

Abstract
Sleep impacts diverse physiological and neural processes and is itself affected by the menstrual cycle; however, few studies have examined the effects of the estrous cycle on sleep in rodents. Studies of disease mechanisms in females therefore lack critical information regarding estrous cycle influences on relevant sleep characteristics. We recorded electroencephalographic (EEG) activity from multiple brain regions to assess sleep states as well as sleep traits such as spectral power and interregional spectral coherence in freely cycling females across the estrous cycle and compared with males. Our findings show that the high hormone phase of proestrus decreases the amount of nonrapid eye movement (NREM) sleep and rapid eye movement (REM) sleep and increases the amount of time spent awake compared with other estrous phases and to males. This spontaneous sleep deprivation of proestrus was followed by a sleep rebound in estrus which increased NREM and REM sleep. In proestrus, spectral power increased in the delta (0.5–4 Hz) and the gamma (30–60 Hz) ranges during NREM sleep, and increased in the theta range (5–9 Hz) during REM sleep during both proestrus and estrus. Slow-wave activity (SWA) and cortical sleep spindle density also increased in NREM sleep during proestrus. Finally, interregional NREM and REM spectral coherence increased during proestrus. This work demonstrates that the estrous cycle affects more facets of sleep than previously thought and reveals both sex differences in features of the sleep–wake cycle related to estrous phase that likely impact the myriad physiological processes influenced by sleep.
Keywords: sex differences, sleep spindle, delta power, coherence, NREM sleep, REM sleep, theta
Statement of Significance.
Hormonal fluctuations across the estrous cycle affect sleep–wake activity, but the full extent of these sleep changes is not known. Our study replicates previously demonstrated effects of the estrous cycle on sleep–waking behavior in female rats and examines the effect of the cycle on several previously unknown metrics such as intercortical coherence, sleep spindles, and power spectral changes. By recording from multiple regions of the cortex as well as the hippocampus in both male and female rats, our study provides a comprehensive investigation of the effects of the estrous cycle on sleep and offers a framework for future sleep research that requires both sexes.
Introduction
Hormonal release across the estrous cycle in mammals and across the menstrual cycle in women causes systemic changes in physiology and in behaviors associated with reproduction, metabolism, and cognitive functions [1–5]. One facet that is often overlooked is the influence of the estrous and menstrual cycles on sleep–wake activity (for review, see refs. [1, 6, 7]). Early work in rats demonstrated that the amount of waking, nonrapid eye movement (NREM) sleep, and rapid eye movement (REM) sleep is altered by the estrous cycle [8, 9]; these changes occur specifically in the phases of proestrus and estrus when hormonal release is high. Additional work in ovariectomized female rodents demonstrated the necessity of the gonadal hormones estradiol and progesterone [10] to produce these changes in sleep–waking behavior. Reintroducing these hormones in ovariectomized rodents demonstrated their sufficiency in affecting sleep–waking behavior [9, 11]. Finally, gonadal function also contributes to sleep differences between females and males. Recent work has demonstrated that sex chromosomes also contribute to sleep differences as gonadectomy abolishes many, but not all, sex difference in sleep [12–14].
In humans, electroencephalographic (EEG) recordings showed the first objective changes in sleep–waking states in women across the menstrual cycle [15]. Further work showed that ovarian hormones alter sleep both across the cycle and throughout life [15–18]. At puberty onset an increased prevalence of insomnia appears in women compared with men. Furthermore, sex differences in sleep onset time disappear following menopause [19, 20], suggesting that sex differences in sleep are in part due to changes in reproductive hormones [7].
Human studies have shown that both spindle frequency and density change across the menstrual cycle [15, 21]. However, it is unknown whether the estrous cycle has a similar effect on spindles in rodents. Sleep in mice appears to be highly strain-specific [22] and while studies in mice have shown sex differences in sleep [12] other work demonstrates the opposite: the estrous cycle does not affect mouse sleep–wake behavior [22]. Finally, studies examining the effects of estrous hormones on sleep and sleep rhythms are often conducted in gonadectomized animals [12, 23, 24] which can complicate comparisons between animal and clinical research. Overall, there remains a lack of basic research in gonadally intact cycling females. This research gap must be filled to better understand how the estrous cycle affects sleep. Moreover, such estrous cycle changes should also be compared with similarly treated gonadally intact males to better understand sex differences in sleep that would be relevant to many fields of basic research.
In the present study, we recorded sleep in gonadally intact male and female rats across the timespan of the estrous cycle. We replicated previous work showing that high hormonal phases—proestrus and estrus—produce changes in sleep amount and sleep architecture, then further analyzed interregional coherence at different frequencies. Proestrus and estrus produce marked increases in NREM sleep delta power. Proestrus also increased REM theta, fast delta, and sigma power as well as increases in NREM sleep spindle density, interregional spindle density correlation, slow gamma power, and both REM and NREM interregional coherence at different frequencies. Finally, in some phases of the estrous cycle we identified differences between males and females in sleep amount, sleep architecture, slow gamma power, and sleep spindle characteristics. This work supports and extends our knowledge of the manner in which the estrous cycle alters many facets of sleep and produces differences in sleep quantity and quality between males and females.
Methods
Seven male and 10 female Long-Evans rats (Charles River, strain 006), age 3–4 months and weighing approximately 300–400 g (male) and 225–300g (female), were used in this study. Food, water, and environmental enrichment were available ad libitum, and animals were housed on shaved paper bedding in climate controlled (23 ± 3°C and 35% ± 10% humidity) chambers with a 12:12 h light/dark cycle with zeitgeber time (ZT) 0–12 marking the lights-on phase of the day. All animal procedures were carried out in accordance with the National Institutes of Health Guide for the Care and Use of Laboratory Animals and in accordance with the University of California Los Angeles Chancellor’s Animal Use Research Committee.
Electrode implantation and experimental procedures
All animals were individually housed and administered 650 mg/kg acetaminophen in water 2 days prior to and 3 days following surgery and 5 mg/kg enrofloxacin 1 day prior to and for 5 days following surgery. Rats were anesthetized with isoflurane vapor (4% induction, 1%–2% maintenance), and placed in a stereotaxic frame. All stereotaxic measurements were from bregma. Stainless steel screw electrodes (Invivo1 Cat#: E63/20/SPC) and a tungsten depth electrode (Invivo1 Cat#: E363T/2/SPC) were implanted to measure cortical EEG activity, and hippocampal local field potentials (LFP), respectively. Within each animal, all electrodes were placed within either the left or the right hemisphere of the brain with the side picked for implantation selected pseudo-randomly (Figure 1A). EEG screw electrodes were implanted over the medial prefrontal cortex (mPFC) (+2.7 mm anterior posterior [AP], ±0.6 mm medial lateral [ML]) and over the secondary visual cortex (−5.0 mm AP, ±1.5 mm ML). An additional screw electrode was placed over the frontal sinus (+11 mm AP) as a reference. The tungsten electrode targeting the CA1 field of the hippocampus was implanted at −3.5 mm AP, ±2.1 mm ML, −2.6 mm DV. A nuchal electromyographic (EMG) electrode (Cooner Wire Cat#: AS636) was implanted into the dorsal neck muscles to measure muscle activity. Inputs from all electrodes were wired into a pedestal connector (Invivo1 Cat#: MS363) which was secured to the skull with stainless steel anchor screws and dental acrylic. Animals were given 10 days for postoperative recovery in their home cages.
Figure 1.

Sleep–waking behavior changes across the estrous cycle. (A) Configuration of recording electrodes. (B) Schematic of home cage recording setup allowing movement and sleep postures. (C) Experimental timeline of 5 days of continuous recording with 12:12 light–dark cycle (top), and the time within the day where swabbing occurred. (D) Representative 10 s epochs showing EEG and EMG for waking, NREM sleep, and REM sleep. (E) Male sleep–waking behavior across 4 days of recording. Each day is broken into quartiles ZT0–6, ZT6–12, ZT12–18, and ZT18–24. The gray shaded areas represents the dark phase. (F) Female sleep–waking behavior across one complete estrous cycle. (G) The percent time spent in waking, NREM sleep (H), and REM sleep (I). Females were analyzed across phases of the estrous cycle using repeated measures two-way ANOVA: waking F(3, 24) = 27.81, NREM F(3, 24) = 28.36, REM F(3, 24) = 15.58. Tukey post hoc. *p < 0.05, **p < 0.01, ***p < 0.005, ****p < 0.0005. Females were compared with males using two-way ANOVA: waking F(4, 152) = 19.81, NREM F(4, 152) = 19.53, REM F(4, 152) = 12.87. Dunnett post hoc. #p <0.05. Data displayed as mean ± SEM. Males n = 7, females n = 9.
After recovery, animals were connected to a chronic recording tether that was attached on the opposite end to a commutator that allowed the animals to move freely in their home cage without entanglement (Figure 1B). Animals were given 48 h to adapt to the tether prior to any recording of sleep–waking behavior. Recordings took place over 5 consecutive days to ensure they encompassed an entire estrous cycle (Figure 1C).
Estrous phase determination
The estrous cycle has four phases: metestrus, diestrus, proestrus, and estrus, with each phase associated with changes in vaginal histology (for review of phase identification see ref. [25]) (Supplementary Figure S1A). To determine estrous phase, female rats were vaginally swabbed once a day with a cotton-tipped applicator moistened with saline. Swabbing was performed within the first 30 min of the light phase each day (Figure 1C). Vaginal smears were applied to microscope slides and left to dry at room temperature at least a day prior to staining. The staining protocol was as follows: slides were fixed in methanol for 3 min and air dried for 15 min. Slides were then immersed in 1:20 dilution of the Giemsa stain (Sigma–Aldrich Cat#: G4507) in deionized water for 5 min, followed by rinsing in deionized water. Finally, slides were cover-slipped and examined under light microscope for estrous stage identification. To equalize handling time amounts and time of day for male–female comparisons, males were sham-swabbed by taking a similarly moistened cotton swab and applying light pressure between the anus and the scrotum. All rats were swabbed every day for 2 weeks prior to any recording in order to habituate them to the process. One female rat was removed from the study due to irregularities in the estrous cycle, i.e. 3 contiguous days of identifiable estrus shown by more than 80% of cells displaying a flattened, cornified appearance.
Electrophysiological data
Electrode data were continuously recorded at a sampling rate of 1 kHz using the Neuralynx Digital Lynx 4SX system (Neuralynx, Bozeman, MT). Recordings were halted for approximately 1 min each day in order to perform the swabbing.
Sleep state analysis
Sleep–waking states were scored manually using cortical EEG, CA1 LFP, and EMG recordings in the same manner as done in previously published studies from our lab [26, 27]. For state identification, EMG data were filtered from 30 to 250 Hz, and EEG and LFP data were filtered from 1 to 25 Hz and viewed in 10 s epochs. Epochs were assigned a state of waking, NREM sleep, or REM sleep using a manual-scoring program developed in our lab [28]. Previous work has shown that the cortex and the hippocampus can simultaneously exhibit two different sleep states [26]. In epochs where the interregional sleep states were in conflict, the state of the cortex was selected as the overall sleep state. For females, each day of sleep was scored with the scorer blinded to the identity of the estrous phase. Males were scored unblinded to the order of days, and each day was identified as day 1, day 2, etc. For each day of each animal, the scored sleep was divided into four, 6 h time periods ZT0–6 and ZT6–12 (the lights-on, sleep-intensive circadian phases), and ZT12–18 and ZT18–24 (the lights-off, waking dominant circadian phase). Sleep architecture data were analyzed using repeated measures two-way ANOVA with Tukey post hoc to correct for multiple comparisons. Repeated measures were calculated in females across estrous phases and in males across recording days.
Power spectral density analysis
Power spectra were analyzed using Neuroexplorer 5 software (Nex Technologies, Madison, AL, RRID:SCR_001818). Raw EEG and LFP data underwent a fast-Fourier transform (FFT) using a 500 ms window with a Hann taper, and a window overlap of 50% to calculate the average power spectral density from 0.5 to 100 Hz. A 60 Hz notch filter was applied to remove environmental signal noise when calculating power spectral densities. 0.5 Hz bins were used to display and analyze power spectral density data. Power spectral density data were analyzed using repeated measures two-way ANOVA with Tukey’s post hoc to correct for multiple comparisons. Repeated measures were calculated in females across estrous phases and in males across recording days.
For NREM SWA (0.5–4 Hz) and slow gamma activity (30–60 Hz), NREM power spectral density data were divided into 2 h periods and slow-wave and slow gamma activity were calculated for each period. The 2-h slow-wave or slow gamma activity was then expressed in relation to the average activity across the estrous cycle in females or across 4 days of recording in males. As some 2-h periods did not contain NREM sleep (i.e. missing values), a mixed-effects model (followed by Tukey’s post hoc) was necessary to analyze repeated measures.
Spectral coherence between brain regions
The coherence of raw EEG and LFP at a given frequency (f) was analyzed using Neuroexplorer 5 software (Nex Technologies) utilizing previously published methodology [29]. Field–field coherence corresponds to the similarity of two signals, “x” and “y”, at each frequency. Coherence value between signals x and y for any given frequency, Cxy (f), was calculated as a function of the spectral densities of x, Pxx(f), and y, Pyy(f), and of the cross-spectral density of x and y, Pxy(f) similar to previous work:
Coherence was calculated using a 0.5 s Welch’s window with a 50% overlap. Cxy(f) for a given frequency window is expressed from 0 to 1.0, with 0 indicating no relationship between the two signals at a given frequency, and 1.0 indicating a perfect linear relationship. Band coherence was calculated by averaging the coherence values at each frequency within a frequency band of interest. A mixed-effects model followed by a Tukey’s post hoc test was used to analyze average band coherence in females across the estrous phases and in males across days. Comparison of male average vs. female estrous phases was done using a two-way ANOVA with a Dunnett’s post hoc test.
Sleep spindle identification
Automatic spindle identification was performed similar to previous work [30]. Cortical EEG from the mPFC and V2 were filtered for the sigma frequency (10–15 Hz) and data were down-sampled to 200 Hz. Then the root-means-square (RMS) over a moving 100 ms window was calculated and smoothed with a moving average. Spindles were counted where the RMS exceeded 2.5 times the standard deviation of the RMS mean from all NREM sleep for that time period lasting at least 0.5 s but not exceeding 2.0 s in length. When examining spindle length and peak frequency, spindles were treated as independent measures, rather than finding the average spindle length or peak frequency within an individual subject.
Statistical analysis
All statistical tests were conducted using Graphpad Prism 8 analytical software (GraphPad, RRID:SCR_002798). All data sets were first tested for normality using the Shapiro–Wilk normality test, as recommended [31]. Data set normality was calculated without performing any transform (e.g. log 10, or z-score) on the data. Statistical tests used repeated measures two-way ANOVAs or linear mixed effect models, followed by a Tukey’s multiple comparisons test to compare repeated measures within males and females. To compare differences between males and females, first, the average value across 4 days for each measure was calculated within males; this was to maintain the variability between participants. Then, the male averages were compared with each phase of the estrous cycle using a two-way ANOVA followed by a Dunnett’s multiple comparisons test. The alpha value was set to 0.05 for all analyses and was always calculated in a two-tail manner. Graphical representations of data were created using Graphpad Prism 8 and MATLAB 2018a (RRID:SCR_001622). Statistical tests used for each comparison within a figure can be found in the figure legend, or within the results section if a figure for a specific analysis is not shown. F-test statistics and degrees freedom for ANOVAs can be found within figure legends and text. Significant differences between females and males is denoted using a pound sign (#), with the color of the pound sign displaying the difference between males and values from a specific estrous phase in Figure 5. Significant differences between different estrous phases are denoted with an asterisk (*). In figures where it was difficult to use bracket lines to denote comparisons between groups, colored asterisks were used to denote comparisons and significance between phases of the estrous cycle.
Figure 5.

NREM slow-wave activity (0.5–4 Hz) and slow gamma activity (31–60 Hz) are altered across the estrous cycle. (A) Female medial prefrontal cortex (mPFC), (B) secondary visual cortex (V2), and (C) CA1 delta power across the estrous cycle are expressed as the average delta power across the whole estrous cycle. (D) Female mPFC, (E) V2, and (F) CA1 NREM slow gamma power across the estrous cycle are expressed as the average slow gamma power across the whole estrous cycle. Male data in A–F represent average male values from similar figures (see Supplementary Figure 4). As some 2 h bins do not contain NREM sleep, for repeated measures, statistical comparisons within females were calculated via a mixed-effects model: mPFC delta F(3, 284) = 7.12, V2 delta F(3, 284) = 2.526, CA1 delta F(3, 248) = 12.29, mPFC slow gamma F(3, 284) = 22.31, V2 slow gamma F(3, 284) = 35.54, CA1 slow gamma F(3, 248) = 11.55. Tukey post hoc. *p < 0.05, asterisk color denotes the day or estrous phase from which the adjacent data is significantly different. Comparisons between the male 4 day average and females were done via two-way ANOVA: mPFC delta F(4, 452) = 5.960, V2 delta F(4, 452) = 1.931, CA1 delta F(4, 404) = 8.745, mPFC slow gamma F(4, 452) = 18.41, V2 slow gamma F(4, 452) = 25.90, CA1 slow gamma F(4, 404) = 9.090. Dunnett post hoc. #p < 0.05. The color of the pound sign corresponds to the phase of the estrous cycle at which males are significantly different. Data displayed as the mean ± SEM for that group. Males n = 7. For mPFC and V2 n = 9 females, for CA1 LFP n = 8 females, as one animal had a broken depth electrode.
Results
Proestrus and estrus differ in sleep and waking quantity
Previous work in rodents established that males and females have differing amounts of waking, NREM, and REM sleep. We first sought to replicate these results. Figure 1D displays 10-s epochs of representative traces of the three behavioral states identified: waking, NREM sleep, and REM sleep. Compared with males (Figure 1G–I), females in proestrus showed increased waking and decreased NREM sleep during all of the light phase and half of the dark (ZT0–18) as well as decreased REM sleep during the last half of the light phase and an even greater reduction in first half of the dark, active phase (ZT6–18). In contrast, females in estrus had increased REM sleep during ZT18–24 compared with males and increased NREM sleep and decreased waking during ZT18–24 of metestrus.
Across the 4 days of recording males showed no difference in the percent of time spent in any sleep–wake state when compared to their own state profile on other days at circadian matched times (repeated measures two-way ANOVA: waking F(3, 18) = 2.787, NREM F(3, 18) = 2.81, REM F(3, 18) = 0.964; Tukey post hoc: waking p = 0.48 to >0.99, NREM p = 0.58 to >0.99, REM p = 0.46 to >0.99). Female rats, however, did show changes in sleep–wake amounts across the 4 days of the estrous cycle (Figure 1E and F). Females displayed increases in time spent awake and decreases in NREM and REM sleep throughout the day during proestrus as compared with other phases of the estrous cycle (Figure 1G–I). These proestrus-affiliated changes peaked at the onset of the dark phase of proestrus. During the subsequent estrus phase, there was a rebound increase in the time spent in NREM and REM sleep and a decrease in waking across all circadian times (ZT0–24) (Figure 1G–I).
Looking within sleep (excluding consideration of waking), REM sleep expressed as a percent of total sleep did not vary in males at circadian-matched times across the 4 days of recording (Supplementary Figure S1B). However, in females, REM sleep was selectively suppressed as a percentage of sleep during proestrus ZT12–18 compared with all other phases. REM sleep remained reduced during proestrus ZT18–24 compared with the time-matched hours of estrus (Supplementary Figure S1C).
Proestrus and estrus possess a unique sleep architecture
We next examined whether sleep architecture was affected by the estrous cycle. Similar to the above analysis of time spent in each state, males showed no variation in the number of bouts per hour of any state across the circadian matched times in the 4 days of recording (repeated measures two-way ANOVA: waking F(3, 18) = 1.547, NREM F(3, 18) = 4.604, REM F(3, 18) = 0.802; Tukey post hoc: waking p = 0.16 to >0.99, NREM p = 0.07 to >0.99, REM p = 0.32 to >0.99; Figure 2A). Females, however, showed architecture variations across the estrous cycle (Figure 2B–E).
Figure 2.

Sleep architecture changes across the estrous cycle. (A) Male and female (B) bouts per hour of waking, NREM sleep, and REM sleep across 4 days of recording and the complete estrous cycle. (C) Comparison of bouts per hour of waking, NREM sleep (D), and REM sleep (E). Females were analyzed across phases of the estrous cycle using repeated measures two-way ANOVA: waking F(3, 24) = 3.37, NREM F(3, 24) = 4.91, REM F(3, 24) = 6.98. Tukey post hoc. Females were compared with males using two-way ANOVA: waking F(4, 152) =5.39, NREM F(4, 152) = 4.05, REM F(4, 152) = 8.69. Dunnett post hoc. Male (F) and female (G) average bout length for waking, NREM sleep, and REM sleep across 4 days or the estrous cycle. (H) Comparison of bout length of waking, NREM sleep (I), and REM sleep (J). For both bouts per hour and bout length, females were analyzed across phases of the estrous cycle using repeated measures two-way ANOVA: waking F(3, 24) = 3.304, NREM F(3, 24) = 23.12, REM F(3, 24) = 35.1. Tukey post hoc. *p < 0.05, **p < 0.01, ***p < 0.005, ****p < 0.0005. Females were compared with males using two-way ANOVA: waking F(4, 152) = 3.39, NREM F(4, 152) = 21.74, REM F(4, 152) = 16.95. Dunnett post hoc. #p < 0.05. Data displayed as mean ± SEM. Males n = 7, females n = 9.
During ZT0–6 of estrus the number of waking bouts per hour decreased in compared with proestrus. Further, during ZT6–12 of estrus, the number of bouts of both waking and NREM decreased compared with all other estrous phases (Figure 2C and D). Compared with males, females in proestrus had an increase in the number of waking bouts per hour during ZT6–12 and increased the number of NREM bouts per hour during ZT18–24 of metestrus. Within females the number of REM bouts per hour during the dark phase (ZT12–24) of proestrus was significantly reduced from all other phases of the estrous cycle (Figure 2E). Females in proestrus also had fewer REM sleep bouts compared with males during ZT12–18. In contrast, females had significantly more bouts of REM sleep than males during ZT12–18 of diestrus and during ZT18–24 of metestrus, diestrus, and estrus. In other words, females had more REM sleep bouts in the latter half of the dark phase than males at all estrous phases except proestrus.
We next examined the length of the bouts of each state. Males again did not show any circadian-matched day-to-day changes in the length of bouts of any state across the 4 recording days (repeated measures two-way ANOVA: waking F(3, 18) = 1.923, NREM F(3, 18) = 1.550, REM F(3, 18) = 0.601 Tukey post hoc: waking p = 0.14 to 0.99, NREM p = 0.11 to >0.99, REM p = 0.25 to 0.99), whereas bout lengths changed significantly across the estrous cycle in females. Early in the dark phase of proestrus, ZT12–18, females showed increased waking bout lengths and decreased NREM and REM sleep bout lengths compared with all other estrous phases (Figure 2H–J). These changes in bout length closely matched changes in the amount of each state shown in Figure 1. Proestrus NREM sleep bouts were also shorter than diestrus and estrus at the last half of the proestrus dark phase, ZT18–24. In contrast, during the entire subsequent light phase of estrus, ZT0–12, both NREM and REM sleep bouts were longer than they were at any other phase of the estrous cycle, constituting the rebound in the amount of NREM and REM during estrus seen in Figure 1.
Compared with males, females had longer bouts of waking during ZT12–18 of proestrus. Additionally, females had shorter bouts of NREM sleep compared with males during ZT0–18 of proestrus. In contrast, females in metestrus had shorter waking bouts during ZT18–24 compared with males. Finally, females had shorter bouts of REM sleep than males during the lights-on hours ZT0–12 in all phases of the cycle except estrus. However, the most significant difference in REM sleep between males and females was the drop in REM sleep (total time, number of bouts, and bout length) in females during ZT12–18 of proestrus.
Changes in NREM and REM sleep power spectra across the estrous cycle
Previous work in women and in female rodents showed changes in the NREM and REM sleep power spectra across the hormonal cycle [15, 32]. We investigated whether similar changes occurred in multiple brain regions in female rats across the estrous cycle and within male rats over a similar number of days.
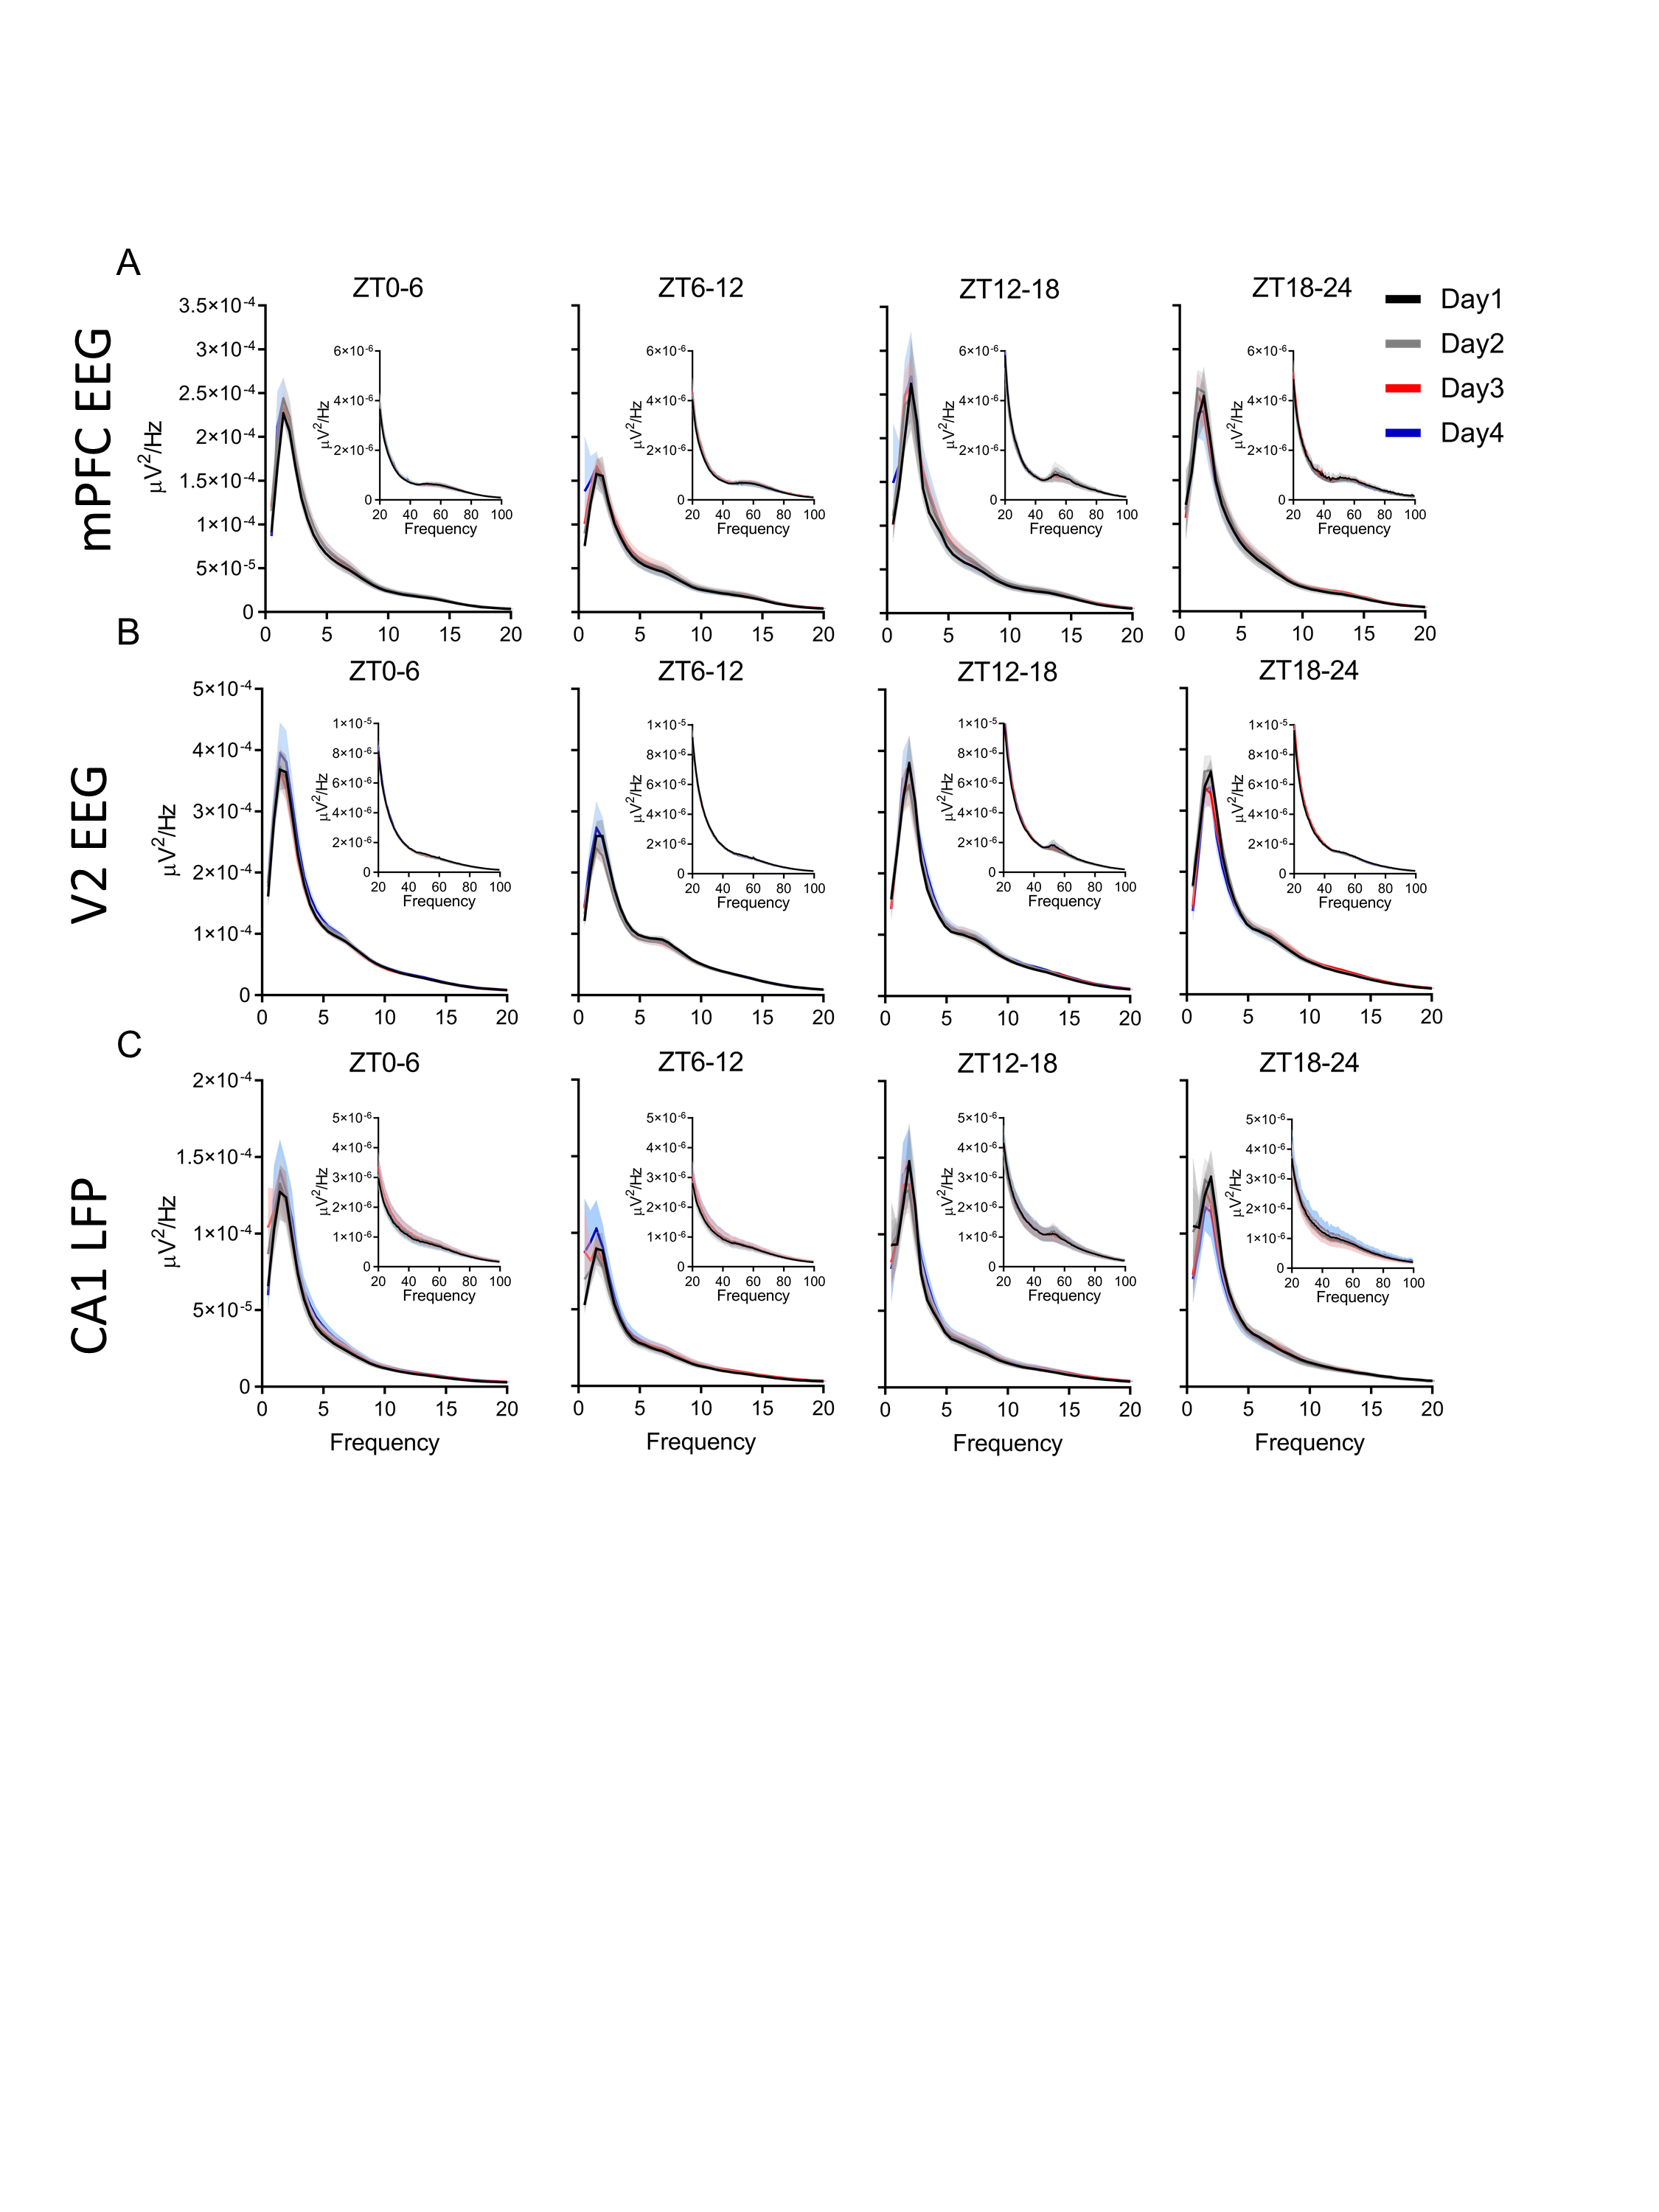
There were no changes in the male brain power spectra within any of the three areas measured (mPFC, the secondary visual cortex (V2), and the hippocampus-CA1 region), during NREM or REM sleep at circadian-matched times over the 4 days of recording (Supplementary Figures S2 and S3). However, females showed a significant increases in NREM delta (0.5–4 Hz) power in all three brain regions during ZT12–24 of proestrus and the following ZT0–6 of estrus. Additionally, we saw a power increase in frequencies of the beta (16–30 Hz) and slow gamma bands in all three brain regions during ZT12–18 of proestrus, continuing through ZT18–24 of proestrus in the beta band in the mPFC (Figure 3A–C). Unlike the increases in the delta band, these NREM beta and gamma increases in the late (dark) phase of proestrus did not carry over into the first 6 h light phase of estrus.
Figure 3.

NREM sleep delta power and slow gamma power changes during proestrus and estrus. (A) Distribution of female rat power spectra during NREM sleep in the medial prefrontal cortex (mPFC) EEG, secondary visual cortex (V2) EEG (B), and CA1 LFP (C). Each 0–20 Hz panel contains a subpanel displaying 20–100 Hz to highlight changes that occur at a higher frequency, but at a lower voltage. The spectral power at each 0.5 Hz frequency bin was analyzed across phases of the estrous cycle using repeated measures two-way ANOVA: parts A and B, F(3, 24), part C F(3, 21). Tukey post hoc. *p < 0.05 The colored line with similar colored asterisk above it represents frequencies where one phase of the estrous cycle is significantly different from all other phases of the estrous cycle. Data displayed as the darker line represents the mean and the lighter shaded region of analog color represents the SEM for that group. For both mPFC EEG and V2 EEG, n = 9 females. For CA1 LFP, n = 8, as one animal had a broken depth electrode.
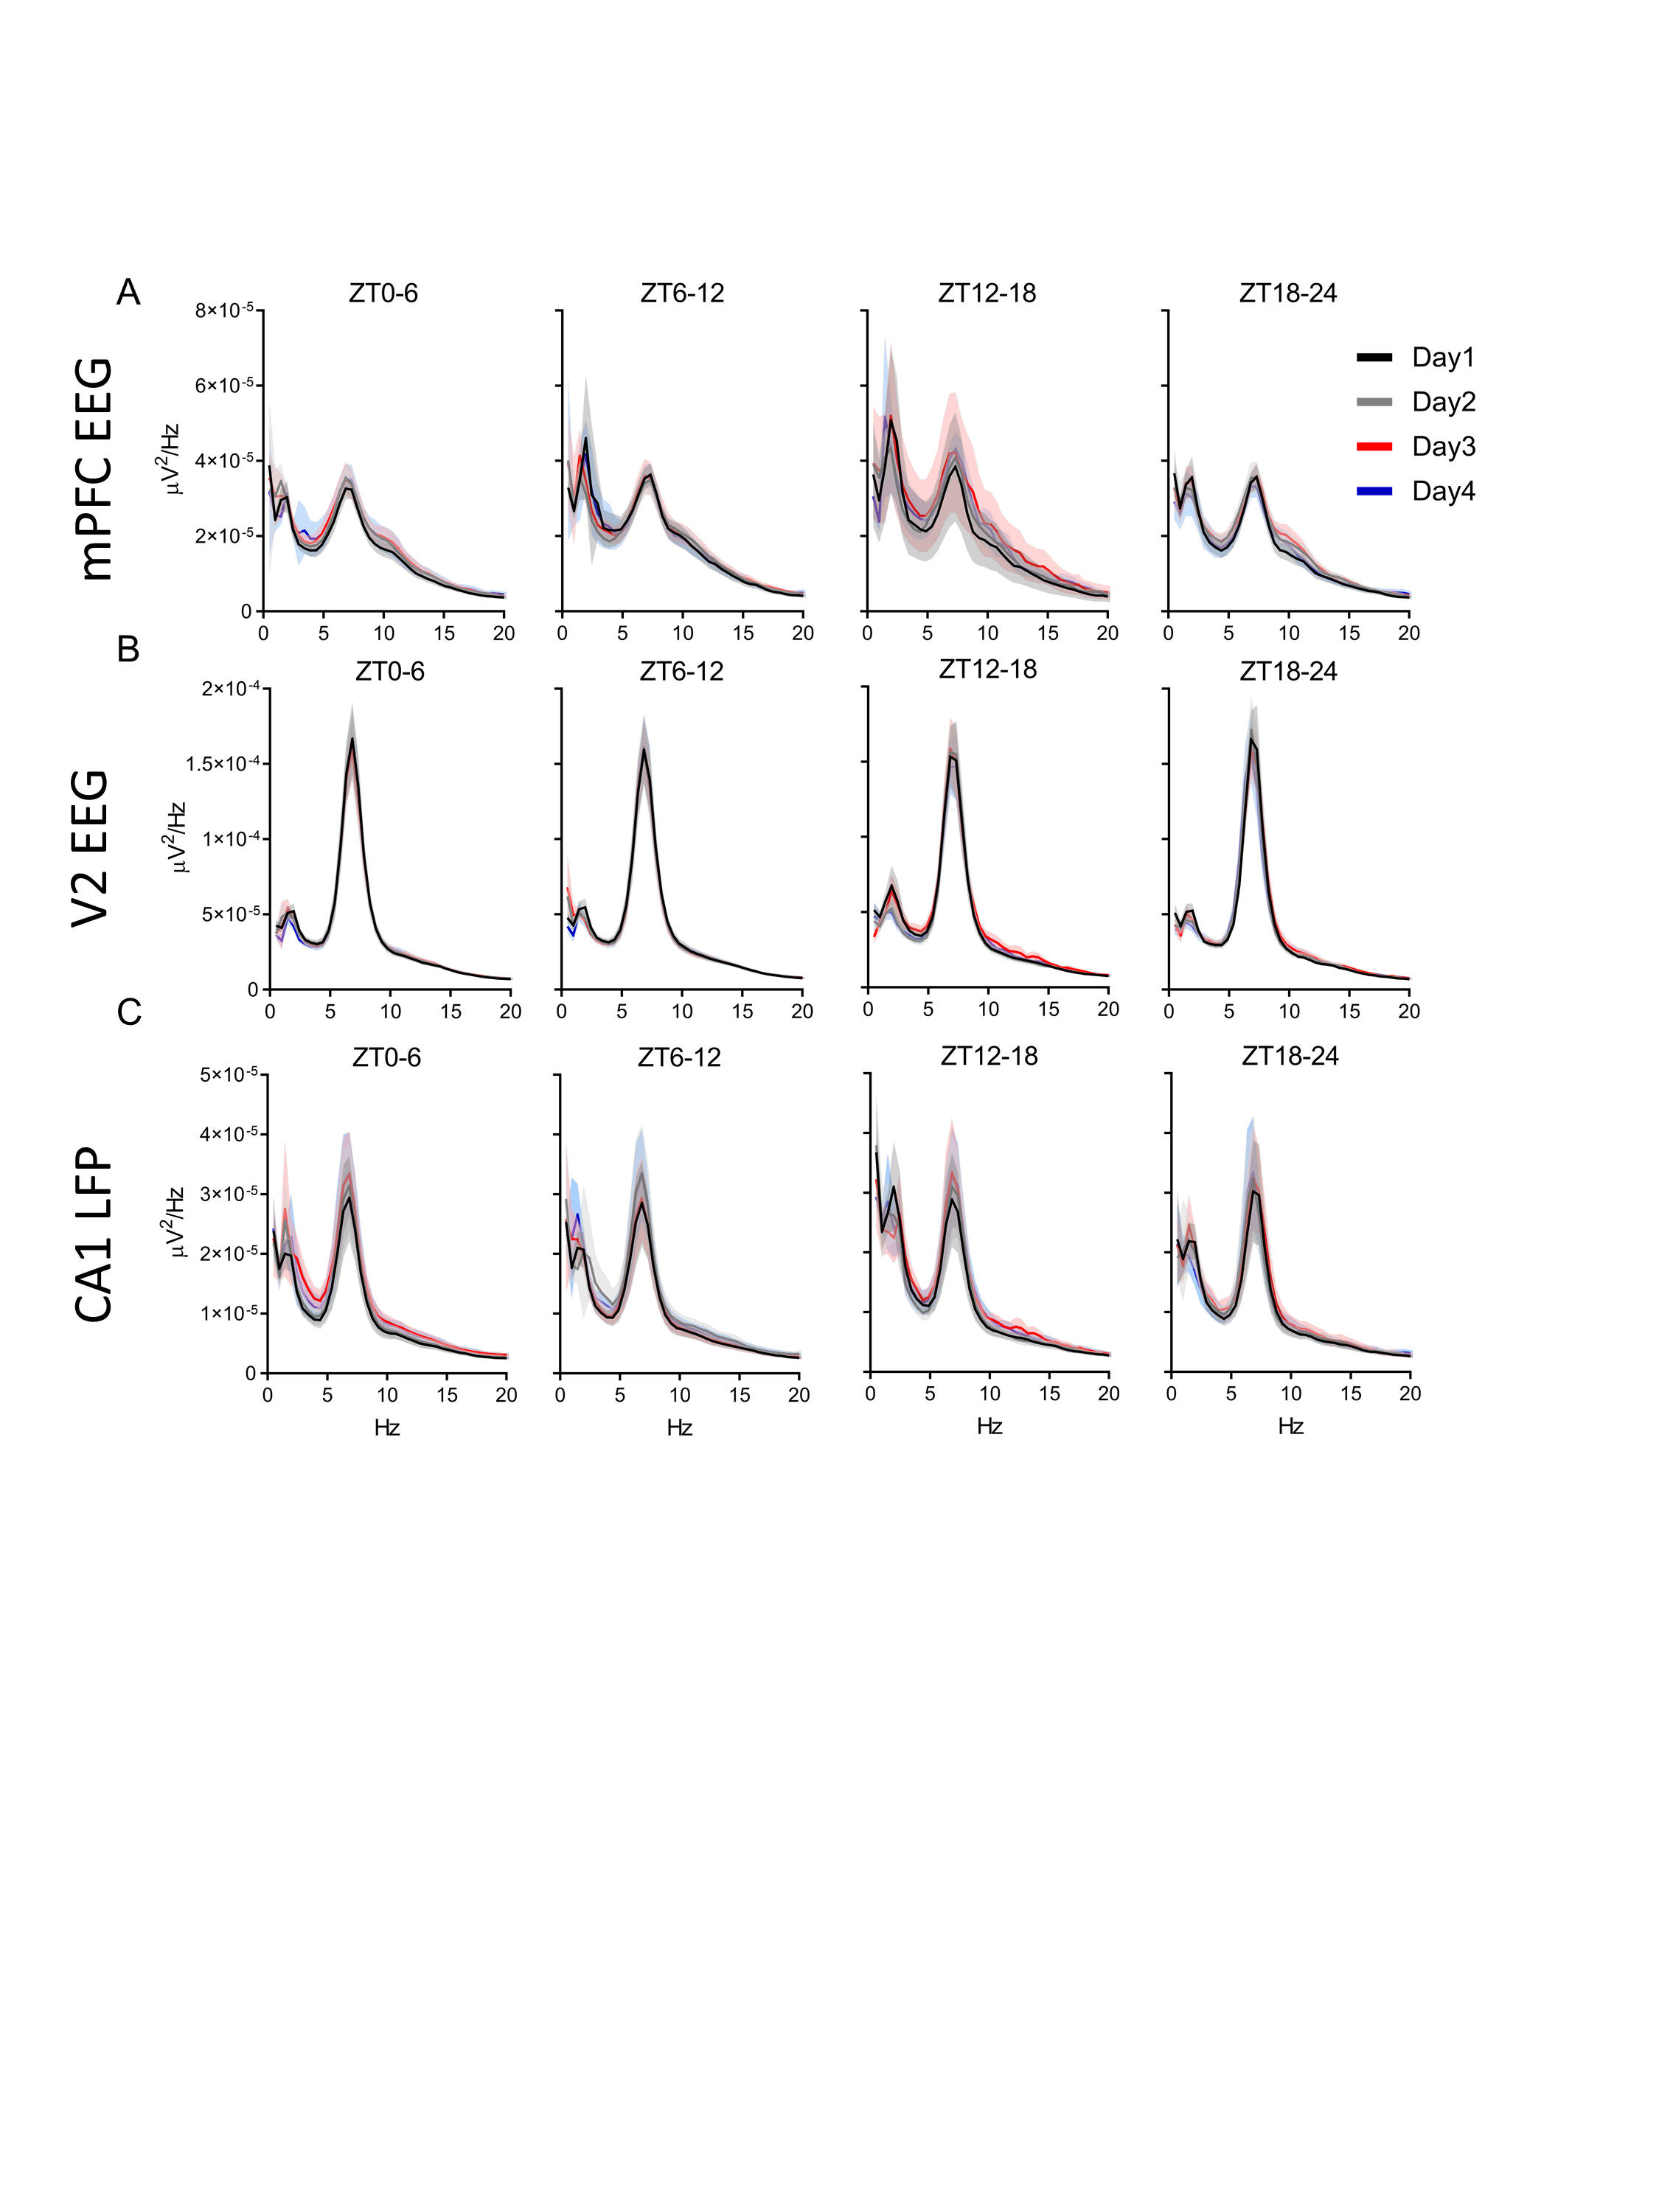
During REM sleep, power spectral densities also changed across the estrous cycle. Unlike the delta increases in NREM sleep, these theta changes did not occur simultaneously in all regions. In the mPFC, REM sleep theta power was significantly lower during ZT0–6 of proestrus (Figure 4A) when REM bout length was also reduced compared with the estrus phase and males (Figure 2J). Later, during ZT12–18 of proestrus, REM sleep theta power grew higher than other phases in the same mPFC region when REM sleep amounts, bout lengths, and number of bouts were at their lowest. Theta power rose in the V2 region during ZT18–24 of proestrus (Figure 4B), although REM sleep amounts and number of bouts remained low compared with other cycle phases. REM sleep theta power fell from this late proestrus high to another low during ZT6–18 of estrus in area V2 and fell in the CA1 area at ZT12–18 (Figure 4B and C).
Figure 4.

REM sleep theta power does not change regularly across the estrous cycle. (A) Distribution of female rat power spectra during REM sleep in the medial prefrontal cortex (mPFC) EEG, secondary visual cortex (V2) EEG (B), and CA1 LFP (C). Each panel has a range of 0–20 Hz; there were no changes at frequencies greater than 20 Hz, so higher frequencies are not displayed. The power at each frequency was analyzed across phases of the estrous cycle using repeated measures two-way ANOVA: parts A and B, F(3, 24), part C, F(3, 21). Tukey post hoc. *p < 0.05. The colored line with similar colored asterisk above it represents frequencies where one phase of the estrous cycle is significantly higher than all other phases of the estrous cycle. Data displayed as the darker line represents the mean and the lighter shaded region of analog color represents the SEM for that group. For both mPFC EEG and V2 EEG, n = 9 females. For CA1 LFP, n = 8, as one animal had a broken depth electrode.
NREM SWA and slow gamma activity are increased during proestrus
Prior studies have indicated that SWA, or delta power, homeostatically changes throughout the light phase in rodents and that the estrous cycle can affect SWA homeostasis [32]. We wanted to see if males and female rats had similar SWA power changes across the day. Across the 4 days of recording, males had similar SWA circadian dynamics in the all three brain regions (Supplementary Figure S4A–C). In females, there was a SWA power increase in the mPFC and CA1 regions, and, to a lesser extent, in area V2, during the dark phase of proestrus compared with other phases (Figure 5A–C). Later, in the first 2 h of the estrus light phase, SWA increased in the mPFC and V2 areas (Figure 5A and B). Finally, in the last 2 h of the dark phase of estrus, both V2 and CA1 SWA were reduced in females compared with males (Figure 5B).
Previous work also found that NREM 10–25 Hz (sigma and beta) activity was increased during the dark phase of proestrus [32]. We examined whether 31–60 Hz (slow gamma) was similarly heightened during proestrus. There was an increase in slow gamma activity in all areas recorded during the dark phase of proestrus compared with all other estrous phases. This increased dark phase proestrus slow gamma was also higher in females than males in the mPFC and V2 cortices (Figure 5D–F). In contrast, V2 slow gamma activity during estrus was significantly lower than males during the dark phase. There were no differences across the 4 days within the mPFC or CA1 in males (Supplementary Figure S4D and F). However, we did find a small rise from day 2 to day 4 in male area V2 slow gamma activity at the very end of the light phase (Supplementary Figure S4E).
Interregional spectral coherence during sleep changes across the estrous cycle
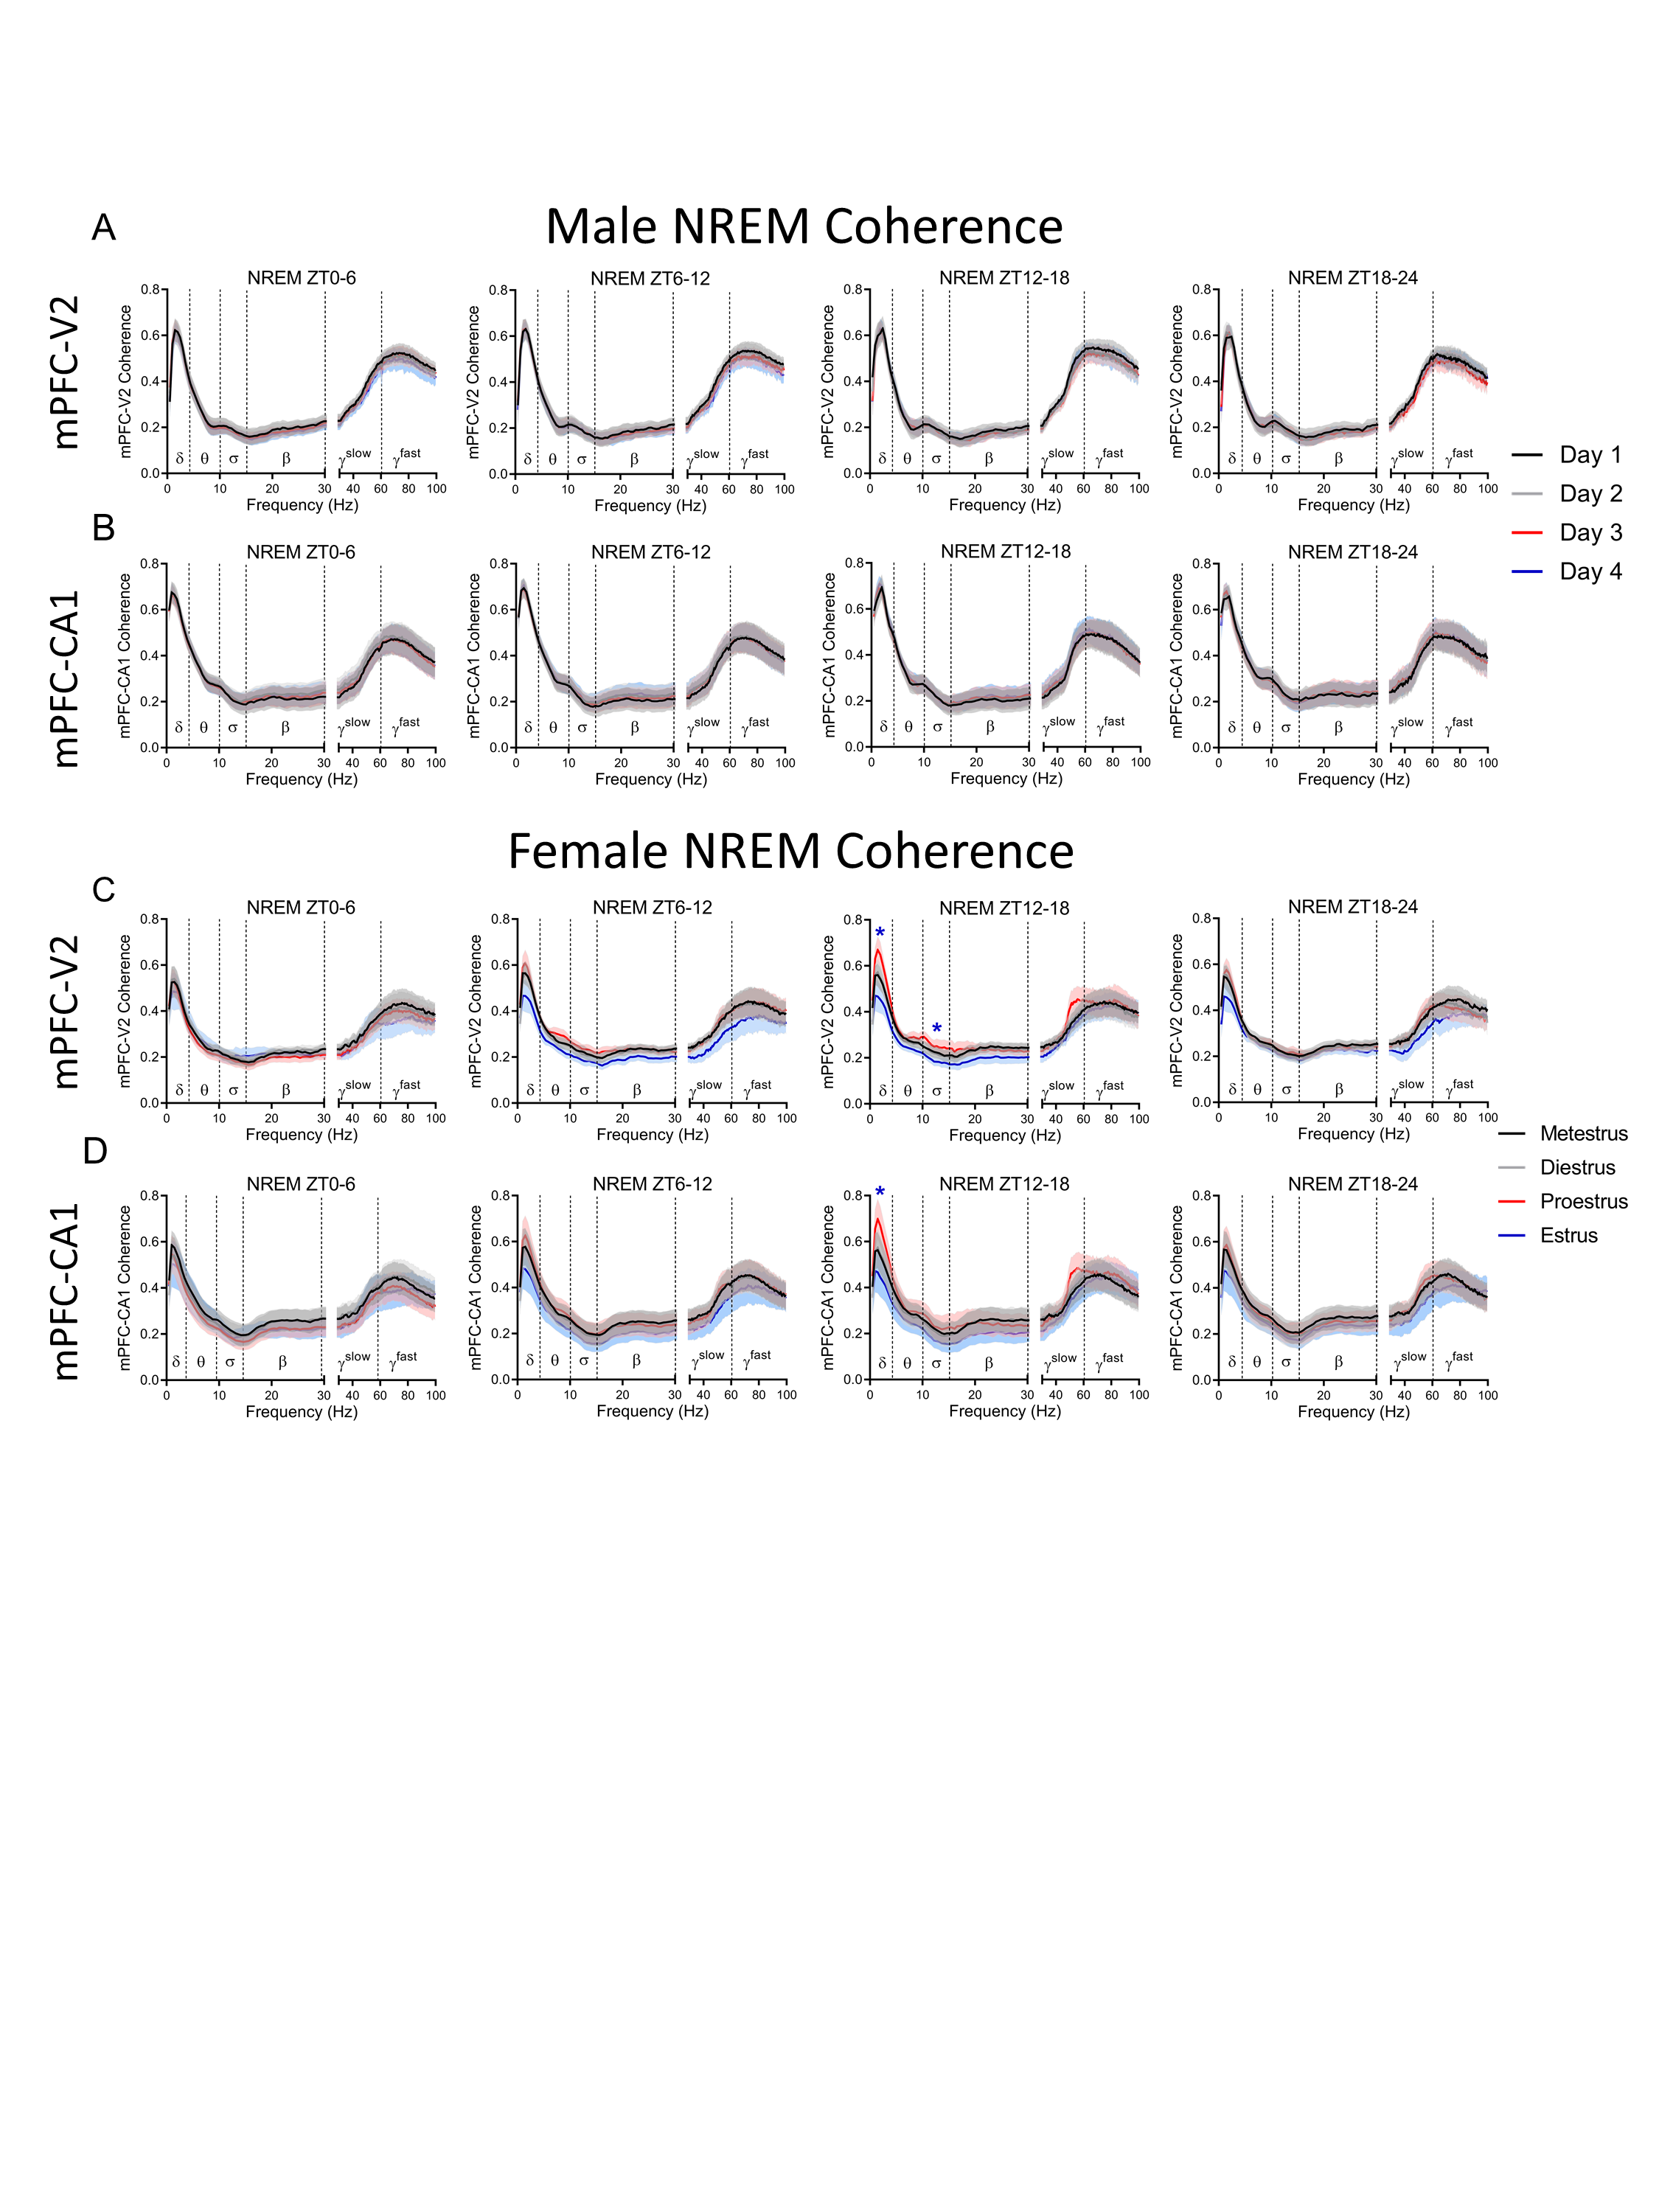
Spectral coherence is a common metric in human sleep research quantifying oscillatory synchronization between two different brain regions [33]. To the best of our knowledge, there have been no published reports of spectral coherence changes in females across the estrous cycle. Given the importance of EEG coherence to cognition [33, 34], we thought it important to investigate whether the estrous cycle modifies coherence between brain areas. We examined spectral coherence between recorded areas across the estrous cycle. Supplementary Figure S5 displays the average spectral coherence during NREM sleep from 0.5 to 100 Hz in males and females. In males there were no differences across days in the coherence at any frequency band between brain areas during NREM sleep (Supplementary Figure S5A and B). In females, however, delta and sigma band coherence between the mPFC and V2 was increased during early dark phase (ZT12–18) of proestrus (Supplementary Figure S5C). Delta coherence also increased between the mPFC and CA1 during this time (Supplementary Figure S5D). There were no significant differences between males and females in any band coherence in either mPFC–V2 or mPFC–CA1 during NREM sleep (mixed-effects model, Dunnett post hoc: p = 0.31 to >0.99 mPFC–V2, p = 0.17 to >0.99 mPFC–CA1) (data not graphed).
Looking next at REM sleep coherence, again, there were no coherence changes across days in males in any frequency band between either mPFC and V2 or between mPFC and CA1 areas (Supplementary Figure S6A and B). In females, however, slow gamma coherence was increased during ZT12–18 of proestrus between both the mPFC and V2 and the mPFC and CA1 areas (Supplementary Figure S6C and D). Fast gamma coherence between the mPFC and CA1 areas was also increased during ZT12–18 of proestrus. There were no differences between males and females in any coherence band during REM sleep (mixed-effects model, Dunnett post hoc: p = 0.31 to >0.99 mPFC–V2, p = 0.27 to >0.99 mPFC–CA1) (data not graphed).
Sleep spindle density, length, and peak frequency differ across the estrous cycle
Previous work in humans has shown that spindle density changes across the menstrual cycle [15, 21], and that women have more spindles than men [35]. We wanted to know whether female spindle numbers differed from males in rats as well, and whether spindle density changed across the rodent estrous cycle. We confined our analyses to spindles recorded from the cortex (e.g. Figure 6A), as spindles have been little described in the hippocampus [27, 36–38]. We found no differences in spindle density between males and females in either cortical area. There were also no changes in male mPFC or V2 sleep spindle density across the 4 days (Figure 6B). However, spindle density changed across the estrous cycle. Female mPFC sleep spindle density increased during the light phase (ZT0–12) of proestrus compared with estrus and was also higher at ZT6–12 in proestrus than diestrus (Figure 6C). However, V2 spindle density was reduced during the late dark phase (ZT18–24) of proestrus compared with estrus. In males, mPFC spindle density positively correlated with V2 spindle density across 4 days of recording (Figure 6D). However, females showed no correlation in spindle density between regions when the 4 days of the estrous cycle were combined (not graphed). A positive correlation in spindle density between cortical regions appeared only during proestrus, with a trend in estrus (Figure 6E).
Figure 6.

Sleep spindles density changes across the estrous cycle. (A) Example sleep spindle identified from medial prefrontal cortex (mPFC) EEG with 0.5–25 Hz filter on top and 10–15 Hz spindle frequency on the bottom panel. Blue shaded region represents an identified spindle. (B) Male mPFC and secondary visual cortex (V2) sleep spindle density (spindles per minute) across 4 days of recording. (C) Female mPFC and V2 sleep spindle density across the estrous cycle. (D) Pearson correlation of male mPFC spindle density vs. male V2 spindle density. (E) Pearson correlation of female mPFC spindle density vs. female V2 spindle density across each phase of the estrous cycle. Analysis within males and females was done via repeated measure two-way ANOVA: male mPFC F(3, 18) = 0.475, male V2 F(3, 18) = 3.461, female mPFC F(3, 24) = 3.212, female V2 F(3, 24) = 0.589; Tukey post hoc *p < 0.05. Asterisk color denotes the day or estrous phase from which the adjacent data significantly differs. Analysis comparing male 4 day average to females was performed with a two-way ANOVA: mPFC F(4, 152) = 1.863, V2 F(4, 152) = 0.701. Dunnett post hoc; no differences found. All plots in (B) and (C) display mean ± SEM. Males n = 7, females n = 9. For correlations in (D) and (E) each point represents sleep spindle density during a single quartile of the day for each animal. Male correlations include all 4 days of recording, whereas female correlations are divided by estrous cycle phase. Males n = 112 (7 males * 4 days * 4 quartiles/day). Females n = 36/phase (9 females * 4 quartiles/phase).
Spindle characteristics such as peak frequency are also altered by the menstrual cycle in women [21]. We found no differences in male cortical sleep spindle peak frequency across the 4 days of recording (data not shown, two-way ANOVA: mPFC F(3, 26164) = 4.22, V2 F(3, 23733) = 0.965; Tukey post hoc: mPFC p = 0.12 to >0.99, V2 p = 0.07 to >0.99). However, in females, spindle peak frequency in the mPFC rose during ZT0–6 of metestrus compared with all other estrous cycle phases and compared with males. Area V2 showed a similar rise in peak frequency during ZT0–6 of metestrus compared with males and compared with diestrus and estrus (Supplementary Figure S7A and B). Also, during ZT6–12, both metestrus and proestrus had a higher mPFC peak spindle frequency compared with diestrus and estrus (Supplementary Figure S7A). The spindle peak frequency during metestrus ZT6–12 rose significantly higher than males. Finally, female mPFC peak spindle frequency rose higher than males at the end of the estrus phase, continuing through the light phase of metestrus, then dipping below that of males across the light phase of diestrus ZT0–12. The highest peak spindle frequency in area V2 occurred during proestrus ZT12–18.
Finally, we examined spindle length between males and females and across the estrous cycle. There was no difference in male cortical spindle length across the 4 days of recording at either cortical site (data not shown, two-way ANOVA: mPFC F(3, 26164) = 1.343, V2 F(3, 23733) = 1.20; Tukey post hoc: mPFC p = 0.20 to >0.99, V2 p = 0.26 to >0.99). In the mPFC female spindles also showed no changes in length across the estrous cycle, but were shorter than males during the late dark phase of diestrus and proestrus (ZT18–24) (Supplementary Figure S7C). In area V2 female spindles were shorter than males at the proestrus late dark phase (ZT18–24) and the diestrus early light phase (ZT0–6) but V2 spindles were long at proestrus early dark phase (ZT12–18)—significantly longer than spindles during estrus, and were longest, and longer than males, during metestrus early light phase (ZT0–6) when they were also longer than spindles at all other estrous phases (Supplementary Figure S7D).
Discussion
We have shown that hormonal fluctuations accompanying the estrous cycle in rats have marked effects on sleep amounts and sleep architecture as well as on sleep features such as EEG signal power at different frequencies. This study extends beyond prior studies to include analyses of signal coherence between three brain regions as well as sleep spindle frequency, length, and density, and correlations in spindle density between cortical brain regions.
We found effects of the estrous cycle on sleep-waking architecture in Long-Evans rats that are similar to many of those found in humans and replicates those found in Sprague Dawley rats [8, 32, 39, 40]. Thus, sleep across the estrous cycle in female rats remains consistent across at least two strains.
During proestrus, the rise in estradiol and progesterone promotes waking and suppresses NREM and REM sleep [11, 23, 24, 41]. Similarly, we found that proestrus contained significantly more waking all through the night, with the most prominent spike in waking during ZT12–18 of proestrus when hormonal levels are at their peak (Supplementary Figure S1A). We showed this spike was chiefly due to an increase in the length of each waking bout. The subsequent decrease in NREM was due to a decrease in the NREM bout length rather than the number of bouts per hour, whereas the most dramatic decrease in REM sleep was due to a decrease in both REM bout length and bout frequency. During the morning of estrus there was a significant rebound from the prior proestrus endogenous suppression of NREM and REM, with the increase in both states due to an increase in bout length.
Comparing males to females, the most prominent sex difference in total sleep time and sleep architecture (bout number and length) also occurred during the dark phase of proestrus and the subsequent light phase of estrus. While males remained consistent in their circadian cycle of total sleep amount and sleep architecture over the 4 days of recording, the female increase in waking during proestrus and the rebound in REM sleep in estrus resulted in prominent differences in sleep amounts between the sexes. Sex differences in architecture were also present during metestrus and diestrus, namely, a decrease in light phase REM bout length and a later dark phase increase in REM sleep bout numbers, with these changes both working to decrease the power of circadian phase in regulating sleep in females compared with males in these two phases of the hormonal rhythm (c.f. Figure 1 E vs. F, Figure 2 A vs. B, F vs. G, and Supplementary Figure S1 B vs. C).
Besides sleep amounts and architecture, sleep features that changed most across the estrous cycle include NREM delta and gamma frequency, power and interregional coherence, REM sleep theta power and interregional gamma coherence, and NREM spindle density, frequency, and interregional density correlations. Spindle density correlations between brain areas were reduced compared with males during both metestrus and diestrus, but during proestrus the correlation in spindle density between regions closely resembled that of males (Figure 6).
Within NREM sleep, increases in delta power (0.5–4 Hz) the morning of estrus have been reported [32]. However, we show for the first time that these effects are not isolated to the cortex or a specific region within it (Figure 3). Interestingly, NREM delta power was also increased during the prior night ZT12–24 of proestrus, which was not found in other work [32]. Both of these increases are likely due to delta rebound following earlier sleep suppression, which is a normal compensatory response to reduced sleep [32, 42].
The increase in NREM sleep slow gamma power (31–60 Hz) peaking during ZT12–18 of proestrus (Figure 5) and the increase in slow gamma interregional coherence during the same estrus phase and time period in REM sleep (Supplementary Figure S6C and D) is a novel finding. Previous work has reported an increase in the beta band (15–30 Hz) during the night of proestrus [32] as we found in REM in Figure 4B; however, there are no reports of changes in slow gamma. One potential reason this change has not been identified previously is that during NREM sleep, frequencies greater than 18 Hz (excluding hippocampal ripples of 100–200 Hz) are often ignored, or, when higher frequencies are analyzed, they are investigated for suspected pathophysiology such as insomnia [43]. The presence of increased gamma, a frequency range that has been associated with consciousness [44], co-occurring with increased delta activity during NREM sleep in proestrus and the increase in interregional gamma coherence during REM sleep is unique and should be kept in mind when evaluating different estrous cycle phase effects on, e.g. insomnia reports and memory processing activity. We posit that these changes may be due to competing mechanisms. On one hand, high levels of progesterone, and particularly estradiol, promote wakefulness [45]. Previous work has shown that estradiol suppresses sleep by decreasing the activity of sleep-promoting neurons in the ventral lateral preoptic area [24, 46]. Additionally, estradiol and progesterone receptors are expressed throughout arousal pathways such as the cholinergic basal forebrain, orexinergic neurons in the hypothalamus, and noradrenergic neurons of the locus coeruleus [47–49]. These arousal pathways are also implicated in reproduction [50–52]. It is likely, therefore, that the increased wakefulness at this time is due to activation of these arousal centers. These arousal centers also promote waking gamma [53–55]. However, we saw no increase in waking gamma during proestrus compared with other estrous phases (figures not shown, p > 0.1). Instead, we saw an increase in NREM slow gamma and REM interregional gamma coherence during proestrus, perhaps reflecting increased arousal drive within these sleep states. The increased wakefulness we saw in proestrus should increase sleep pressure through homeostatic mechanisms. Thus, although sleep is sometimes achieved in this phase, the arousal signature of slow gamma power remains inscribed upon these sleep rhythms.
Estrous cycle-related changes in NREM sleep delta power occurred in a similar manner across all recorded regions. However, changes in REM sleep within the theta range were localized to specific brain regions. Additional differences in REM sleep were identified outside of the theta range, but only during ZT12–18 and only in proestrus where low amounts of REM sleep affected power spectra sampling. Previous work did not identify specific changes in REM sleep theta power across the estrous or menstrual cycle and treating ovariectomized female rodents with gonadal sex hormones has provided mixed theta power results [15, 32, 56, 57]. However, as REM sleep theta has been linked to memory consolidation [27, 58, 59], even isolated theta power reductions may have detrimental effects on cognition when REM occurs in this window. Also, REM theta is reduced in post-traumatic stress disorder (PTSD), which is considered by many to be a memory consolidation disorder [60]. PTSD affects a higher percentage of trauma-exposed women than men [61]. Our study suggests that windows of decreased REM theta power across the hormonal cycle could present vulnerable periods where maladaptive responses to traumatic stress are more likely to result. Conversely, higher theta power in the late proestrus phase could present a window of resilient sleep.
Schwierin et al. established that both NREM 0.75–4 Hz SWA and 10–25 Hz activity were regulated differently during the dark phase of proestrus: SWA decreased and 10–25 Hz frequency activity increased. In contrast, we found both 0.5–4 Hz SWA and 31–60 Hz slow gamma activity increased during the dark phase of proestrus. This increase in slow gamma during proestrus was also different from males in both the mPFC and V2. The prominent cortical increase in slow gamma is likely due to the aforementioned effects of estradiol and progesterone n sleep/waking circuits and is contrasted by the complete absence of slow gamma changes (whether in raw spectral power or homeostasis) in males. Further work is necessary to replicate and to better understand these changes in SWA and slow-gamma activity.
We show novel changes in intracortical coherence and cortical–hippocampal coherence during sleep across the estrous cycle. Although there were no differences in coherence between males and females, within females, NREM sleep SWA and sigma band (sleep spindle frequency) coherence increased during ZT12–18 of proestrus. In REM sleep, although there was not a change in theta coherence across the estrous cycle, there was enhanced slow and fast gamma-band coherence between cortical areas and between the mPFC and hippocampus in that same early dark phase of proestrus. Despite decrease in sleep during the dark phase of proestrus the increase in coherence may be indicative of enhanced offline processing [62]. Specifically, memory processing, which requires sleep, may be preserved by enhanced coherence despite a decrease in overall sleep.
To the best of our knowledge, no previous work exists examining sleep spindles within female rodents across the estrous cycle. We show that spindle density increases during the light phase of proestrus in the mPFC and decreases at the end of the dark phase of proestrus in area V2. Although the mechanism for the increase in spindle density during proestrus remains unknown, we can speculate about the function. As spindles have been linked to memory consolidation [27, 63, 64], an increase in spindles, specifically in the mPFC, a region necessary for decision making and higher cognitive function (for review see ref. [65]), may be indicative of enhanced memory processing. Strengthening memory processing just prior to fertility could enhance, among other memories, consolidation of contexts associated with reproductive success. The increased spindle density in female rats occurred at a slightly different point in the hormonal cycle than in women. In women, spindle density increases during the luteal phase following ovulation [15], whereas we report in rats that the increase occurred during the light phase of proestrus just prior to ovulation.
Although there was no difference in spindle density between males and females within either cortical region, there were differences in interregional spindle density correlation and in spindle length and peak frequency between the sexes, and across the estrous cycle. Previous work found an approximately 0.5 Hz increase in spindle frequency across the menstrual cycle [21]. We found a mild but significant approximately 0.2 Hz increase in spindle frequency during metestrus and proestrus compared with other phases. The increase in V2 spindle length during the early dark phase of proestrus and the early dark phase of metestrus is more interesting, as we have found that a reduction in longer spindles was associated with learning deficits [26]. Thus, modulations in spindle density and spindle length in different cortical areas at different estrous phases could alter memory consolidation. Further work in learning and memory and estrous cycle phases is necessary to determine whether these changes in sleep spindle characteristics have any physiological relevance.
Conclusion
We demonstrate that the estrous cycle alters sleep architecture, NREM and REM sleep power spectra, interregional coherence, and sleep spindle density and interregional density correlations, spindle frequency, and length. Further, there are differences between males and females in sleep architecture, slow gamma coherence, NREM delta, and spindle characteristics—the majority of which occur within proestrus and estrus. We conclude that the estrous cycle has a much greater effect on sleep than previously thought and should be fully considered in future studies to better understand and benefit women’s health.
Supplementary Material
Acknowledgments
We would like to thank Sue Moenter (University of Michigan) for her expertise in the rodent estrous cycle and sex differences and Brooks Gross (UCLA) for his consultations and assistance in sleep staging.
Funding
This research was supported by RO1 NIMH 60670 (GRP), and the Rackham Merit Fellowship-University of Michigan (KMS).
Conflict of interest statement. The authors declare no conflicting interest.
References
- 1. Baker FC, et al. . Menstrual cycle effects on sleep. Sleep Med Clin. 2018;13(3):283–294. [DOI] [PubMed] [Google Scholar]
- 2. Symonds CS, et al. . Effects of the menstrual cycle on mood, neurocognitive and neuroendocrine function in healthy premenopausal women. Psychol Med. 2004;34(1):93–102. [DOI] [PubMed] [Google Scholar]
- 3. Cahill L. Why sex matters for neuroscience. Nat Rev Neurosci. 2006;7(6):477–484. [DOI] [PubMed] [Google Scholar]
- 4. Clegg DJ, et al. . Gonadal hormones determine sensitivity to central leptin and insulin. Diabetes. 2006;22(4):978–987. [DOI] [PubMed] [Google Scholar]
- 5. Hirschberg AL. Sex hormones, appetite and eating behaviour in women. Maturitas. 2012;71(3):248–256. [DOI] [PubMed] [Google Scholar]
- 6. Baker FC, et al. . Circadian rhythms, sleep, and the menstrual cycle. Sleep Med. 2007;8(6):613–622. [DOI] [PubMed] [Google Scholar]
- 7. Mong JA, et al. . Sleep, rhythms, and the endocrine brain: influence of sex and gonadal hormones. J Neurosci. 2011;31(45):16107–16116. [DOI] [PMC free article] [PubMed] [Google Scholar]
- 8. Colvin GB, et al. . Changes in sleep-wakefulness in female rats during circadian and estrous cycles. Brain Res. 1968;7(2):173–181. [DOI] [PubMed] [Google Scholar]
- 9. Malven PV, et al. . Sleeping patterns in female guinea pigs; effects of sex hormones. Exp Neurol. 1966;15(2):229–239. [DOI] [PubMed] [Google Scholar]
- 10. Colvin GB, et al. . Circadian sleep-wakefulness patterns in rats after ovariectomy and treatment with estrogen. Exp Neurol. 1969;25(4):616–625. [DOI] [PubMed] [Google Scholar]
- 11. Branchey M, et al. . Effects of estrogen and progesterone on sleep patterns of female rats. Physiol Behav. 1971;6(6):743–746. [DOI] [PubMed] [Google Scholar]
- 12. Paul KN, et al. . Diurnal sex differences in the sleep–wake cycle of mice are dependent on gonadal function. Sleep. 2006;29(9):1211–1223. [DOI] [PubMed] [Google Scholar]
- 13. Fang J, Fishbein W. Sex differences in paradoxical sleep: influences of estrus cycle and ovariectomy. Brain Res. 1996;734(1–2):275–285. [PubMed] [Google Scholar]
- 14. Ehlen JC, et al. . Sex chromosomes regulate nighttime sleep propensity during recovery from sleep loss in mice. PLoS One. 2013;8(5):e62205. [DOI] [PMC free article] [PubMed] [Google Scholar]
- 15. Driver HS, et al. . Sleep and the sleep electroencephalogram across the menstrual cycle in young healthy women. J Clin Endocrinol Metab. 1996;81(2):728–735. [DOI] [PubMed] [Google Scholar]
- 16. Dzaja A, et al. . Women’s sleep in health and disease. J Psychiatr Res. 2005;39(1):55–76. [DOI] [PubMed] [Google Scholar]
- 17. Moline ML, et al. . Sleep in women across the life cycle from adulthood through menopause. Med Clin North Am. 2004;88(3):705–36, ix. [DOI] [PubMed] [Google Scholar]
- 18. Manber R, et al. . Sex, steroids, and sleep: a review. Sleep. 1999;22(5):540–555. [PubMed] [Google Scholar]
- 19. Johnson EO, et al. . Epidemiology of DSM-IV insomnia in adolescence: lifetime prevalence, chronicity, and an emergent gender difference. Pediatrics. 2006;117(2):e247–e256. [DOI] [PubMed] [Google Scholar]
- 20. Roenneberg T, et al. . Epidemiology of the human circadian clock. Sleep Med Rev. 2007;11(6):429–438. [DOI] [PubMed] [Google Scholar]
- 21. Ishizuka Y, et al. . Sleep spindle frequency changes during the menstrual cycle. J Sleep Res. 1994;3(1):26–29. [DOI] [PubMed] [Google Scholar]
- 22. Koehl M, et al. . Sleep in female mice: a strain comparison across the estrous cycle. Sleep. 2003;26(3):267–272. [DOI] [PubMed] [Google Scholar]
- 23. Cusmano DM, et al. . Gonadal steroid modulation of sleep and wakefulness in male and female rats is sexually differentiated and neonatally organized by steroid exposure. Endocrinology. 2014;155(1):204–214. [DOI] [PMC free article] [PubMed] [Google Scholar]
- 24. Hadjimarkou MM, et al. . Estradiol suppresses rapid eye movement sleep and activation of sleep-active neurons in the ventrolateral preoptic area. Eur J Neurosci. 2008;27(7):1780–1792. [DOI] [PubMed] [Google Scholar]
- 25. Westwood FR. The female rat reproductive cycle: a practical histological guide to staging. Toxicol Pathol. 2008;36(3):375–384. [DOI] [PubMed] [Google Scholar]
- 26. Emrick JJ, et al. . Different simultaneous sleep states in the Hippocampus and Neocortex. Sleep. 2016;39(12):2201–2209. [DOI] [PMC free article] [PubMed] [Google Scholar]
- 27. Swift KM, Gross BA, Frazer MA, et al. . Abnormal locus coeruleus sleep activity alters sleep signatures of memory consolidation and impairs place cell stability and spatial memory. Curr Biol. 2018:1–11. [DOI] [PMC free article] [PubMed] [Google Scholar]
- 28. Gross BA, et al. . Open-source logic-based automated sleep scoring software using electrophysiological recordings in rats. J Neurosci Methods. 2009;184(1):10–18. [DOI] [PMC free article] [PubMed] [Google Scholar]
- 29. Kattla S, et al. . Fatigue related changes in electromyographic coherence between synergistic hand muscles. Exp Brain Res. 2010;202(1):89–99. [DOI] [PubMed] [Google Scholar]
- 30. Eschenko O, et al. . Elevated sleep spindle density after learning or after retrieval in rats. J Neurosci. 2006;26(50):12914–12920. [DOI] [PMC free article] [PubMed] [Google Scholar]
- 31. Ghasemi A, et al. . Normality tests for statistical analysis: a guide for non-statisticians. Int J Endocrinol Metab. 2012;10(2):486–489. [DOI] [PMC free article] [PubMed] [Google Scholar]
- 32. Schwierin B, et al. . Sleep homeostasis in the female rat during the estrous cycle. Brain Res. 1998;811(1–2):96–104. [DOI] [PubMed] [Google Scholar]
- 33. Mölle M, et al. . Learning increases human electroencephalographic coherence during subsequent slow sleep oscillations. Proc Natl Acad Sci USA. 2004;101(38):13963–13968. [DOI] [PMC free article] [PubMed] [Google Scholar]
- 34. Tarokh L, et al. . Early adolescent cognitive gains are marked by increased sleep EEG coherence. PLoS One. 2014;9(9):e106847. [DOI] [PMC free article] [PubMed] [Google Scholar]
- 35. Gaillard JM, et al. . Spindle density in sleep of normal subjects. Sleep. 1981;4(4):385–391. [DOI] [PubMed] [Google Scholar]
- 36. Malow BA, et al. . Hippocampal sleep spindles revisited: physiologic or epileptic activity? Clin Neurophysiol. 1999;110(4):687–693. [DOI] [PubMed] [Google Scholar]
- 37. Sullivan D, et al. . Comparison of sleep spindles and theta oscillations in the hippocampus. J Neurosci. 2014;34(2):662–674. [DOI] [PMC free article] [PubMed] [Google Scholar]
- 38. Ferrara M, et al. . Hippocampal sleep spindles preceding neocortical sleep onset in humans. Neuroimage. 2013;86:425–432. [DOI] [PubMed] [Google Scholar]
- 39. Kleinlogel H. The female rat’s sleep during oestrous cycle. Neuropsychobiology. 1983;10(4):228–237. [DOI] [PubMed] [Google Scholar]
- 40. Zhang SQ, et al. . Sleep patterns in cyclic and pseudopregnant rats. Neurosci Lett. 1995;193(2):125–128. [DOI] [PubMed] [Google Scholar]
- 41. Mongrain V, et al. . Chronotype and sex effects on sleep architecture and quantitative sleep EEG in healthy young adults. Sleep. 2005;28(7):819–827. [DOI] [PubMed] [Google Scholar]
- 42. Borbély AA, et al. . Sleep deprivation: effect on sleep stages and EEG power density in man. Electroencephalogr Clin Neurophysiol. 1981;51(5):483–495. [DOI] [PubMed] [Google Scholar]
- 43. Perlis ML, et al. . Beta/Gamma EEG activity in patients with primary and secondary insomnia and good sleeper controls. Sleep. 2001;24(1):110–117. [DOI] [PubMed] [Google Scholar]
- 44. Başar-Eroglu C, et al. . Gamma-band responses in the brain: a short review of psychophysiological correlates and functional significance. Int J Psychophysiol. 1996;24(1–2):101–112. [DOI] [PubMed] [Google Scholar]
- 45. Deurveilher S, et al. . Estradiol and progesterone modulate spontaneous sleep patterns and recovery from sleep deprivation in ovariectomized rats. Sleep. 2009;32(7):865–877. [PMC free article] [PubMed] [Google Scholar]
- 46. Deurveilher S, et al. . Estradiol replacement enhances sleep deprivation-induced c-Fos immunoreactivity in forebrain arousal regions of ovariectomized rats. Am J Physiol Regul Integr Comp Physiol. 2008;295(4):R1328–R1340. [DOI] [PubMed] [Google Scholar]
- 47. Shughrue PJ, et al. . Comparative distribution of estrogen receptor-alpha and -beta mRNA in the rat central nervous system. J Comp Neurol. 1997;388(4):507–525. [DOI] [PubMed] [Google Scholar]
- 48. Curran-Rauhut MA, et al. . The distribution of progestin receptor mRNA in rat brainstem. Brain Res Gene Exp Patterns. 2002;1(3–4):151–157. [DOI] [PubMed] [Google Scholar]
- 49. Mong JA, et al. . Sex differences in sleep: impact of biological sex and sex steroids. Philos Trans R Soc Lond B Biol Sci. 2016;371(1688):20150110. [DOI] [PMC free article] [PubMed] [Google Scholar]
- 50. Earnest DJ, et al. . Role for acetylcholine in mediating effects of light on reproduction. Science. 1983;219(4580):77–79. [DOI] [PubMed] [Google Scholar]
- 51. Kohsaka A, et al. . A significant participation of orexin-A, a potent orexigenic peptide, in the preovulatory luteinizing hormone and prolactin surges in the rat. Brain Res. 2001;898(1):166–170. [DOI] [PubMed] [Google Scholar]
- 52. Deaver DR, et al. . Effects of dopamine, norepinephrine and serotonin on plasma concentrations of luteinizing hormone and prolactin in ovariectomized and anestrous ewes. Biol Reprod. 1982;27(3):624–632. [DOI] [PubMed] [Google Scholar]
- 53. Betterton RT, et al. . Acetylcholine modulates gamma frequency oscillations in the hippocampus by activation of muscarinic M1 receptors. Eur J Neurosci. 2017;45(12):1570–1585. [DOI] [PMC free article] [PubMed] [Google Scholar]
- 54. Hajós M, et al. . Norepinephrine but not serotonin reuptake inhibitors enhance theta and gamma activity of the septo-hippocampal system. Neuropsychopharmacology. 2003;28(5):857–864. [DOI] [PubMed] [Google Scholar]
- 55. Vassalli A, et al. . Hypocretin (orexin) is critical in sustaining theta/gamma-rich waking behaviors that drive sleep need. Proc Natl Acad Sci USA. 2017;114(27):E5464–E5473. [DOI] [PMC free article] [PubMed] [Google Scholar]
- 56. Deurveilher S, et al. . Female reproductive hormones alter sleep architecture in ovariectomized rats. Sleep. 2011;34(4):519–530. [DOI] [PMC free article] [PubMed] [Google Scholar]
- 57. Pawlyk AC, et al. . Effect of 17alpha-ethinyl estradiol on active phase rapid eye movement sleep microarchitecture. Eur J Pharmacol. 2008;591(1-3):315–318. [DOI] [PubMed] [Google Scholar]
- 58. Boyce R, et al. . Causal evidence for the role of REM sleep theta rhythm in contextual memory consolidation. Science. 2016;352(6287):812–816. [DOI] [PubMed] [Google Scholar]
- 59. Nishida M, et al. . REM sleep, prefrontal theta, and the consolidation of human emotional memory. Cereb Cortex. 2009;19(5):1158–1166. [DOI] [PMC free article] [PubMed] [Google Scholar]
- 60. Cowdin N, et al. . Theta frequency activity during rapid eye movement (REM) sleep is greater in people with resilience versus PTSD. Exp Brain Res. 2014;232(5):1479–1485. [DOI] [PMC free article] [PubMed] [Google Scholar]
- 61. Shalev A, et al. . Post-traumatic stress disorder. N Engl J Med. 2017;376(25):2459–2469. [DOI] [PubMed] [Google Scholar]
- 62. Montgomery SM, et al. . Theta and gamma coordination of hippocampal networks during waking and rapid eye movement sleep. J Neurosci. 2008;28(26):6731–6741. [DOI] [PMC free article] [PubMed] [Google Scholar]
- 63. Nishida M, et al. . Daytime naps, motor memory consolidation and regionally specific sleep spindles. PLoS One. 2007;2(4):e341. [DOI] [PMC free article] [PubMed] [Google Scholar]
- 64. Latchoumane CV, et al. . Thalamic spindles promote memory formation during sleep through triple phase-locking of cortical, thalamic, and hippocampal rhythms. Neuron. 2017;95(2):424–435.e6. [DOI] [PubMed] [Google Scholar]
- 65. Euston DR, et al. . The role of medial prefrontal cortex in memory and decision making. Neuron. 2012;76(6):1057–1070. [DOI] [PMC free article] [PubMed] [Google Scholar]
Associated Data
This section collects any data citations, data availability statements, or supplementary materials included in this article.