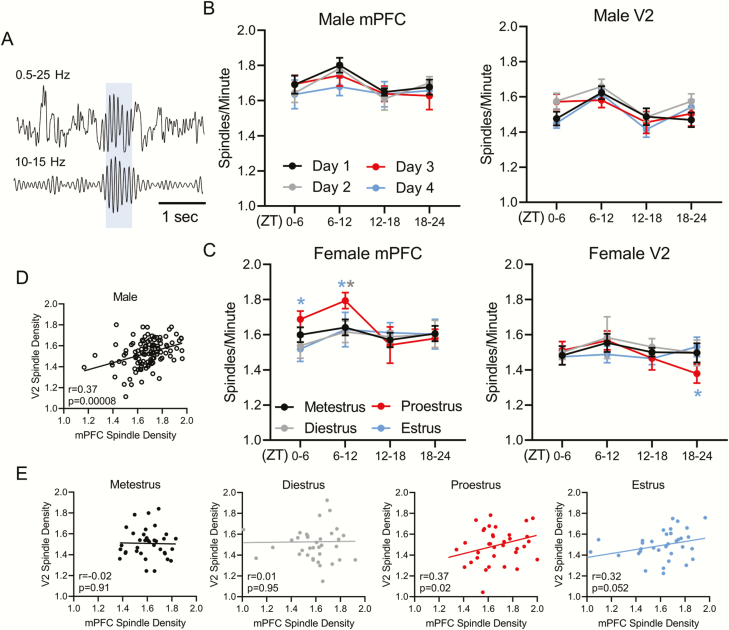
Figure 6.
Sleep spindles density changes across the estrous cycle. (A) Example sleep spindle identified from medial prefrontal cortex (mPFC) EEG with 0.5–25 Hz filter on top and 10–15 Hz spindle frequency on the bottom panel. Blue shaded region represents an identified spindle. (B) Male mPFC and secondary visual cortex (V2) sleep spindle density (spindles per minute) across 4 days of recording. (C) Female mPFC and V2 sleep spindle density across the estrous cycle. (D) Pearson correlation of male mPFC spindle density vs. male V2 spindle density. (E) Pearson correlation of female mPFC spindle density vs. female V2 spindle density across each phase of the estrous cycle. Analysis within males and females was done via repeated measure two-way ANOVA: male mPFC F(3, 18) = 0.475, male V2 F(3, 18) = 3.461, female mPFC F(3, 24) = 3.212, female V2 F(3, 24) = 0.589; Tukey post hoc *p < 0.05. Asterisk color denotes the day or estrous phase from which the adjacent data significantly differs. Analysis comparing male 4 day average to females was performed with a two-way ANOVA: mPFC F(4, 152) = 1.863, V2 F(4, 152) = 0.701. Dunnett post hoc; no differences found. All plots in (B) and (C) display mean ± SEM. Males n = 7, females n = 9. For correlations in (D) and (E) each point represents sleep spindle density during a single quartile of the day for each animal. Male correlations include all 4 days of recording, whereas female correlations are divided by estrous cycle phase. Males n = 112 (7 males * 4 days * 4 quartiles/day). Females n = 36/phase (9 females * 4 quartiles/phase).

