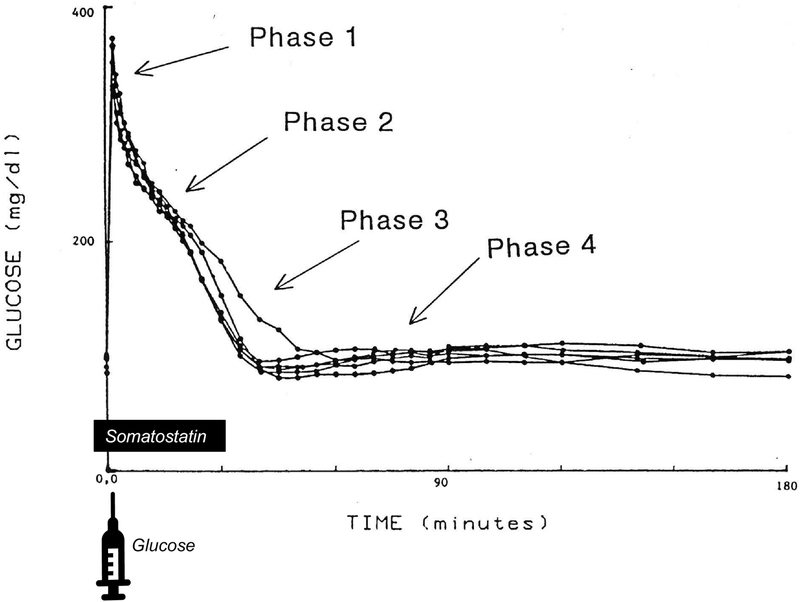
Figure 2.
Phases of glucose normalization during the intravenous glucose tolerance test. Glucose was injected at t=0. Somatostatin was infused from −1 to 30 minutes to delay insulin response. Phase 1: glucose mixing; Phase 2: insulin-independent glucose disappearance (i.e. glucose effectiveness); Phase 3: insulin-dependent glucose disappearance; Phase 4: glucose renormalization. Adapted from (18).

