Abstract
Mutations in genes involved in DNA methylation (DNAme; e.g., TET2, DNMT3A), are frequently observed in hematological malignancies1–3 and clonal hematopoiesis4,5. Applying single-cell sequencing to murine hematopoietic stem and progenitor cells, we observed that these mutations disrupt hematopoietic differentiation, causing opposite shifts in the frequencies of erythroid vs. myelo-monocytic progenitors upon Tet2 or Dnmt3a loss. Notably, these shifts trace back to transcriptional priming skews in uncommitted hematopoietic stem cells (HSCs). To reconcile genome-wide DNAme changes with specific erythroid vs. myelo-monocytic skews, we provide evidence in support of differential sensitivity of transcription factors due to biases in CpG enrichment in their binding motif. Single-cell transcriptomes with targeted genotyping showed similar skews in transcriptional priming of DNMT3A-mutated human clonal hematopoiesis bone marrow progenitors. These data show that DNAme shapes the hematopoietic differentiation topography, and support a model in which genome-wide methylation changes are transduced to differentiation skews through biases in transcription factor binding-motif CpG enrichment.
Keywords: Clonal hematopoiesis, Tet2, Dnmt3a, DNA methylation, hematopoietic differentiation, single cell RNA sequencing
HSCs exhibit transcriptional oscillations that drive cell-fate commitment; a process defined as transcriptional priming6,7. Sampling of lineage fates leads to HSC transcriptional heterogeneity8, which is epigenetically propagated9. DNAme likely impacts this process as a stably inherited epigenetic mark10,11 implicated in the regulation of transcription factor binding12–17. Consistent with a prominent role for DNAme in HSC differentiation18,19, somatic mutations in DNAme modifiers are frequently observed in myeloid malignancies, including mutations in DNMT3A, a key de novo CpG methyltransferase, TET2, encoding an enzyme critical for CpG demethylation, and missense mutations in IDH1 and IDH2 leading to the production of 2-hydroxyglutarate (2HG), an oncometabolite that inhibits TET2 activity20. Such mutations are thought to arise in primitive hematopoietic stem and progenitor populations, thus disrupting HSC function21. Mutations in DNAme modifiers are also frequently observed in clonal hematopoiesis, a state of abnormal HSC clonal expansion without overt hematological abnormality, associated with increased risk of heart disease and blood cancers22–30. However, how mutations in TET2, DNMT3A and IDH2 skew HSC transcriptional priming remains largely unknown. We therefore applied single cell RNA sequencing (scRNA-seq) to hematopoietic progenitors from mice with somatic deletion of Tet2 or Dnmt3a or expression of mutant Idh2, to uncover transcriptional priming skews in HSCs upon disruption of genome wide methylation.
We performed scRNA-seq on bone marrow lineage-negative (Lin−) hematopoietic progenitors from Mx1-Cre wild type (WT) and Mx1-Cre Tet2flfl mice (Tet2 KO; Figure 1a, Extended Data Figure 1a–d and Extended Data Figure 2a–e). Cells were isolated four weeks after Cre-mediated recombination (Figure 1a and Extended Data Figure 1e–f) to study the impact on HSC transcriptional priming, before secondary genetic events may take place31 (Supplementary Table 1). Data integration and clustering identified a total of 26 transcriptional clusters, consistent with previous reports32 (Figure 1b–d and Supplementary Table 2). This analysis showed that Tet2 KO did not result in novel independent clusters, with intermingling of WT and Tet2 KO cells throughout all progenitor clusters (Extended Data Figure 1g and Extended Data Figure 3a–c).
Figure 1. Experimental design and single cell RNA sequencing data integration and clustering.
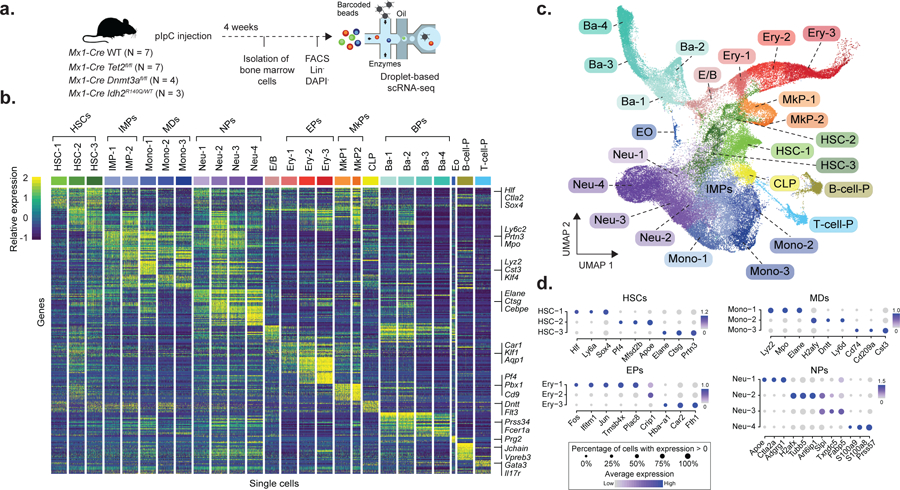
a) Experimental design for scRNA-seq experiments, showing the number of mice used for each genotype (pIpC = polyinosinic-polycytadylic acid; FACS = Fluorescence-assisted cell sorting, Lin− = Lineage negative, DAPI− = negative for DAPI staining). b) Single cell expression profiles from 200 randomly sampled cells from each of the cell clusters from WT mice (HSC = Hematopoietic stem cell; IMP = Immature myeloid progenitor, Mono = Monocyte progenitor, Neu = Neutrophil/granulocyte progenitor; E/B = Erythroid/basophil progenitor; Ery = Erythroid progenitor; MkP = Megakaryocyte progenitor; CLP = Common lymphoid progenitor; Ba = Basophil progenitor; Eo = Eosinophil progenitor; B-cell-P = B-cell progenitor; T-cell-P = T-cell progenitor). Examples of genes used for classification are shown. c) Uniform Manifold Approximation and Projection (UMAP) dimensionality reduction (n = 68,613 cells) d) Top three differentially expressed genes (FDR < 0.05, logistic regression with Bonferroni correction) when comparing each cell cluster with the remaining clusters corresponding to the same cell type in WT (N = 4 mice from Chromium technology). HSCs = Hematopoietic stem cells (n = 1,164 cells); MDs = Monocytic-dendritic progenitor, (n = 917 cells); EPs = Erythroid progenitors (n = 1,169 cells); NPs = Neutrophil progenitors (n = 2,421 cells). The dot size encodes the fraction of cells within the cluster that show detectable expression of the gene (UMIs > 0), while the color encodes the average expression level across all cells within a cluster.
Nonetheless, Tet2 deletion affected the frequency of specific cell clusters, including a 50% increase of HSC-1 cluster (Figure 2a–b and Extended Data Figure 4a), with similar findings in Lin− c-Kit+ progenitors (Extended Data Figure 4b–c). The expanded HSC-1 cluster showed decreased cell cycle activity (Figure 2c, left panel and Supplementary Table 3, module 15), as well as an increase in cell quiescence (Figure 2c, right panel, Extended Data Figure 4d and Supplementary Table 3), which may underlie the expansion of these mutated HSCs33. In agreement with these findings, we observed a decrease in Ki67+ LT-HSCs (Lin−, Sca-1+, c-Kit+, CD150+, CD48−) and an increase in serial re-plating capacity in Tet2 KO bone marrow (BM) cells (Extended Data Figure 4e–f).
Figure 2. Tet2 KO promotes HSC expansion and skews myelo-monocytic vs. erythroid progenitor frequencies.
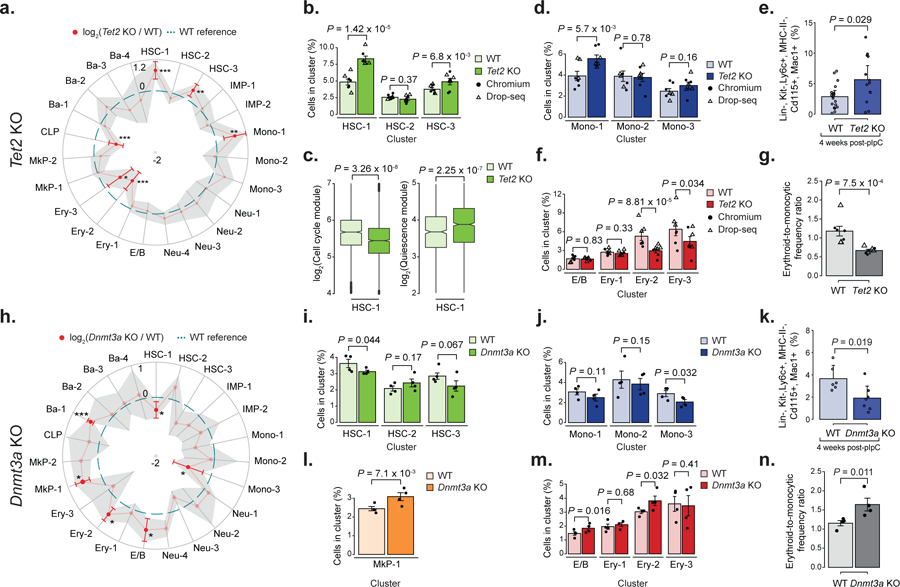
a) Changes in cluster frequencies for lineage negative Tet2 KO (18,651 cells, n = 7 mice) relative to WT (17,702 cells, n = 7 mice). Red dots indicate significant frequency changes; red error bars represent standard deviation; dashed line indicates WT reference frequencies; shadow region indicates +/− standard deviation. Statistical comparison was performed by linear mixed model (LMM) followed by ANOVA; * P < 0.05; ** P < 0.01; *** P < 0.001). b) HSC 1–3 cluster frequencies for WT (n = 7 mice) and Tet2 KO (n = 7 mice; LMM followed by ANOVA. c) Left panel: comparison of cell cycle signature for WT (n = 1,136 cells, n = 7 mice) and Tet2 KO (n = 1,728 cells; n = 7 mice; two-sided Wilcoxon rank sum test). Right panel: quiescence score for each cell for WT (n = 1,136 cells, n = 7 mice) and Tet2 KO (n = 1,728 cells; n = 7 mice; two-sided Wilcoxon rank sum test). d) Mono 1–3 cluster frequencies for WT (n = 7 mice) and Tet2 KO (n = 7 mice; LMM followed by ANOVA). e) Bone marrow monocyte precursor cell frequency as measured by flow cytometry for WT (n = 18) and Tet2 KO (n = 13) mice (two-sided Student t-test; error bars represent standard deviation). f) E/B and Ery 1–3 cluster frequency for WT (n = 7 mice) and Tet2 KO (n = 7 mice; LMM followed by ANOVA) g) Ratio between WT (n = 7 mice) and Tet2 KO (n = 7 mice) early erythroid (E/B, Ery-1 and Ery-2) and monocytic (IMP-1 and Mono-1) cluster frequencies. (LMM followed by ANOVA). h) Overview of relative changes in cluster frequencies for lineage-negative Dnmt3a KO (n = 4 mice) relative to technology-matched WT (n = 4 mice) progenitors. Red dots indicate significant frequency changes; red error bars indicate standard deviation; dashed line indicates WT reference frequencies; shadow region indicates +/− standard deviation (LMM followed by ANOVA; * P < 0.05, *** P < 0.001). i) HSC 1–3 cluster frequency for WT (n = 4 mice) and Dnmt3a KO (n = 4 mice; LMM followed by ANOVA). j) Mono 1–3 cluster frequencies for WT (n = 4 mice) and Dnmt3a KO (n = 4 mice; LMM followed by ANOVA). k) Flow cytometry measurement of Ly6c+ monocyte precursors for WT (n = 6) and Dnmt3a KO (n = 7) mice (two-sided Students t-test; error bars represent standard deviation). l) MkP-1 cluster frequency for WT (n = 4 mice) and Dnmt3a KO (n = 4 mice; LMM followed by ANOVA). m) E/B and Ery 1–3 cluster frequency for WT (n = 4 mice) and Dnmt3a KO (n = 4 mice; LMM followed by ANOVA). n) Ratio between WT (n = 4 mice) and Dnmta3 KO (n = 4 mice) early erythroid (E/B, Ery-1 and Ery-2) and monocytic (IMP-1 and Mono-1) cluster frequencies (LMM followed by ANOVA). All experiments in this figure were performed 4 weeks after recombination. For all barplots, bars indicate the mean frequencies; dots indicate biological replicates and error bars represent standard error except indicated otherwise.
We also observed an increase in the myelo-monocytic progenitor cluster Mono-1 (Figure 2d), marked by Ly6c2, Prtn3 and Lyz2 and lack of expression of H2-Ab1 (Extended Data Figure 4g–h), consistent with monocyte/macrophage-biased cell expansion34–37 (Figure 2e and Extended Data Figure 5a–b). Consistent with the scRNA-seq data, Tet2 KO mice showed increased peripheral blood monocytes (Extended Data Figure 5c). In contrast, we identified decreased erythroid progenitor frequencies (Figure 2f and Extended Data Figure 5b), reflected in decreased peripheral red blood cells in Tet2 KO mice (Extended Data Figure 5c) and decreased ability of Tet2 KO bone marrow cells to generate erythroid colonies (Extended Data Figure 5d). These skews resulted in a shift in the erythroid-to-monocytic cell frequency ratio (Figure 2g), which remained 20 weeks after recombination (Extended Data Figure 5e–f).
Neomorphic IDH2 mutations result in synthesis of the oncometabolite 2-hydroxyglutarate that inhibits TET220,38. TET2 and IDH2 mutations are often mutually exclusive39, suggesting convergent mechanisms. Nonetheless, Lin− cells from Mx1-Cre Idh2R140Q/WT mice (Idh2-R140Q) showed no changes in the frequencies of HSC 1–3 or Mono-1 clusters, with only a decrease in Ery-2 cluster (Extended Data Figure 6a–e). Thus, Idh2-R140Q mutations do not phenocopy Tet2 deletion in disrupting hematopoietic differentiation. Differential gene expression analysis did not show major changes in Idh2-R140Q mutant HSCs compared to WT (Extended Data Figure 6f), suggesting that Idh2-R140Q HSC disruption may be less pronounced than Tet2 KO, consistent with emerging data in clonal hematopoiesis showing that IDH2 mutations are less frequently observed.
In contrast, DNMT3A is the most commonly mutated gene in clonal hematopoiesis5. Notably, DNMT3A is associated with an opposite effect on global methylation compared with TET2 loss39. scRNAseq of Mx1-Cre Dnmt3afl/fl (Dnmt3a KO) mice (Extended Data Figure 1a and Extended Data Figure 1f) showed an opposite skew in erythroid vs. myelo-monocytic progenitor frequencies compared to Tet2 KO (Figure 2h–m; Extended Data Figure 6g–h), associated with abnormal erythrocyte indices (Extended Data Figure 6i), akin to those observed in clonal hematopoiesis5. Thus, Dnmt3a KO showed skews that favor the erythroid over the myelo-monocytic lineage (Figure 2n), opposite to biases observed in Tet2 KO (Extended Data Figure 6j).
Differential gene expression of Tet2 KO HSCs showed reduced expression of DNA replication genes (Figure 3a), consistent with decreased cell cycling. Tet2 KO HSCs displayed increased Cxcr4 expression, a mediator of HSC homing40,41 under active investigation as a therapeutic target42,43. Notably, consistent with disruption of transcriptional priming, we observed increased expression of monocyte-related genes, and a decrease in expression MEP genes (Supplementary Table 4) including erythroid related genes (e.g. Car1, and Car2). In contrast, Dnmt3a KO HSCs up-regulate Car1 (Figure 3a).
Figure 3. Erythroid-to-myeloid committed progenitor frequency changes are concordant with skewed HSC transcriptional priming.

a) UMAP highlighting the selected HSC clusters (HSC 1–3, left panel). Differential gene expression between WT (n = 2,150 cells) and Tet2 KO (n = 2,989 cells, central panel) or WT and Dnmt3a KO (n = 1,325 cells, right panel) HSC 1–3 clusters. Red dots represent differentially expressed genes (permutation test followed by Benjamini-Hochberg (BH) correction, FDR < 0.05, see online methods) with an absolute log2 fold change higher than 0.5. Pathway enrichment was performed with EnrichR57. b) Top panel: heatmap showing single cells from HSC 1–3 clusters. Bottom panel: Generalized additive model fit for erythroid, myelo-monocytic and stem scores from WT (n = 7 mice) HSC 1–3 clusters (n = 7,648 cells). Grey areas represent the 95% confidence interval. c) For each genotype, 1,225 cells from the HSC 1–3 clusters were randomly sampled and density plots were generated. The percentage of cells with either erythroid or myelo-monocytic priming is shown. d) Transcriptional priming scores for HSC 1–3 cells for Tet2 KO (2,989 cells; n = 7 mice), WT (2,150 cells; n = 7 mice) and Dnmt3a KO (1,225 cells, n = 4 mice) progenitors (two-sided Wilcoxon rank sum test followed by Bonferroni correction). e) Posterior probabilities of Gaussian mixture model fit for myelo-monocytic transcriptional priming for 1,225 randomly sampled cells from the HSC 1–3 clusters for WT (n = 4), Tet2 KO (n = 3) or Dnmt3a KO (n = 4) from Chromium samples (Binomial test). f) In vitro colony-forming assay using purified LT-HSCs from WT (n = 282 colonies), Tet2 KO (n = 391 colonies) or Dnmt3a KO (n = 209 colonies; two-sided Fisher exact test; CFU-GM = colony-forming unit granulocytic/monocytic; BFU-E = burst-forming unit erythroid; CFU-GEMM = colony-forming unit granulocytic/erythroid/monocyte/megakaryocyte, see online methods). g) Schematic representation of the procedure for visualization of the differentiation topology. h) Differentiation topologies derived from scRNA-seq data.
Gene module analysis of WT HSCs (Extended Data Figure 7a–b and Supplementary Table 3, see online methods) showed anti-correlated erythroid and myelo-monocytic modules reflecting that transcriptional priming towards these divergent fates can be observed already in uncommitted HSCs (Figure 3b). This analysis further showed that that differentiation skews (Figure 2) result from concordant skews in HSC transcriptional priming (Figure 3c–e and Extended Data Figure 7c, validated through in vitro assays in Figure 3f). Thus, Tet2 KO hyper-methylation leads to myelo-monocytic skews in HSC priming, whereas Dnmt3a KO-induced hypo-methylation resulted in opposite erythroid-biased skews (Figure 3g–h). These data raise an intriguing question: given that changes in DNAme caused by these mutations are globally distributed across the genome, how do genome-wide changes in DNAme drive deterministic skews in hematopoietic differentiation?
We hypothesized that differences in CpG density of DNA binding motifs of cell-fate specific transcription factors may lead to differential sensitivity to global methylation level changes (Figure 4a), supported by the association between transcription factor motif sensitivity to methylation and change in transcription factor transcriptional activity upon Tet2 KO (Extended Data Figure 8a–b). Consistent with our hypothesis that CpG enrichment of transcription factor motifs may underlie the link between global DNAme changes and deterministic HSC priming skews, the known DNA binding motifs44,45 of erythroid-related transcription factors displayed higher CpG content compared with binding motifs of myelo-monocytic-related transcription factors (Figure 4b–c, see Extended Data Figure 8c–d). This was further supported by ATAC-seq with bisulfite conversion (Figure 4d and Extended Data Figure 9a–b) that validated the CpG enrichment bias of lineage-specific transcription factor binding motifs (Figure 4e and Extended Data Figure 9c, see online methods), showed the expected methylation changes even in open chromatin (Figure 4f–g), and notably, showed a strong correlation between CpG content and the number of hyper- or hypo-methylated CpG sites within transcription factor binding motifs at accessible peaks for Tet2 KO and Dnmt3a KO, respectively (Figure 4h–i and Extended Data Figure 9d–f).
Figure 4. Tet2 KO and Dnmt3a KO promote differential methylation of accessible transcription factor binding sites, favoring CpG rich erythroid motifs.

a) Schematic representation of modulation of transcription factor activity through mutation in Tet2 or Dnmt3a, as a function of the CpG enrichment of the binding motif. Filled circle = methylated CpGs, unfilled circles represent unmethylated CpGs. b) Fold change in transcription factor expression between Ery 1–3 and IMP 1–2 in WT (n = 7 mice) clusters. Erythroid and myelo-monocytic transcription factors with FDR < 0.05 and absolute log2 fold change > 0.3 are highlighted in red and blue, respectively (permutation test followed by Benjamini-Hochberg (BH) correction). Inset: examples of CpG frequency per motif position are shown as grey bars. Mean CpG frequency per base for the motifs are shown as black bars. c) Mean CpG frequency per base of the DNA binding motifs of myelo-monocytic- (n = 8) and erythroid-associated (n = 11) transcription factors (two-sided Students t-test). d) Schematic representation of ATAC-Bseq experimental protocol. e) Mean CpG frequency per base for de novo discovered transcription factor binding motifs in peaks associated with erythroid (n = 20 motifs) or myelo-monocytic (n = 20 motifs) genes (two-sided Students t-test). f) Differential ATAC-Bseq accessibility between WT (n = 2 mice) and Tet2 KO (n = 2 mice) or WT and Dnmt3a KO (n = 2 mice). g) Differential methylation (FDR < 0.05 and absolute methylation difference higher than 5%) at accessible regions for Tet2 KO and Dnmt3a KO mice, as calculated with MethylKit60 (Chi-squared with sliding linear model correction). h) Number of hyper-methylated CpGs (FDR < 0.25 and methylation difference > 5%) for Tet2 KO (n = 104,829 total CpG sites; left panel) or hypo-methylated CpGs (FDR < 0.25 and methylation difference < −5%) for Dnmt3a KO (250,353 total CpG sites; right panel) per 100 motifs in ATAC-Bseq peaks for erythroid, myelo-monocytic or other fates is shown in red, blue and grey, respectively (Pearson correlation; two-sided Students t-test; grey area represents the 95% confidence interval of the linear fit). i) Methylation values of accessible sites containing the DNA binding motif for Tal1 were divided into quartiles, and the distribution for WT (n = 1,669 motifs; n = 2 biologically independent mice), Tet2 KO (n = 880 motifs; n = 2 mice) and Dnmt3a KO (n = 1,226 motifs; n = 2 mice) is shown (two-sided Fisher exact test between first and fourth quartiles).
In further validation of the impact of DNAme on the binding of transcription factor with CpG-rich motifs, single nuclei ATAC-seq (snATAC-seq) demonstrated shifts in transcription factor motif accessibility (Figure 5a–d and Supplementary Figure 1a–f). Consistent with our model, CpG-rich erythroid transcription factor (e.g., Tal1 and Klf1) motifs showed decreased activity in Tet2 KO HSCs relative to WT HSCs, with an opposite effect in Dnmt3a KO HSCs (Figure 5e), while myelo-monocytic transcription factors (e.g., Irf8 and Spi1) were not affected to the same extent (Supplementary Figure 1g–h). In a complementary analysis, de novo motif enrichment in the HSC cluster showed decreased CpG content in motifs enriched in Tet2 KO HSCs compared to Dnmt3a HSC motifs (Figure 5f), supporting a model in which CpG-rich motifs are preferentially affected by mutations in DNAme modifiers.
Figure 5. Single-cell ATAC-seq reveals shifts in motif accessibility.
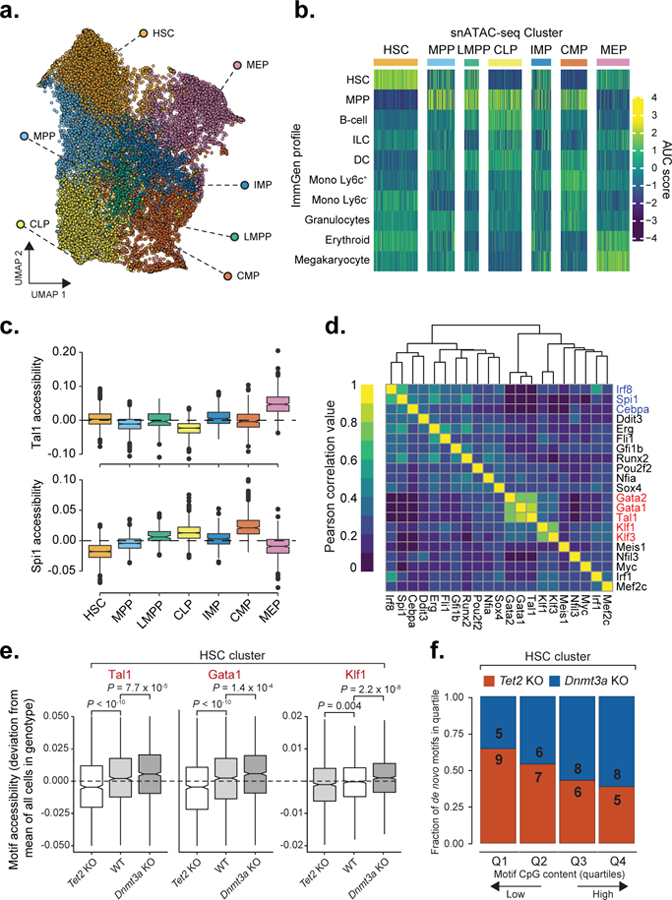
a) Uniform Manifold Approximation and Projection (UMAP) for snATAC-seq data (n = 20,029 cells). HSC = hematopoietic stem cell; MEP = megakaryocyte-erythrocyte progenitor; MPP = multi-potent progenitor; IMP = immature myeloid progenitor; CLP = common lymphoid progenitor; LMPP = lymphoid-primed multi-potent progenitor; CMP = common myeloid progenitor. b) Single cell scores for available bulk ATAC-seq profiles from the ImmGen Database61 of FACS-sorted hematopoietic progenitors (see online methods). c) Single cell motif accessibility deviation scores as a proxy of transcription factor binding activity62 for Tal1 and Spi1 transcription factors for WT (n = 5,810 cells), for each of the defined clusters as calculated by chromVar63 for the DNA binding motifs available from the HOCOMOCO v11 database46. d) Motif accessibility correlation between single cells. Mean accessibility for each transcription factor was calculated using chromVar63, followed by cell-to-cell Pearson correlation of motif accessibility calculated for WT cells from the HSC cluster (n = 1,410 cells) e) Motif accessibility deviation scores comparison between WT (n = 1,410 cells), Tet2 KO (n = 1,173) and Dnmt3a KO (n = 1,305 cells) cells mapped to the HSC cluster (two-sided Wilcoxon rank sum test). f) Mean CpG frequency per base of de novo motifs divided into quartiles based on the CpG content for Tet2 KO (n = 27 motifs) or Dnmt3a KO (n = 27 motifs).
To directly link DNAme changes and transcriptional priming in HSCs, we isolated LT-HSCs (Figure 6a) and performed multi-omics single-cell methylation and scRNA-seq. These data recapitulated the observed changes in our droplet-based scRNA-seq (Figure 2a and Figure 2h), with an increase in HSC-1 and a decrease in Ery-1 and MkP 1–2 mapped LT-HSCs in Tet2 KO compared to Dnmt3a KO (Figure 6b), a decrease in cell cycle in Tet2 KO LT-HSCs (Figure 6c, left panel and Extended Data Figure 10a) and an increase in the expression of the quiescence signature (Figure 6c, right panel). We also observed similar transcriptional priming biases (Figure 6d) and the expected methylation changes at enhancer sites (Figure 6e and Extended Data Figure 10b). Finally, in support of our proposed model, we observed that cells with higher enhancer methylation showed decreased priming towards the erythroid cell fate compared to cells with low enhancer methylation (Figure 6f, Extended Data Figure 10c–d).
Figure 6. Single-cell multi-omics links enhancer methylation and transcriptional priming, and identifies transcriptional priming skews within a human clonal hematopoiesis sample.
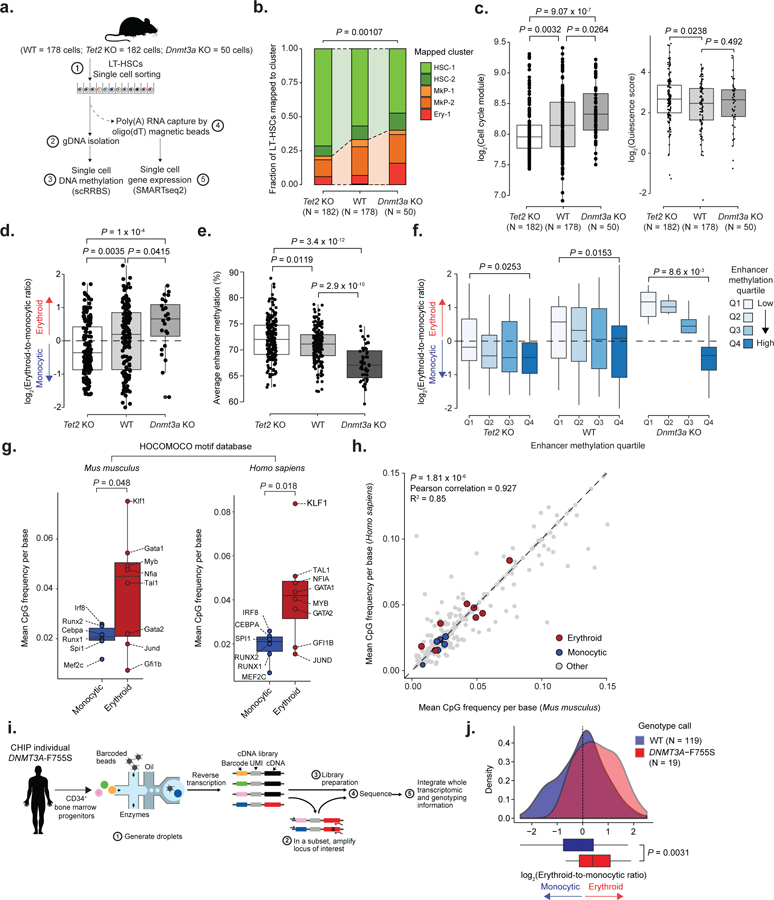
a) Schematic representation of the scRRBS+RNA protocol. b) Frequency of WT (n = 178 cells), Tet2 KO (n = 182 cells) and Dnmt3a KO (n = 50 cells) LT-HSCs mapped by maximum likelihood to the clusters shown in Figure 1b (two-sided Fisher exact test). c) Left panel: Cell cycle analysis of scRNA-seq data for LT-HSCs, comparing WT (n = 178 cells), Tet2 KO (n = 182 cells) and Dnmt3a KO (n = 50 cells) progenitors (two-sided Wilcoxon rank sum test). Right panel: Quiescence score for WT, Tet2 KO and Dnmt3a KO LT-HSCs (two-sided Wilcoxon rank sum test). d) Transcriptional priming scores for WT (n = 178 cells), Tet2 KO (n = 182 cells) and Dnmt3a KO (n =50 cells) LT-HSCs (two-sided Wilcoxon rank sum test). e) Single cell average enhancer methylation for WT (n = 178 cells), Tet2 KO (n = 182 cells) and Dnmt3a KO (N =50 cells) LT-HSCs (two-sided Wilcoxon rank sum test). f) Transcriptional priming scores per average enhancer methylation quartile for WT (n = 178 cells), Tet2 KO (n = 182 cells) and Dnmt3a KO (N =50 cells) progenitors (first quartile vs. fourth quartile; two-sided Wilcoxon rank sum test). g) Mean CpG frequency per base for either Mus musculus or Homo sapiens transcription factor binding motifs (n = 335 motifs) extracted from the HOCOMOCO v1146 database (two-sided Students t-test). h) Mean CpG frequency per base correlation between Mus musculus and Homo sapiens transcription factor binding motifs (Pearson correlation). i) Schematic representation of the procedure to link single cell genotypes to scRNA-seq profiles. j) Intra-sample transcriptional priming for the clonal hematopoiesis sample, comparing WT and DNMT3A-F755S CD34+ bone marrow progenitor cells (two-sided Students t-test).
The CpG content of the motifs of interest were similar in human transcription factor motifs46 (Figure 6g–h). To directly explore changes in transcriptional priming of human hematopoietic progenitors, we performed scRNA-seq on CD34+ bone marrow cells from an individual with clonal hematopoiesis (Figure 6i and Extended Data Figure 10e–h) driven by DNMT3A mutation. Consistent with the findings in Dnmt3a KO mice, the DNMT3A-mutant CD34+ clonal hematopoiesis sample showed increased frequency of GATA1+ erythroid progenitors compared to previously published normal CD34+ cells7 (Extended Data Figure 10i). We further applied our recently developed Genotyping of Transcriptomes (GoT) protocol47, enabling direct linkage of genotypes to scRNA-seq profiles (Figure 6i), and found that DNMT3A mutated CD34+ cells showed an increase in erythroid and decrease in monocytic transcriptional priming compared with WT CD34+ cells from the same individual (Figure 6j).
In summary, Tet2 KO mice showed expansion of early HSCs marked by Hlf, Sox4 and Meis1 expression, consistent with a cell-intrinsic contribution to Tet2 KO related self-renewal48. Tet2 KO HSC quiescence may be in part mediated by increased susceptibility to hypermethylation of Myc and Myb, due to their CpG-rich binding motifs, as these transcription factors have been shown to promote increased cell cycle activity and asymmetric cell divisions49,50. We also observed deterministic skews in committed progenitor frequencies, mainly along the erythroid vs. myelo-monocytic bifurcation, which has been recently described as a critical fork in HSC differentiation51. This is consistent with human clonal hematopoiesis data that show modest but significant monocytosis even when the mutant TET2 allele is present at low frequency24, which may underlie the associated cardiovascular risk24. In contrast, DNMT3A loss is associated with opposite biases, which was also observed in a human clonal hematopoiesis sample with mutated DNMT3A. Notably, we find these biases originate from skews in HSC transcriptional priming.
Nevertheless, DNAme modifier mutations result in only modest DNAme changes that are distributed across the genome52. To reconcile stochastic, global DNAme changes and deterministic skews to cell fate choices, we suggest a potential mechanism – differential CpG enrichment in DNA binding motifs confers varying sensitivity to methylation changes of lineage-defining transcription factors. We anticipate that this model will be further refined by emerging data on DNMT binding preferences53, and additional precision on the impact of DNAme on transcription factor binding15,54, which may help identify the transcription factors most implicated in clonal hematopoiesis phenotypes.
Thus, DNAme shapes the hematopoietic differentiation topography (Figure 3h). Indeed, somatic mutations in these modifiers are highly over-represented in hematological malignancies55, suggesting an important regulatory role for DNAme in the context of hematopoiesis. We may speculate that the less spatially structured hematopoietic differentiation process does not benefit to the same degree from environmental cues compared to well-organized epithelial tissues56, thus requiring efficient cell-intrinsic encoding throughout differentiation, such as that afforded by DNAme. Therefore, the study of DNAme in relation to hematopoietic differentiation will inform the understanding of topological encoding of HSC differentiation as well as the interrogation of the emerging challenge of human clonal hematopoiesis, to chart the critical switches that fuel clonal expansions.
Online methods
Mouse Models
All animals were housed at Memorial Sloan Kettering Cancer Center (MSKCC). All animal procedures were completed in accordance with the Guidelines for the Care and Use of Laboratory Animals and were approved by the Institutional Animal Care and Use Committees at MSKCC. Tet2fl/fl [64], Dnmt3afl/fl [65], and Idh2R140Q/WT [66] conditional alleles have been described previously, and were crossed to the Mx1-Cre transgenic mice67.
Peripheral blood analysis
Blood was collected by submandibular bleeding using heparinized microhematocrit capillary tubes (Thermo Fisher Scientific, Waltham, MA). Automated peripheral blood counts were obtained using a ProCyte Dx Hematology Analyzer (IDEXX, Westbrook, ME).
Isolation of lineage-negative bone marrow cells for single-cell analysis
To induce recombination of the conditional alleles, 16–20 week-old male Mx1-Cre, Mx1-Cre Tet2fl/fl, Mx1-Cre Dnmt3afl/fl and Mx1-Cre Idh2R140Q/WT mice were treated with three doses of polyinosinic-polycytadylic acid (pIpC; 12 mg/kg/day; GE Healthcare, Chicago, IL) every other day via intra-peritoneal injection. Primary mouse bone marrow (BM) cells were isolated into cold phosphate-buffered saline (PBS), without Ca2+ and Mg2+, and supplemented with 2% bovine serum albumin (BSA) to generate single cell suspensions. Red blood cells (RBCs) were removed using ammonium chloride-potassium bicarbonate (ACK) lysis buffer, resuspended in PBS/2% BSA, and filtered through a 40μm cell strainer. Total nucleated cells were quantified by Vi-Cell XR cell counter (Beckman Coulter, Brea, CA). BM cells were harvested from the legs (femora and tibiae) and hip bones, and lineage depletion was performed with biotin-conjugated antibodies against B220 (RA3–6B2), CD19 (1D3), CD3 (17A2), CD4 (GK1.5), CD8a (53–6.7), CD11c (N418), CD11b (M1/70), Gr-1 (RB6–8C5), NK1.1 (PK136) and Ter119, labeled with anti-biotin MicroBeads (130–090-485; Miltenyi Biotec, Bergisch Gladbach, Germany), and lineage-negative (Lin−) cells were magnetically separated using MACS columns according to the manufacturer’s instructions (Miltenyi Biotec, Bergisch Gladbach, Germany). Cells were then stained with streptavidin-conjugated secondary antibody, and live (DAPI-negative) lineage-negative cells were purified by flow cytometry on a BD Aria (BD Bioscience, San Jose, CA) and subjected to single-cell analysis.
Flow cytometry analyses
BM cells were incubated with antibodies in PBS/2% BSA (without Ca2+ and Mg2+) for 45 min on ice. For hematopoietic stem and progenitor cell analysis from adult mouse bone marrow, cells were stained with a lineage cocktail of monoclonal antibodies including B220 (RA3–6B2), CD19 (1D3), CD3 (17A2), CD4 (GK1.5), CD8a (53–6.7), CD11c (N418), CD11b (M1/70), Gr-1 (RB6–8C5), NK1.1 (PK136) and Ter119, allowing for mature lineage exclusion from the analysis. Cells were also stained with antibodies against c-Kit (2B8), Sca-1 (D7), FcγRII/III (93), CD34 (RAM34), CD48 (HM48–1) and CD150 (9D1). DAPI was used to exclude dead cells. The composition of mature hematopoietic cell lineages in the bone marrow was assessed using a combination of antibodies against B220, CD19, CD3, CD4, CD8a, Mac1/CD11b, Gr-1, Ly6C (HK1.4), Ly6G (1A8), MHC-II (I-A/I-E), CD115 (AFS98), Ter119. For cell cycle analysis on bone marrow LT-HSCs populations, Ki67-FITC Flow Kit was following manufacture instructions (Cat#556026; BD Pharmingen, San Jose, CA). FACS analysis was performed on an LSR Fortessa (BD Biosciences, San Jose, CA). Data analysis was performed using the FlowJo software.
In vitro differentiation assays
For in vitro colony forming assays, 25,000 nucleated BM cells from each genotype were plated in duplicates in cytokine-supplemented methylcellulose medium supplemented with mSCF, mIL3, hIL6, and hEPO (MethoCult™ GF M3434; StemCell Technologies, Vancouver, Canada). Colonies were enumerated 10–14 days later, and 25,000 cells were serially re-plated for two more passages in duplicates. For detection of clonogenic BM erythroid progenitors, 50,000 nucleated BM cells from each genotype were plated in duplicates in serum-free methylcellulose medium supplemented with human transferrin and hEPO (MethoCult™ SF M3436; StemCell Technologies, Vancouver, Canada), and colonies were enumerated 7–10 days later. To functionally assess lineage priming skews at the level of phenotypically-defined long-term hematopoietic stem cells (LT-HSCs), mouse bone marrow LT-HSCs (Lin− Sca1+ c-Kit+ CD150+ CD48−) were purified by flow cytometry and subjected to differentiation in methylcellulose medium supplemented with mSCF, mIL3, hIL6, and hEPO (MethoCult™ GF M3434; StemCell Technologies, Vancouver, Canada), and colonies were scored and enumerated 10–14 days later.
Drop-seq data generation and sequencing analysis pipeline
Single-cell transcriptomic profiles were generated using Drop-seq, a technology designed for highly parallel genome-wide expression profiling of individual cells using nanoliter droplets, as previously described68. In brief, single-cell suspensions and uniquely barcoded beads were co-localized in droplets using a microfluidics device (see CAD file from http://mccarrolllab.com/dropseq/, manufactured by FlowJEM, Toronto, Canada). The droplets are composed of cell-lysis buffer and serve as compartmentalizing chambers for RNA capture. Flow rates were adjusted to maintain stable droplet formation and increase droplet homogeneity. We then adjusted cell and bead concentrations to accommodate variation in droplet size compared to the original publication68 (113 μm in our system). Doublet rate was estimated with the species-mixing experiment described previously68. Examination of cells showed complete lysis within the time required for examination by microscopy (less than 1 min), notably shorter than the time cells spend in droplets during lysis and mRNA capture.
Droplet breakage and single-cell library preparations followed the procedure as described68. In brief, collected droplets were disrupted and RNA-hybridized beads were extracted. Reverse transcription was performed with template switching to allow for cDNA amplification by PCR. An additional pre-PCR step was added to determine the appropriate number of cycles (17–19 cycles) to achieve a cDNA library at a concentration of 400–1,000 μg μl−1, as suggested by the protocol. cDNA samples were purified using Agencourt AMPure XP (Beckman Coulter, Brea, CA), and were run on a 2100 BioAnalyzer instrument with a High Sensitivity DNA kit (Agilent Technologies, Santa Clara, CA). Samples were prepared for sequencing using the Illumina Nextera XT kit, and sequenced on a NextSeq 500 (Illumina, San Diego, CA) at an average of 70,000 reads per cell. Libraries with large numbers of cells were divided into technical replicates, which were processed independently. Raw reads were processed and aligned (STAR aligner69) using the standard Drop-seq pipeline, and according to the ‘Drop-seq Alignment Cookbook’, both found at http://mccarrolllab.com/dropseq/. Reads were aligned to the mm10 transcriptome. For each read, a single optimal mapping position was retained. Unique transcripts mapping to alternative splice variants were combined for subsequent analysis. Single-cell expression matrices were generated using cellular barcodes and unique molecular identifiers (UMIs). Cells with UMI < 200 or mitochondrial gene percentage > 20% were filtered out. To ensure even exclusion of mature erythroid cells across experiments, and additional filter of barcodes containing > 1% hemoglobin expression was applied. After filtering, we obtained a total of 22,041 cells across conditions, with 2,127 ± 43.71 UMIs and 1,130 ± 27.29 genes detected per cell.
Chromium 10x single cell RNA-seq data processing
Single cell RNA sequencing data generated with Chromium 10x v2 was processed using Cell Ranger (v2.1.0) with default parameters, and data generated with Chromium v3 was processed using the updated version of Cell Ranger (v3.1). For both chemistry versions, samples were sequenced at an average of 50,000 reads per cell. Raw sequencing data was de-multiplexed and post-processed following the custom pipelines provided by 10x Genomics. Briefly, raw base calls were de-multiplexed into fastq files using the cellranger mkfastq command, followed by alignment to the selected reference mm10 genome for mouse samples or hg19 genome for the human subject data, respectively. Barcode and UMI counting was performed using the cellranger count command with default parameters. Cell barcodes with UMI < 1,000 or mitochondrial gene percentage > 20% were filtered out. Low complexity cell barcodes with number of genes detected lower than expected (lower than two standard deviations from linear fit, Extended Data Figure 1b) were filtered out. To ensure even exclusion of mature erythroid cells across experiments, and additional filter of barcodes containing > 1% hemoglobin expression was applied. After filtering, we obtained a total of 31,440 cells from Chromium v2 and 12,212 cells from Chromium v3 experiments. Cells show 10,021 ± 79.21 (mean ± SEM) UMIs per cell and an average of 2,466 ± 32.12 (mean ± SEM) genes detected across all cells.
Single cell RNA-seq data integration and clustering
In order to account for technical variations across Drop-seq, Chromium v2 and Chromium v3 platforms, data normalization, integration and clustering was performed using the Seurat package (v3.1.0). Filtered count matrices were normalized using the SCTransform command, which implements regularized negative binomial regression for normalization and variance stabilization70. After normalization, 3,000 integration anchors across technologies were defined using the FindIntegrationAnchors function, with the cells from Chromium v2 (n = 32,995) used as reference dataset. Once the integration anchors were defined, data integration was performed using the IntegrateData function, setting normalization.method = “SCT”. Once data was successfully integrated, we performed principal component analysis (PCA) by running the RunPCA function with default parameters. The first 30 principal components were used to define the cell clusters, by first running the FindNeighbors function with reduction = “pca” and dims = 1:30 followed by FindClusters with resolution = 1. For visualization, a UMAP cell embedding was generated using the RunUMAP function with the following parameters: reduction = “pca”, dims = 1:30. Cluster labels were manually assigned and curated based on expressed genes previously reported by Paul et al32 and Giladi et al51. Joint embedding of cells within each cell cluster across the different scRNA-seq platforms was confirmed (Extended Data Figure 3a). The consistency of gene expression for cells assigned to the same cluster between technologies was evaluated through pseudo-bulk of the single cell count matrix followed by gene expression correlation. Briefly, for a given cell cluster and for each of the technologies used, the total number of UMIs mapped to each gene was calculated, followed by normalization by the total number of UMIs in the cluster and multiplied by 10,000 to obtain the number of molecules per 10,000 UMIs for each gene. Next, linear regression between each pair of technologies was performed, and R2 value for each cluster for each pair of technologies used was calculated (Extended Data Figure 3b). Cluster identities were further verified by gene expression correlation with the Mouse Cell Atlas71 dataset using the single cell Mouse Cell Atlas (scMCA) function72 (Extended Data Figure 3c).
For integration of the human data, a similar approach was used. Briefly, single cell transform70 was applied for normalization of cell counts, followed by selection of 3,000 integration features. Integration anchors were defined using the FindIntegrationAnchors function with default parameters. Data was integrated by using the IntegrateData function with the normalization.method parameter set to “SCT”. Principal component analysis was performed using the function with default parameters, and 30 principal components were retained for downstream analysis. Dimensionality reduction was performed with the RunUMAP function, and clustering was performed by using FindNeighbors function with the following parameters: reduction = “pca” and dims = 1:30, followed by the FindClusters function with resolution = 1.
Statistics and Reproducibility
In order to perform statistical comparisons of cluster frequencies between genotypes, we implemented linear mixture models (LMM) using the lme4 R package (v1.1–21), similar to our previous approach47. This allowed including random effects to account for technical variation73. We included both experimental batch and technology as random effects in our statistical comparisons. The P-values were calculated by analysis of variance (ANOVA) with likelihood ratio test using the Stats R package (v3.5.2) between two LMMs: the first one taking into account the variables of interest, and the second one removing the genotype as independent variable:
Relevant statistics for this test are presented in Supplementary Table 5.
For all boxplots presented, the box represents the interquartile range; upper and lower whiskers represent the largest and smallest values within 1.5 times interquartile range above the 75th or below the 25th percentile, respectively; the central line represents the median. Dots represent outlier values or data value distributions. For all violin plots presented, the violin represent the kernel probability density of the data, dots represent the observed values.
Gene modules
Gene module discovery:
In order to identify sets of highly co-expressed genes within HSCs (HSC 1–3), we selected WT HSCs only to prevent confounding factors derived from altered gene expression in the KO mouse models. Chromium data was used for increased depth. Similarly to Martin et al74, UMI counts were downsampled to 2,000 total UMIs per cell to ensure homogeneous per-cell coverage. In order to minimize the contribution of sample-specific noise, the gene-to-gene Pearson correlation matrix was calculated separately for each individual biological replicate and z-transformation was performed followed by averaging of the transformed matrices. The correlation coefficients were then used for hierarchical clustering of the genes, allowing a total of 30 modules containing a minimum of 10 genes. A minimum correlation value of 0.1 between sample-specific modules was required.
Gene module score per cell:
Once the modules were obtained, the per-cell score for each of the defined modules was calculated as the fraction of UMIs mapping to the gene set, multiplied by a factor of 10,000 to obtain the molecules per 10,000 UMIs mapping to the genes comprised by the module.
Transcriptional priming calculation:
Transcriptional priming was defined as the log2 ratio between erythroid and monocytic gene modules. In order to normalize the distributions of module scores, we first implemented quantile normalization of the module score distributions, followed by taking the log2 ratio of quantile-normalized erythroid and monocytic scores for each single cell. Of note, reduction in the expression of genes related to the lymphoid fate (e.g., Dntt, Figure 2a, middle panel) was also observed. This finding is consistent with previous data showing that enhancer DNA de-methylation is required for proper B-cell differentiation, and that lack of Tet1 or Tet2 expression impairs B-cell differentiation by preventing lineage-specific de-methylation events75. The observed down-regulation of Dntt in HSC clusters of Tet2 KO mice potentially reflects a decrease in lymphoid transcriptional priming. Notably, monocytic and lymphoid priming were shown to be correlated in HSCs in normal hematopoiesis51 and therefore, our data suggest a decoupling of these priming effects in Tet2 KO mice, also manifested in a decrease in common lymphoid progenitor (CLP) cluster frequencies (P = 6.53 x 10⁻⁵, linear mixed model followed by ANOVA, Figure 2a).
SELEX and regulon analysis:
To correlate the expression of transcription factor target genes with their methylation preference and CpG content, we implemented the SCENIC algorithm76 (v1.0) on WT HSC clusters with default settings to identify sets of target genes for each transcription factor (“regulons”). We next obtained the available SELEX data15 and computed the product of the mean CpG content per base and the SELEX enrichment score, obtaining a composite score reflecting both the CpG content and the methylation preference for each transcription factor. We focused on those transcription factors negatively impacted by methylation of their DNA binding site, since Tet2 KO induced hyper-methylation would likely result in disruption of regulon activity, and computed the Pearson correlation between the composite score and the regulon activity.
Differential expression analysis
In order to perform differential gene expression analysis for the HSC clusters between genotypes, we tested for differential expression between cells in HSCs cluster from mice with the genotype of interest (e.g., Tet2 KO) compared with cell in HSCs clusters from mice in WT mice. As in Martin et al74, first, we calculated the observed log-fold-change between the two groups of cells for each gene. We then randomly permuted the cells of the two groups 106 times while maintaining the sizes of the sets and recalculating the log-fold-change for each permutation. The empirical P-value was then defined based on the rank of the difference observed between the log-fold-change of each gene with its empirical fold-change distribution. The reported P-values were FDR-adjusted by the Benjamini-Hochberg method.
For calculating differential gene expression within cluster families (e.g., across HSCs or across monocyte clusters, as in Extended Data Figure 4a and Extended Data Figure 4g), the clusters of interest were selected and the FindMarkers function from Seurat (v 3.1.0) was used, with the following parameters: log.fc.threshold = 0.25; min.pc = 0.2; only.pos = F and test.use = “LR”. P-values were adjusted by the Bonferroni method. Cell cycle and quiescence scores were calculated by measuring UMIs mapping to each gene set per 10,000 UMIs for each cell.
Single cell reduced representation bisulfite plus RNA sequencing library construction
Data generation:
Single cells were sorted by flow cytometry into 2.5 μL of RLT Plus buffer (Qiagen, Venlo, Netherlands) supplemented with 1 U/μL of RNase Inhibitor (Lucigen, Middleton, WI). Sorted cells were immediately store at −80°C. Genomic DNA and mRNA have been separated manually as previously described77. Single-cell complementary DNA was amplified from the tubes containing the captured mRNA according to the Smart2-seq protocol78. After amplification and purification using 0.8X SPRI beads, 0.5ng cDNA was used for Nextera Tagmentation and library construction. Library quality and quantity was respectively assessed using Agilent Bioanalyzer 2100 and Qubit. Genomic DNA present in the pooled supernatant and wash buffer from the mRNA isolation step was precipitated on 0.8X SPRI beads and eluted directly into the reaction mixtures for Msp1 and HaeIII (Fermentas, Waltham, MA) enzymatic reaction (10μL final reaction). MscRRBS protocol is then performed on the digested gDNA after the restriction enzyme double digestion step.
scRRBS analysis pipeline:
Each pool of 96 cells was first demultiplexed by Illumina i7 barcodes, resulting in four pools of 24 cells. Each pool of 24 cells was further demultiplexed by unique cell barcodes. Reads were assigned to a given cell if they matched 80% of the template adapters. Adapters and adapter reverse complements (6 bp) were trimmed from the raw sequence reads. After adapter removal, reads were trimmed from their 3’ end for read quality by applying a 4 bp sliding window and removing bases until the mean base quality of the window had a Phred quality score greater than 15. We aligned trimmed reads in single-end mode to the mm10 mouse genome assembly using Bismark79 (v.0.14.5; parameters: -multicore 4 -X 1000 --un –ambiguous) running on bowtie2–2.2.8 aligner80. Bismark methylation extractor (--bedgraph --comprehensive) was used to determine the methylation state of each individual CpG. For downstream analyses, a site was considered methylated or unmethylated only if there was 90% agreement of the methylation state for all reads mapped to the site. Mean mapping efficiency was 71.6% with a median of 3,797,027 reads per cell. To remove technical methylation variation due to the addition of unmethylated bases during the end repair step of library construction, 5bp from the 5’ of read 1 were trimmed. Measurement of single cell methylation levels at promoter, enhancer, CpG island, exon or intron genomic regions was performed taking into account only CpG sites covered in at least 3 WT cells, 3 Tet2 KO and 3 Dnmt3a KO cells, to minimize technical variation between datasets due to differences in profiled CpGs due to variation in the restriction enzyme cutting efficiency.
scRNA-seq pipeline:
the sequenced paired-end read fragments were mapped against the mm10 mouse genome assembly using the 2pass default mode of STAR69 (v2.5.2a) with the annotation of GENCODE81 (v19). The number of read counts overlapping with annotated genes was quantified applying the ‘GeneCounts’ option in the STAR alignment. Maximum likelihood projection was performed by generating a gene expression model for each of the clusters defined in our Chromium 10x and Drop-seq scRNA-seq data as described above, by taking the fraction of UMIs mapping to a gene as compared to the total UMIs detected for the cluster. We then calculated the log likelihood for each cell in our dataset to map to each of the gene expression models for the clusters. Each cell was then assigned to the cluster showing the highest log likelihood value.
Extended Data
Extended Data Fig. 1. Chromium 10x data summary.

a) Summary of Chromium 10x data (pIpC = polyinosinic-polycytadylic acid). b) Number of genes detected as a function of the number of unique molecular identifiers (UMIs) per cell barcode. Red dots = cell barcodes with mitochondrial content > 20%; blue dots = cell barcode with lower than expected complexity (lower than two standard deviations from linear fit); dashed red line = linear fit. c) Percentage of cell barcodes removed per sample after filtering low complexity barcodes and barcodes with mitochondrial UMIs > 20%. d) Quality control of scRNA-seq (n = 13 biological independent animals) after filtering. e) PCR validation of Tet2 exon 3 deletion 4 weeks after pIpC administration. Genomic DNA was isolated from Lin− bone marrow cells and amplified using the primers Tet2-F1, Tet2-R1 or Tet2-R-Lox, (Supplementary Table 5). One representative example of n = 3 independent experiments is shown. f) PCR validation of Dnmt3a exon 17 and 18 deletion 4 weeks after pIpC administration. Genomic DNA was isolated from Lin− bone marrow cells and amplified using the primers Dnmt3a-F1, Dnmt3a-R1 or Dnmt3a-R-Lox, shown in Supplementary Table 5. One representative example of n = 3 independent experiments is shown. g) Uniform Manifold Approximation and Projection (UMAP) dimensionality reduction showing joint embedding of WT (17,702 cells; n = 7 mice), Tet2 KO (18,651 cells; n = 7 mice), Dnmt3a KO (13,858 cells, n = 4 mice) and Idh2-R140Q (9,883 cells, n = 3 mice).
Extended Data Fig. 2. Drop-seq data summary.
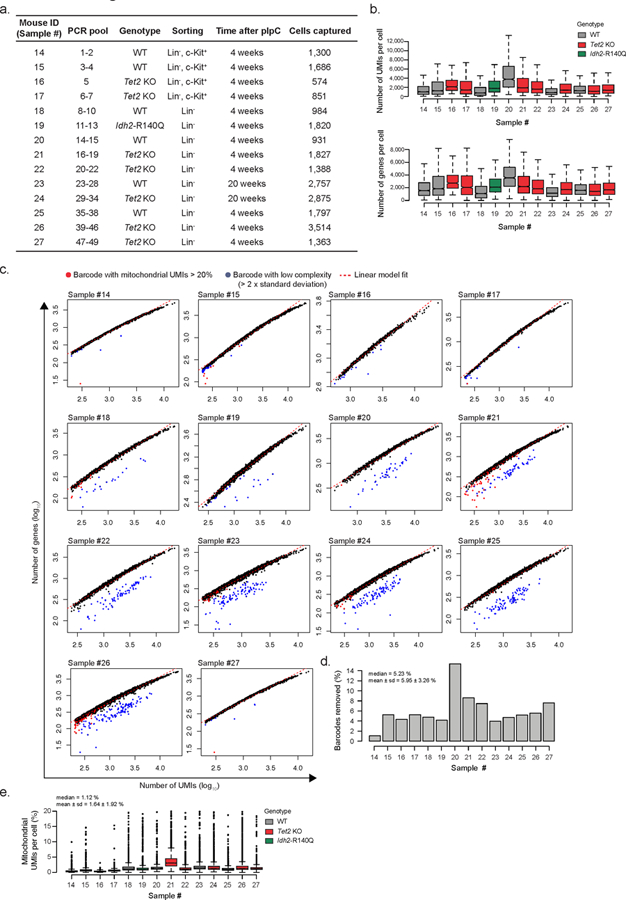
a) Summary of Drop-seq data showing PCR pool, genotype, sorting strategy, time after recombination (n = 14 biologically independent animals) and number of cells captured after filtering (pIpC = polyinosinic-polycytadylic acid). b) Number of unique molecular identifiers (UMIs) and genes detected per cell barcode per sample. c) Overview of number of genes detected as a function of the number of UMIs per cell barcode. Red dots = cell barcodes with mitochondrial content > 20%; blue dots = cell barcode with lower than expected complexity (lower than two standard deviations from linear fit); dashed red line = linear fit. d) Percentage of cell barcodes removed per sample (n = 14 biologically independent animals) after filtering out low complexity barcodes and barcodes with mitochondrial UMIs > 20%. e) Percentage of mitochondrial UMIs per cell per sample (n = 14 biologically independent animals) after filtering.
Extended Data Fig. 3. Quality control of joint embedding across single cell technologies.
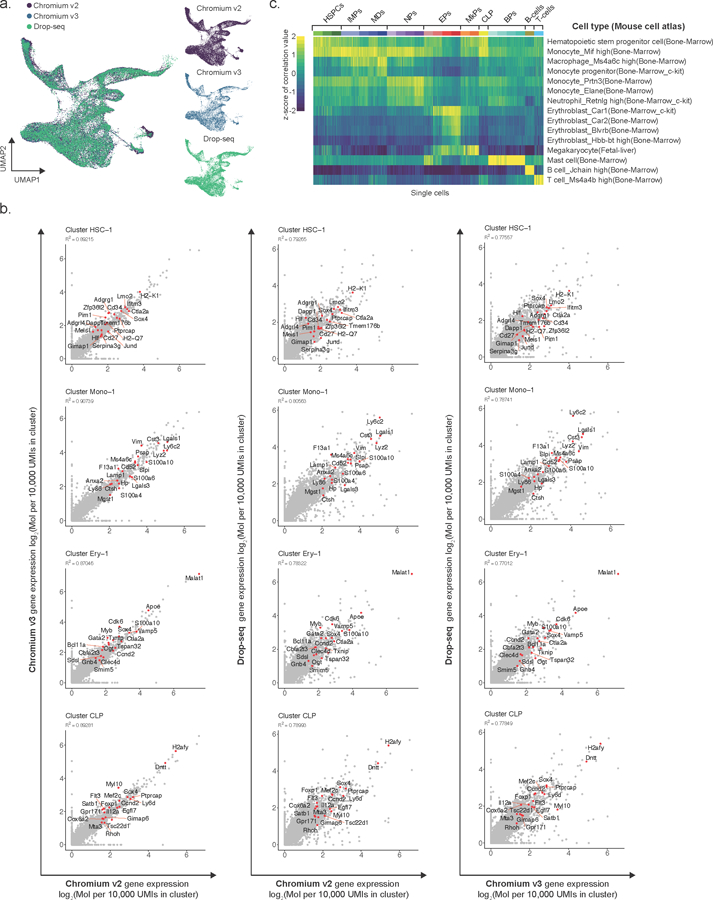
a) Left panel: Uniform Manifold Approximation and Projection (UMAP) dimensionality reduction showing joint embedding of WT (17,702 cells; n = 7 mice), Tet2 KO (18,651 cells; n = 7 mice), Dnmt3a KO (13,858 cells, n = 4 mice) and Idh2-R140Q (9,883 cells, n = 3 mice) lineage-negative hematopoietic progenitors. Right panels: UMAP embedding obtained for each scRNA-seq method is shown separately. b) Gene expression correlation between cells obtained by different scRNA-seq methods (Chromium v2, Chromium v3 and Drop-seq) that were mapped to the same cell cluster. The gene expression frequency was calculated as the number of unique molecular identifiers (UMIs) mapping to a given gene relative to the total number of UMIs detected for a given cluster, and multiplied by a factor of 105. The log2 of the pseudo-bulk gene expression is shown (R2 values were obtained from Pearson correlation; red dots highlight the top gene markers for each cluster). c) Gene expression correlation between WT cells and expression profiles from the Mouse Cell Atlas64 dataset, as obtained by scMCA65 (see online methods).
Extended Data Fig. 4. Cluster annotation, supporting evidence for HSC self-renewal and Lineage-negative, c-Kit+ cells validation in Tet2 KO.
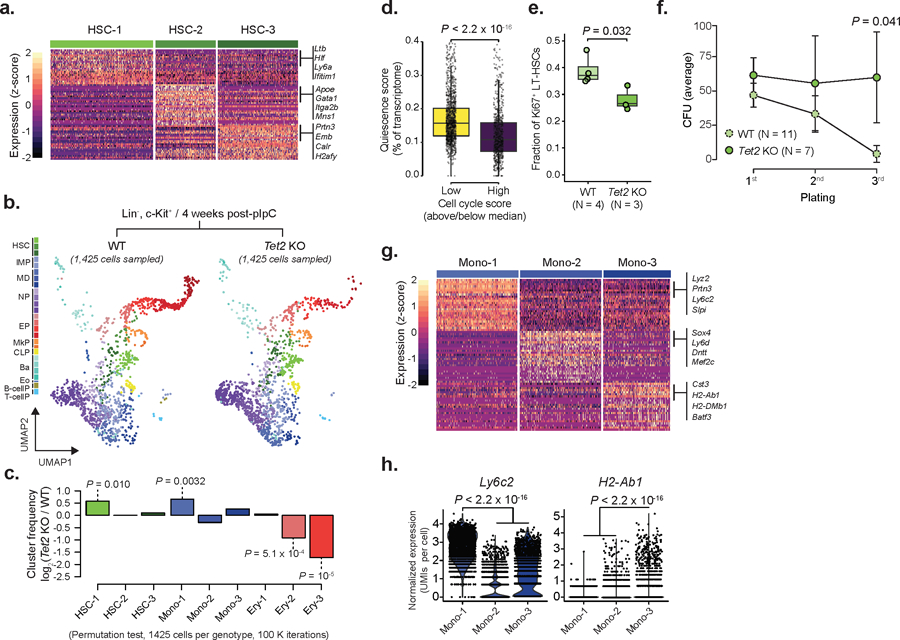
a) Differentially expressed genes for WT cluster HSC-1 (492 cells), HSC-2 (288 cells) or HSC-3 (384 cells), relative to the remaining HSC clusters from Chromium data (n = 4 mice; logistic regression with Bonferroni correction; FDR < 0.05). b) Drop-seq data for Lin−, c-Kit positive cells for WT (2,986 cells, n = 2 mice) or Tet2 KO (1,425 cells, n = 2 mice) progenitors 4 weeks after recombination (HSCs = Hematopoietic stem cells; IMP = Immature myeloid progenitors; MD = Monocytic-dendritic progenitors; NP = Neutrophil progenitors; EP = Erythroid progenitors; MkP = Megakaryocyte progenitors; CLP = Common lymphoid progenitors; Ba = Basophil progenitors; Eo = Eosinophil progenitors; B-cellP = B-cell progenitors; T-cellP = T-cell progenitors). c) Frequency changes for HSCs, MDs and EPs 4 weeks after recombination (Permutation test on 1,425 randomly sampled cells from each genotype, with 105 iterations). d) Quiescence score per cell cycle category (above/below median) in WT HSCs (n = 1,982 cells; two-sided Wilcoxon rank sum test). e) Flow cytometry of cell cycle in LT-HSCs as measured by Mki67 expression for WT (n = 4 mice) or Tet2 KO (n = 3 mice) 4 weeks after recombination (two-sided Student t-test). f) Serial re-plating colony-formation assays for WT (n = 11) and Tet2 KO (n = 7) Lin−, c-Kit+ bone marrow hematopoietic (CFU = colony formation unit; dots represent the mean; error bars represent standard deviation; two-sided Students t-test). g) Differentially expressed genes per WT cluster Mono-1 (n = 344 cells), Mono-2 (n = 345 cells) or Mono-3 (n = 284 cells), relative to the remaining monocyte clusters. Differentially expressed genes were defined from Chromium data (n = 4 mice; logistic regression with Bonferroni correction; FDR < 0.05). h) Expression of Ly6c2 and H2-Ab1 in WT Mono-1 (n = 344 cells), Mono-2 (n = 345 cells) and Mono-3 (n = 284 cells) clusters (logistic regression with Bonferroni correction).
Extended Data Fig. 5. Flow cytometry validation, peripheral blood counts, in vitro colony-forming assay and 20 weeks post pIpC validations of Tet2 KO frequency changes.
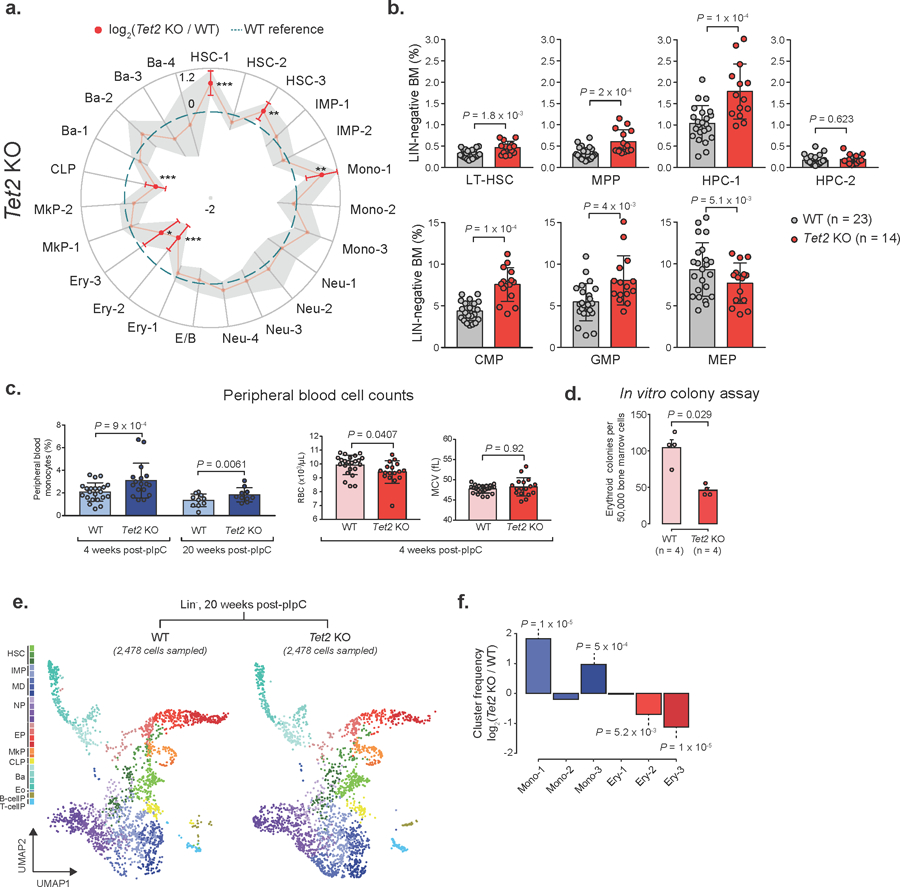
a) Frequency changes for Lin− Tet2 KO (18,651 cells, n = 7 mice) relative to WT (17,702 cells, n = 7 mice) 4 weeks after recombination. Red dots indicate significant frequency changes; red error bars represent standard deviation; dashed line indicates WT reference frequencies; grey shadow region indicates +/− standard deviation (LMM followed by ANOVA; * P < 0.05; ** P < 0.01; *** P < 0.001). b) Flow cytometry for WT (n = 15) and Tet2 KO (n = 23) mice 4 weeks after recombination (two-sided Students t-test; bars represent the mean value, error bars represent the standard deviation; LT-HSC = long-term hematopoietic stem cell; MPP = Multi-potent progenitor; HPC = Hematopoietic progenitor cell; CMP = common myeloid progenitor; GMP = Granulocyte-monocyte progenitor; MEP = megakaryocyte-erythrocyte progenitor). c) Peripheral blood cell counts from WT (n = 10) or Tet2 KO (n = 10) mice, either 4 or 20 weeks after Cre-mediated recombination (two-sided Students t-test; bars represent the mean and error bars represent the standard deviation. Each dot represents a mouse replicate; RBC = red blood cells; MCV = mean corpuscular volume). d) Erythroid colony-forming assay for WT (n = 4) or Tet2 KO (n = 4) mice, 4 weeks after recombination (two-sided Student t-test; bars represent the mean number of colonies for each genotype; error bars represent standard deviation). e) Drop-seq data showing 2,478 randomly sampled cells from Lin− cells for WT (2,757 cells) or Tet2 KO (2,875 cells) 20 weeks after recombination (HSCs = Hematopoietic stem cells; IMP = Immature myeloid progenitors; MD = Monocytic-dendritic progenitors; NP = Neutrophil progenitors; EP = Erythroid progenitors; MkP = Megakaryocyte progenitors; CLP = Common lymphoid progenitors; Ba = Basophil progenitors; Eo = Eosinophil progenitors; B-cellP = B-cell progenitors; T-cellP = T-cell progenitors). f) Frequency changes for monocyte (Mono 1–3) and erythroid (Ery 1–3) progenitor clusters (permutation test).
Extended Data Fig. 6. Validation of cell cluster frequency changes in Idh2-R140Q mutant mice and Dnmt3a KO mice.
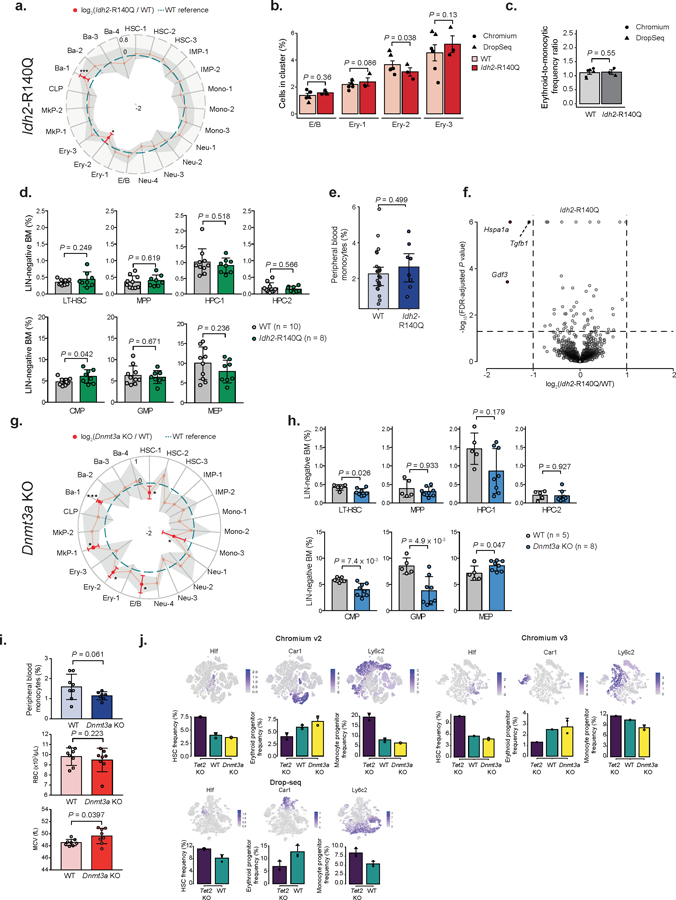
a) Frequency changes for Lin− Idh2-R140Q (n = 3) relative to WT (n = 6) mice 4 weeks post-recombination (linear mixed model (LMM) followed by ANOVA; *P < 0.05; ***P < 0.01). b) E/B and Ery 1–3 frequencies 4 weeks after recombination for WT (n = 6) and Idh2-R140Q (n = 3) mice. Error bars represent standard error of the mean (SEM; LMM followed by ANOVA). c) Ratio between erythroid (E/B, Ery-1 and ERy-2) and monocytic (IMP-1 and Mono-1) clusters for WT (n = 6) and Idh2-R140Q (n = 3) mice 4 weeks post-recombination. Error bars indicate SEM (LMM followed by ANOVA). d) Flow cytometry of hematopoietic progenitors from WT (n = 10) and Idh2-R140Q (n = 8) mice 4 weeks post-recombination (two-sided Students t-test; LT-HSC = long-term hematopoietic stem cell; MPP = Multi-potent progenitor; HPC = Hematopoietic progenitor cell; CMP = common myeloid progenitor; GMP = Granulocyte-monocyte progenitor; MEP = megakaryocyte-erythrocyte progenitor). e) Peripheral blood monocytes for WT (n = 22) or Idh2-R140Q (n = 8) mice 4 weeks post-recombination (two-sided Students t-test). f) Differential gene expression between WT (n = 2,150 cells) and Idh2-R140Q (n = 1,184 cells) HSC 1–3 clusters. Red dots represent differentially expressed genes (permutation test followed by Benjamini-Hochberg (BH) correction, P < 0.05 and absolute log2 fold change > 1). g) Frequencies for Lin− Dnmt3a KO (n = 4) relative to WT (n = 4) mice, 4 weeks post-recombination (LMM followed by ANOVA; *P < 0.05; ***P < 0.001). h) Flow cytometry of WT (n = 5) and Dnmt3a KO (n = 8) mice 4 weeks post-recombination (two-sided Students t-test). i) Peripheral blood measurements for WT (n = 8) or Dnmt3a KO (n = 8) mice 4 weeks post-recombination (two-sided Students t-test; RBC = red blood cell; MCV = mean corpuscular volume). j) Frequency changes in HSCs (Hlf+), erythroid (Car1+) and monocyte (Ly6c2+; Irf8+) progenitors for WT (n = 6), Tet2 KO (n = 6) and Dnmt3a KO (n = 4) mice clustered independently for each technology. For bar plots, bars represent mean values, dots represent mouse replicates and error bars represent standard deviation unless indicated otherwise. For radar plots, red dots indicate significant frequency changes; red error bars represent standard deviation; dashed line indicates WT reference frequencies and shadow region indicates +/− standard deviation.
Extended Data Fig. 7. Gene module analysis.
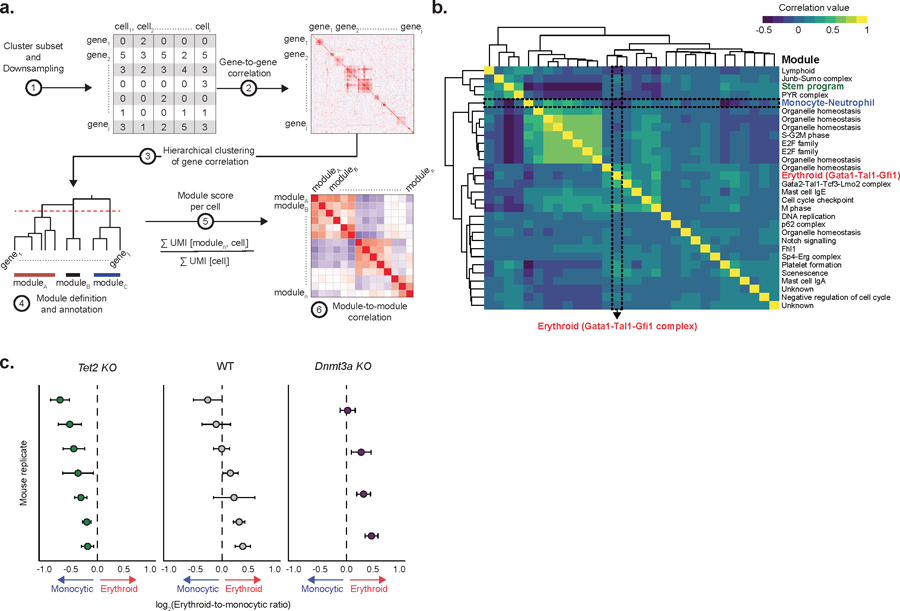
a) Schematic representation of the process for gene module identification. b) Correlation between gene module scores in HSC clusters (HSC 1–3), as calculated by the number of unique molecular identifiers (UMIs) mapping to the genes from each module per 10,000 total UMIs in the cell (Pearson correlation). c) Transcriptional priming values per biological replicate for Tet2 KO (n = 2,989 cells; n = 7 mice), WT (n = 2,150 cells; n = 7 mice) and Dnmt3a KO (n = 1,325 cells; n = 4 mice). Dots represent the mean value; error bars show the 95% confidence interval.
Extended Data Fig. 8. Mean CpG frequencies per base of erythroid and monocytic transcription factor binding motifs.
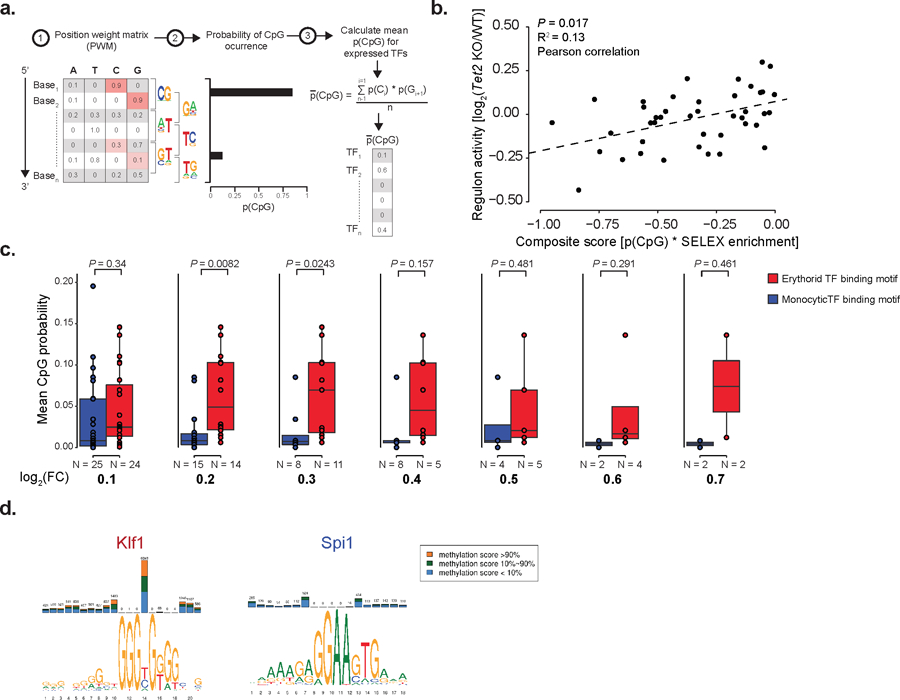
a) Schematic representation of the process for mean CpG frequency per base calculation for transcription factor binding motif position weight matrix. b) Scatter plot showing the correlation between the ratio of transcription factor regulon66 activity change between Tet2 KO (n = 7 mice) and WT (n = 7 mice), as calculated by the total number of molecules mapping to the genes comprising the regulons for the HSC 1–3 clusters per 10,000 UMIs in the cluster, and the product of the CpG frequency in the transcription factor motif and enrichment score as determined by SELEX15 (two-sided Students t-test). c) Mean CpG frequency per base differences between erythroid- and monocytic-associated transcription factors according to different thresholds used for expression change between clusters (n = 7 biologically independent animals; two-sided Wilcoxon rank sum test; FC = fold change). d) Examples of motif CpG content and methylation for Klf1 and Spi1 transcription factors as obtained from the MethMotif database67.
Extended Data Fig. 9. Mean CpG frequency per base correlates with methylation of motifs at accessible enhancer regions.
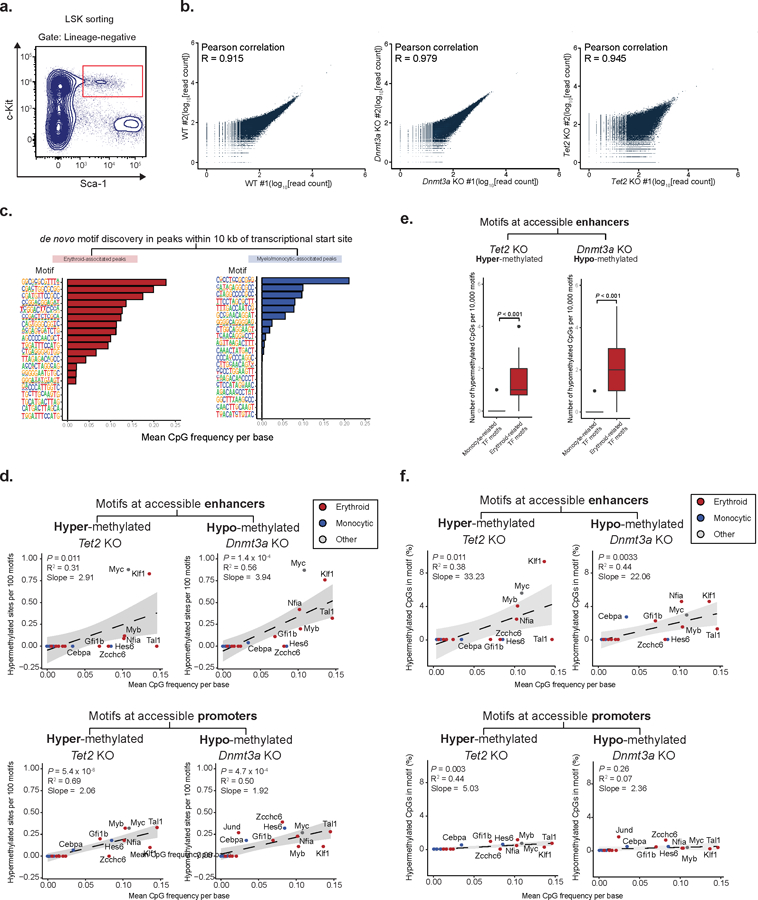
a) Gating for cell sorting for ATAC-Bseq experiments (LSK = lineage negative; Sca1 positive; c-Kit positive). b) Correlation between biological replicates for ATAC-Bseq experiments. Reads were downsampled to 30 x 106 reads per sample and the average read count per 10 kbp genomic windows was calculated (Pearson correlation). c) Examples of Homer output for de novo motif enrichment for either erythroid- or myelo-monocytic-associated accessible peaks within 10 kb of the closest transcriptional start site. d) Correlation between mean CpG frequency per base and the number of differentially (FDR<0.25, absolute methylation difference > 5%) hyper- or hypo-methylated CpGs between WT and Tet2 KO (n = 104,829 CpG sites) or Dnmt3a KO (250,353 CpG sites) respectively, per 100 motifs at accessible enhancers (upper panel) or accessible promoters (two-sided Students t-test; bottom panel; Spearman correlation). e) Number of hypermethylated CpGs per 10,000 motifs for erythroid- or monocyte-associated transcription factor motifs. 100 iterations of sampling without replacement were performed, sampling 10,000 motif sites each iteration, and measuring the number of differentially (FDR<0.25, absolute methylation difference > 5%) hypermethylated or hypomethylated sites captured in Tet2 KO (n = 2 mice) and Dnmt3a KO (n = 2 mice), respectively (two-sided Students t-test). f) Correlation between the percentage of hyper- or hypo-methylated CpGs between WT (n = 2 mice) and Tet2 KO (n = 2 mice) or Dnmt3a KO (n = 2 mice), respectively from total CpGs captured for each transcription factor DNA binding motif site and the mean CpG frequency per base, for motifs in accessible enhancers (middle panel) or accessible promoters (bottom panel; Spearman correlation; two-sided Students t-test).
Extended Data Fig. 10. Single cell RNA and methylation reveals increased heterogeneity and links enhancer methylation with transcriptional priming.
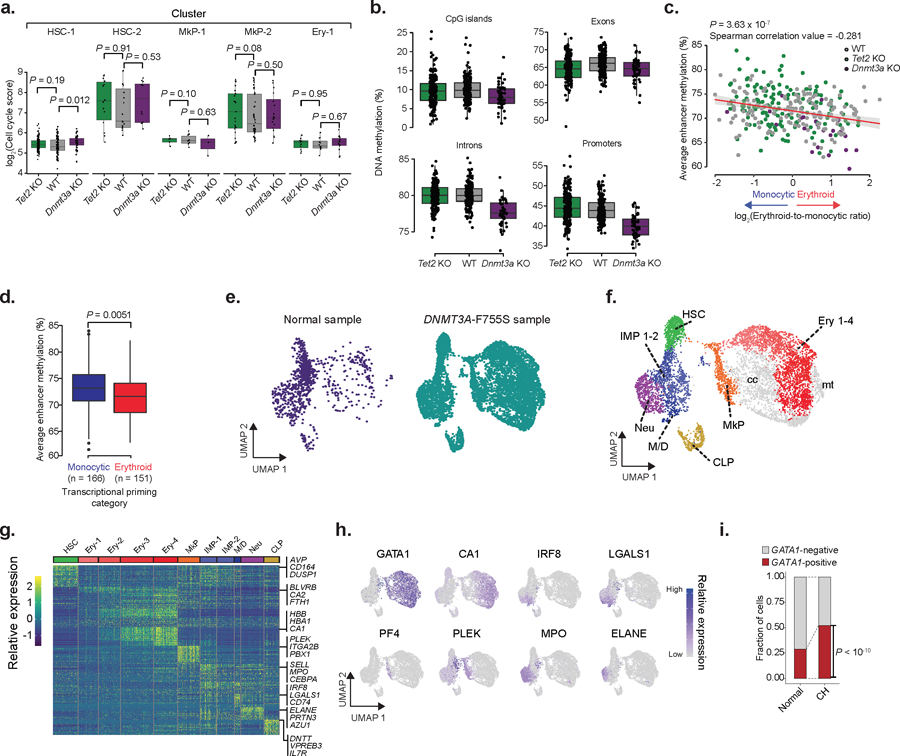
a) LT-HSCs cell cycle scores for WT (n = 178 cells), Tet2 KO (n = 182 cells) and Dnmt3a KO (N =50 cells) as calculated by the number of UMIs mapping to the gene set per 10,000 total UMIs for each of the mapped clusters (two-sided Wilcoxon rank sum test). b) Single cell methylation percentage of CpG islands (CpGi), exon, intron and promoter regions for WT (n = 178 cells), Tet2 KO (n = 182 cells) or Dnmt3a KO (n = 50 cells) LT-HSCs. CpGi were robust to Tet2 deletion-induced hypermethylation, as previously reported69,70. c) Correlation between erythroid-to-monocytic transcriptional priming and mean enhancer methylation in WT (n = 178), Tet2 KO (n = 182) and Dnmt3a KO (n = 50) LT-HSCs (Spearman correlation; two-sided Students t-test). d) Average single cell enhancer methylation comparison between erythroid (n = 151 cells) or monocytic (n = 166 cells) primed LT-HSCs across genotypes (two-sided Wilcoxon rank sum test). e) CD34+ hematopoietic bone marrow progenitors from normal7 (n = 1,035 cells) or DNMT3A-F755S mutant affected (n = 7,338 cells) subjects. f) Clusters for the clonal hematopoiesis sample (HSC = hematopoietic stem cell; IMP = immature myeloid progenitor; Neu = neutrophil/granulocyte progenitor; Ery = erythroid progenitor; M/D = monocyte-dendritic progenitor; CLP = common lymphoid progenitor; MkP = megakaryocyte progenitor; cc = high cell cycle cluster; mt = high mitochondrial gene expression cluster). g) Differentially expressed genes per cluster (FDR < 0.05; logistic regression with Bonferroni correction; Supplementary Table 2) per cluster are shown. h) Gene marker expression from erythroid (GATA1, CA1), monocyte (IRF8, LGALS1), megakaryocyte (PF4, PLEK) and neutrophil (MPO, ELANE) cells. i) Frequency of GATA1+ cells for normal (n = 1,035 cells) and DNMT3A-F755S (n = 7,338 cells) clonal hematopoiesis subject. Cells were defined as positive when at least one UMI was detected for GATA1 (two-sided Fisher exact test).
Supplementary Material
Acknowledgments
R.C. is supported by Lymphoma Research Foundation and Marie Skłodowska-Curie fellowships. S.C.L. is supported by the ASH Scholar Award, the Edward P. Evans Foundation Young Investigator Award, and the NIH K99/R00 Pathway to Independence Award (NCI R00 CA218896). P.L. is supported by the AACR Takeda Multiple Myeloma Fellowship and the NCC National Cancer Center Postdoctoral fellowship. OA-W is supported by grants from NIH/NHLBI (R01 HL128239), the Henry & Marilyn Taub Foundation, the Edward P. Evans Foundation, Leukemia and Lymphoma Society. This work was also funded by P30 CA008748. J.A.S. is supported by National Institute of General Medical Sciences 1R35GM122515. A.D.V. is supported by a National Cancer Institute career development grant K08 CA215317, the William Raveis Charitable Fund Fellowship of the Damon Runyon Cancer Research Foundation (DRG 117–15), and an Evans MDS Young Investigator grant from the Edward P. Evans Foundation. D.A.L. is supported by the Burroughs Wellcome Fund Career Award for Medical Scientists, the Pershing Square Sohn Prize for Young Investigators in Cancer Research and the National Institutes of Health Director’s New Innovator Award (DP2-CA239065). This work was enabled by the Weill Cornell Epigenomics Core and Flow Cytometry Core. This work was also supported by the Leukemia Lymphoma Society Translational Research Program, National Heart Lung and Blood Institute (R01HL145283–01) and Stand Up To Cancer Innovative Research Grant (SU2C-AACR-IRG-0616).
Footnotes
Competing interests
OA-W has served as a consultant for H3B Biomedicine, Foundation Medicine Inc, Merck, and Janssen, and is on the Scientific Advisory Board of Envisagenics Inc; OA-W has received prior research funding from H3B Biomedicine unrelated to the current manuscript. R.L.L. is on the supervisory board of Qiagen and is a scientific advisor to Loxo (until 2/2019), Imago, C4 Therapeutics and Isoplexis, which each include an equity interest. He receives research support from and consulted for Celgene and Roche, he has received research support from Prelude Therapeutics, and he has consulted for Lilly, Incyte, Novartis, Astellas, Morphosys and Janssen. He has received honoraria from Lilly and Amgen for invited lectures and from Gilead for grant reviews.
Data availability: The data used in this publication is available at the Gene Expression Omnibus (GEO) database, accession number GSE124822.
Ethical compliance: This study is in compliance with all ethical regulations and was approved by the Institutional Review Board of Memorial Sloan-Kettering Cancer Center.
References:
- 1.Ley TJ et al. DNMT3A mutations in acute myeloid leukemia. N Engl J Med 363, 2424–2433, doi: 10.1056/NEJMoa1005143 (2010). [DOI] [PMC free article] [PubMed] [Google Scholar]
- 2.Delhommeau F et al. Mutation in TET2 in myeloid cancers. N Engl J Med 360, 2289–2301, doi: 10.1056/NEJMoa0810069 (2009). [DOI] [PubMed] [Google Scholar]
- 3.Gross S et al. Cancer-associated metabolite 2-hydroxyglutarate accumulates in acute myelogenous leukemia with isocitrate dehydrogenase 1 and 2 mutations. J Exp Med 207, 339–344, doi: 10.1084/jem.20092506 (2010). [DOI] [PMC free article] [PubMed] [Google Scholar]
- 4.Busque L et al. Recurrent somatic TET2 mutations in normal elderly individuals with clonal hematopoiesis. Nat Genet 44, 1179–1181, doi: 10.1038/ng.2413 (2012). [DOI] [PMC free article] [PubMed] [Google Scholar]
- 5.Abelson S et al. Prediction of acute myeloid leukaemia risk in healthy individuals. Nature 559, 400–404, doi: 10.1038/s41586-018-0317-6 (2018). [DOI] [PMC free article] [PubMed] [Google Scholar]
- 6.Chang HH, Hemberg M, Barahona M, Ingber DE & Huang S Transcriptome-wide noise controls lineage choice in mammalian progenitor cells. Nature 453, 544–547, doi: 10.1038/nature06965 (2008). [DOI] [PMC free article] [PubMed] [Google Scholar]
- 7.Velten L et al. Human haematopoietic stem cell lineage commitment is a continuous process. Nat Cell Biol 19, 271–281, doi: 10.1038/ncb3493 (2017). [DOI] [PMC free article] [PubMed] [Google Scholar]
- 8.Graf T & Stadtfeld M Heterogeneity of embryonic and adult stem cells. Cell Stem Cell 3, 480–483, doi: 10.1016/j.stem.2008.10.007 (2008). [DOI] [PubMed] [Google Scholar]
- 9.Yu VWC et al. Epigenetic Memory Underlies Cell-Autonomous Heterogeneous Behavior of Hematopoietic Stem Cells. Cell 168, 944–945, doi: 10.1016/j.cell.2017.02.010 (2017). [DOI] [PMC free article] [PubMed] [Google Scholar]
- 10.Bintu L et al. Dynamics of epigenetic regulation at the single-cell level. Science 351, 720–724, doi: 10.1126/science.aab2956 (2016). [DOI] [PMC free article] [PubMed] [Google Scholar]
- 11.Bird A DNA methylation patterns and epigenetic memory. Genes Dev 16, 6–21, doi: 10.1101/gad.947102 (2002). [DOI] [PubMed] [Google Scholar]
- 12.Domcke S et al. Competition between DNA methylation and transcription factors determines binding of NRF1. Nature 528, 575–579, doi: 10.1038/nature16462 (2015). [DOI] [PubMed] [Google Scholar]
- 13.Stone A et al. DNA methylation of oestrogen-regulated enhancers defines endocrine sensitivity in breast cancer. Nat Commun 6, 7758, doi: 10.1038/ncomms8758 (2015). [DOI] [PMC free article] [PubMed] [Google Scholar]
- 14.Prendergast GC & Ziff EB Methylation-sensitive sequence-specific DNA binding by the c-Myc basic region. Science 251, 186–189 (1991). [DOI] [PubMed] [Google Scholar]
- 15.Yin Y et al. Impact of cytosine methylation on DNA binding specificities of human transcription factors. Science 356, doi: 10.1126/science.aaj2239 (2017). [DOI] [PMC free article] [PubMed] [Google Scholar]
- 16.Kribelbauer JF et al. Quantitative Analysis of the DNA Methylation Sensitivity of Transcription Factor Complexes. Cell Rep 19, 2383–2395, doi: 10.1016/j.celrep.2017.05.069 (2017). [DOI] [PMC free article] [PubMed] [Google Scholar]
- 17.Yang L et al. DNMT3A Loss Drives Enhancer Hypomethylation in FLT3-ITD-Associated Leukemias. Cancer Cell 30, 363–365, doi: 10.1016/j.ccell.2016.07.015 (2016). [DOI] [PubMed] [Google Scholar]
- 18.Bock C et al. DNA methylation dynamics during in vivo differentiation of blood and skin stem cells. Mol Cell 47, 633–647, doi: 10.1016/j.molcel.2012.06.019 (2012). [DOI] [PMC free article] [PubMed] [Google Scholar]
- 19.Ji H et al. Comprehensive methylome map of lineage commitment from haematopoietic progenitors. Nature 467, 338–342, doi: 10.1038/nature09367 (2010). [DOI] [PMC free article] [PubMed] [Google Scholar]
- 20.Xu W et al. Oncometabolite 2-hydroxyglutarate is a competitive inhibitor of alpha-ketoglutarate-dependent dioxygenases. Cancer Cell 19, 17–30, doi: 10.1016/j.ccr.2010.12.014 (2011). [DOI] [PMC free article] [PubMed] [Google Scholar]
- 21.Abdel-Wahab O & Levine RL Mutations in epigenetic modifiers in the pathogenesis and therapy of acute myeloid leukemia. Blood 121, 3563–3572, doi: 10.1182/blood-2013-01-451781 (2013). [DOI] [PMC free article] [PubMed] [Google Scholar]
- 22.Sperling AS, Gibson CJ & Ebert BL The genetics of myelodysplastic syndrome: from clonal haematopoiesis to secondary leukaemia. Nat Rev Cancer 17, 5–19, doi: 10.1038/nrc.2016.112 (2017). [DOI] [PMC free article] [PubMed] [Google Scholar]
- 23.Steensma DP et al. Clonal hematopoiesis of indeterminate potential and its distinction from myelodysplastic syndromes. Blood 126, 9–16, doi: 10.1182/blood-2015-03-631747 (2015). [DOI] [PMC free article] [PubMed] [Google Scholar]
- 24.Jaiswal S et al. Clonal Hematopoiesis and Risk of Atherosclerotic Cardiovascular Disease. N Engl J Med 377, 111–121, doi: 10.1056/NEJMoa1701719 (2017). [DOI] [PMC free article] [PubMed] [Google Scholar]
- 25.Genovese G, Jaiswal S, Ebert BL & McCarroll SA Clonal hematopoiesis and blood-cancer risk. N Engl J Med 372, 1071–1072, doi: 10.1056/NEJMc1500684 (2015). [DOI] [PubMed] [Google Scholar]
- 26.Jaiswal S et al. Age-related clonal hematopoiesis associated with adverse outcomes. The New England journal of medicine 371, 2488–2498, doi: 10.1056/NEJMoa1408617 (2014). [DOI] [PMC free article] [PubMed] [Google Scholar]
- 27.Couronne L, Bastard C & Bernard OA TET2 and DNMT3A mutations in human T-cell lymphoma. N Engl J Med 366, 95–96, doi: 10.1056/NEJMc1111708 (2012). [DOI] [PubMed] [Google Scholar]
- 28.Li W et al. DNMT3A mutations and prognostic significance in childhood acute lymphoblastic leukemia. Leuk Lymphoma 56, 1066–1071, doi: 10.3109/10428194.2014.947607 (2015). [DOI] [PubMed] [Google Scholar]
- 29.Mayle A et al. Dnmt3a loss predisposes murine hematopoietic stem cells to malignant transformation. Blood 125, 629–638, doi: 10.1182/blood-2014-08-594648 (2015). [DOI] [PMC free article] [PubMed] [Google Scholar]
- 30.Kramer AC et al. Dnmt3a regulates T-cell development and suppresses T-ALL transformation. Leukemia 31, 2479–2490, doi: 10.1038/leu.2017.89 (2017). [DOI] [PMC free article] [PubMed] [Google Scholar]
- 31.Pan F et al. Tet2 loss leads to hypermutagenicity in haematopoietic stem/progenitor cells. Nat Commun 8, 15102, doi: 10.1038/ncomms15102 (2017). [DOI] [PMC free article] [PubMed] [Google Scholar]
- 32.Paul F et al. Transcriptional Heterogeneity and Lineage Commitment in Myeloid Progenitors. Cell 163, 1663–1677, doi: 10.1016/j.cell.2015.11.013 (2015). [DOI] [PubMed] [Google Scholar]
- 33.Wilson NK et al. Combined Single-Cell Functional and Gene Expression Analysis Resolves Heterogeneity within Stem Cell Populations. Cell Stem Cell 16, 712–724, doi: 10.1016/j.stem.2015.04.004 (2015). [DOI] [PMC free article] [PubMed] [Google Scholar]
- 34.Mildner A et al. Genomic Characterization of Murine Monocytes Reveals C/EBPbeta Transcription Factor Dependence of Ly6C(−) Cells. Immunity 46, 849–862 e847, doi: 10.1016/j.immuni.2017.04.018 (2017). [DOI] [PubMed] [Google Scholar]
- 35.Olsson A et al. Single-cell analysis of mixed-lineage states leading to a binary cell fate choice. Nature 537, 698–702, doi: 10.1038/nature19348 (2016). [DOI] [PMC free article] [PubMed] [Google Scholar]
- 36.Yanez A et al. Granulocyte-Monocyte Progenitors and Monocyte-Dendritic Cell Progenitors Independently Produce Functionally Distinct Monocytes. Immunity 47, 890–902 e894, doi: 10.1016/j.immuni.2017.10.021 (2017). [DOI] [PMC free article] [PubMed] [Google Scholar]
- 37.Drissen R et al. Distinct myeloid progenitor-differentiation pathways identified through single-cell RNA sequencing. Nat Immunol 17, 666–676, doi: 10.1038/ni.3412 (2016). [DOI] [PMC free article] [PubMed] [Google Scholar]
- 38.Ward PS et al. The common feature of leukemia-associated IDH1 and IDH2 mutations is a neomorphic enzyme activity converting alpha-ketoglutarate to 2-hydroxyglutarate. Cancer Cell 17, 225–234, doi: 10.1016/j.ccr.2010.01.020 (2010). [DOI] [PMC free article] [PubMed] [Google Scholar]
- 39.Shih AH, Abdel-Wahab O, Patel JP & Levine RL The role of mutations in epigenetic regulators in myeloid malignancies. Nat Rev Cancer 12, 599–612, doi: 10.1038/nrc3343 (2012). [DOI] [PubMed] [Google Scholar]
- 40.Sugiyama T, Kohara H, Noda M & Nagasawa T Maintenance of the hematopoietic stem cell pool by CXCL12-CXCR4 chemokine signaling in bone marrow stromal cell niches. Immunity 25, 977–988, doi: 10.1016/j.immuni.2006.10.016 (2006). [DOI] [PubMed] [Google Scholar]
- 41.Tzeng YS et al. Loss of Cxcl12/Sdf-1 in adult mice decreases the quiescent state of hematopoietic stem/progenitor cells and alters the pattern of hematopoietic regeneration after myelosuppression. Blood 117, 429–439, doi: 10.1182/blood-2010-01-266833 (2011). [DOI] [PubMed] [Google Scholar]
- 42.Hwang HS et al. Enhanced Anti-Leukemic Effects through Induction of Immunomodulating Microenvironment by Blocking CXCR4 and PD-L1 in an AML Mouse Model. Immunol Invest, 1–10, doi: 10.1080/08820139.2018.1497057 (2018). [DOI] [PubMed] [Google Scholar]
- 43.Cho BS, Kim HJ & Konopleva M Targeting the CXCL12/CXCR4 axis in acute myeloid leukemia: from bench to bedside. Korean J Intern Med 32, 248–257, doi: 10.3904/kjim.2016.244 (2017). [DOI] [PMC free article] [PubMed] [Google Scholar]
- 44.Pujato M, Kieken F, Skiles AA, Tapinos N & Fiser A Prediction of DNA binding motifs from 3D models of transcription factors; identifying TLX3 regulated genes. Nucleic Acids Res 42, 13500–13512, doi: 10.1093/nar/gku1228 (2014). [DOI] [PMC free article] [PubMed] [Google Scholar]
- 45.Heinz S et al. Simple combinations of lineage-determining transcription factors prime cis-regulatory elements required for macrophage and B cell identities. Mol Cell 38, 576–589, doi: 10.1016/j.molcel.2010.05.004 (2010). [DOI] [PMC free article] [PubMed] [Google Scholar]
- 46.Kulakovskiy IV et al. HOCOMOCO: towards a complete collection of transcription factor binding models for human and mouse via large-scale ChIP-Seq analysis. Nucleic Acids Res 46, D252–D259, doi: 10.1093/nar/gkx1106 (2018). [DOI] [PMC free article] [PubMed] [Google Scholar]
- 47.Nam AS et al. Somatic mutations and cell identity linked by Genotyping of Transcriptomes. Nature 571, 355–360, doi: 10.1038/s41586-019-1367-0 (2019). [DOI] [PMC free article] [PubMed] [Google Scholar]
- 48.Kunimoto H et al. Tet2-mutated myeloid progenitors possess aberrant in vitro self-renewal capacity. Blood 123, 2897–2899, doi: 10.1182/blood-2014-01-552471 (2014). [DOI] [PubMed] [Google Scholar]
- 49.Verbist KC et al. Metabolic maintenance of cell asymmetry following division in activated T lymphocytes. Nature 532, 389–393, doi: 10.1038/nature17442 (2016). [DOI] [PMC free article] [PubMed] [Google Scholar]
- 50.Wilson A et al. c-Myc controls the balance between hematopoietic stem cell self-renewal and differentiation. Genes Dev 18, 2747–2763, doi: 10.1101/gad.313104 (2004). [DOI] [PMC free article] [PubMed] [Google Scholar]
- 51.Giladi A et al. Single-cell characterization of haematopoietic progenitors and their trajectories in homeostasis and perturbed haematopoiesis. Nat Cell Biol 20, 836–846, doi: 10.1038/s41556-018-0121-4 (2018). [DOI] [PubMed] [Google Scholar]
- 52.Zhang X et al. DNMT3A and TET2 compete and cooperate to repress lineage-specific transcription factors in hematopoietic stem cells. Nat Genet 48, 1014–1023, doi: 10.1038/ng.3610 (2016). [DOI] [PMC free article] [PubMed] [Google Scholar]
- 53.Emperle M et al. Mutations of R882 change flanking sequence preferences of the DNA methyltransferase DNMT3A and cellular methylation patterns. Nucleic Acids Res 47, 11355–11367, doi: 10.1093/nar/gkz911 (2019). [DOI] [PMC free article] [PubMed] [Google Scholar]
- 54.Viner C et al. Modeling methyl-sensitive transcription factor motifs with an expanded epigenetic alphabet. bioRxiv https://www.biorxiv.org/content/10.1101/043794v1.full.pdf (2016). [DOI] [PMC free article] [PubMed]
- 55.Lawrence MS et al. Mutational heterogeneity in cancer and the search for new cancer-associated genes. Nature 499, 214–218, doi: 10.1038/nature12213 (2013). [DOI] [PMC free article] [PubMed] [Google Scholar]
- 56.Tetteh PW et al. Replacement of Lost Lgr5-Positive Stem Cells through Plasticity of Their Enterocyte-Lineage Daughters. Cell Stem Cell 18, 203–213, doi: 10.1016/j.stem.2016.01.001 (2016). [DOI] [PubMed] [Google Scholar]
Methods-only references
- 57.Kuleshov MV et al. Enrichr: a comprehensive gene set enrichment analysis web server 2016 update. Nucleic Acids Res 44, W90–97, doi: 10.1093/nar/gkw377 (2016). [DOI] [PMC free article] [PubMed] [Google Scholar]
- 58.Liu T Use model-based Analysis of ChIP-Seq (MACS) to analyze short reads generated by sequencing protein-DNA interactions in embryonic stem cells. Methods Mol Biol 1150, 81–95, doi: 10.1007/978-1-4939-0512-6_4 (2014). [DOI] [PubMed] [Google Scholar]
- 59.Love MI, Huber W & Anders S Moderated estimation of fold change and dispersion for RNA-seq data with DESeq2. Genome Biol 15, 550, doi: 10.1186/s13059-014-0550-8 (2014). [DOI] [PMC free article] [PubMed] [Google Scholar]
- 60.Akalin A et al. methylKit: a comprehensive R package for the analysis of genome-wide DNA methylation profiles. Genome Biol 13, R87, doi: 10.1186/gb-2012-13-10-r87 (2012). [DOI] [PMC free article] [PubMed] [Google Scholar]
- 61.Yoshida H et al. The cis-Regulatory Atlas of the Mouse Immune System. Cell 176, 897–912 e820, doi: 10.1016/j.cell.2018.12.036 (2019). [DOI] [PMC free article] [PubMed] [Google Scholar]
- 62.Thurman RE et al. The accessible chromatin landscape of the human genome. Nature 489, 75–82, doi: 10.1038/nature11232 (2012). [DOI] [PMC free article] [PubMed] [Google Scholar]
- 63.Schep AN, Wu B, Buenrostro JD & Greenleaf WJ chromVAR: inferring transcription-factor-associated accessibility from single-cell epigenomic data. Nat Methods 14, 975–978, doi: 10.1038/nmeth.4401 (2017). [DOI] [PMC free article] [PubMed] [Google Scholar]
- 64.Moran-Crusio K et al. Tet2 loss leads to increased hematopoietic stem cell self-renewal and myeloid transformation. Cancer Cell 20, 11–24, doi: 10.1016/j.ccr.2011.06.001 (2011). [DOI] [PMC free article] [PubMed] [Google Scholar]
- 65.Nguyen S, Meletis K, Fu D, Jhaveri S & Jaenisch R Ablation of de novo DNA methyltransferase Dnmt3a in the nervous system leads to neuromuscular defects and shortened lifespan. Dev Dyn 236, 1663–1676, doi: 10.1002/dvdy.21176 (2007). [DOI] [PubMed] [Google Scholar]
- 66.Shih AH et al. Combination Targeted Therapy to Disrupt Aberrant Oncogenic Signaling and Reverse Epigenetic Dysfunction in IDH2- and TET2-Mutant Acute Myeloid Leukemia. Cancer Discov 7, 494–505, doi: 10.1158/2159-8290.CD-16-1049 (2017). [DOI] [PMC free article] [PubMed] [Google Scholar]
- 67.Kuhn R, Schwenk F, Aguet M & Rajewsky K Inducible gene targeting in mice. Science 269, 1427–1429 (1995). [DOI] [PubMed] [Google Scholar]
- 68.Macosko EZ et al. Highly Parallel Genome-wide Expression Profiling of Individual Cells Using Nanoliter Droplets. Cell 161, 1202–1214, doi: 10.1016/j.cell.2015.05.002 (2015). [DOI] [PMC free article] [PubMed] [Google Scholar]
- 69.Dobin A et al. STAR: ultrafast universal RNA-seq aligner. Bioinformatics 29, 15–21, doi: 10.1093/bioinformatics/bts635 (2013). [DOI] [PMC free article] [PubMed] [Google Scholar]
- 70.Hafemeister CS, R. Normalization and variance stabilization of single-cell RNA-seq data using regularized negative binomial regression. Preprint at: https://www.biorxiv.org/content/10.1101/576827v1, doi: 10.1101/576827 (2019). [DOI] [PMC free article] [PubMed]
- 71.Han X et al. Mapping the Mouse Cell Atlas by Microwell-Seq. Cell 172, 1091–1107 e1017, doi: 10.1016/j.cell.2018.02.001 (2018). [DOI] [PubMed] [Google Scholar]
- 72.Sun H, Zhou Y, Fei L, Chen H & Guo G scMCA: A Tool to Define Mouse Cell Types Based on Single-Cell Digital Expression. Methods Mol Biol 1935, 91–96, doi: 10.1007/978-1-4939-9057-3_6 (2019). [DOI] [PubMed] [Google Scholar]
- 73.Bolker BM et al. Generalized linear mixed models: a practical guide for ecology and evolution. Trends Ecol Evol 24, 127–135, doi: 10.1016/j.tree.2008.10.008 (2009). [DOI] [PubMed] [Google Scholar]
- 74.Martin JC et al. Single-Cell Analysis of Crohn’s Disease Lesions Identifies a Pathogenic Cellular Module Associated with Resistance to Anti-TNF Therapy. Cell 178, 1493–1508 e1420, doi: 10.1016/j.cell.2019.08.008 (2019). [DOI] [PMC free article] [PubMed] [Google Scholar]
- 75.Orlanski S et al. Tissue-specific DNA demethylation is required for proper B-cell differentiation and function. Proc Natl Acad Sci U S A 113, 5018–5023, doi: 10.1073/pnas.1604365113 (2016). [DOI] [PMC free article] [PubMed] [Google Scholar]
- 76.Aibar S et al. SCENIC: single-cell regulatory network inference and clustering. Nat Methods 14, 1083–1086, doi: 10.1038/nmeth.4463 (2017). [DOI] [PMC free article] [PubMed] [Google Scholar]
- 77.Macaulay IC et al. G&T-seq: parallel sequencing of single-cell genomes and transcriptomes. Nat Methods 12, 519–522, doi: 10.1038/nmeth.3370 (2015). [DOI] [PubMed] [Google Scholar]
- 78.Picelli S et al. Full-length RNA-seq from single cells using Smart-seq2. Nat Protoc 9, 171–181, doi: 10.1038/nprot.2014.006 (2014). [DOI] [PubMed] [Google Scholar]
- 79.Krueger F & Andrews SR Bismark: a flexible aligner and methylation caller for Bisulfite-Seq applications. Bioinformatics 27, 1571–1572, doi: 10.1093/bioinformatics/btr167 (2011). [DOI] [PMC free article] [PubMed] [Google Scholar]
- 80.Langmead B & Salzberg SL Fast gapped-read alignment with Bowtie 2. Nat Methods 9, 357–359, doi: 10.1038/nmeth.1923 (2012). [DOI] [PMC free article] [PubMed] [Google Scholar]
- 81.Harrow J et al. GENCODE: the reference human genome annotation for The ENCODE Project. Genome Res 22, 1760–1774, doi: 10.1101/gr.135350.111 (2012). [DOI] [PMC free article] [PubMed] [Google Scholar]
Associated Data
This section collects any data citations, data availability statements, or supplementary materials included in this article.


