Abstract
Background
Although randomized, controlled trials (RCTs) are seen as the gold standard for evidence in clinical medicine, a number of considerations are increasing the use of real‐world data (RWD) to generate evidence. A series of methodological challenges must be overcome in order for such real‐world evidence (RWE) to gain acceptance.
In diabetes, RWE faces some particular issues that have limited its development. As the natural history of diabetes progresses, patients' disease changes over time and treatments will be modified as a result. This evolving disease and treatment pattern requires application of methods that account for such changes over time. Research developing RWE in diabetes and other conditions has sometimes been subject to important biases, and researchers should be aware of, and take steps to mitigate potential for bias in order to enhance the evidence produced.
Results
We review a RWE study that replicated and extended evidence provided by a RCT regarding the effects of weekly exenatide relative to basal insulin (glargine or detemir) to illustrate a potential application of RWE. This study observed a 0.7% decrease in HbA1C for weekly exenatide relative to a 0.5% decrease in HbA1C for the comparator along with a 2 kg weight loss for weekly exenatide relative to a 0.25 kg weight gain, effects that were close to those from the RCT. Further, the RWE study was able to extend results to patient populations that were not well represented in the RCT.
Conclusion
Despite numerous challenges, RWE can be used to complement evidence from RCTs.
1. BACKGROUND: FROM RCT TO RWE
The treatments and follow‐up monitoring that patients receive are highly varied both within and across providers and patient response to treatment is variable and may be influenced by many factors apart from treatment. Such variability tends to obscure the effect of treatment, making it a challenge to distinguish treatment effects from selection effects, disease progression, or natural variability. However, separating the treatment effect signal from the noise produced by these other factors is necessary in order to draw reasonable inferences regarding whether the treatment works. The randomized, controlled trial (RCT) has become the foundation of evidence generation in medicine, since it mitigates the obscuring complexities that arise from routine healthcare.1, 2 The RCT offers an opportunity to assess the effect of treatment by imposing regularity (through selection criteria, random allocation of treatment, and standardized data collection) upon the seeming quagmire of variation and alternate explanations. The underlying logic of the RCT, with random allocation of treatment (ensuring balance across compared groups) and blinding of patients and investigators (addressing biased outcome ascertainment) enhances inferences regarding treatment effects. In addition, the RCT includes elements to improve adherence along with outcome ascertainment. As such, the RCT addresses selection bias so that observed treatment benefits are not the result of differential risk among patients across treatment groups. Also removed is information bias through protocol‐specified follow‐up and objective outcome measures along with blinding, so that study outcomes are measured the same way in patients receiving treatment as in the comparators.
Evidence obtained from RCTs enables clinicians to confidently draw conclusions regarding the efficacy of interventions, although this may differ from effectiveness of the same treatments in clinical practice, due to the real‐world differences in patient populations, use of treatment, or patient follow‐up and monitoring. The ability of the RCT to isolate treatment effects comes at considerable direct cost in both time and resources. However, the RCT has more subtle constraints, such as what questions can be asked and what treatments can be compared (requirement for equipoise), a potential lack of generalizability (given that RCT participants may differ from those seen in routine practice due to inclusion or exclusion criteria), and that the treatment effect may vary with changes in treatment setting that have different adherence or monitoring.
Some limitations of RCTs may be addressable by conducting studies using real world data (RWD). Sources of RWD include Registries (disease, product, or geographic/institution‐based), Electronic Medical Records (EMR), Health insurance claims data, surveys, and linked data (e.g. claims or EMR linked to mortality, cancer registry, etc.).3 Since RWD are not collected in the setting of a conventional RCT and given the litany of reasons and the threats to validity that gave rise to the RCT, it would seem to be taking a step (or two) backward to embrace evidence arising from RWD as a foundation of decision‐making. However, several considerations are driving forces behind this re‐examination of the role that RWD can play in evidence generation regarding effectiveness of treatments. These considerations arise from a recognition of the limitations of the RCT and an advancement in methods that improve causal inference from RWD.
One consideration relates to the limitations of RCTs, since the resources they consume mean that fewer research questions can be answered if RCTs are the sole approach to answering them. In contrast, using RWD expands the number and range of research questions answerable. The limited generalizability of RCTs is also potentially overcome by using RWD. Once a treatment is available for use, clinicians may try using it for their patients who might not meet the strict selection criteria of an RCT, and the experience of such patients is captured in RWD. By applying suitable methods to RWD, the resulting real‐world evidence (RWE) can extend the knowledge gained from RCTs and guide expectations for patients and providers in real‐world settings.
Another consideration is the growing availability of RWD, both in breadth and depth. More and more measurements about patient activities and status are available in electronic form, and this electronic data can be linked with others to form a data source that is customized for the needs of the research question.4 As data sources expand from the periodic capture of routine transactions with healthcare providers to continuous monitoring through connected devices and wearables, RWD improves in its representativeness and granularity, making it possible to study aspects of treatment on patients that were previously unimaginable.
Finally, there is impetus to use RWD in regulatory decision‐making, in part driven by regulation including the 21st century cures act and framework developed by the US Food and Drug Administration (FDA) for incorporating RWD into their decisions.5 Additional initiatives to use RWE for regulatory decision‐making have come from Europe including the European Medicines Agency (EMA). 6, 7, 8 Using RWD to address limitations of RCTs requires considerable expertise in methods to use them appropriately and to not fall victim to biases that can arise from incorrect study designs or analyses. There continues to be advancement in research techniques and methods that enhance the utility of RWD and lead to greater reliability in creating RWE from it. 9, 10, 11
2. PARTICULAR CHALLENGES FOR RWE IN DIABETES
The natural history of diabetes (particularly type 2 diabetes) typically involves a progression for individual patients and treatment evolves to meet the changing disease characteristics resulting from this progression. This process creates a number of challenges when conducting a RWD study of treatment for patients with diabetes.12 There are a set of potential pitfalls that may not be apparent to either a researcher using RWD for a study or to a reader of the resulting manuscript. An important one is insufficient accounting for heterogeneity in diabetes status, including type, severity, duration, and comorbidity status. Diabetes might be treated as binary (either present or not), but this definition incompletely captures the complexity of the underlying disease. Although patients with diabetes have several features in common with one another, patients can be separated into subgroups based on characteristics of the disease that change over time. Furthering the complexity, these characteristics may change differently in some patients and not others, thus what might be considered an “average” patient will change longitudinally.
There is a wide range of treatments available to treat diabetes, and therapies can be used individually or in combination. While there is guidance and an underlying logic in how treatments are used; the patterns of use can vary extensively complicating categorization and comparison. Just as diabetes itself is not a static condition, the treatments for diabetes are not static, therefore a longitudinal view must be applied and analytic approaches that respect this temporality must be used.13
There have been some notable examples where incorrect analytic approaches to the complexities that diabetes presents have led to incorrect inferences through immortal time and the associated bias.14, 15 Immortal person‐time is observation time contributed by a patient that is event free by definition. The approaches that produce immortal time tend to be ones that use future information about a patient to characterize their status at study enrolment. Since people who do not survive into the future will lack this information, its use will create a group of people who are immortal (they must have survived in order to meet the definition). Immortal time bias can occur from the presence of immortal person‐time in either the treated or comparison group (or both). Since RWD often spans the entire timeframe to be studied, it is easy to create immortal time and there is no automatic protection against it (as there is in a RCT). The RWD investigator should understand immortal time and seek to avoid it. When faced with a condition (diabetes) that changes over time and for which treatments change over time, it can be tempting to look ahead and use future information to categorize a patient. However, the creation of study variables or the formation of study cohorts based on future information opens the door to time‐related biases.
Beyond the specific issues for diabetes, RWD studies must address issues of selection bias and information bias. Selection bias typically refers to the characteristics of patients who receive a treatment being studied and how they differ from patients to whom they are compared. In contrast to a RCT where the treatment groups are randomly assigned, the nonrandom assignment of treatments in RWD can lead to a host of differences between compared groups that are collectively referred to as selection bias. These differences can include obvious characteristics, such as age or sex, or more clinical characteristics, such as comorbidities or concomitant medications. Also across comparison groups, the features of diabetes may be different, such as duration of diabetes, laboratory results, or history of hypoglycemic episodes. However, certain differences may not be apparent, such as the prescriber's perceptions regarding the patient's likely adherence to treatment or monitoring.
In protocol driven RCTs, documentation of adherence and outcomes occurs in standard intervals following the identification of patient and assignment of treatment and are assessed systematically. In contrast, outcomes that occur among patients in RWD are identified, followed‐up, and documented at the discretion of the treating physician(s). This can lead to preferential documentation of more serious outcomes, that resulted in interaction with the healthcare system, to be captured within the RWD. Many outcomes that are relevant for patients with diabetes include mild changes in the spectrum of some outcomes, and subtle change in or absent symptomatology. These include hypoglycemia, blood glucose, glycated haemoglobin A1C (HbA1C), renal function, and various stages of end‐organ damage. Unless specific questions are asked of patients, or specific laboratory tests ordered, these outcomes will not be ascertained. This paper aims to provide an example in a type 2 diabetes setting to replicate RCT evidence and even extend that RCT evidence by use of RWD.
3. A REVIEW OF DURATION‐3
Exenatide is a glucagon‐like peptide‐1 receptor agonist (GLP‐1 RA) that is effective for treating type 2 diabetes since it has been shown to lower fasting and post‐prandial blood glucose, along with HbA1C levels.16 Treatment with exenatide leads to modest (<2 kg) weight loss; nausea and potentially vomiting are expected adverse effects, although exenatide is less associated with hypoglycemia than insulin. A formulation that extends duration and allows for once weekly subcutaneous injection formulation was developed as an improvement over the original immediate‐acting exenatide, which is administered twice daily. The manufacturer sponsored a series of RCTs (the DURATION studies) to demonstrate various aspects of once‐weekly exenatide efficacy.
One of these studies, DURATION‐3, involved the comparison of adding once‐weekly exenatide versus adding insulin glargine daily to treatment regimen of patients with type 2 diabetes who were already receiving metformin alone or in combination with sulfonylureas.17 The patients were enrolled at 72 sites around the world, and included 233 patients randomized to weekly exenatide and 223 patients randomized to insulin glargine. Of these patients, 47% were female, and the average age was 58 years. (Table 1).
Table 1.
Baseline characteristics of patients in the DURATION‐3 RCT (adapted from Reference 17)
| Characteristic | Exenatide once weekly (n = 233) | Insulin glargine (n = 223) |
|---|---|---|
| Women [n (%)] | 113 (48%) | 100 (45%) |
| Ethnic origin [n (%)] | ||
| African American | 1 (1%) | 1 (<1%) |
| White | 190 (82%) | 189 (85%) |
| Asian | 13 (6%) | 14 (6%) |
| Hispanic | 28 (12%) | 19 (9%) |
| Age (years) [mean (SD)] | 58 (10) | 58 (9) |
| Weight (kg) [mean (SD)] | 91.2 (18.6) | 90.6 (16.4) |
| Haemoglobin A1C (%) [n (%)] | 8.3% (1.1%) | 8.3% (1.0%) |
| Body‐mass index (kg/m2) [mean (SD)] | 32 (5.0) | 32 (5.0) |
| Fasting blood glucose (mmol/L) [mean (SD)] | 9.9 (2.5) | 9.7 (2.7) |
| Duration of diabetes (years) [mean (SD)] | 8.0 (6.0) | 7.8 (6.0) |
| Background treatment [n (%)] | ||
| Metformin | 164 (70%) | 157 (70%) |
| Metformin and sulfonylurea | 69 (30%) | 66 (30%) |
The patients in DURATION‐3 were followed for 26 weeks, with 209 patients completing follow‐up in both the weekly exenatide and insulin glargine arms. Several study outcomes were recorded during this follow‐up, and the primary one was change in HbA1C, while change in body weight was a secondary study outcome. Improvement in HbA1C was observed among both patients receiving once‐weekly exenatide and those receiving insulin glargine, with a mean percentage decrease of between 1% and 1.5%, but there was significantly greater decrease in HbA1C among patients receiving once‐weekly exenatide. (Figure 1).
Figure 1.
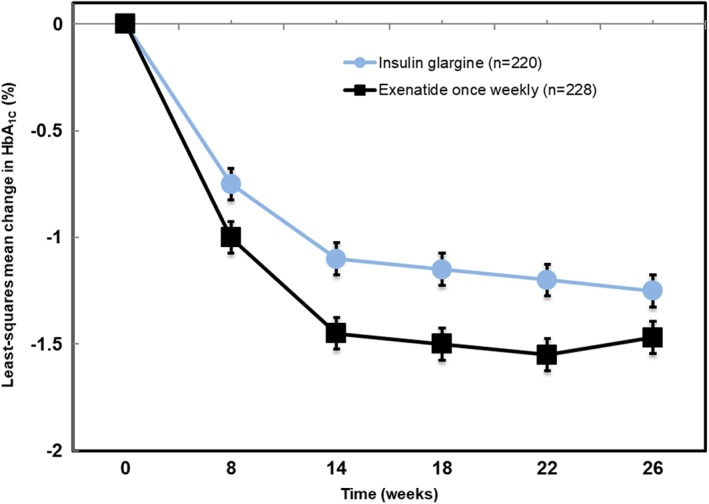
Change in HbA1C during follow‐up of DURATION‐3. (adapted from Reference 17)
Weekly exenatide recipients experienced an average of just over 2 kg weight loss, while the insulin glargine recipients experienced an average of approximately a 1 kg weight gain. (Figure 2).
Figure 2.
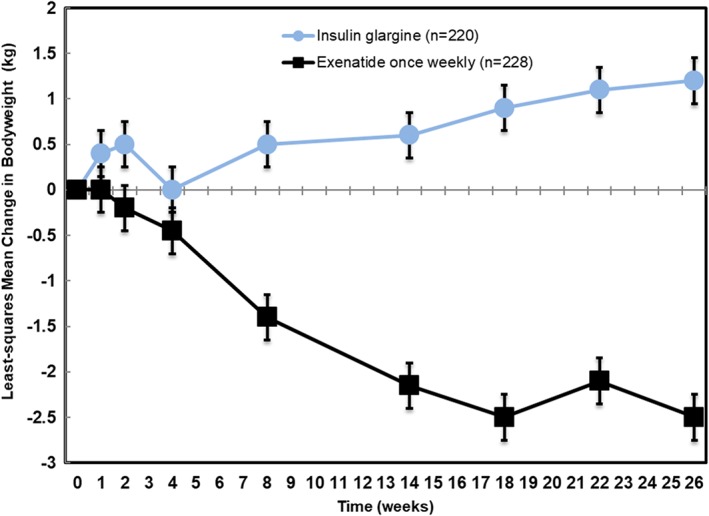
Change in body weight during follow‐up of DURATION‐3. (adapted from Reference 17)
Results from DURATION‐3 might be encouraging to patients and their providers with once‐weekly exenatide appearing to offer an advantage over insulin glargine on both HbA1C change and body weight. Since a choice between these two treatments might be needed for patients with type 2 diabetes who do not achieve adequate glucose control with metformin alone or in combination with sulfonylurea, this research question addresses a clinically‐relevant situation. In these patients, study results suggest that once‐weekly exenatide may offer benefits, and the weekly administration may have greater patient acceptance that could translate into better adherence. However, the patient sample of DURATION‐3 included few patients of African‐American origin and few elderly patients. These patient groups might be candidates for the choice between once‐weekly exenatide and insulin glargine, and the results of DURATION‐3 would only apply to them by extension or generalization. Direct evidence for the effect of once‐weekly exenatide relative to insulin glargine could come from conducting a study in RWD and translating it into RWE.
4. DEVELOPING RWE FOR WEEKLY EXENATIDE
In order to develop RWE that would extend the results of the DURATION‐3 study to African‐American patients and elderly patients, careful selection of data source along with application of appropriate methods was necessary.18, 19, 20 The data source selected for this study was the Optum Electronic Health Record (EHR) database, which is derived from the EMR systems of more than 70 different care delivery organizations. These organizations are affiliated groups of healthcare providers (hospitals, clinics, physician offices) that document healthcare provided using a variety of EMR systems. The disparate EMR system data is shared with Optum and converted into a common data format that permit a range of analytic services that are provided back to them. Optum maintains the data for research purposes, such as this study.
A new user cohort study of once‐weekly exenatide initiators relative to basal insulin (BI) initiators, specifically insulin glargine or insulin detemir initiators, was designed and conducted. To address concerns regarding selection bias that arise from the potential for once‐weekly exenatide initiators to be different from basal insulin initiators, propensity score matching was employed. This process creates a summary measure of likelihood to initiate weekly exenatide relative to the basal insulin comparator, which is the propensity score, a single number between zero and 1 that represents the predicted probability of initiating weekly exenatide relative to basal insulin.21 The propensity score was developed using a logistic regression model that included dozens of variables representing patient characteristics that might differentiate once‐weekly exenatide initiators from basal insulin initiators. Matching treatment groups using this score results in cohorts that have approximately equivalent means and distributions of propensity scores. Further, achieving balance in the propensity score has the effect of inducing balance between the cohorts with respect to each of the numerous baseline characteristics that comprise the propensity score.22
The cohorts were formed using a new‐user cohort design to emulate a RCT (Figure 3).23, 24 This approach begins follow‐up for study outcomes at the point of treatment initiation for both once‐weekly exenatide and basal insulin cohorts, as would a RCT. The outcomes that occur in the follow‐up are assigned to whatever treatment cohort the patient initiated, in a manner similar to intent‐to‐treat. By starting follow‐up for both cohorts at treatment initiation, the study is protected against bias that might come from comparing a cohort that includes existing or prevalent users of one treatment (those who have “survived” on treatment) to initiators of another treatment who have not yet had the opportunity to demonstrate that they will remain on treatment. Patients who choose to remain on a treatment may be different from patients who discontinue the treatment, and the reasons for discontinuation may be due to adverse effects (or lack of effectiveness) of the treatment or may be due to progression of the underlying condition that is the indication for treatment. By starting follow‐up for both treatment cohorts at initiation, the new‐user design has the potential to account for time‐varying effects of treatments, where the risk of outcomes may be higher early after starting treatment and then wane as time goes on or vice‐versa.
Figure 3.
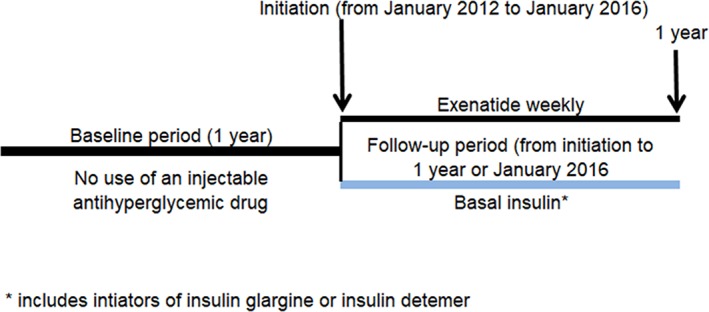
Weekly exenatide RWE cohort formation
As with most sources of RWD, the Optum EHR data exists in a mostly natural state (other than its conversion into a common data model) that reflects its purpose for documenting clinical care that patients receive at the contributing institutions. In order for this RWD to be used for research, an analytic data file is created by applying a set of data handling rules developed in the study protocol. The RWD study was to have follow‐up at pre‐specified intervals, although the particular intervals differed somewhat, with calendar quarters over the course of 1 year instead of varying weekly intervals over half a year in DURATION‐3. Since healthcare as practiced numerous providers across independent health systems (the real‐world) does not adhere to such regular follow‐up schedules, actual patient follow‐up data at each of the specified calendar quarters was only present for some fraction of the starting cohorts. (Figure 4) This pattern of missingness was not a feature of the source EHR data, but rather a consequence of the research design imposed upon the data. Nevertheless, it needed to be addressed in the creation of an analytic dataset for the study to produce RWE.
Figure 4.
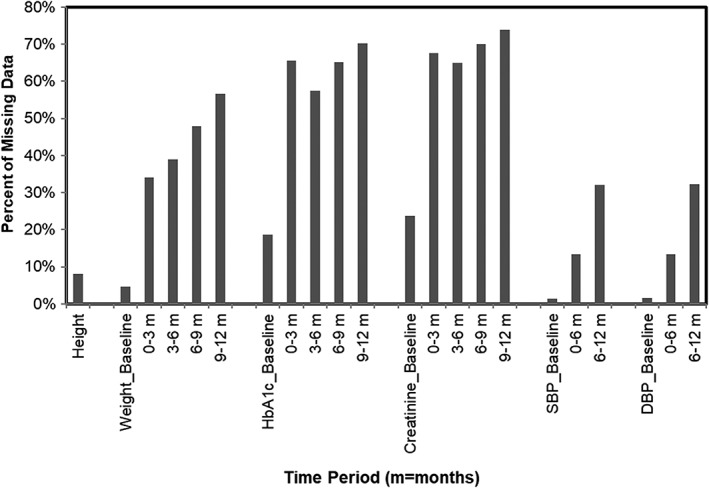
Fraction of study sample with missing values at specified study time points. SBP, systolic blood pressure; DBP, diastolic blood pressure; HbA1C, haemoglobin A1C
Values for the variables were summarized quarterly in the first year of follow‐up, using the mean of values in the interval when more than one measure was available. If a patient had no value for a measure within a particular interval, multiple imputation was used to address the large amount of missing data at each of the study follow‐up time points.25, 26 The multiple imputation procedure used 5 imputations and applied a fully conditional specification (FCS) procedure that permitted imputation of continuous values using a variety of continuous and categorical predictors.27 Extensive criteria were used to impute the values and assess whether the values obtained made sense, both by being within plausible clinical ranges and in appropriate ranges for the specific patient. Using the National Health and Nutrition Evaluation Survey (NHANES) references to provide ranges for laboratory measures, and assessing individual patient outliers, that could represent errors in measurement of an individual value, using fences defined by the 25th and 75th percentile for an individual and permitting 1.5 times the range between those percentiles (ie, 1.5 times the interquartile range). Values that were imputed beyond the range of values considered valid were set to the minimum or maximum of valid range (winsorized).
After imputing the study measures, there were 2075 weekly exenatide initiators and 73 610 basal insulin initiators. Propensity score matching was performed using a ratio of two basal insulin initiators to each once‐weekly exenatide initiator. This ratio matching was conducted in order to enhance statistical power because there were a limited number of weekly exenatide initiators and many more basal insulin initiators. After matching 2008 (96.8%) weekly exenatide initiators to 4016 basal insulin initiators, a table of baseline characteristics was developed to illustrate both the patients to whom the study results most directly apply and the comparability between the cohorts achieved by the matching process. (Table 2) This table shows the remarkable balancing effects of propensity score matching. Each of the baseline characteristics are quite similar between the cohorts so that a reader would expect that a comparison between the cohorts would be fair and not confounded by an important difference in baseline characteristic that might be a risk factor for a study outcome. While balance in such a table can be assessed by examination, a more formal way is to calculate balance metrics and compare to some threshold. The balance metric employed was the absolute standardized differences and a threshold of 0.1 or lower represented adequate balance.28 An aspect of the RWE study design that is implied in the table is that the exenatide and basal insulin initiator cohorts were selected as injection‐naïve patients in order to enhance similarity even before propensity score matching. A choice that meant the study was likely balanced on duration of diabetes, even though this specific variable could not be ascertained from the EHR.29
Table 2.
Baseline patient characteristics of weekly exenatide and basal insulin cohorts (RWE study, after matching)
| Characteristic | Exenatide once weekly (n = 2008) | Basal insulin* (n = 4016) |
|---|---|---|
| Age group [n (%)] | ||
| ≤ 34 | 65 (3.2%) | 136 (3.4%) |
| 35‐44 | 215 (10.7%) | 433 (10.8%) |
| 45‐54 | 540 (26.9%) | 1079 (26.9%) |
| 55‐64 | 693 (34.5%) | 1416 (35.3%) |
| 65‐74 | 421 (21.0%) | 815 (20.3%) |
| ≥ 75 | 74 (3.7%) | 137 (3.4%) |
| Age (years) [mean (SD)] | 57.0 (9.2) | 56.9 (9.1) |
| Sex [n (%)] | ||
| Male | 1003 (50.0%) | 1979 (49.3%) |
| Female | 1005 (50.0%) | 2037 (50.7%) |
| Race/ethnicity [n (%)] | ||
| White | 1630 (81.2%) | 3277 (81.6%) |
| African American | 151 (7.5%) | 303 (7.5%) |
| Hispanic | 96 (4.8%) | 220 (5.5%) |
| Asian | 38 (1.9%) | 62 (1.5%) |
| Multiple | 31 (1.5%) | 41 (1.0%) |
| Unknown | 62 (3.1%) | 113 (2.8%) |
| Number of diabetes drug classes [n (%)] | ||
| 0 | 507 (25.2%) | 950 (23.7%) |
| 1 | 583 (29.0%) | 1186 (29.5%) |
| 2 | 568 (28.3%) | 1170 (29.1%) |
| 3+ | 350 (17.4%) | 710 (17.7%) |
| Body‐mass index (kg/m2) [n (%)] | ||
| ≤ 24 | 32 (1.6%) | 73 (1.8%) |
| 25‐29 | 276 (13.7%) | 503 (12.5%) |
| 30‐39 | 1108 (55.2%) | 2219 (55.3%) |
| 40+ | 592 (29.5%) | 1221 (30.4%) |
| Weight (kg) [mean (SD)] | 107.5 (0.5) | 107.9 (0.4) |
| Haemoglobin A1C (%) [n (%)] | ||
| ≤ 7 | 425 (21.2%) | 789 (19.6%) |
| >7‐9 | 1000 (49.8%) | 1936 (48.2%) |
| >9 | 583 (29.0%) | 1290 (32.1%) |
| Haemoglobin A1C (%) [mean (SD)] | 8.3 (1.0) | 8.5 (1.1) |
| Estimated GFR (ml/min) [n (%)] | ||
| Could not be estimated | 62 (3.1%) | 113 (2.8%) |
| ≥ 90 | 924 (47.5%) | 1873 (48.0%) |
| 60‐90 | 772 (39.7%) | 1528 (39.1%) |
| ≤ 60 | 250 (12.8%) | 502 (12.9%) |
| Estimated GFR [mean (SD)] | 85.7 (22.1) | 85.7 (25.6) |
| Any baseline hypoglycemia [n (%)] | ||
| No | 1917 (95.5%) | 3841 (95.6%) |
| Yes | 91 (4.5%) | 175 (4.4%) |
Insulin glargine or detemir.
These cohorts were followed from initiation of once‐weekly exenatide or basal insulin across a 1‐year period for each of the study outcomes, with the two outcomes focused on being HbA1C and body weight. These outcomes were summarized in the study cohorts at baseline and at four quarterly intervals (0‐3 months, 3‐6 months, 6‐9 months, and 9+ months) in follow‐up. The outcome of HbA1C indicates from a baseline where the two cohorts are equal, a divergence can be seen favouring once‐weekly exenatide at each of the subsequent quarterly intervals. (Figure 5).
Figure 5.
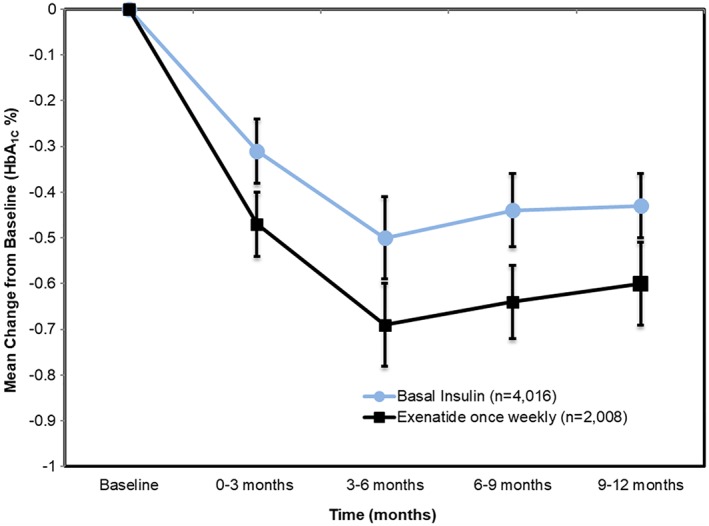
Changes in HbA1C during RWE study follow‐up
The outcome of body weight indicates an initial balance followed by divergence between the two cohorts at each of the follow‐up intervals. The group of patients who initiate basal insulin show no change in weight (or perhaps a little bit of weight gain) during follow‐up, while the weekly exenatide initiators experience weight loss of approximately 2 kg on average. (Figure 6).
Figure 6.
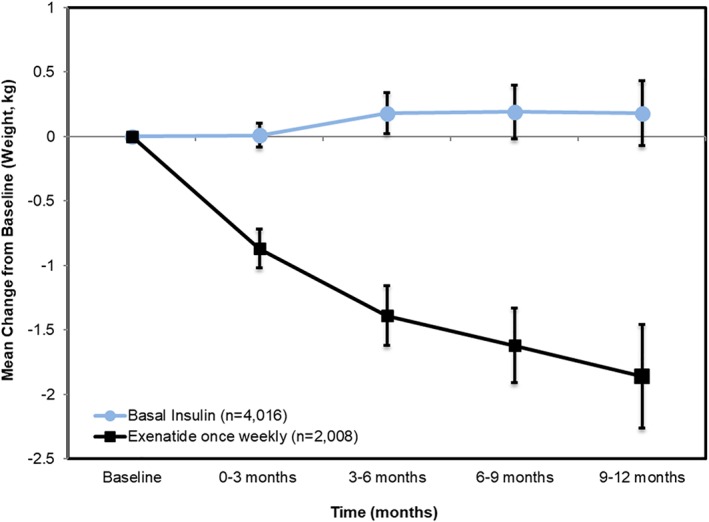
Changes in body weight during RWE study follow‐up
These overall results for the outcomes of HbA1C and for body weight in the RWE study of once‐weekly exenatide mirror the results for the same outcomes from DURATION‐3. By itself, this similarity in pattern of outcome response in RCT and RWE is remarkable, but the value of RWE is illustrated by stratifying the results and focusing on subgroups of the population that were not well represented in the RCT, in particular elderly patients and African Americans. In patients 65‐74 years, the pattern of both HbA1C response and weight change during follow‐up was quite similar (although with less precision) to patients under age 65. (Figure 7) For the oldest patients (75+ years), the pattern of response was still similar, although the small numbers of such patients produce overlapping confidence intervals, reducing certainty in the point estimates being different between compared treatments.
Figure 7.
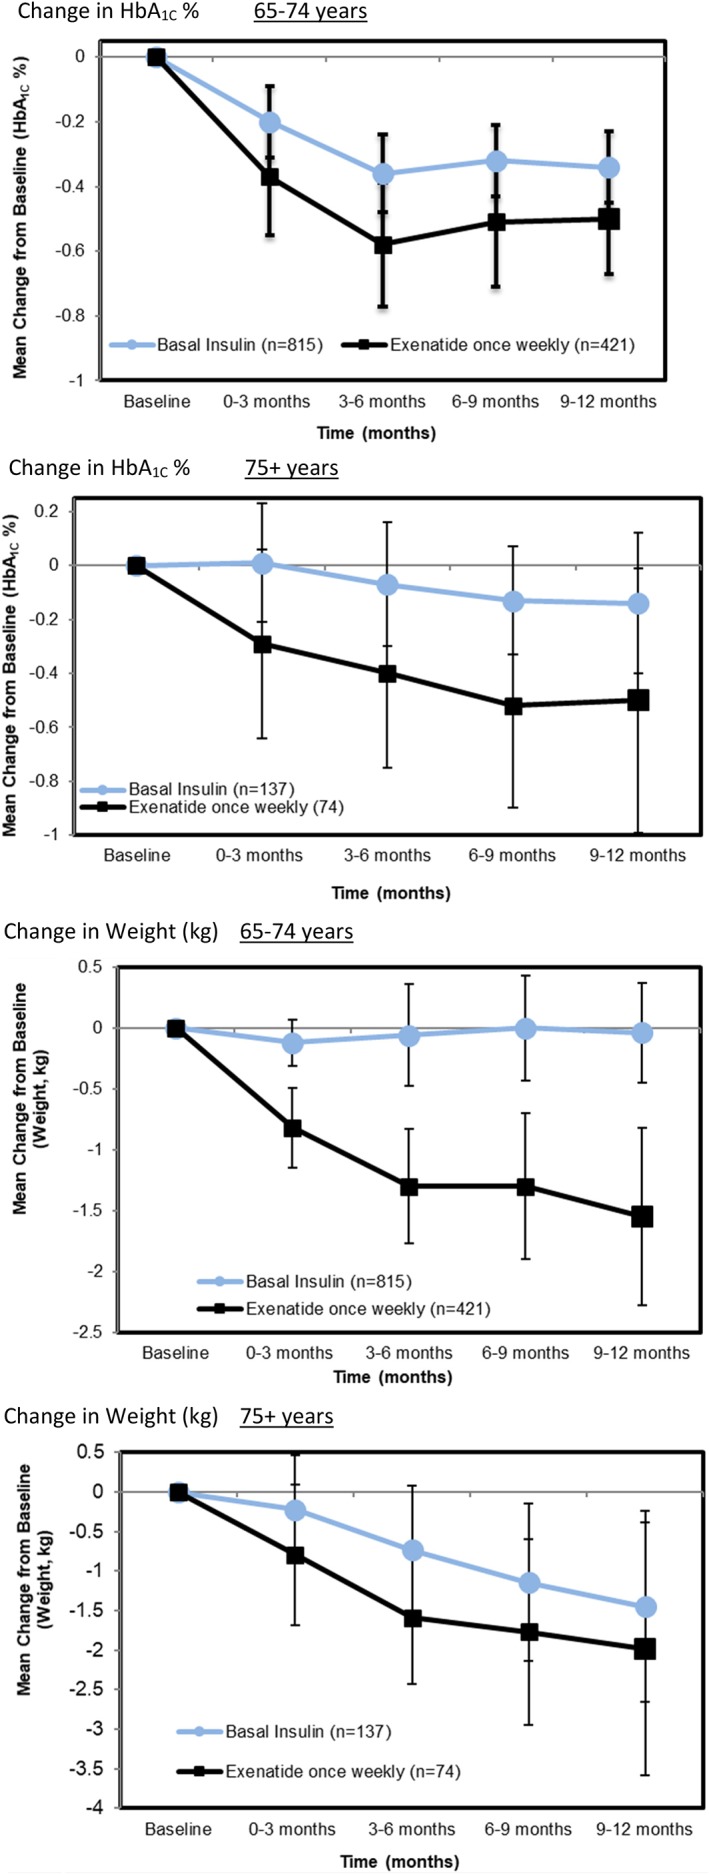
Results for subgroups of age among RWE patients. A, Change in HbA1C % for 65‐74 years. B, Change in HbA1C % for 75+ years. C, Change in weight (kg) for 65‐74 years. D, Change in Weight (kg) for 75+ years
Among African‐American patients, the pattern of HbA1C and weight response was similar to patients overall, although this subgroup started from a different baseline. (Figure 8).
Figure 8.
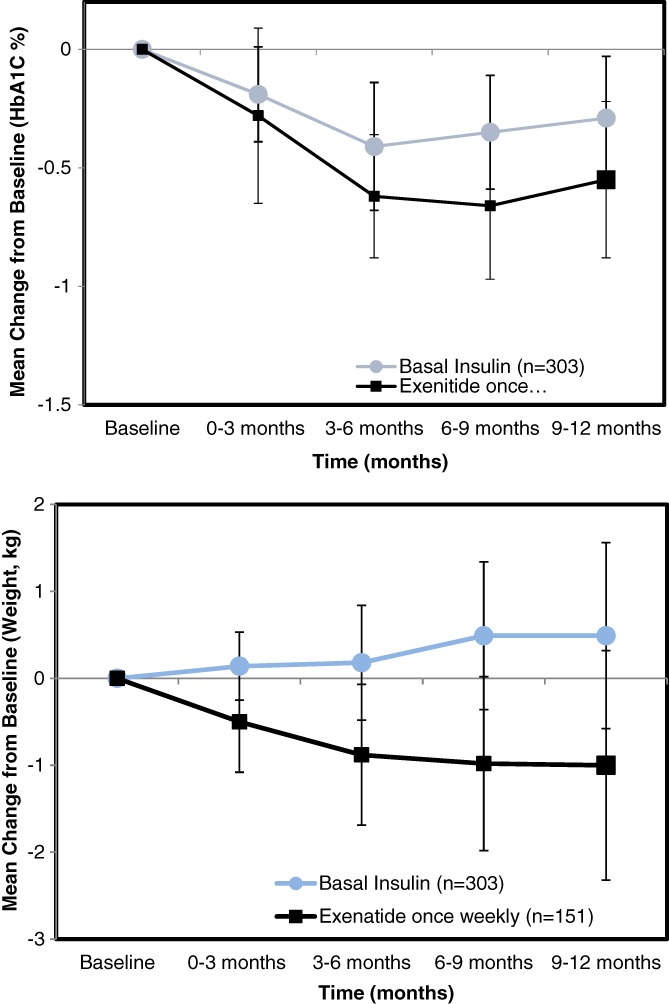
Results for African‐American subgroup among RWE patientsResults are adjusted for baseline difference between treatments in subgroups
A range of potential sources of bias in the example RWE study is presented in a table that identifies sources of bias and approaches used to address them (Table 3).
Table 3.
Potential sources of bias and how addressed in the RWE study (adapted from Reference 30)
| Methodological challenge | Strategy to reduce bias | How addressed in this study |
|---|---|---|
| Temporality in administrative data | Use of cohort study design ensures exposure precedes outcome | Applied a cohort design with start follow‐up for outcomes at first prescription of either weekly exenatide or basal insulin |
| Time‐varying hazards and treatment duration effects | New‐user cohort design | Both weekly exenatide and basal insulin users were naïve initiators of injectable diabetes therapy |
| Exposure risk window definition | Clear biologic hypothesis | Time‐frame of RCT (6 months) and RWE study (12 months) represent similar short‐term timeframe |
| Time‐varying exposures | Consider both ITT and as‐treated analyses | Both RCT and RWE study used ITT analysis |
| Confounding |
Choose appropriate comparison group Apply appropriate methods |
Both RCT and RWE study used active comparison group Use of propensity score improves comparability of groups in RWE study |
5. DISCUSSION
These RWE results suggest that the pattern of effect on HbA1C and weight of weekly exenatide relative to basal insulin in real‐world patients is similar to that seen in DURATION‐3, and further that the results extend to the under‐represented subgroups of elderly and African American patients. Although a reader might have reasonably surmised that the RCT would generalize to these patient subgroups so that this RWE study was not needed in this setting, a critic might have pointed to this as a limitation and reserved judgment until data were available to support this conclusion. Having the RWE serves to back up assertions of generalizability with data, shifting the discussion from one of speculation to one of evidence.
This study structured the follow‐up into regular intervals across time to enhance comparison of change in HbA1C and weight in a similar fashion to a RCT. The need for multiple imputation to address missing covariates and outcome measures was partially due to this somewhat artificial partitioning of time. Not all RWD comparative safety and effectiveness studies will need to use imputation, but it is important to evaluate missing data and the potential effect it might have on treatment response. Depending on the situation, other methods of analysis or study design to address missing data may be preferred.
This application of RWD expanded the evidence base for once‐weekly exenatide and might serve as a generalizable example of one way to extend the valuable, but limited resource of the RCT for obtaining evidence. This use of RWE illustrates the effect of a treatment in routine care where dosing, adherence or monitoring might differ from those in a RCT. Results from such RWE studies could factor into provider and patient decisions regarding treatment and guide expectations of potential benefit. RWE could be used in policy formulation or drug pricing decisions, and could be incorporated into value‐based reimbursement mechanisms where reimbursement is tied to benefits as actually realized in the populations using the drugs.31, 32
In settings where a RCT that addresses the same or similar research question is not available to serve as a benchmark, the RWE will need to stand alone. Of course, RWE can be used to show the effect of treatment even without an existing RCT, but this brings with it all the limitations and cautions about potential biases when conducting a study using RWD that have been mentioned previously.
Treatment with weekly exenatide relative to basal insulin appears in the RWE study to produce effects that are quite similar to those observed in the RCT, even for under‐represented subgroups of patients. While requiring fewer resources than the conduct of a similar RCT, this RWE study still involved considerable time, funding and expertise. In this case, RWE provided a useful complement a RCT, an example of the application of RWE that could also be used to study other comparative effectiveness or safety research questions.
Seeger JD, Nunes A, Loughlin AM. Using RWE research to extend clinical trials in diabetes: An example with implications for the future. Diabetes Obes Metab. 2020;22(Suppl. 3):35–44. 10.1111/dom.14021
Peer Review The peer review history for this article is available at https://publons.com/publon/10.1111/dom.14021.
REFERENCES
- 1. Sackett DL. Why did the randomized clinical trial become the primary focus of my career? Value Health. 2015;18:550‐552. [DOI] [PubMed] [Google Scholar]
- 2. Bothwell LE, Podolsky SH. The emergence of the randomized, controlled trial. N Engl J Med. 2016;375:501‐504. [DOI] [PubMed] [Google Scholar]
- 3. Berger ML, Sox H, Willke RJ, et al. Good practices for real‐world data studies of treatment and/or comparative effectiveness: recommendations from the joint ISPOR‐ISPE special task force on real‐world evidence in health care decision making. Pharmacoepidemiol Drug Saf. 2017;26:1033‐1039. [DOI] [PMC free article] [PubMed] [Google Scholar]
- 4. Cave A, Brun NC, Sweeney F, Rasi G, Senderovitz T. Big data ‐ how to realise the promise. Clin Pharmacol Ther. 2020;107:753‐761. [DOI] [PMC free article] [PubMed] [Google Scholar]
- 5. Sherman RE, Anderson SA, Dal Pan GJ, et al. Real‐world evidence ‐ what is it and what can it tell us? N Engl J Med. 2016;375:2293‐2297. [DOI] [PubMed] [Google Scholar]
- 6. Eichler HG, Koenig F, Arlett P, et al. Are novel, nonrandomized analytic methods fit for decision making? The need for prospective, controlled, and transparent validation. Clin Pharmacol Ther. 2020;107:773‐779. [DOI] [PMC free article] [PubMed] [Google Scholar]
- 7. HMA . EU Medicines Agencies Network Strategy to 2020 – Working together to improve health. 2015. http://www.ema.europa.eu/docs/en_GB/document_library/Other/2015/12/WC500199060.pdf.
- 8. Cave A, Kurz X, Arlett P. Real‐world data for regulatory decision making: challenges and possible solutions for Europe. Clin Pharmacol Ther. 2019;106:36‐39. [DOI] [PMC free article] [PubMed] [Google Scholar]
- 9. Franklin JM, Glynn RJ, Martin D, Schneeweiss S. Evaluating the use of nonrandomized real‐world data analyses for regulatory decision making. Clin Pharmacol Ther. 2019. Apr;105(4):867‐877. [DOI] [PubMed] [Google Scholar]
- 10. Khosla S, White R, Medina J, et al. Real world evidence (RWE) – a disruptive innovation or the quiet evolution of medical evidence generation? F1000 Res. 2018;7:111. [DOI] [PMC free article] [PubMed] [Google Scholar]
- 11. Lamberti MJ, Kubick W, Awatin J, McCormick J, Carroll J, Getz K. The use of real‐world evidence and data in clinical research and Postapproval safety studies. Ther Innov Regul Sci. 2018;52:778‐783. [DOI] [PubMed] [Google Scholar]
- 12. Mamtani R, Haynes K, Finkelman BS, Scott FI, Lewis JD. Distinguishing incident and prevalent diabetes in an electronic medical records database. Pharmacoepidemiol Drug Saf. 2014;23:111‐118. [DOI] [PMC free article] [PubMed] [Google Scholar]
- 13. Bykov K, He M, Franklin JM, Garry EM, Seeger JD, Patorno E. Glucose‐lowering medications and the risk of cancer: a methodological review of studies based on real‐world data. Diabetes Obes Metab. 2019;21:2029‐2038. [DOI] [PMC free article] [PubMed] [Google Scholar]
- 14. Suissa S, Azoulay L. Metformin and the risk of cancer: time‐related biases in observational studies. Diabetes Care. 2012;35:2665‐2673. [DOI] [PMC free article] [PubMed] [Google Scholar]
- 15. Suissa S. Immortal time bias in pharmacoepidemiology. Am J Epidemiol. 2008;167:492‐499. [DOI] [PubMed] [Google Scholar]
- 16. Htike ZZ, Zaccardi F, Papamargaritis D, Webb DR, Khunti K, Davies MJ. Efficacy and safety of glucagon‐like peptide‐1 receptor agonists in type 2 diabetes: a systematic review and mixed‐treatment comparison analysis. Diabetes Obes Metab. 2017;19:524‐536. [DOI] [PubMed] [Google Scholar]
- 17. Diamant M, Van Gaal L, Guerci B, et al. Exenatide once weekly versus insulin glargine for type 2 diabetes (DURATION‐3): 3‐year results of an open‐label randomised trial. Lancet Diabetes Endocrinol. 2014;2:464‐473. [DOI] [PubMed] [Google Scholar]
- 18. Loughlin AM, Qiao Q, Nunes AP, et al. Effectiveness and tolerability of therapy with exenatide once weekly vs basal insulin among injectable‐drug‐naïve elderly or renal impaired patients with type 2 diabetes in the United States. Diabetes Obes Metab. 2018;20:898‐909. [DOI] [PMC free article] [PubMed] [Google Scholar]
- 19. Loughlin AM, Qiao Q, Nunes AP, et al. Effectiveness and tolerability of therapy with once‐weekly exenatide once versus basal insulin among injectable‐drug‐naïve patients in a real‐world setting in the United States. Diabetes Spectr. 2018;31:129‐137. [DOI] [PMC free article] [PubMed] [Google Scholar]
- 20. Nunes AP, Loughlin AM, Qiao Q, et al. Tolerability and effectiveness of Exenatide once weekly relative to basal insulin among type 2 diabetes patients of different races in routine care. Diabetes Ther. 2017;8:1349‐1364. [DOI] [PMC free article] [PubMed] [Google Scholar]
- 21. Austin PC. An introduction to propensity score methods for reducing the effects of confounding in observational studies. Multivar Behav Res. 2011;46:399‐424. [DOI] [PMC free article] [PubMed] [Google Scholar]
- 22. Rosenbaum PR. Rubin, DB.1The central role of the propensity score in observational studies for causal effects. Biometrika. 1983;70:41‐55. [Google Scholar]
- 23. Ray WA. Evaluating medication effects outside of clinical trials: new‐user designs. Am J Epidemiol. 2003;158:915‐920. [DOI] [PubMed] [Google Scholar]
- 24. Hernán MA, Robins JM. Using big data to emulate a target trial when a randomized trial is not available. Am J Epidemiol. 2016;183:758‐764. [DOI] [PMC free article] [PubMed] [Google Scholar]
- 25. Pederson AB, Mikkelson EA, Cronin‐Fenton D, et al. Missing data and multiple imputation in clinical epidemiological research. Clin Epidemiol. 2017;9:157‐166. [DOI] [PMC free article] [PubMed] [Google Scholar]
- 26. Li P, Stuart EA, Allison DB. Multiple imputation: a flexible tool for handling missing data. JAMA. 2015;314:1966‐1967. [DOI] [PMC free article] [PubMed] [Google Scholar]
- 27. Liu Y, De A. Multiple imputation by fully conditional specification for dealing with missing data in a large epidemiologic study. Int J Stat Med Res. 2015;4:287‐295. [DOI] [PMC free article] [PubMed] [Google Scholar]
- 28. Austin PC. Balance diagnostics for comparing the distribution of baseline covariates between treatment groups in propensity‐score matched samples. Statist Med. 2009;28:3083‐3107. [DOI] [PMC free article] [PubMed] [Google Scholar]
- 29. Patorno E, Patrick AR, Garry EM, et al. Observational studies of the association between glucose‐lowering medications and cardiovascular outcomes: addressing methodological limitations. Diabetologia. 2014;57:2237‐2250. [DOI] [PubMed] [Google Scholar]
- 30. Patorno E, Gopalakrishnan C, Franklin JM, et al. Claims‐based studies of oral glucose‐lowering medications can achieve balance in critical clinical variables only observed in electronic health records. Diabetes Obes Metab. 2018;20:974‐984. [DOI] [PMC free article] [PubMed] [Google Scholar]
- 31. Butcher L. Can ICER bring cost‐effectiveness to drug prices? Manag Care. 2019;28(6):30‐33. [PubMed] [Google Scholar]
- 32. Webb DJ, Walker A. Value‐based pricing of drugs in the UK. Lancet. 2007;369:1415‐1416. [DOI] [PubMed] [Google Scholar]


