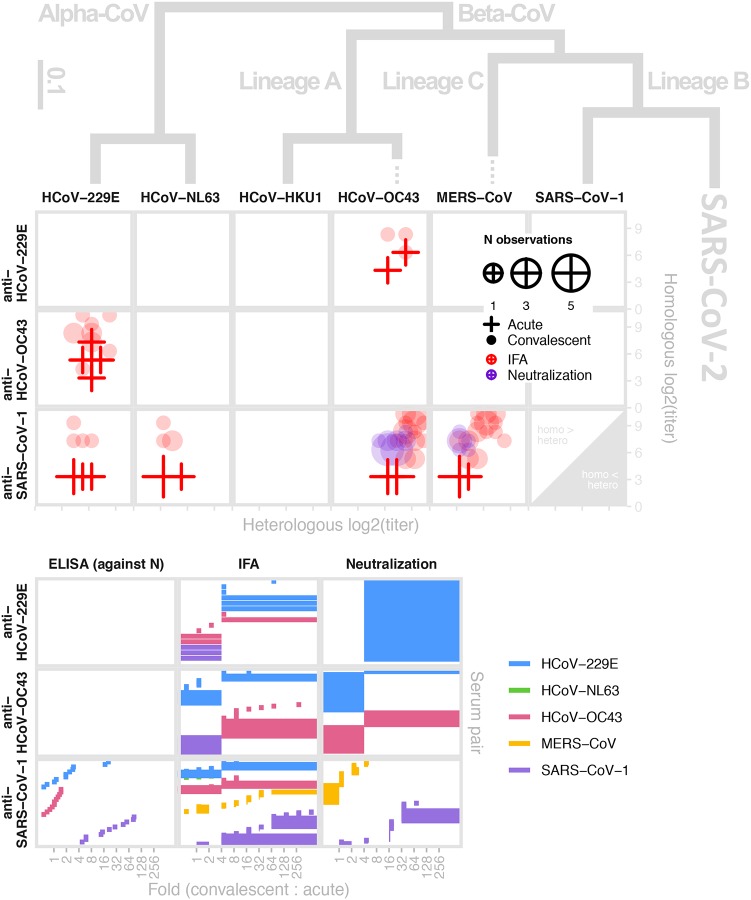
Figure 5: Antigenic and phylogenetic relationships among human coronaviruses.
(Top) Reactivity of antiserum (x-axis) taken from individuals with confirmed infections of each human coronavirus against a panel of human coronaviruses (columns) shown in relation to their phylogeny as measured by IFA (red) and neutralization (purple); convalescent (circles) and acute sera (crosses); size of plot characters denotes the number of observations. The y-axis provides titers to the homologous strain the sera (rows) for comparison. (Bottom) Bracket of reported convalescent-to-acute titer fold-rise upon infection. Data extracted from 7 studies39,65,69,72,73,139,140. Phylogeny modified from141.
Antigenic and phylogenetic relationships among HCoVs.

