

Abstract
The role of ventilation in preventing tuberculosis (TB) transmission has been widely proposed in infection control guidance. However, conclusive evidence is lacking. Modeling suggested the threshold of ventilation rate to reduce effective reproductive ratio (ratio between new secondary infectious cases and source cases) of TB to below 1 is corresponding to a carbon dioxide (CO2) level of 1000 parts per million (ppm). Here, we measured the effect of improving ventilation rate on a TB outbreak involving 27 TB cases and 1665 contacts in underventilated university buildings. Ventilation engineering decreased the maximum CO2 levels from 3204 ± 50 ppm to 591‐603 ppm. Thereafter, the secondary attack rate of new contacts in university dropped to zero (mean follow‐up duration: 5.9 years). Exposure to source TB cases under CO2 >1000 ppm indoor environment was a significant risk factor for contacts to become new infectious TB cases (P < .001). After adjusting for effects of contact investigation and latent TB infection treatment, improving ventilation rate to levels with CO2 <1000 ppm was independently associated with a 97% decrease (95% CI: 50%‐99.9%) in the incidence of TB among contacts. These results show that maintaining adequate indoor ventilation could be a highly effective strategy for controlling TB outbreaks.
Keywords: carbon dioxide, contact investigation, isoniazid preventive therapy, outbreak control, tuberculosis, ventilation
Practical Implications.
Tuberculosis (TB) is the leading global epidemic, causing 1.6 million deaths worldwide in 2017. Despite advances in molecular diagnosis, effective drug therapy, and directly observed treatment, short‐course (DOTS) programme, the global incidence declined very slowly, only 2% per year––but is in line with predicted impact of DOTS strategy. Additional strategies are urgently required.
This study provides the first empirical data showing that improving indoor ventilation to levels with CO2 <1000 ppm is highly effective in controlling a TB outbreak which occurred in poorly ventilated indoor environment. A refocusing on the importance of adequate indoor ventilation in TB control could be the game changer for achieving the global End TB target.
1. INTRODUCTION
Tuberculosis (TB) is currently the leading global epidemic, causing more than 1.6 million deaths worldwide in 2017.1 Despite the advances in molecular diagnosis, effective drug treatment, and directly observed treatment, short‐course (DOTS) program, the worldwide TB incidence declined very slowly, 2% per year at the present time—but is consistent with model predictions for the impact of the DOTS strategy.1, 2 Additional strategies are urgently required to achieve the global End TB target.
Tuberculosis is an airborne disease which spread through infectious aerosol generated by patients during cough.3 In an indoor environment, infectious aerosol progressively accumulates and put everyone in the room at risk unless the indoor air is continuously replaced with the fresh outdoor air by ventilation.4 Poor ventilation is associated with increased risk of tuberculin skin test (TST) conversion.5 The role of ventilation in preventing TB transmission has been widely proposed in infection control guidance.2, 6, 7, 8 However, conclusive evidence is lacking.8, 9
Theoretically, improving ventilation rate decreases the probability of TB transmission exponentially, but never to zero.10 Nevertheless, to stop the TB epidemic, it only needs to reduce the effective reproductive ratio (ratio between new secondary infectious cases and source cases) to less than one, rather than to zero.11 Modeling work, based on parameters from South Africa high schools, suggested that this threshold is 8.6 L/s per person, corresponding to an indoor carbon dioxide (CO2) level of 1000 parts per million (ppm).12 However, this theoretical threshold has not been tested in real world.
Taiwan has advanced public health services. The national directly observed therapy program and contact investigation system ensure all TB patients and their contacts are diagnosed promptly and treated effectively.13 Nevertheless, a large outbreak involving 27 active TB cases and 1665 contacts occurred at a poorly ventilated university building during 2010‐2013. Investigation found that the university building had an indoor CO2 level up to 3204 ppm as the outbreak unfolded. We aimed to measure the effect of improving ventilation to levels with indoor CO2 <1000 ppm on this TB outbreak, focusing on the risk of contacts to become new secondary infectious TB cases.
2. METHODS
2.1. Study settings
University A, located at suburbs of Taipei, has around 10 000 students. The university building used a central mechanical ventilation and air‐conditioning system to maintain temperature within a comfortable range in a hot and humid climate. The air circulates between classrooms. None of the classrooms has an independent ventilation system. To minimize electricity cost, no extractor ventilation machines had been installed for underground floors (Figure 1). The lack of air outflow created a positive indoor pressure that prevented the inflow of fresh hot air.
Figure 1.
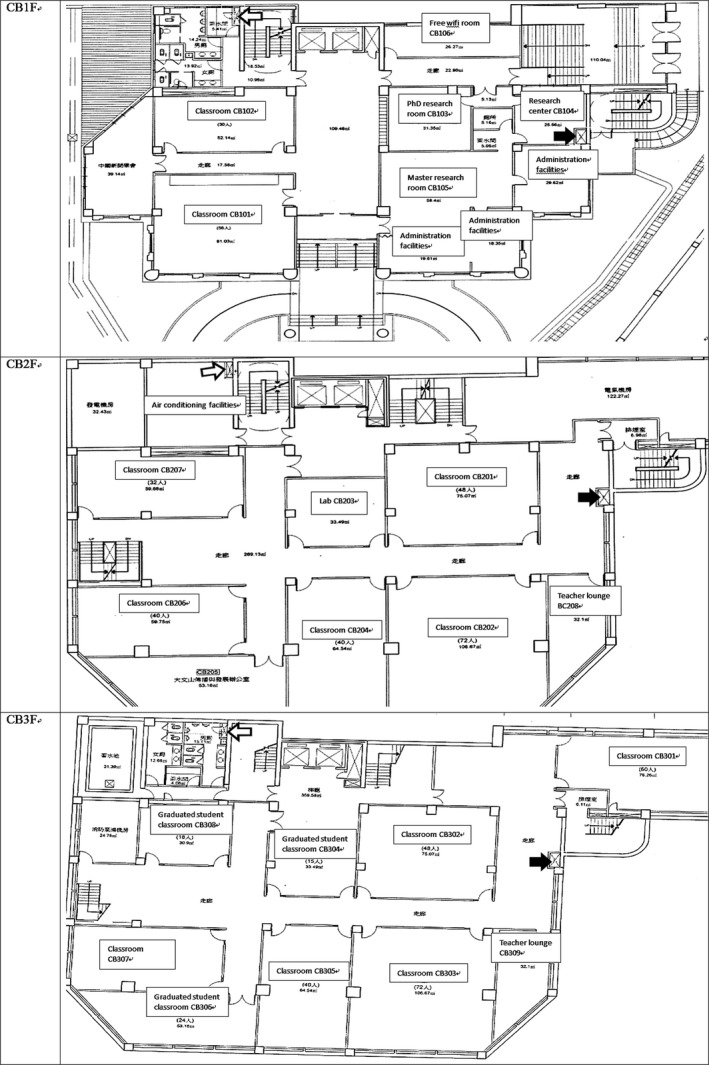
Building C underground floorplan. The locations of the very small outward grille and inward grille of this central ventilation system in each floor are labeled with black arrow (outlet) and white arrow (inlet), respectively. There were 2, 5, and 4 classrooms on basement 1 (CB1F), basement 2 (CB2F), and basement 3 (CB3F), respectively, plus administrative offices and graduate student research rooms. Before ventilation engineering, this ventilation system did not have any extractor machines. The four 2850 cubic‐feet‐per‐min (CFM) supply machines and one 2300 CFM supply machines created a positive pressure which minimized inflow of hot fresh air. On October 28, 2011, three 3000 CFM extractor machines were installed, along with five 3000 CFM supply machines. During November 2011, two more supply machines were installed, along with a revision of a direct type air inlet duct to increase the inward air flow
2.2. The outbreak
The outbreak began at classrooms (Figure 2) in the underground floors of the Building C. Figure 1 shows a diagram of rooms in the floorplan. The index case (Case 0, a student who presented with a productive cough for 1 month) was diagnosed with smear‐positive non‐cavitary TB in November 2010. The index case was immediately put on sick leave and began treatment. Initial chest radiography (CXR) screening of 44 classmates, 3 teachers and 4 family members, found no additional cases. However, from April to September 2011, 11 new cases emerged. Most of these cases had been in the same classroom but never had close contact with the index case. The National Reference Laboratory of Mycobacteriology performed DNA fingerprinting with standard IS6110 restriction fragment length polymorphism,14 which showed an identical genotype for all collected strains isolated from the index case and the subsequent 11 cases, including 7 secondary cases related to the index case, 2 tertiary cases related to Case 3, and two cases of uncertain sources (Figure 3). The ongoing transmission, despite the early removal of the index case, prompted investigation of possible environmental factors.
Figure 2.

One of the crowded and poorly ventilated 56‐seat underground classrooms, where the index case had attended class, with a carbon dioxide level up to 2936 parts per million (ppm) at peak hours (the photograph was taken after the students have left)
Figure 3.
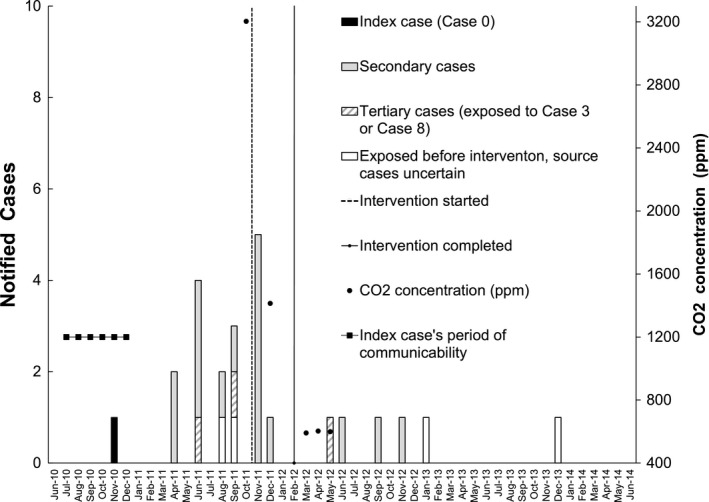
Epidemic curve by notification date of active tuberculosis (TB) cases and carbon dioxide (CO2) concentration (the monthly maximum values of daily average) in the underground floors of Building C before and after ventilation engineering intervention. Index case (black), secondary cases (gray), and tertiary cases (diagonal) are shown by different color or pattern. Four additional cases caused by the same strain (white) were found by cross‐checking 20 392 employees and students who had stayed at University A campus before the ventilation engineering was completed on January 16, 2012: Case 9 was exposed to Case 0 in the CB2 classroom for only 20 h, but exposed to Case 3 in Building M on the same floor (but not in the same room) for 62 h; Case 22 exposed to Case 0 for 32 h, to Case 3 for 39 h, to Case 8 for 14 h, and Case 23 was exposed to Case 0 for 30 h, Case 3 for 39 h, Case 8 for 14 h, Case 9 for 8 h, all in Building M on the same floor but not in the same room. The curriculum of Case 7 could not be matched to any TB cases. The final four cases (one notified in 2016, 2017, and two in 2018, respectively, not shown in the Figure) were contacts of the index case (contact occurred in poorly ventilated environments before the ventilation engineering). All these four patients had been diagnosed to have latent TB infection in late 2011 but refused to receive isoniazid preventive therapy
2.3. Study design
We used a retrospective cohort study of all contacts (n = 1665) involved in this outbreak (follow‐up to July 31, 2018, with a mean follow‐up time of 5.9 years) to examine the effect of ventilation improvement on the risk for contacts to become new infectious TB cases. We obtained cases, contacts, and follow‐up data from the National Surveillance of Notifiable Contagious Diseases (NSNCD), a centralized cloud‐based case management database to ensure that all new TB cases from the list of university students, employees, and TB patients’ contacts were included.
2.4. Contact investigation
In addition to household contacts, all persons who had a cumulative 30‐40‐hour exposure to shared air (defined as staying in the same floor or within the same building with any infectious TB patients) were considered as contacts for whom clinical and radiographic evaluations and follow‐up were provided to detect active TB.13 Public health nurses used lists of students/faculties/employee, curriculum, and class rosters to identify contacts as many as possible. To analyse the chain of transmission, all contacts were linked to the first source case he/she had been exposed to. Per national policy, contacts <13 years of age received a TST, using a cutoff point of 10 mm.13 In response to this outbreak, the authority expanded TST to all contacts regardless of age beginning in October 2011. Isoniazid preventive therapy (isoniazid 10 mg/kg once daily [max. 300 mg] for 9 months) was offered to all asymptomatic contacts with latent TB infection (LTBI, defined as having a positive TST >10 mm, and normal chest radiographs). However, LTBI contacts could choose not to receive treatment.
2.5. Measurement of indoor CO2 levels
Standard portable CO2 meters, TSI‐8760 (TSI Incorporated, with precision range of ±50 ppm),15 were used to measure CO2 levels. The CO2 meters were calibrated using the National Institute of Standards and Technology standard gases (0/910/3010 ppm). All CO2 measurements were conducted during peak hours (10 am to noon or 1 pm to 5 pm) when almost every classroom was occupied (20‐50 students per class, Appendix S1). Measurements were taken beginning 30 minutes after the commencement of a class and lasted until the end of a class. One to four sites were sampled, based on classroom size. The measurement was repeated every 10 seconds for 5‐15 minutes. The maximum, minimum, and average CO2 levels, classroom population, and numbers of open windows and doors (at the time of measurement), were recorded (Appendix S1). Because indoor CO2 in congregate settings rarely achieve steady state,16 we used the monthly maximum of daily averages of indoor CO2 levels as the best estimate17 for the theoretical steady‐state value in calculating the corresponding ventilation rate. We performed a sensitivity analysis which uses monthly median of daily averages of indoor CO2 levels in estimating the effect of ventilation on infection risk.
2.6. Estimation of ventilation rate
The relationship between the steady‐state indoor CO2 level (which represents the per person ventilation) and room ventilation rate Q is given by Issarow et al17:
Here, Q is ventilation rate (L/s), which we wanted to estimate. C E is the CO2 level of outdoor ambient air (400 ppm), n is the number of room occupants, p is the breathing rate, and C a is the concentration in exhaled breath. For a standard classroom (180 m3) with 30 students, substituting pC a by average CO2 generation rate (0.0048 L/s per person),18 a CO2 level of 3204 ppm (before intervention) is equivalent to 1.7 L/s per person. After ventilation engineering, the CO2 levels decreased to 591‐603 ppm, equivalent to 23.6‐25.1 L/s per person.
2.7. Secondary attack rate
We compared the secondary attack rate in contacts of TB cases notified before the completion of ventilation engineering on January 16, 2012, (before intervention) and the secondary attack rate in contacts of TB cases notified after the completion of ventilation engineering on January 16, 2012, (after intervention). All contacts were followed up to July 31, 2018.
2.8. Effect of ventilation improvement
The effect of ventilatory improvement on reducing TB incidence among contacts was estimated by the following formula:11
2.9. Statistical analysis
Proportions and rates were compared with chi‐square (or Fisher's exact test) and chi‐score test, respectively. For time‐to‐event analysis, the zero time of follow‐up for each contact is the diagnosis date of the source case (index date). The end of follow‐up was the date when the contact was notified as an active TB case (event), the date of mortality due to non‐TB‐related causes (censored), or July 31, 2018 (censored). To control the effect of isoniazid preventive therapy (100% effective, none of the 173 [0%] contacts who received isoniazid preventive therapy acquired TB), person‐time after the date of starting isoniazid preventive therapy was censored. Probabilities of TB were estimated by Kaplan‐Meier method and compared using log‐rank test. Cox regression and logistic regression were used to adjust for covariates. All analyses were conducted using SAS ver. 9.2 (SAS Institute). A two‐sided P < .05 was considered statistically significant.
2.10. Ethical statement
The Institutional Review Board of Taiwan Centers for Diseases Control (Taipei, Taiwan) approved the study procedure as public health surveillance, which does not require informed consent.
3. RESULTS
3.1. Epidemiological investigation
A total of 27 active TB cases (mean age:23 years, all previously healthy) were identified. Fifteen cases were confirmed by sputum culture of strains with an identical DNA fingerprint. Twelve cases were confirmed by serial CXR findings and response to anti‐TB treatment as well as epidemiological link to one of DNA fingerprinting‐confirmed cases. Figure 3 shows the chains of transmission (index case, secondary cases, and tertiary cases). There were four DNA fingerprinting‐confirmed active TB case whose source case was uncertain (see Figure 3 legend for details).
3.2. Initial ventilation assessment
Ventilation specialists from the Taiwan Institute of Labor, Occupational Safety and Health (ILOSH) inspected the classrooms in the underground floors of Building C on October 13, 2011. The CO2 level measured at Classroom CB307 (in B3 floor) where the index case had attended the class was as high as 3204 ppm. The CO2 level measured at Classroom CB202 in B2 floor was 2926 ppm (Appendix S1). Furthermore, the CO2 level measured at the inlet of air flow (see the floorplan in Figure 1) was 1600 ppm, which indicates that the airflow in underground floors were nearly 100% recirculation, with little inflow of fresh air from the outside. The authority enforced ventilation engineering.
3.3. Ventilation engineering
The intervention consisted of: (a) for the ground floor and above, keeping the windows open (to serve as air outlets) to facilitate both natural and mechanical ventilation; and (b) for the underground floors, installing extractor ventilation machines to improve air outflow (see Figure 1 legend for details), along with constructing new ventilatory circuits for Building C to normalize the outflow of exhaled air so that the pre‐existing inlet pipes from the roof could function as designed (see Figure 1 and Appendix S2). The above intervention decreased ground floor CO2 levels to 700‐800 ppm (measured on December 9, 2011), but the CO2 levels on underground floors were still up to 1413 ppm (Appendix S1). A glass wall at the ground floor door in Building C (Figure 4A) blocked the outflow of exhaled air (through a stairway) from classrooms on the three underground floors. The outbreak coordination committee therefore recommended removing the aforementioned glass wall, which was subsequently removed on January 16, 2012 (Figure 4B). After these interventions, the ventilation levels in Building C improved to 370‐400 ppm on the ground floor and 591‐603 ppm (23.6‐25.1 L/s per person) on the underground floors (Figure 3). The same ventilation engineering work were implemented in other buildings as well.
Figure 4.
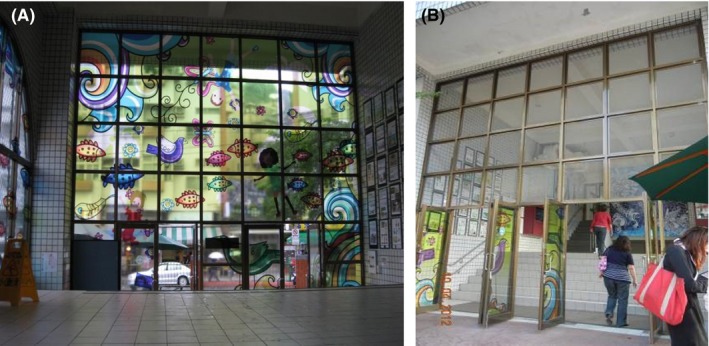
The un‐openable glass wall at the front door of the ground floor of Building C, which obstructed the ventilation of underground floor classrooms. (A), before intervention and (B) after removal of upper two‐third glass (replaced with insect screen)
3.4. Impact of ventilation on secondary attack rate in University A
After ventilation engineering, the secondary attack rate of university contacts dropped to zero (contacts of TB cases notified before January 16, 2012:20/728 [2.7%] vs contacts of TB cases notified after January 16, 2012:0/278 [0.0%], P = .002, follow‐up to July 31, 2018, for a mean of 5.9 years). The drop in secondary attack rate was not due to CXR screening that may detect less infectious cases (20/634 [3.0%] vs 0/275 [0.0%], after excluding contacts of cases detected by mass CXR screening, P < .001), nor was it caused by treatment of LTBI (20/1 480 411 vs 0/544 752 person‐days, after excluding person‐time after starting isoniazid preventive therapy, P = .007).
3.5. Ventilation levels and risk for contacts to become new infectious TB cases
Table 1 shows demographic and epidemiological information for 1665 contacts (including 1006 school contacts, 214 contacts at a private tutoring class [where Case 8 attended], 96 household contacts, and 352 contacts in other settings) involved in this outbreak. Exposure to source cases under indoor CO2 >1000 ppm (n = 942, including the 728 school contacts exposed before January 16, 2012, and 214 contacts at a private tutoring class where an indoor CO2 level of 1022 ppm, Table S4) was associated with a higher risk for the contacts to become new infectious TB cases (P < .001, median time from exposure to TB notification: 11 months,19 interquartile range: 6‐18 months, person‐time after the start of LTBI treatment was censored, Figure 5). One of the 214 contacts at the private tutoring class acquired active TB (Table 1). Therefore, CO2 level of 1022 ppm was not safe. The only one contact in the CO2 level <1000 ppm category who acquired active TB (Table 1) was the index patient's younger sister, who had prolonged close household contact with the index patient.
Table 1.
Characteristics of the 1665 contacts involved in the outbreaka
| Variables | Acquired TB (n = 22)b | Did not acquire TB (n = 1643) | P value |
|---|---|---|---|
| No. (%) | No. (%) | ||
| Age (y), median (min, max) | 20.0 (15.9‐39.8) | 21.8 (2.4‐94.0) | .441 |
| <15 | 0 (0) | 14 (0.9) | |
| 16‐25 | 21 (95.5) | 1227 (74.7) | |
| 26‐35 | 0 (0) | 120 (7.3) | |
| 36‐45 | 1 (4.6) | 73 (4.4) | |
| 46‐55 | 0 (0) | 129 (7.9) | |
| 56‐65 | 0 (0) | 62 (3.8) | |
| ≥65 | 0 (0) | 18 (1.1) | |
| Sex | |||
| Male | 8 (33.4) | 855 (52.0) | .144 |
| Female | 14 (66.7) | 788 (47.9) | |
| Source patient sputum smear results | |||
| Negative or scanty | 0 (0.0) | 630 (38.3) | <.0001 |
| Positive | 22 (100.0) | 1013 (61.7) | |
| Context of contacts | |||
| University contacts | 19 (86.4) | 984 (60.0) | .031 |
| Household contactsc | 2 (9.5) | 94 (5.7) | |
| Private tutoring class | 1 (4.8) | 213 (13.0) | |
| Contacts in other settingsd | 0 (0) | 352 (21.4) | |
| Contacts of the index case | |||
| No | 3 (13.6) | 1522 (92.6) | <.0001 |
| Yes | 19 (86.4) | 121 (7.4) | |
| Isoniazid preventive therapy | |||
| No | 22 (100.0) | 1470 (89.5) | .158 |
| Yes | 0 (0) | 173 (10.5) | |
| Contact under CO2 level >1000 ppme | |||
| No | 1 (4.6)f | 722 (43.9) | <.0001 |
| Yes | 21 (95.5) | 921 (56.1) | |
P value, by chi‐square test or Fisher's exact test (if the sample size is smaller than five).
Abbreviations: CO2, carbon dioxide; ppm, parts per million; TB, tuberculosis.
All student, staff, and faculty with a cumulative 30‐40 h exposure to shared air (defined as staying in the same floor or within the same building with any infectious TB patient) were considered as contacts. Public health nurses used administrative data (lists of students/faculties/employee, curriculum, and class rosters) and results from a structured questionnaire to identify contacts as many as possible. Initially, 40 h were used. However, one contact with 30 h exposure to the index case became Case 3. Thereafter, the authority updated the operative definition for university contacts to a cumulative 30 h exposure to shared air, due to the severely underventilated environment in University A.
The total 27 TB cases in this outbreak include the index case (Case 0), twenty‐two contacts who acquired active TB during follow‐up, and four additional TB cases who had exposure to shared air with infectious TB cases but did not meet the operative definition of contact (see the legend of Figure 3).
Three household contacts were also university contacts (one is the index case's sister, who acquired active TB, and two are Case 5's roommates who attended the same school).
Friends (n = 19), workplace contacts (n = 165), flight contacts (n = 3), contacts at another university (n = 165).
Defined as having an indoor air CO2 level >1000 ppm at the time of exposure. Contacts in this category include the 728 university contacts who were exposed to TB patients in this outbreak before the ventilation engineering was completed on January 16, 2012. One TB patient (Case 8) attended a private tutoring class. Public health inspectors found the tutoring class had a CO2 level of 1022 ppm. Therefore, the 214 tutoring class attendees were also considered to have been exposed to TB patients in environment with a CO2 level >1000 ppm.
This is a household contact.
Figure 5.
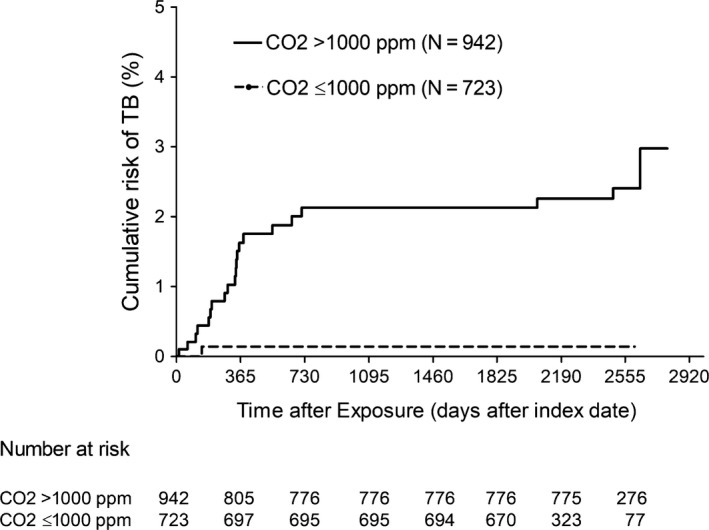
Kaplan‐Meier estimates for the risk of contacts to become new infectious tuberculosis (TB) cases, by ventilation status at the time of exposure to source cases (person‐time after the start of isoniazid preventive therapy was censored)
3.6. Effect of ventilation improvement
After adjusting for exposure to “super spreader” (the index case, Case 0), proximity of contact (household) and LTBI treatment (by censoring person‐time after the start of LTBI treatment), Cox regression revealed that among 1035 contacts of smear‐positive source cases, exposure to source cases under indoor CO2 >1000 ppm was a major risk factor for contacts to become new infectious TB cases (adjusted hazard ratio 32.8 [95% CI:2.0‐540.3]) (Table 2). Ventilation improvement to levels with CO2 <1000 ppm was associated with a 97% decrease in incidence of infectious TB cases among contacts (95% CI:50%‐99.9%).
Table 2.
Risk factors for 1035 smear‐positive contacts to acquire active TB
| Variates | No. of TB casesa in each category of the contact (%) | Univariable | Multivariable | ||||
|---|---|---|---|---|---|---|---|
| HR | 95% CI | P value | Adjusted HR | 95% CI | P value | ||
| Contacts of index case | |||||||
| No | 3/895 (0.3) | 1.0 | 1.0 | ||||
| Yes | 19/140 (13.6) | 46.5 | 38.7‐157.7 | <.0001 | 27.9 | 8.1‐96.9 | <.0001 |
| Household contacts | |||||||
| No | 20/995 (2.0) | 1.0 | 1.0 | ||||
| Yes | 2/40 (5.0) | 2.7 | 0.6‐11.7 | .1796 | 57.5 | 6.8‐487.1 | .0002 |
| Contact under CO2 level >1000 ppm | |||||||
| No | 1/449 (0.2) | 1.0 | |||||
| Yes | 21/586 (3.6) | 14.3 | 1.9‐107.0 | .0095 | 32.8 | 2.0‐540.3 | .0145 |
Abbreviations: CO2, carbon dioxide; HR, hazard ratio; ppm, parts per million; TB, tuberculosis.
We used Cox regression to estimate the hazard ratio associated with exposure to source cases under poorly ventilated (operatively defined as CO2 levels >1000 ppm) environments among the contacts, adjusting for infectiousness of source cases (index case) or proximity of contact (household). For each contact, the zero time was the diagnosis date of the source case. The end of follow‐up was the date when the contact was notified as an active TB case (event), the date of starting isoniazid preventive therapy (censored), the date of any mortality due to non‐TB‐related causes (censored), or July 31, 2018 (censored).
3.7. Risk of LTBI
LTBI was diagnosed in 302 of the 667 contacts who received TST. Exposure under CO2 >1000 ppm environment was associated with a significantly higher likelihood of LTBI (245/488 [50.2%] vs 57/179 [31.8%], P < .001). Logistic regression revealed that after adjusting for the higher infectiousness of the index case, exposure to source cases under CO2 >1000 ppm in the university buildings before the intervention was also a risk factor for contacts to have LTBI (adjusted odds ratio 1.6 [95% CI:1.1‐2.3], P = .014) (Table 3). Ventilation improvement to levels with indoor CO2 <1000 ppm was associated with a 38% decrease in likelihood of LTBI among the contacts (95% CI: 9%‐57%).
Table 3.
Risk factors for 667 contacts to have latent TB infection
| Variates | No. of LTBI casesa in each category of the contact (%) | Univariable | Multivariable | ||||
|---|---|---|---|---|---|---|---|
| OR | 95% CI | P value | Adjusted OR | 95%CI | P value | ||
| Contacts of index caseb | |||||||
| No | 222/565 (39.3) | 1.0 | 1.0 | ||||
| Yes | 80/102 (78.4) | 5.6 | 3.4‐9.3 | <.0001 | 4.9 | 2.9‐8.1 | <.0001 |
| Contact under CO2 level >1000 ppm | |||||||
| No | 57/179 (31.8) | 1.0 | 1.0 | ||||
| Yes | 45/488 (50.2) | 2.2 | 1.5‐3.1 | <.0001 | 1.6 | 1.1‐2.3 | .014 |
Abbreviations: CO2, carbon dioxide; LTBI, latent TB infection; OR, odds ratio; ppm, parts per million; TB, tuberculosis.
Number of latent TB infection cases, defined as a positive tuberculin skin test using a cutoff point of 10 mm.
All 102 contacts of the index case were exposed under poorly ventilated environment (CO2 levels >1000 ppm).
3.8. Sensitivity analysis
Replacement of monthly maximum CO2 value with monthly median CO2 level (Figure S1) did not alter the exposure categories of contacts in Tables 1, 2, 3, and Figure 5 and therefore did not alter the analysis results.
4. DISCUSSION
This study provides the first empirical data showing that improving indoor ventilation to levels with CO2 <1000 ppm is highly effective in controlling a TB outbreak which occurred in poorly ventilated indoor environment. Improving ventilation to indoor CO2 levels <1000 ppm was associated with a 97% decrease in risk for contacts to become new infectious TB cases and helped to end the TB outbreak in University A.
Prompt diagnosis, isolation, and treatment for both TB and LTBI are essential for the control of this outbreak. However, these chemotherapy‐based interventions in University A were less successful than what should be expected. The role of poor ventilation in this outbreak was discovered precisely because of the ongoing occurrence of tertiary cases despite early removal of the index case 1 year ago. The worsening situation in October 2011 prompted investigations of indoor ventilation and the subsequent ventilation engineering. In retrospect, infectious aerosol accumulated in the poorly ventilated environment. Without the ventilation improvement, the outbreak in University A would be more prolonged and more difficult to control. The limitation of chemotherapy‐based interventions is further highlighted by four cases who did not have identifiable sources but nevertheless acquired the outbreak TB strain (Figure 3). They may have entered a classroom or a floor for unrecorded activity and breathed the exhaled air from prior occupants. In such scenarios, TB transmission may occur even when the sources were not there. This makes contact investigation and preventive therapy not the answer for controlling of TB in congregate settings.
A major strength of this study is the comprehensive epidemiological investigation. The outbreak investigation team found that TB transmission can occur following an exposure to shared air as short as 30 hours under poorly ventilated environments. Another strength is the comprehensive contact tracing and long‐term follow‐up based on Taiwan's highly effective public health system.13 The TST and clinical/radiographic evaluation to detect active TB also followed standardized protocols. With the assistance of civil registration and a centralized cloud‐based contagious disease database, the NSNCD, follow‐up was nearly complete.
The NIOSH and other governmental agencies had recommended indoor air quality standards based on CO2 levels of 600‐1500 ppm for schools and workplaces.20, 21, 22 The considerations for these recommendations are for comfort and learning/working efficiency. Our results support the hypothesis that there is a threshold of ventilation rate that stop TB epidemic. However, our data are not precise enough to exactly define this threshold, which could be in between 600 and 1000 ppm CO2 in this outbreak. Moreover, the threshold could vary across different TB outbreak—a higher ventilation rate would be required to neutralize the hazard from a more infectious index case.
In response to the nosocomial multidrug‐resistant (MDR) TB outbreaks crisis in 1990s, the United States Centers for Disease Control and Prevention (CDC) issued a 3‐tiered strategy: administrative control (prompt isolation of TB patients), environmental control (isolation room, ventilation and germicidal ultraviolet), and personal protective equipment (mask).6, 7, 23 CDC recommended that airborne infection isolation rooms should have a ventilation rate of at least 12 air changes per hour (ACH), based on engineering specifications for removing airborne particles, with high‐efficient particulate air (HEPA) filtering for re‐circulated air if non‐recirculating local exhaust ventilation is not feasible.6 After implementation, no more new cases occurred.23, 24 The respective contribution from each tier in this strategy cannot be separately evaluated. Nevertheless, this success is in keeping with our observation that improving ventilation rate to 23.6‐25.1 L/s per person (equivalent to 14‐15 ACH) helped to end the TB outbreak in University A.
Since 2009, World Health Organization (WHO) recommend healthcare facilities should be built to have a natural ventilation rate of at least 12 ACH.8, 25 WHO recently reviewed evidence on effect of ventilation in TB control and identified 10 observational studies which reported the impact of multi‐tiered control strategy on TST conversion rate among healthcare workers.8 High heterogenicity in study design and compliance to environmental control guidelines precluded a meta‐analysis. WHO considered further assessment on the effect of ventilation in TB control as a research priority.8 Our results show that improving indoor ventilation rate to levels equivalent to 14‐15 ACH is highly effective in controlling a TB outbreak. Our findings strengthen the evidence base for the current WHO recommendation on the ventilation requirement for healthcare facilities.
One limitation of our study is the lack of baseline TST data prior to the outbreak. Taiwan is a middle‐burden country with an annual TB incidence of 53.0 cases per 100 000 residents in 2012.26 TST is not required for new students upon admission to universities in Taiwan. The lack of baseline TST data before this outbreak makes it impossible to use TST conversion (ie, incident LTBI) to measure the impact of ventilation improvement on TB transmission. Given the limitation in interpretation, the analyses still show that the ventilation improvement was associated with 38% decrease in likelihood of LTBI. Another limitation of this study is the lack of information on Bacillus Calmette‐Guerin (BCG) vaccine history,27 HIV status,28 comorbidities such as diabetes mellitus29 or rheumatoid arthritis30 for the contacts. This information is considered private and therefore inaccessible by public health surveillance in Taiwan; however, the above‐stated host conditions were unlikely to confound the analyses. First, BCG has been a universal vaccination at birth in Taiwan since 1965,27 with more than a 95% vaccination rate in this generation of college students. The student cohort in this outbreak only received single dose of BCG at their birth, although some teachers or employees might have received a booster dose while in elementary school.27 Second, the HIV prevalence is very low in Taiwan (approximately 0.1%) and is concentrated in specific high‐risk groups, that is, people who inject drug and men who have sex with men.31 Third, an overwhelming majority of the contacts and the patients were healthy and active 18‐22‐year‐old young college students (Table 1), an age range during which comorbidities should be rare.
Until now, Global End TB Strategy has focused on early diagnosis and effective treatment of active TB and preventive therapy for LTBI in high burden resource‐limited countries,32 and so far had a limited impact on TB epidemic trajectory.2 As a comparison, in developed countries, the improvement in indoor ventilation as part of a general improvement in public health from the nineteenth to twentieth centuries was followed by a dramatic reduction in TB incidence before the era of anti‐TB chemotherapy.12, 33, 34 Interventions to maintain adequate indoor ventilation (to decrease airborne TB transmission) act at an earlier stage in the chain of events and therefore would be synergistic in the current global effort to end TB by greatly reducing the task and burden of subsequent diagnosis and treatment.
In conclusion, the present study shows that maintaining adequate indoor ventilation could be a highly effective strategy for controlling TB outbreaks. Our findings highlight the need to assess indoor ventilation status in TB outbreak investigation. In congregate settings where there is known to be a high risk of TB, it may be beneficial to make pre‐emptive improvements to building ventilation. A refocusing on the importance of adequate ventilation in TB control may prevent hundreds of thousands of TB cases from occurring12, 35, 36 and therefore could be the game changer for achieving the global End TB target.
CONFLICT OF INTEREST
All authors have no conflict of interest.
AUTHOR CONTRIBUTIONS
C‐TF designed the study. C‐RD oversaw the outbreak investigation and intervention. S‐CW assessed the ventilation situation at University A and made critical recommendations. M‐CY, T‐FC, J‐YW, and P‐C Chan read chest radiographs of the patients and contacts, diagnosed active and latent TB, and treated the patients and contacts with latent TB. P‐C Chuang and RWJ performed DNA fingerprinting. C‐RD obtained ethical approval and verified baseline and follow‐up information of patients and contacts. P‐C Chan and C‐RD did the statistical analysis. C‐TF, P‐C Chan, and C‐RD wrote the manuscript. All authors read and approved the submitted version of the manuscript. P‐C Chan and C‐TF contributed equally to the study.
Supporting information
ACKNOWLEDGEMENTS
We thank the public health workers in Taipei City, New Taipei City, Keelung City, and the Centers for Diseases Control, Taiwan, who were involved in investigating and controlling this outbreak. We thank Geoff Hughes for assistance in copyediting. The findings and conclusions in this article are those of the authors and do not necessarily represent the official position of Taiwan Centers for Disease Control (Taipei, Taiwan). Preliminary follow‐up data and analyses till the end of 2013 were part of the Master thesis of the first author, Chun‐Ru Du, at the National Taiwan University (2015). Some of this study's initial findings have been accepted in the form of an abstract in the poster discussion session at the 47th Union World Conference on Lung Health and were reported to attendees on October 26, 2016, in Liverpool, United Kingdom. There was no funding for this investigation.
Du C‐R, Wang S‐C, Yu M‐C, et al. Effect of ventilation improvement during a tuberculosis outbreak in underventilated university buildings. Indoor Air. 2020;30:422–432. 10.1111/ina.12639
Pei‐Chun Chan and Chi‐Tai Fang are contributed equally.
Contributor Information
Pei‐Chun Chan, Email: pcanita.tw@cdc.gov.tw.
Chi‐Tai Fang, Email: fangct@ntu.edu.tw.
REFERENCES
- 1. World Health Organization . Global Tuberculosis Report 2018. Geneva: World Health Organization; 2018. Licence: CC BY‐NCSA 3.0 IGO. [Google Scholar]
- 2. Yates TA, Tanser F, Abubakar I. Plan Beta for tuberculosis: it's time to think seriously about poorly ventilated congregate settings. Int J Tuberc Lung Dis. 2016;20(1):5‐10. [DOI] [PMC free article] [PubMed] [Google Scholar]
- 3. Riley RL, Mills CC, Nyka W, et al. Aerial dissemination of pulmonary tuberculosis. A two‐year study of contagion in a tuberculosis ward. 1959. Am J Epidemiol. 1995;142(1):3‐14. [DOI] [PubMed] [Google Scholar]
- 4. Escombe AR,Oeser CC, Gilman RH, et al. Natural ventilation for the prevention of airborne contagion. PLoS Med. 2007;4(2):e68. [DOI] [PMC free article] [PubMed] [Google Scholar]
- 5. Menzies D, Fanning A, Yuan L, FitzGerald JM. Hospital ventilation and risk for tuberculous infection in Canadian health care workers. Canadian Collaborative Group in Nosocomial Transmission of TB. Ann Intern Med. 2000;133(10):779‐789. [DOI] [PubMed] [Google Scholar]
- 6. Sehulster L, Chinn RY. Guidelines for environmental infection control in health‐care facilities. Recommendations of CDC and the Healthcare Infection Control Practices Advisory Committee (HICPAC). MMWR Recomm Rep. 2003;52(Rr‐10):1‐42. [PubMed] [Google Scholar]
- 7. Jensen PA, Lambert LA, Iademarco MF, Ridzon R. Guidelines for preventing the transmission of Mycobacterium tuberculosis in health‐care settings, 2005 (US Department of Health and Human Services: Public Health Service, Centers for Disease Control and Prevention). MMWR Recomm Rep. 2005;54:1‐141. [PubMed] [Google Scholar]
- 8. World Health Organization . WHO Guidelines on Tuberculosis Infection Prevention and Control, 2019 Update, Geneva: World Health Organization; 2019. License: CC BY‐NC‐SA 3.0 IGO. [PubMed] [Google Scholar]
- 9. Li Y, Leung GM, Tang JW, et al. Role of ventilation in airborne transmission of infectious agents in the built environment – a multidisciplinary systematic review. Indoor Air. 2007;17(1):2‐18. [DOI] [PubMed] [Google Scholar]
- 10. Nardell EA, Keegan J, Cheney SA, Etkind SC. Airborne infection: theoretical limits of protection achievable by building ventilation. Am Rev Respir Dis. 1991;144(2):302‐306. [DOI] [PubMed] [Google Scholar]
- 11. Rothman KJ. Epidemiology: An Introduction. New York, NY: Oxford University Press; 2012. [Google Scholar]
- 12. Richardson ET, Morrow CD, Kalil DB, Ginsberg S, Bekker LG, Wood R. Shared air: a renewed focus on ventilation for the prevention of tuberculosis transmission. PLoS ONE. 2014;9(5):e96334. [DOI] [PMC free article] [PubMed] [Google Scholar]
- 13. Chan PC, Shinn‐Forng Peng S, Chiou MY et al. Risk for tuberculosis in child contacts. Development and validation of a predictive score. Am J Respir Crit Care Med. 2014;189(2):203‐213. [DOI] [PubMed] [Google Scholar]
- 14. Van Embden J, Cave MD, Crawford JT, et al. Strain identification of Mycobacterium tuberculosis by DNA fingerprinting: recommendations for a standardized methodology. J Clin Microbiol. 1993;31(2):406‐409. [DOI] [PMC free article] [PubMed] [Google Scholar]
- 15. TSI . Model 8760/8762 IAQ‐CALCTM Indoor Air Quality Meters —Operation and Service Manual 1980406m Revision G; 2004.
- 16. Rudnick SN, Milton DK. Risk of indoor airborne infection transmission estimated from carbon dioxide concentration. Indoor Air. 2003;13(3):237‐245. [DOI] [PubMed] [Google Scholar]
- 17. Issarow CM, Mulder N, Wood R. Modelling the risk of airborne infectious disease using exhaled air. J Theor Biol. 2015;372:100‐106. [DOI] [PubMed] [Google Scholar]
- 18. Persily A, De Jonge L. Carbon dioxide generation rates for building occupants. Indoor Air. 2017;27(5):868‐879. [DOI] [PMC free article] [PubMed] [Google Scholar]
- 19. Behr MA, Edelstein PH, Ramakrishnan L. Revisiting the timetable of tuberculosis. BMJ. 2018;362:k2738. [DOI] [PMC free article] [PubMed] [Google Scholar]
- 20. National Institute for Occupational Safety and Health, USA (2015) Indoor environmental quality. http://www.cdc.gov/niosh/topics/indoorenv/hvac.html. Accessed December 1, 2019.
- 21. Bakó‐Biró Z, Clements‐Croome DJ, Kochhar N, Awbi HB, Williams MJ. Ventilation rates in schools and pupils' performance. Build Environ. 2012;48:215‐223. [Google Scholar]
- 22. Indoor Air Quality Promotion Center , Environmental Protection Department, Environment Bureau , Hong Kong (November 19, 2015) Indoor air quality management programme. http://www.iaq.gov.hk/en/faq.aspx. Accessed December 1, 2019.
- 23. Blumberg HM, Watkins DL, Berschling JD et al. Preventing the nosocomial transmission of tuberculosis. Ann Intern Med. 1995;122(9):658‐663. [DOI] [PubMed] [Google Scholar]
- 24. Wenger PN, Beck‐Sague CM, Jarvis WR, Otten J, Breeden A, Orfas D. Control of nosocomial transmission of multidrug‐resistant Mycobacterium tuberculosis among healthcare workers and HIV‐infected patients. Lancet. 1995;345(8944):235‐240. [DOI] [PubMed] [Google Scholar]
- 25. World Health Organization (2009). Natural ventilation for infection control in health‐care settings. http://www.who.int/water_sanitation_health/publications/natural_ventilation/en/. Accessed December 1, 2019. [PubMed]
- 26. Taiwan Centers for Disease Control (2014) Taiwan tuberculosis control report 2013. https://www.cdc.gov.tw/InfectionReport/Info/upxJr9t9iKeSbo_Wpacpuw?infoId=3ucTy67l0YAVwdKC3dTBag. Accessed December 1, 2019.
- 27. Chan PC, Yang CH, Chang LY et al. Lower prevalence of tuberculosis infection in BCG vaccinees: a cross‐sectional study in adult prison inmates. Thorax. 2013;68(3):263‐268. [DOI] [PubMed] [Google Scholar]
- 28. Selwyn PA, Hartel D, Lewis VA et al. A prospective study of the risk of tuberculosis among intravenous drug users with human immunodeficiency virus infection. N Engl J Med. 1989;320(9):545‐550. [DOI] [PubMed] [Google Scholar]
- 29. Jeon CY, Murray MB. Diabetes mellitus increases the risk of active tuberculosis: a systematic review of 13 observational studies. PLoS Medicine. 2008;5(7):e152. [DOI] [PMC free article] [PubMed] [Google Scholar]
- 30. Dixon WG, Hyrich KL, Watson KD et al. Drug‐specific risk of tuberculosis in patients with rheumatoid arthritis treated with anti‐TNF therapy: results from the British Society for Rheumatology Biologics Register (BSRBR). Ann Rheum Dis. 2010;69(3):522‐528. [DOI] [PMC free article] [PubMed] [Google Scholar]
- 31. Taiwan Centers for Disease Control .Statistics of HIV/AIDS. https://www.cdc.gov.tw/Category/Page/rCV9N1rGUz9wNr8lggsh2Q. Accessed December 1, 2019.
- 32. World Health Organization (2016) The End TB Strategy: global strategy and targets for tuberculosis prevention, care and control after 2015. http://www.who.int/tb/post2015_TBstrategy.pdf. Accessed December 1, 2019.
- 33. Dubos R, Dubos J. The White Plague: Tuberculosis, Man, and Society. New Brunswick, NJ: Rutgers University Press; 1952. [Google Scholar]
- 34. Lienhardt C. From exposure to disease: the role of environmental factors in susceptibility to and development of tuberculosis. Epidemiol Rev. 2001;23(2):288‐301. [DOI] [PubMed] [Google Scholar]
- 35. Taylor JG, Yates TA, Mthethwa M, Tanser F, Abubakar I, Altamirano H. Measuring ventilation and modelling M tuberculosis transmission in indoor congregate settings, rural KwaZulu‐Natal. Int J Tuberc Lung Dis. 2016;20(9):1155‐1161. [DOI] [PMC free article] [PubMed] [Google Scholar]
- 36. Andrews JR, Morrow C, Wood R. Modeling the role of public transportation in sustaining tuberculosis transmission in South Africa. Am J Epidemiol. 2013;177(6):556‐561. [DOI] [PMC free article] [PubMed] [Google Scholar]
Associated Data
This section collects any data citations, data availability statements, or supplementary materials included in this article.
Supplementary Materials