Abstract
During metazoan development, immune surveillance and cancer dissemination, cells migrate in complex three-dimensional microenvironments1–3. These spaces are crowded by cells and extracellular matrix, generating mazes with differently sized gaps that are typically smaller than the diameter of the migrating cell4,5. Most mesenchymal and epithelial cells and some, but not all, cancer cells actively generate their migratory path using pericellular tissue proteolysis6. By contrast, amoeboid cells such as leukocytes use non-destructive strategies of locomotion7, raising the question how these extremely fast cells navigate through dense tissues. Here we reveal that leukocytes sample their immediate vicinity for large pore sizes, and are thereby able to choose the path of least resistance. This allows them to circumnavigate local obstacles while effectively following global directional cues such as chemotactic gradients. Pore-size discrimination is facilitated by frontward positioning of the nucleus, which enables the cells to use their bulkiest compartment as a mechanical gauge. Once the nucleus and the closely associated microtubule organizing centre pass the largest pore, cytoplasmic protrusions still lingering in smaller pores are retracted. These retractions are coordinated by dynamic microtubules; when microtubules are disrupted, migrating cells lose coherence and frequently fragment into migratory cytoplasmic pieces. As nuclear positioning in front of the microtubule organizing centre is a typical feature of amoeboid migration, our findings link the fundamental organization of cellular polarity to the strategy of locomotion.
During development and immune surveillance, trafficking cells typically follow chemotactic cues, which globally prescribe direction and destination of migration8. At the same time, cells have to negotiate the local physical environment9 and traverse or circumnavigate obstacles within inhomogeneous tissues4,5. Rapidly migrating cells such as leukocytes rarely cause permanent tissue defects by proteolysis or rearrangement of the extracellular matrix7,10, which suggests that they are able to adapt their migratory path to the physical constraints of their immediate environment.
As a model system for rapid amoeboid migration of leukocytes in 3D microenvironments, we imaged dendritic cells (DCs) expressing LifeAct–GFP embedded in fluorescent 3D collagen gels by light-sheet microscopy with isotropic, subcellular 3D resolution11. Collagen fibres assembled into a 3D network with pore diameters ranging between 1 μm and 5 μm (Extended Data Fig. 1a–c, Supplementary Video 1) into which DCs inserted multiple actin-rich protrusions (Fig. 1a, b, Extended Data Fig. 1d, Supplementary Video 1). To investigate how single cells respond to differential pore-size regimes we spiked collagen gels with islands of higher network density and established gradients of the chemokine CCL19, which chemoattracts mature DCs (Fig. 1c–e). When chemotaxing DCs approached a dense island head-on, thus encountering a broad area of denser matrix, they steadily transited from the low-density matrix to the high-density matrix (Fig. 1c and Supplementary Video 2). Following this transition, they decelerated but continued to migrate towards the chemokine source (Fig. 1c and Extended Data Fig. 1e). By contrast, cells approaching a dense island on more tangential trajectories preferentially remained in regions of lower collagen density, thus deviating from the direct path as prescribed by the chemotactic gradient (Fig. 1c and Supplementary Video 2). These findings suggest that DCs follow the path of least resistance: whenever the option is available, they circumnavigate local areas of high matrix density, thereby trading the shortest path for migratory speed.
Fig. 1 |. Migrating cells are selective for pore size.
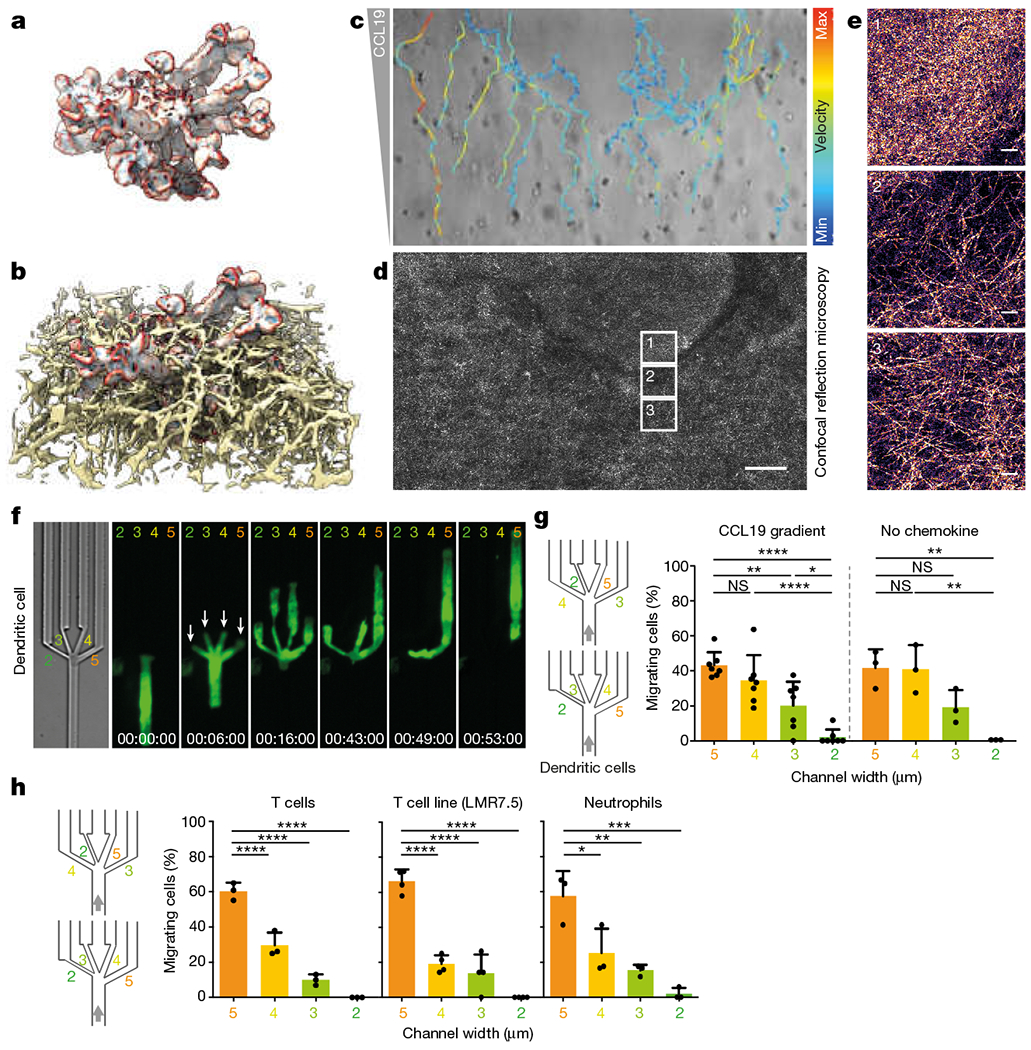
a, A DC (LifeAct-GFP-labelled) embedded in a 3D collagen matrix (Alexa Fluor 568-labelled) and imaged by light-sheet microscopy with isotropic, subcellular 3D resolution. Colouring on the DC surface indicates regions of large positive and negative curvature in red and blue, respectively. Image representative of 24 cells from five experiments. b, Subvolume of the collagen matrix surrounding the DC depicted in a. Image representative of 24 cells from five experiments. c, Migratory tracks (velocity colour coding) of DCs along a CCL19 chemokine gradient in a collagen matrix spiked with a region of higher collagen density (three experiments). d, Confocal reflection microscopy of the same collagen matrix shown in b (three experiments). Scale bar, 100 μm. e, Enlargement of regions in boxes 1, 2 and 3 in c, exemplifying regions of higher (top) and lower (middle and bottom) collagen densities. Scale bar, 10 μm. f, Protrusion dynamics of the leading edge of a DC, labelled with LifeAct–GFP, during migration in microchannels through a junction (decision point) with four differently sized pores 2, 3, 4 and 5 μm wide (4 μm height). Arrows highlight early establishment of cell-front protrusions into all different pore sizes (3 experiments). g, Quantification of pore-size preference of DCs treated as in f, with (left; seven experiments, 119 cells; one-way ANOVA with Tukey’s test; ****P < 0.0001, **P = 0.0029, *P = 0.0225) or without (right; three experiments, 81 cells; one-way ANOVA with Tukey’s test; **P = 0.0049) CCL19 chemokine gradient. Pooled data from two devices with differently ordered sequences of pore size (2, 3, 4 and 5 μm or 4, 2, 5 and 3 μm, respectively). h, Migration of T cells, LMR7.5 hybridoma T cells and neutrophils in microchannels through a decision point of four differently sized pores of 2, 3, 4 and 5 μm wide (T cells, LMR7.5, 4 μm height; neutrophils, 2 μm height), and quantification of pore-size preference along a chemokine gradient (T cells (CCL19): three experiments, 68 cells; LMR7.5: 3 experiments, 40 cells; neutrophils (fMLP): three experiments, 46 cells; one-way ANOVA with Tukey’s test; ****P < 0.0001, ***P = 0.0007, **P = 0.0043, *P = 0.0193). Pooled data from two devices with differently ordered sequences of pore size (2, 3, 4 and 5 μm or 4, 2, 5 and 3 μm, respectively). Data in g and h are mean ± s.d. Time is indicated as h:min.s.
To test the mechanistic basis of local path-finding, we established DC migration in microfluidic setups, which enable precise control over geometric parameters. We used a pillar forest’, which represents a flat-tened approximation of a 3D collagen gel12 (Extended Data Fig. 1f–l). To introduce inhomogeneity, we placed pillars at alternating 2 μm and 5 μm intervals, and found that DCs preferentially passed through the larger pores (79.89% ± 6.15%, mean ± s.d.) (Extended Data Fig. 2a–d and Supplementary Video 3). When we engineered islands of densely packed pillars into less dense surroundings, DCs recapitulated the behaviour in heterogeneous collagen gels and bypassed dense areas (Extended Data Fig. 2e, Supplementary Video 2).
In a complex 3D scaffold, cells usually face multiple pores simultaneously (Fig. 1a). To investigate their capacity to discriminate among several pore sizes, we engineered channels guiding the cells towards a decision point, at which they encounter four differently sized pores between 2 and 5 μm width. DCs showed a strong pore-size preference, migrating predominantly through larger pores and ignoring smaller pores (Fig. 1f, g, Extended Data Fig. 2f, Supplementary Video 3). Pore-size discrimination was comparable in the absence or presence of a chemokine gradient (Fig. 1g, Extended Data Fig. 2g–i). When DCs faced a single pore, they passed through all pore sizes efficiently, albeit with longer passage times in smaller pore regimes (Extended Data Fig. 2j). To investigate whether pore-size selectivity is a general feature of amoeboid cells, we tested primary T cell blasts, a T cell line, and neutrophil granulocytes and found behaviours equivalent to DCs (Fig. 1h and Extended Data Fig. 3a–g). On the basis of these data we conclude that amoeboid cells have the ability to distinguish between differently sized pores and, when given the option, they preferentially migrate along the path of least resistance.
When DCs extended actin-rich protrusions into differently sized pores (Fig. 1f, Extended Data Fig. 4a, b, Supplementary Video 3), protrusion-retraction dynamics did not correlate with ultimate pore choice (Extended Data Fig. 4c). This argued against a selector function of the cell’s leading edge, which usually serves as the steering organelle. As the nucleus is often the bottleneck when cells migrate in 3D environments9,13–17, we tested whether the nucleus is involved in active directional choices18. Imaging nuclear positioning revealed that pore choice temporally coincided with nuclear passage (Fig. 2a), and that before passage, the nucleus massively deformed and protruded into multiple pores (Fig. 2b, Extended Data Figs. 4d–j, 5a–f, Supplementary Video 4). For the polymorph nucleus ofneutrophil granulocytes19, we even observed parallel penetration of nuclear lobes into different pores (Fig. 2c–e, Supplementary Video 8). These observations suggest that cells may use their nucleus as a mechanical gauge to choose their path. To functionally test this hypothesis, we spatially decoupled the decision point (the channel split) from the site at which the leading edge senses pore size (channel constriction) (Fig. 2f). We placed differently sized constrictions 10 μm upstream of the decision point where the channel splits into four equal branches. In these conditions, DCs lost their pore-size preference, even though the leading edges fully penetrated all constrictions (Fig. 2f, g). Together with observations that (i) DCs cannot distinguish pores larger than the nuclear diameter (Fig. 2h), (ii) overexpression of a stiffer mutant form of lamin A20,21 resulted in an increased propensity to pass through bigger pores (Extended Data Fig. 6a–c), (iii) enucleated cells are not pore-size selective (Fig. 2i, j), and (iv) nuclear positioning is actively driven by cytoskeletal forces (Extended Data Figs. 6d–h, 8e–g, Supplementary Video 5), these results suggest that the nucleus is the decisive mechanical gauge mediating navigation along the path of least resistance, and that protrusive structures such as lamellipodia22 act in a subordinate manner.
Fig. 2 |. The nucleus functions as a mechanical guide along the path of least resistance.
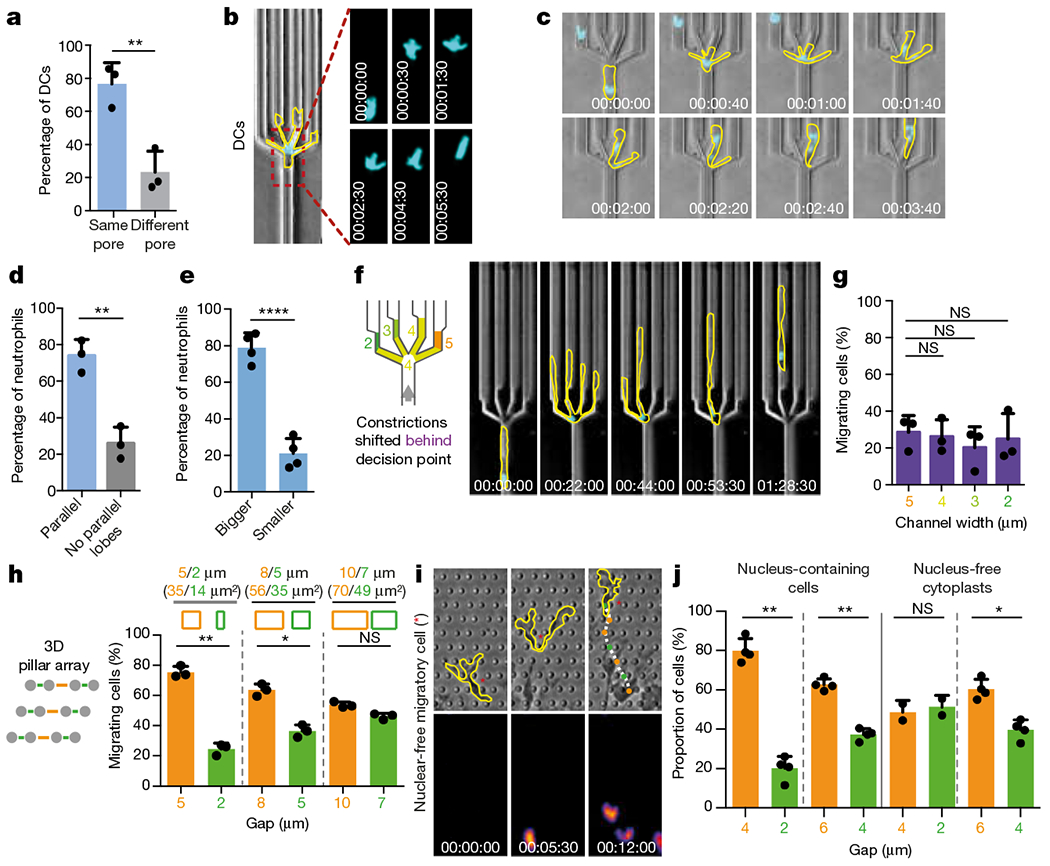
a, Correlation of initial nuclear translocation and final pore decision (three experiments, 61 cells; unpaired t-test, **P = 0.0068). b, Nuclear protrusion dynamics (Hoechst stain) during DC pore-size decision (cell outline in yellow, time indicated; representative of five experiments). c, Nuclear lobe dynamics (Hoechst stain) during neutrophil pore-size decision (cell outlines in yellow, time indicated; representative of three experiments). d, Quantification of parallel nuclear lobes into different pores during neutrophil pore-size decision (three experiments, 46 cells; unpaired t-test, **P = 0.0027). e, Pore-size selection by parallel nuclear lobes (four experiments, 71 cells; unpaired t-test, ****P < 0.0001). f, Spatial decoupling of the decision point (the channel split) from the site where the leading edge senses pore size (channel constriction) by locating the differently sized constrictions 10 μm upstream of the decision point (cell outlines in yellow, nucleus (Hoechst stain) in cyan, time indicated; representative of three experiments). g, Quantification of cell ‘decisions’ from f; pooled data from two devices with differently ordered sequences of pore size (2, 3, 4 and 5 μm or 4, 2, 5 and 3 μm, respectively; three experiments, 120 cells; one-way ANOVA with Tukey’s test). h, Pore-size preference of DCs in pillar arrays with pores of increasing size (three experiments, 62 cells, 1,148 pore passages; paired t-test; **P = 0.0073, *P = 0.0289). i, Nucleus-free cell fragment (cytoplast; outlines in yellow) migrating in a pillar array of large (orange) and small (green) pores (representative of three experiments). j, Quantification of pore passages in i (three experiments, 19 nucleus-free cytoplasts, 224 pore passages; paired t-test; **P = 0.0023 (4 μm vs 2 μηm, intact cells), **P = 0.0034 (6 μm vs 4 μm, intact cells), *P = 0.0267 (6 μm vs 4 μm, nucleus-free cytoplast)).
It has long been recognized that the organization of cellular polarity differs between amoeboid cells and mesenchymal cells: whereas mesenchymal cells often migrate with the microtubule-organizing centre (MTOC) and Golgi apparatus ‘in front’ of the nucleus23 (‘MTOC-first’), amoeboid cells preferentially migrate with the inverted configuration (‘nucleus first’) and only reorient once they stably dock onto other cells, as exemplified by immunological synapses23–26. The ultimate physiological foundations of this peculiar polarization remain unknown. Visualization of microtubules in DCs directionally migrating in channels, pillar forests, collagen gels and in the physiological environment of a mouse ear revealed a dynamically deforming ‘frontward’-positioned nucleus (Fig. 3a, Extended Data Figs. 7a–k, 8a–c, Supplementary Videos 6, 7), directly trailed by the closely associated MTOC, which frequently caused nuclear indentations (Extended Data Fig. 8i, j) as if pushing the nucleus forward. To test whether the nucleus-first configuration relates to pore-size selection, we took advantage of cell-to-cell variation in our system: 72.23% ± 2.8% (mean ± s.d.) of DCs in microchannels migrated with the nucleus first, whereas 21.27% ± 2.9% migrated in the MTOC-first configuration (Fig. 3b, Extended Data Fig. 8c). Migration speed in non-constricted channels and through single pores was independent of polar configuration (Extended Data Fig. 8d, k, l). Whereas the leading edges of DCs migrating nucleus-first were indistinguishable from those of cells migrating MTOC-first, they exhibited more nuclear deformations, a stronger propensity to pass through larger pores and, consequently, a faster passage beyond the decision point (Fig. 3c–f, Extended Data Fig. 9a–c, Supplementary Video 8). Similarly, fibroblasts only showed a preference for larger pores when migrating in the nucleus-first configuration (Fig. 3g, Extended Data Fig. 9d–g, Supplementary Video 8). In neutrophils, the MTOC located itself predominantly in between nuclear lobes when cells moved through straight channels. However, during passage through decision points, the nucleus unfolded, and at least one lobe passed the (preferentially largest) pore before the MTOC and the other nuclear lobes ultimately followed (Extended Data Fig. 10a–c and Supplementary Video 8). Thus, we conclude that the nucleus-first configuration, which is typical for amoeboid cells, facilitates migration along the path of least resistance, whereas cells migrating MTOC-first do not show this capacity.
Fig. 3 |. Nucleus-first cell polarity facilitates migration along the path of least resistance.
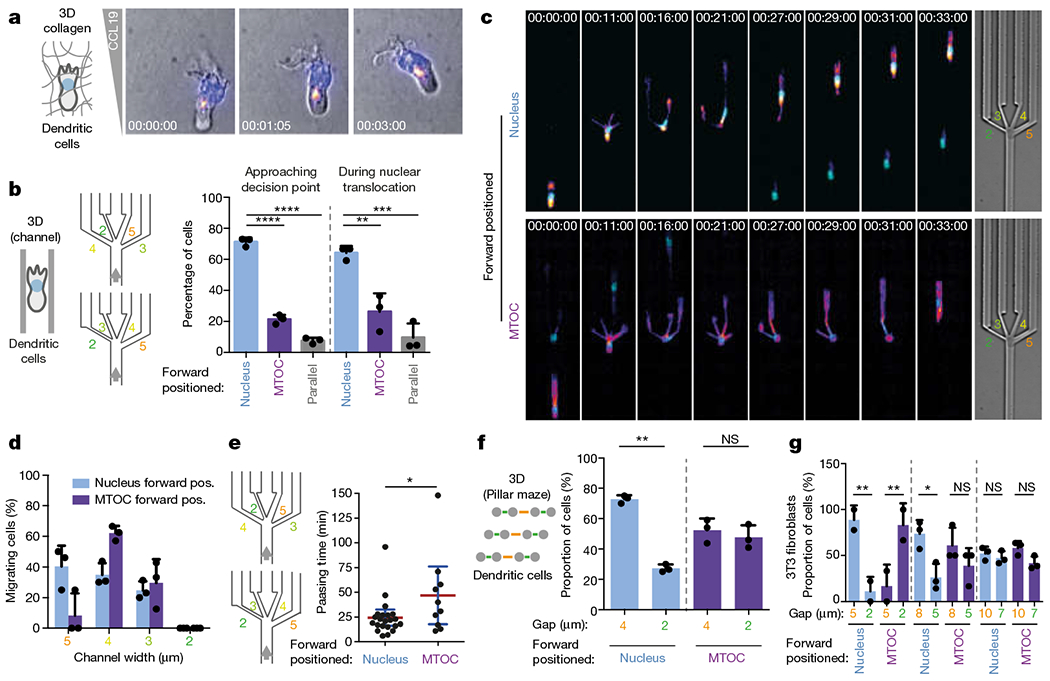
a, Position of MTOC (indicated by EMTB–mCherry, with fire colour-coded intensity: black (minimum), magenta, orange, yellow to white (maximum)) and nucleus (Hoechst stain; cyan) in a DC migrating in a collagen matrix along a CCL19 gradient (time indicated; representative of three experiments). b, Quantification of relative position of nucleus and MTOC in DCs before and during pore-size decisions (three experiments, 76 cells; one-way ANOVA with Tukey’s test; ****P < 0.0001, ***P = 0.0007, **P = 0.0049). c, Examples of DCs migrating through the decision point with the nucleus (top) or the MTOC (bottom) first (time indicated; representative of three experiments). d, Pore-size preference of DCs approaching a pore-size decision with nucleus or MTOC first (3 experiments, 76 cells). e, Time taken for cell to pass through a pore (passing time), based on whether the cell passes through in nucleus-first or MTOC-first configuration (three experiments, 32 cells; unpaired t-test; *P = 0.0389). f, Pore-size preference of DCs (nucleus-first versus MTOC-first configuration) migrating through pillar arrays with different pore sizes (three experiments, 31 cells, 252 pore passages; paired t-test; **P = 0.0042). g, Pore-size preference of fibroblasts (nucleus-first versus MTOC-first configuration) migrating through pillar arrays with different pore sizes (125 cells, 146 pore passages; one-way ANOVA with Tukey’s test; ***P = 0.0017, **P = 0.0088, *P = 0.0307). Data in b, d, f and g are mean ± s.d.; data in e are mean ± 95% confidence interval (CI).
The close proximity between MTOC and nucleus and the finding that in polymorphonuclear cells the MTOC specifies the nuclear lobe that leads the directional choice (Extended Data Fig. 10d), together with evidence that the MTOC determines polarization in other cellular systems27, raised the possibility that the nucleus acts as the mechanical gauge and the MTOC acts as the spatially associated directional selector. We therefore imaged the MTOC in DCs and found that once it followed the nucleus through a pore, all remaining protrusions were retracted (Fig. 4a). To functionally uncouple nucleus-based pore-selection from MTOC-based directional selection, we engineered microfluidic channels that split into two symmetric channels (‘Y’ junctions). This revealed that the MTOC is the superior predictor for side selection (Fig. 4b, Supplementary Video 10), meaning that in the rare cases where MTOC and nucleus dissociate, the MTOC is a better indicator of the ultimate directional choice of the cell. It is well established that microtubule depolymerization triggers actomyosin contraction via activation of RhoA and myosinII28, providing a potential link between MTOC passage and trading-edge retraction, such as via the RHOA guanine nucleotide exchange factor LFC1–GEF-H129. Imaging microtubule plus-end dynamics upon MTOC passage revealed that microtubules vanish from the trading protrusion before or on retraction (Fig. 4c, Supplementary Video 9). On myosin II inhibition with blebbistatin and a ROCK inhibitor, ceds showed slowed passage owing to a fadure to retract supernumerary protrusions (Extended Data Fig. 10e–n); likewise, microtubule disruption by low-dose nocodazole treatment led to drastically increased passage times. Nocodazole-treated cells frequently faded to make any productive decision (Fig. 4d, e and Supplementary Video 10) and instead, protrusions often advanced beyond the decision point, ultimately breaking the cell into fragments (Fig. 4d, f and Supplementary Video 10). Notably nocodazole-treated DCs successfully passed through single constrictions (Extended Data Fig. 9o), demonstrating that microtubules mediate decision-making rather than physical passage. Likewise, DCs in 3D collagen gels showed massive fragmentation when exposed to chemotactic stimuli (Extended Data Fig. 9p and Supplementary Video 10). These data demonstrate that MTOC-nucleated microtubules serve to signal successful nuclear passage to the trailing edge of the cell, decisively coordinating pathfinding and cellular coherence upon passage through pores.
Fig. 4 |. The microtubule cytoskeleton coordinates nuclear probing with cellular locomotion.
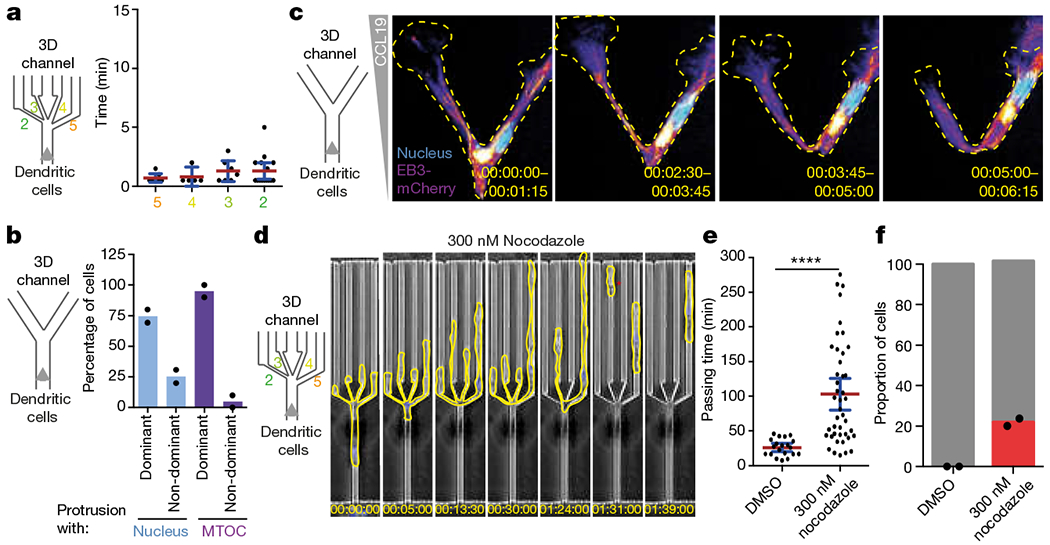
a, Retraction of cellular protrusions (from non-chosen pores) on passage of the MTOC into the chosen pore (three experiments, 34 cells). b, Path choice of DCs in Y-junction channels on translocation of the nucleus or the MTOC into one of the Y branches (two experiments, 46 cells). c, Microtubule plus ends, labelled with EB3–mCherry (fire colour-coded intensity), and nucleus (Hoechst stain, cyan) in a DC migrating through a Y-junction channel (time indicated; representative of three experiments). Images depict maximal intensity projections of 15 frames (5 s intervals). d, DCs (outlined in yellow) migrating through a decision point with pores 2, 3, 4 and 5 μm wide in the presence of 300 nM nocodazole (representative of two experiments). The red star highlights loss of cellular integrity. e, Quantification of the passing time in the experiments represented in d (two experiments, 63 cells; Mann–Whitney test; ****P < 0.0001). f, Quantification of the cellular integrity in the experiments represented in d (two experiments, 61 cells). Data in c and f are mean ± s.d.; data in a and e are mean ± 95% CI.
Overall, we show that the nucleus-first configuration, a distinctive feature of amoeboid cells, facilitates rapid navigation along the path of least resistance. These cells use the nucleus as a mechanical gauge, providing the basis for fast and non-destructive tissue locomotion such as during immune surveillance. By contrast, the mesenchymal cell-body-first configuration does not allow such subtle navigation, but is likely to support the slow path-generating strategy of pericellular proteolysis30. Beyond its relevance in development, immunity and regeneration, this functional link between polar organization and the generic mode of locomotion might also serve to classify migration of metastatic cancer cells.
METHODS
Data reporting.
No statistical methods were used to predetermine sample size. The experiments were not randomized. The investigators were not blinded to allocation during experiments and outcome assessment.
Mice.
All mice used in this study were of C57BL/6J background and bred and maintained in accordance with the Austrian law for animal experimentation (Österreichisches Tierschutzgesetz) and euthanized at 6-to-12 weeks of age (male and female) for use in experiments. Permission was granted and all experimental protocols were approved by the Austrian federal ministry of science, research and economy (identification code: BMWF-66.018/0005-II/3b/2012). All experiments were performed in accordance with relevant guidelines and regulations.
Cell culture.
All cells were grown and maintained at 37°C in a humidified incubator with 5% CO2 and routinely tested for mycoplasma contamination.
Dendritic cells.
DCs were differentiated from bone marrow extracted from femur and tibia of six-to-eight-week-old male C57BL/6J wild-type (or LifeAct–GFP positive31) mice, or from immortalized haematopoietic precursors (as described in refs 32,33). In brief, haematopoietic precursors were differentiated in RIO culture medium (RPMI 1640 supplemented with 10% fetal calf serum (FCS),2 mM l-glutamine, 100 U/ml penicillin, 100 mg/ml streptomycin, and 0.1 mM 2-mercaptoethanol; all Gibco) supplied with 10% granulocyte-macrophage colony-stimulating factor (GM-CSF) hybridoma supernatant, with addition of fresh medium on differentiation days 3 and 6 (ref.34). For maturation and subsequent migration assays, either fresh (day 8) or thawed DCs were stimulated overnight with 200 ng/ml lipopolysaccharide (LPS; E.coli 0127:B8 Sigma). For phagocytic uptake of polystyrene-based latex beads (Fluoresbrite yellow-green microspheres 6 μm, Polyscience), immature day seven DCs were incubated for 2 h with one drop of the beads per DC culture plate, followed by LPS stimulation (as above) in the presence of the beads.
T cells.
T cells were isolated from the spleen of male or female 6-to-12-week-old, C57BL/6J mice, using the EasySep mouse naive T cell isolation Kit (Stemcell). Cells were seeded onto cell culture plates coated with 1 μg/ml CD3 antibody and 1 μg/ml CD28 antibody, and either used for experiments between differentiation days2 and 6, or frozen at day 6 and thawed for experiments.
LMR7.5 hybridoma T cells.
Cells were a gift from A. M. Lennon (U932, Institut Curie, Paris, France), used courtesy of N. Glaichenhaus (IPMC UMR7525, UNS, Sophia-Antipolis, France) and cultured in R10 culture medium (RPMI 1640 supplemented with 10% FCS, 2 mM l-glutamine, 100 U/ml penicillin, 100 mg/ml streptomycin, and 50 mM 2-mercaptoethanol; all Invitrogen).
Polymorphonuclear leukocytes.
Human peripheral blood polymorphonuclear leukocytes (PMNs) were isolated from healthy donors (in accordance with relevant national guidelines and regulations, and informed consent of healthy volunteers: GS1-EK-4/543–2018) using EasySep Direct Human Pan-Granulocyte Isolation Kit (Stemcell). Purity and non-activated status of PMNs were validated using flow cytometry (FSC, SSC, CD1 lb, CD 14, CD45, CD62L, CD66b, CD235a; Miltenyi). For short-term storage or staining, PMNs were kept in Hanks balanced salt solution without phenol red (Gibco), supplemented with 0.6% human serum albumin (Sigma) and 1% glutamine (Gibco), with gently agitation in a ventilated tube in a humidified incubator. For experiments, PMNs were resuspended in RPMI without phenol red, supplemented with 0.6% human serum albumin, 20 mM HEPES (Gibco) and 1% glutamine.
Fibroblasts.
3T3 Swiss fibroblasts were cultured in DMEM GlutaMax (Thermofisher) supplemented with 10% FCS, 100 U/ml penicillin and 100 mg/ml streptomycin, and collected with Trypsin–EDTA for experiments.
Fluorescent reporter constructs.
The fluorescent plasmid DNA reporter construct coding for EB3–GFP was a gift from V. Small (IMBA, Austria). LV-GFP plasmid encoding H2B–GFP was a gift from E. Fuchs (Addgene plasmid no. 25999)35. GFP-wt-laminA and GFP-progerin were gifts from T. Misteli (Addgene plasmid no. 17662 and 17663)36. The EMTB-3 × mCherry constructs were a gift from W. M. Bement (University of Wisconsin)37. Gateway cloning technology was used to generate lentivirus from plasmid DNA constructs. In brief, corresponding DNA segments were amplified using primers containing overhangs with attBl and attB2 recombination sites on the 3′- and the 5′-end respectively. To obtain an EMTB fusion construct carrying a single mCherry tag, the PCR product was separated by gel electrophoresis, and only the fragment of corresponding size (EMTB: 816 bp, mCherry: 705 bp) was further processed. Gel-purified PCR fragments were inserted into pcDNA221 entry vectors (Invitrogen) by BP recombination reaction generating the entry clone, and expression clones were obtained by the LR recombination reaction between entry clone and pLenti6.3 destination vector (Invitrogen).
Transgene delivery for reporter cell line generation.
Fusion-protein-coding lentiviruses were produced in LX-293 HEK cells (Clontech) by co-transfection of the expression plasmids (pLenti6.3, Invitrogen) with pCMV-dR8.91 packaging- and pCMV-VSV-G envelope plasmids (a gift from B. Weinberg; Addgene plasmid no. 8454(ref.38)). The supernatant of virus-producing cells was collected 72 h after transfection for immediate use or stored at −80 °C after snap freezing. For generation of stably expressing reporter cells, immortalized progenitor cells (for later differentiation into DCs) and LMR7.5 T cell hybridoma cells were spin infected (l,500g, 1 h) in the presence of lentivirus coding for fluorescent reporter construct of interest and 8 μg/ml Polybrene (Sigma-Aldrich). Spin infection was carried out in a 12-well plate with 3 × 10⁵ cells/ml per reaction plus 500 μl of undiluted virus. The 3T3 fibroblasts were infected without spin infection. Following transduction, cells were expanded for two days and subsequently selected for stable virus insertion using 10 μg/ml blasticidin (Gibco) for one week. Cells expressing fluorescent reporter constructs were sorted using fluorescence-activated cell sorting (FACS Aria III, BD Biosciences) before further experiments.
Flow cytometry analysis.
Primary DCs and neutrophils were routinely checked for correct surface expression markers using antibodies against MHCII and CD11c (DCs; both eBiosciences) and CD11b, CD14, CD45, CD62L, CD66b, CD235a (Neutrophils; all Miltenyi). Stainings were done in FACS buffer (1 × PBS, 2 mM EDTA, 1% BSA) with Fc receptor blockage (anti-mouse CD16/CD32) for antibodies bearing an Fc part.
Micro-fabricated devices.
Micro-fabricated devices were generated as recently described12,39. In brief, microfluidic photomask designs were drawn with Coreldraw X8 (Corel), converted to Gerber format with Linkcad, and printed on chrome photomask at a resolution of 1 μm (JD Photo Data & Photo Tools). For high-resolution structures, wafers were first coated with a sub-micron layer of SU8 as a sticky substrate for later SU8 structures. We used GM-1040 SU8 photoresist (Gersteltec) at 5,000 r.p.m. for 2 min with flood UV exposure. The feature layer was then applied with SU8–2005 (Microchem). According to the datasheet, a UV-absorbing glass plate and higher exposure were used to make sharp features. PL-360-LP from Omega Optical and 550 mJ/cm2 with an EVG mercury lamp based mask aligner gave good results in the 3–7 μm thickness range. The thick loading channels were made with Microchem SU8–3025 using the EVG mask aligner according to the Microchem data sheet without the PL-360-LP plate. The master wafers underwent vapour silanization for 1 h with (1H, 1H, 2H, 2H-perfluorooctyl) trichlorosilane. The final results were single hydrophobic master wafers containing several aligned layers. Polydimethylsiloxane (PDMS) devices were made with Sylgard 184 Elastomer Kit (Dow Corning) using a ratio of 10:1. The PDMS was mixed in a Thinky mixing machine and then poured on the wafer in an aluminium tray and further degassed several times in a vacuum chamber. The devices were baked at 80 °C overnight. The hardened devices were carefully peeled off the mould and cut into single devices using a razor blade. Holes were punched with a custom arbor press, and sticky tape was used to remove debris. Glass coverslips were sonicated for 5 min in 70% ethanol and blown dry. Devices were bonded to the glass slides by oxygen plasma then sealed together at 85 °C for 1 h to make the bond permanent.
Cell migration assays.
For visualization of the nucleus in live cells, cells were preincubated for at least 30 min with NucBlue (Invitrogen), followed by washing. For live-cell MTOC or microtubule visualization in human granulocyte neutrophils, cells were incubated with 1 μM SiR-tubulin (Cytoskeleton). For cytoskeletal inhibition experiments, 300 nM nocodazole (Sigma), 1μM Y27632 (Sigma) or 50 μM para-nitroblebbistatin (Optopharma) were used.
3D collagen migration assays.
Matrix densities ranging from 1.7 mg/ml to 5.6 mg/ml were obtained by using different bovine collagen stock solutions (PureCol, Nutragen, Fibricol; all AdvancedBioMatrix) and dilutions, mixed in 1 × minimum essential medium eagle (MEM, Sigma) and 0.4% sodium bicarbonate (Sigma) with 3 × 10⁵ cells in R10 at a 2:1 ratio (as described previously40). Collagen–cell mixtures were casted in custom-made migration chambers. After 45 min. polymerization of collagen fibres at 37 °C and 5% CO2, gels were overlaid with 100 μl CCL19 (R&D Systems, 0.6 μg/ml). DC migration was recorded with time-lapse video microscopy and analysed by a custom-made tracking tool. Inhomogeneous collagen gels with spiked regions of higher collagen density were obtained by polymerizing a higher concentrated collagen mixture first (5.6 mg/ml), followed by cutting with a razor blade into very small pieces, and subsequent addition of the more-concentrated collagen gel pieces into a polymerizing mixture of lower-concentration collagen.
Immunofluorescence in 3D collagen migration assays.
Three-dimensional collagen gels were cast as described above. Two hours after introduction of the CCL19 gradient, the gel was isolated from the chamber and immediately bathed in 4% paraformaldehyde for 10 min at room temperature. After three washes with PBS, the primary antibody (diluted in PBS, 0.2% BSA and 0.05% saponin) was incubated overnight at 4°C. Then, after PBS washes, the secondary antibody (diluted in PBS, 0.2% BSA and 0.05% saponin) was incubated for 2 h at room temperature, washed three more times with PBS, and subsequently mounted using Fluoromount (Sigma) with DAPI (1:5,000).
Light-sheet imaging of DCs in collagen gel.
Agarose sample chambers were made as described11 and soaked in R10 medium before imaging. A collagen solution was prepared by mixing concentrated PBS and water with bovine collagen I (Advanced Biomatrix) at concentrations of 2.0 mg/ml or 5.6 mg/ml. Eight per cent of collagen was labelled by direct conjugation to Alexa Flour 568. The collagen was neutralized with 1 M NaOH and mixed with DCs before incubation at 37 °C. Imaging was performed with or without CCL19 (R&D Systems, 10μg/ml).
Cell migration in micro-fabricated devices.
An overview of the devices used is shown in Extended Data Fig. 2a, b. For the hole-based assay shown in Extended Data Fig. 2b, a 2 mm biopsy puncher was used to punch holes. To ensure comparable confinement, the heights of the channels and pillar arrays were adjusted to the individual cell/nucleus sizes of the cell types used: 4 μm or 5 μm for DCs, T cells and LMR7.5 hybridomaT cells (4 μm: Figs, 1f–h, 2a, b, f, g, i, j, 3b–f, 4a–f, Extended Data Figs, 1h–l, 2c, d, f–j, 3a–e, 4a–j, 6a, b, d, 8b–l, 9a–c, 10e–o; 5 μm: Figs. 2h, 3c, Extended Data Fig. 2a, b, e), 2 μm for neutrophils (Figs, 1h, 2c–e, 3g, Extended Data Figs. 3f, g, 10a–d), 7 μm for fibroblasts (Fig. 4h; Extended Data Figs. 6c, 9d–g). Before the introduction of cells, the devices were flushed with the corresponding medium and incubated for at least 1 h at 37°C, 5% CO2. To visualize the CCL19 chemokine gradient, we mixed 2.5μg/ml CCL19 with FITC–dextran (200 μg/ml in R10; hydrodynamic radius: 2.3 nm; Sigma Aldrich) as a proxy, as the diffusion profiles of FITC–dextran 10 kDa and the chemokine CCL19 are similar owing to similar hydrodynamic radii41.
Ex vivo crawl-in assay.
Four-to-six-week-old C57BL/6J mice were euthanized, ears were split and the cartilage-free ventral half was used as migration matrix as described previously10. Wild-type bone-marrow-derived DCs were labelled with 10 μM TAMRA (Invitrogen) and a total of 6 × 10⁴ cells were applied to one ear sheet and incubated for 20 min to allow migration into the tissue. Subsequently, non-adherent cells were washed away and ear explants were incubated at 37°C and lymphatic vessels of the ear explants were immunostained for LYVE1 (R&D).
Imaging.
Cell migration in micro-fabricated devices.
Cell migration was recorded with an inverted wide-field Nikon Eclipse microscope using 20×/0.5 PH1 air, 60×/1.4 PH3 oil and 100×/1.4 PH3 oil objectives, equipped with a Lumencor light source (390 nm, 475 nm, 542/575 nm) and an incubation chamber, heated stage and CO2 mixer (Ibidi); or an Visitron epifluorescence microscope using a Plan-APOCHROMAT 20x/0.8 air objective, equipped with a lumencor light source (390 nm, 475 nm and 542/575 nm) and an incubation chamber, heated stage and CO2 mixer (Ibidi).
Spinning-disc microscopy.
High-magnification EB3 dynamics were imaged with an inverted TILL photonics spinning disc using a 60×/1.35 oil objective equipped with an Andor 885 camera, laser lines (405, 445, 488, 561 and 640 nm) and an incubation chamber, heated stage and CO2 mixer (Ibidi).
Confocal reflection microscopy.
Collagen matrix analysis by confocal reflection microscopy was done as described34 by using an inverted Leica SP5 confocal/multiphoton microscope.
Ex vivo crawl-in assay.
Labelled DCs within the explants were visualized using a LSM700 upright confocal microscope (Zeiss) with a plan apochromat 40×/1.1 water objective and 405, 488 and 555 nm laser lines.
Light-sheet imaging.
DCs embedded in 3D collagen were imaged with axially swept light-sheet microscopy11, which has an isotropic resolution of ~390 nm.
Image analysis.
Fiji42 was used for image processing, including using the Trackmate plugin for manual cell tracking43. Generally, only single, non-interacting cells were quantified to exclude the influence of neighbouring cells on pore-size decision, cell path and cell speed.
Quantification of displacement towards chemokine source and average speed in 3D collagen gels.
The average displacement of all cells towards the chemokine source was calculated with a custom-made script22 in ImageJ. In brief, cell migration image sequences were background corrected by subtracting the average of the sequence. Particle filtering was used to discard objects smaller or larger than the cells. For each image, the lateral displacement that optimizes its overlap with the previous frame was determined. Finally, the displacement towards the chemokine source was calculated from the optimal y displacement in pixels, divided by the time between two consecutive frames.
Analysis of nucleus and MTOC positioning.
Nuclear (Hoechst) andMTOC (major EB3–mCherry signal) signals were segmented with ilastikv. 1.1.5 (https://ilastik.org) to generate binary images of nucleus and MTOC positioning, which were subsequently analysed by a custom-made Matlab script (available upon request) to determine the cell speed in relation to the nucleus–MTOC axis configuration.
Light-sheet image analysis.
To extract the DC surface, we used custom-built Matlab tools to combine three transformations of the deconvolved image that each detected different components of the cell. First, we generated a lamellipodia-enhanced image by applying a multiscale surface filter44 that accentuates planar features that are 2 or 3 pixels thick. This image was normalized by subtracting the intensity value two standard deviations above the mean. Second, we enhanced the cell cortex by calculating the Otsu threshold45 of the deconvolved image and subtracting this value from the deconvolved image. Third, we enhanced the cell interior by applying a gamma correction of 0.8, smoothing with a Gaussian filter of width two pixels, Otsu thresholding, morphologically dilating with a sphere of radius seven pixels, filling the holes in each x–y plane, morphologically eroding with a sphere of radius five pixels, and finally smoothing with a Gaussian filter of width one pixel. The three images were combined by finding the maximum value at each pixel, and a triangle mesh was generated as an isosurface of the combined image. The surface curvature of the mesh was calculated as previously described46. To better visualize the collagen matrix, a multiscale steerable filter46,47 was applied to detect linear features that are two or three pixels wide. ChimeraX was used for rendering.
Analysis of 3D collagen pore sizes.
Collagen matrix information from light-sheet microscopy images was used to analyse pore sizes of the collagen fibre network. The collagen network was segmented from the raw light-sheet images using ilastik48. The segmentation threshold was chosen such that the volume of the segmented network matched the volume fraction of collagen in the gel. The pore-size distribution was obtained analogously to the 2D pore-size analysis described in ref.49: 3D spheres were consecutively positioned into fitting corresponding gaps of the network (starting with the largest spheres) using a custom-made Matlab script (available upon request). To exclude edge artefacts, the outer sector (with a width of the largest overall filling spheres) was not included into the pore-size analysis.
Statistics.
Figures represent pooled data from independent biological replicates as indicated in the figure legends. Appropriate control experiments were performed for each biological replicate. All replicates were validated independently and pooled only when all showed the same result. All statistical analyses were performed with GraphPad Prism using the appropriate tests according to normal or non-normal data distribution: unpaired t-tests (Fig. 2a, d, e, 3e, Extended Data Figs. 6g, h, 8h, j), paired t-tests (Fig. 2j, l, 3g, Extended Data Figs. 2b, 10c), one-way ANOVA with Tukeys test (Fig. 1g, h, 2g, 3b, h, 4b, Extended Data Figs. 2f, h, 3b, e, g, 4a, d, f, 6f, 8e, f, 9a, 10b), two-way ANOVA (Extended Data Figs. 6b, c, 9c), Mann–Whitney (Fig. 4e, Extended Data Figs. 9b, c, 10h, i, l, m), Kruskal–Wallis with Dunns test (Extended Data Figs. 2g,h, 3c, 4e, 8d,l, 10o). *P < 0.05, **P < 0.01, ***P < 0.001 and ****P < 0.0001.
Reporting Summary.
Further information on experimental design is available in the Nature Research Reporting Summary linked to this article.
Extended Data
Extended Data Fig. 1 |. DC migration in 3D collagen matrices of different densities and microfluidic assays to study cell migration through defined inhomogeneous spaces.
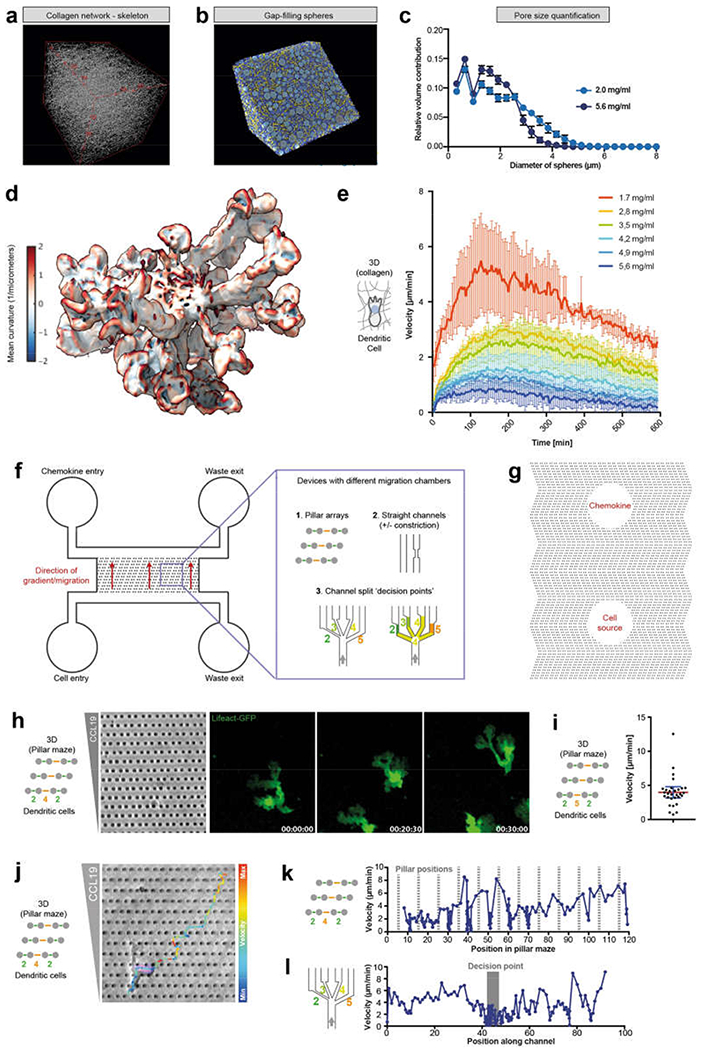
a, Skeleton representation of the collagen matrix (labelled with Alexa Fluor 568) imaged by light-sheet microscopy with isotropic, subcellular 3D resolution (4 experiments). b, Pore-size analysis by filling 3D spheres (blue) between the collagen fibres (yellow) based on the skeleton representation in a. c, Quantification of pore sizes as in b for two different collagen concentrations (2.0 and 5.6 mg ml−1; n = 4 cells each; mean ± s.d.). d, Magnification of Fig. 1a, showing an example of a DC (labelled with LifeAct–GFP) with multiple protrusions (with veil like shapes) embedded in a 3D collagen matrix and coloured by surface curvature (regions of large positive and large negative curvature in red and blue, respectively; see scale bar), e, Migration velocities (average displacement in direction of the chemokine gradient over time) of DCs in collagen matrices of different collagen concentrations (1.7–5.6 mg ml−1) along a CCL19 gradient, highlighting the ability of DCs to migrate even in high collagen densities (5.6 mg ml−1), but with a reduced velocity. Data are mean ± s.d. (n = 4 experiments). f, Scheme of the PDMS-based microfluidic setup used to analyse cell migration in different defined microenvironments. In brief, cells and chemokine were flushed separately from two different entrances into two main channels, which are connected either by pillar arrays or different types of channels. On stopping the flow, a chemokine gradient was established and cells migrated into the connecting area (Methods). g, Alternative PDMS-based migration chamber setup, in which cells are placed in one hole and a chemokine is placed in the other; the holes are connected by arrays of pillars (Methods). h, Typical shape of a DC (labelled with LifeAct-GFP) with multiple cell fronts, migrating in a CCL 19 gradient (left) through a pillar array with 2 μm and 4 μm pores, arranged to generate streets’ of large (orange) and small (green) pores (2 experiments), i, Migration velocities of DCs through a pillar array of 2 μm and 5 μm pores (30 cells); data are mean ± 95% CI. j, Velocity (colour-coded) of a representative DC migrating through a pillar array of 2 μm and 4 μm pores (2 experiments). k, Quantification of e, showing cellular deceleration before pore translocation even before passing large pores (2 experiments). l, DC velocity before, during and after pore-size decision, when migrating in a microchannel through a junction (decision point) of four differently sized pores of 2, 3, 4 and 5 μm width (2 experiments). During this ‘decision time’, DCs feature multiple parallel cell fronts and cellular protrusions (see Fig. 1).
Extended Data Fig. 2 |. DC migration through defined inhomogeneous spaces.
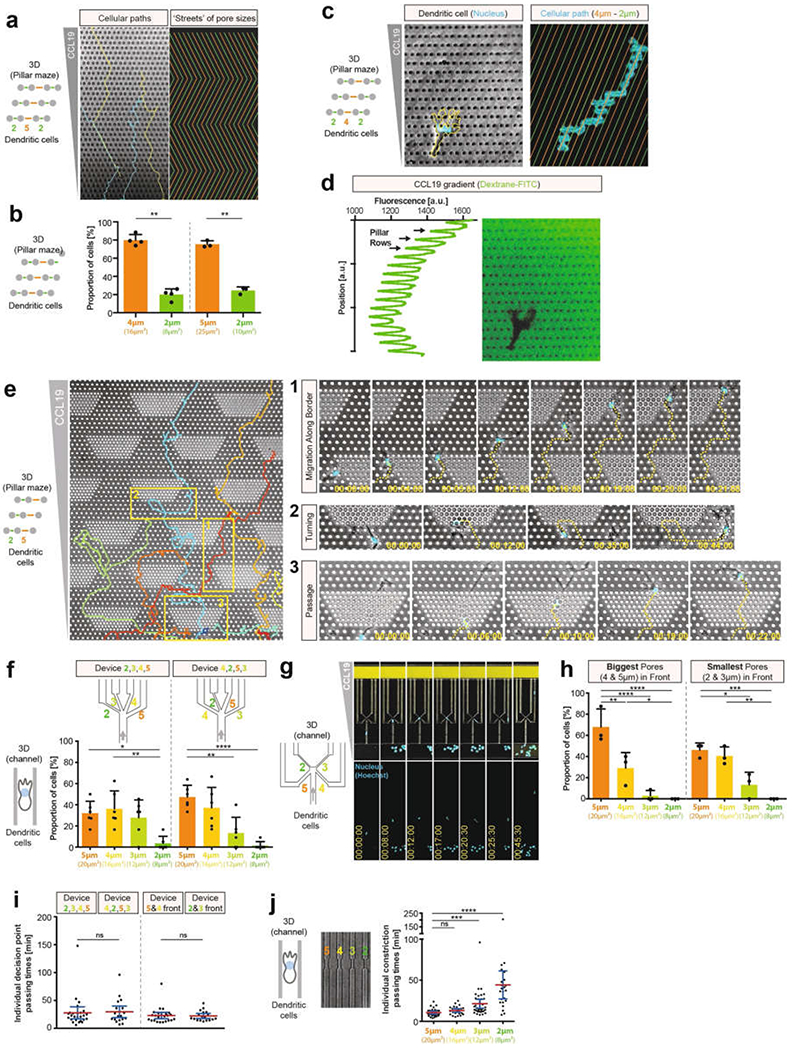
a, Tracks (left; blue, yellow) of DCs migrating long distances through pillar arrays (2 μm and 5 μm pores; 5 μm height), in which ‘streets’ of pore size change orientation after ten pores (right panel, ‘streets’ of large and small pores in orange and green, respectively) (3 experiments). b, Left, quantification of DC pore-size preference in pillar forests depicted in c (4 experiments, 23 cells, 231 pore passages; paired t-test, **P = 0.0023). Right, quantification of DC pore-size preference in a (3 experiments, 21 cells, 312 pore passages; paired t-test, **P = 0.0073). c, Similar to a, but with different pore sizes and pillar arrangements, showing that DCs (nucleus (Hoechst stain) in cyan, cell outlines in yellow) can deviate from the most direct chemokine gradient (CCL19) along the path of least resistance (2 μm and 4 μm pores; arranged to generate streets (top right) of large (orange) and small (green) pores) (3 experiments). d, CCL19 gradient in a visualized by dextran–FITC (3 experiments). e, Pillar forests with dense pillar islands (2 μm pores) within a surrounding area with lower pillar density (5 μm pores). Insets are expanded on the right, showing examples of small-pore avoidance by migration along boundaries of small-pore islands (1) or turning (2), and small-pore translocation when cells encounter dense pillar islands head-on (3) (3 experiments). f, As in Fig. 1g (left), but showing the results of the pore-size preference of DCs in individual devices with different orders of pore sizes (3 experiments, 27 cells in device 1, 30 cells in device 2); one-way ANOVA with Tukey’s test; ****P < 0.0001, **P = 0.0016, *P = 0.0159). g, DC migration through microchannels with a decision point with two small pores (2 μm and 3 μm wide) directly in the migration direction, and two larger pores (4 μm and 5 μm wide) diagonally against the direction of migration (3 experiments). h, Quantification of g, comparing alternative orientations (small pores in front versus in the back) (3 experiments, 61 cells; one-way ANOVA with Tukey’s test; left: ****P < 0.0001, **P = 0.0037, *P = 0.0389; right panel, ***P = 0.0007, **P = 0.0025, *P = 0.0157). i, Quantification of passing times in devices with different pore-size arrangements as in f and h (3 experiments; 26,29, 25 and 18 cells, left to right, respectively; Kruskal–Wallis with Dunn’s test). j, DC passing times through the same pore sizes as in d, f and Fig. 1g, but without the possibility of pore selection (single pores; 3 experiments, 114 cells; Kruskal–Wallis with Dunn’s test; ****P < 0.0001, ***P = 0.0002). Data in a, b, f and h are mean ± s.d.; data in i and j are mean ± 95% CI.
Extended Data Fig. 3 |. Migration of T cells, LMR7.5 cells and neutrophils through defined inhomogeneous spaces.
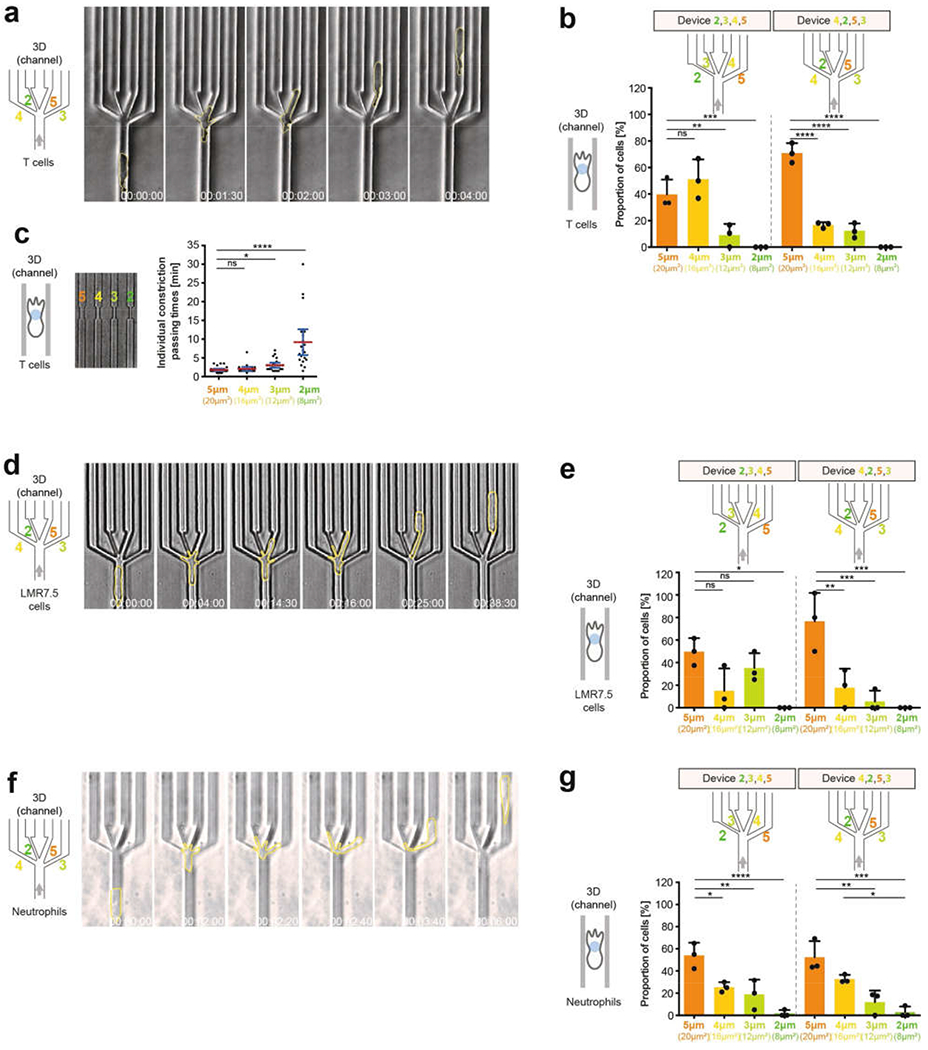
a, Image sequence of a representative T cell (cell outlines in yellow) migrating in microchannels through a junction (decision point) with pores 2, 3,4 and 5 μm wide (3 experiments). b, As in Fig. 1h, but showing the results of the pore-size preference of T cells in individual devices with different sequences of pore sizes (3 experiments, 37 (left) or 42 (right) cells; one-way ANOVA with Tukey’s test; ****P < 0.0001, ***P = 0.0003, **P = 0.0045). c, Passing times for T cells through the same pore sizes as in Fig. 1h, but without the possibility of pore choice (single pores; 3 experiments, 90 cells; Kruskal–Wallis with Dunn’s test; ****P < 0.0001, *P = 0.0128). d, Image sequence of a representative LMR7.5 T cell hybridoma cell (cell outlines in yellow) migrating in microchannels through a decision point with exits 2, 3, 4 and 5 μm wide (3 experiments). e, As in Fig. 1h, but showing the results of the pore-size preference of LMR7.5 T cell hybridoma cells in individual devices with different sequences of pore sizes (3 experiments, 23 (left) or 17 (right) cells; one-way ANOVA with Tukey’s test; ***P = 0.0002, ***P = 0.0004, **P = 0.0030, *P = 0.0132 (left to right), respectively). f, Image sequence of a representative neutrophil (cell outlines in yellow) migrating in microchannels through a decision point with pores 2, 3, 4 and 5 μm wide (height 2 μm) (3 experiments). g, As in Fig. 1h, but showing the results of the pore-size preference for neutrophils in individual devices with different sequences of pore sizes (3 experiments, 59 (left) or 63 (right) cells; one-way ANOVA with Tukey’s test; left: ****P < 0.0001, **P = 0.0054, *P = 0.0284; right: ***P = 0.0002, **P = 0.0014, *P = 0.0212). Data in b, e and g are mean ± s.d.; data in c are mean ± 95% CI.
Extended Data Fig. 4 |. Dynamic nuclear protrusions during pore-size decisions.

a, Quantification of the translocation of cell fronts through the differently sized pores (3 exeriments, 71 cells, 237 lamellipodia; one-way ANOVA with Tukey’s test). b, Number of cell front protrusions per cell during four-way pore-size decision (3 experiments, 62 cells). c, Quantification of cell front protrusion retractions before cell body (nuclear) passage (3 experiments, 101 lamellipodia). d, Quantification of initial nuclear protrusions into the different pore sizes during pore-size decision (3 experiments, 51 cells, 164 nuclear protrusions; one-way ANOVA with Tukey’s test; ***P = 0.0003). e, Number of parallel nuclear protrusions per cell during pore-size decision (3 experiments, 51 cells). f, Pore-size selection for the larger, intermediate or smaller pore when there are parallel nuclear lobes (3 experiments, 50 cells; one-way ANOVA with Tukey’s test; **P = 0.0025 (bigger vs intermediate), **P = 0.0021 (bigger vs smaller)). g, Maximal nuclear protrusion depth into non-chosen pores (9 cells (5 μm), 27 cells (4 μm), 25 cells (3 μm) and 27 cells (2 μm); Kruskal–Wallis with Dunn’s test; ****P < 0.0001, **P = 0.0058, *P = 0.0474). h, Frequent and parallel nuclear protrusions (nucleus (Hoechst) in cyan) of migrating DCs navigating through a pillar array with 2 μm and 4 μm pores (3 experiments). i, Nuclear protrusions of a T cell (nucleus (Hoechst) in cyan; cell outlines in yellow) migrating in microchannels through a decision point of four differently sized pores of 2, 3, 4 and 5 μm width (3 experiments). j, Nuclear protrusions of a LMR7.5 T cell hybridoma (nucleus (Hoechst) in cyan; EB3–mCherry in green) migrating in microchannels through a decision point of four differently sized pores of 2, 3,4 and 5 μm width (3 experiments). Data in a–f are mean ± s.d.; data in g are mean ± 95% CI.
Extended Data Fig. 5 |. Dynamic nuclear protrusions during 3D migration in collagen matrices.
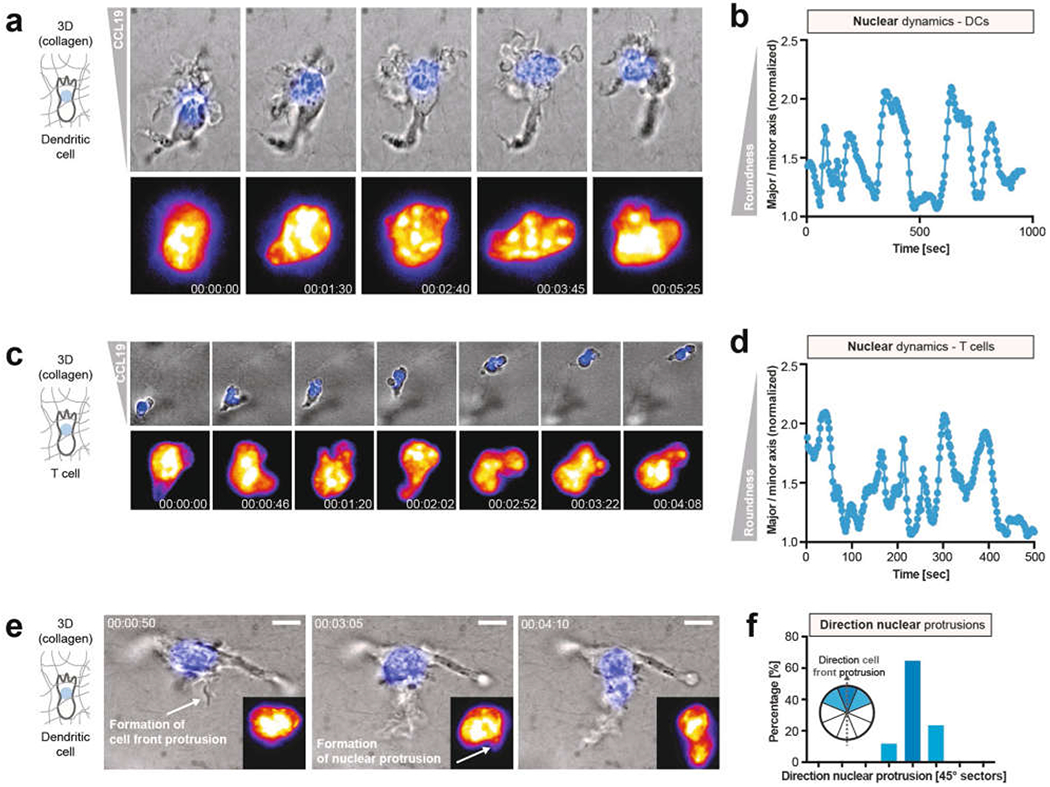
a, Nuclear-labelled (top panels, blue; bottom panels, fire colour-coded intensity) DC migrating in a collagen matrix along a CCL19 gradient, depicting the various shapes adopted by the nucleus (3 experiments). b, Nuclear shape changes over time of a DC migrating in a 3D collagen matrix, highlighting the dynamic transitions between rounded and more deformed shapes (3 experiments), c, Nuclear-labelled (top panels, blue; bottom panels, fire-colour-coded intensity) T cell migrating in a collagen matrix along a CCL19 gradient, highlighting the various shapes adopted by the nucleus (3 experiments). d, Nuclear shape changes over time of a T cell migrating in a 3D collagen matrix, highlighting the dynamic transitions between rounded and more deformed shapes (3 experiments). e, DC during formation of a new cell front protrusion, followed by a nuclear protrusion in the direction of the new cell front (3 experiments). f, Quantification of the direction of nuclear protrusion in relation to the direction of new cell front protrusions (n = 17 cells).
Extended Data Fig. 6 |. Nuclear function as a mechanical guide.
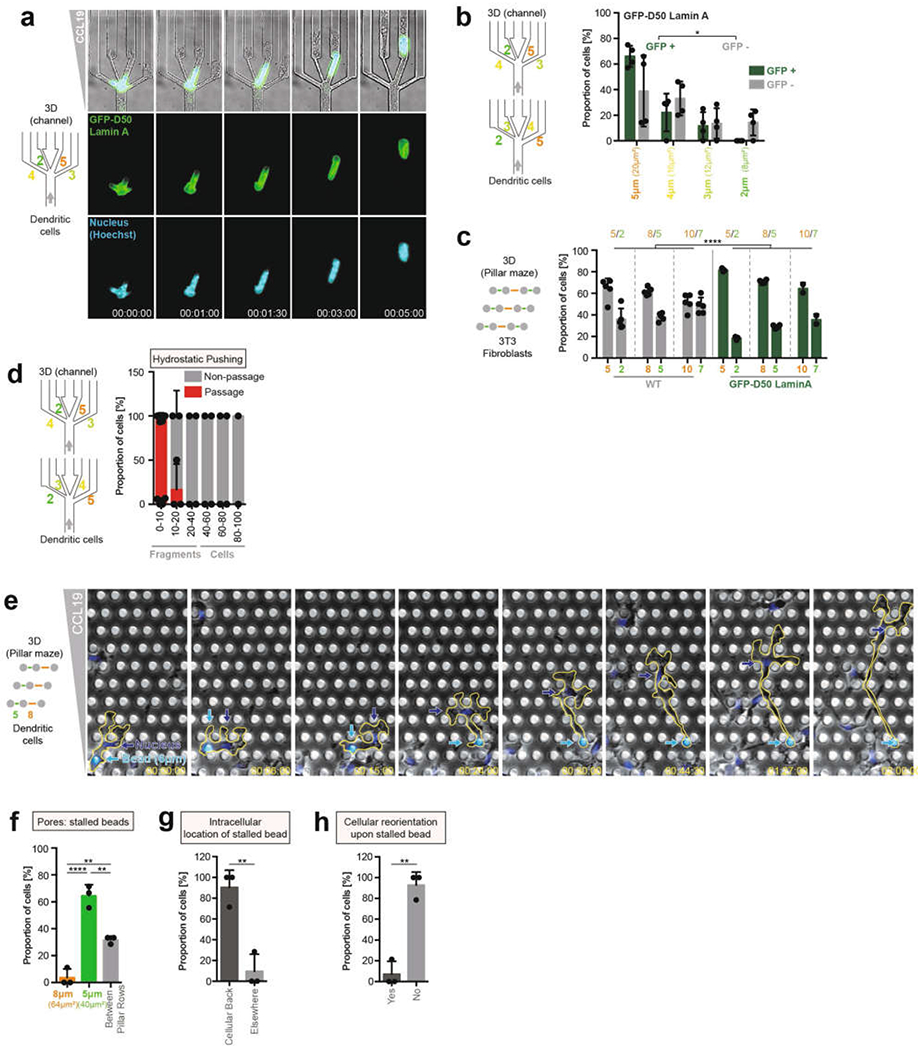
a, DC expressing lamin(D50)–GFP (lamin(D50) is also known as progerin) migrating through a four-way pore-size decision (4 experiments). b Quantification of pore-size preference in a, divided into GFP+ and GFP− regions (4 experiments, 293 cells; unpaired t-test; *P = 0.0118). c Pore-size preference of 3T3 fibroblasts expressing lamin(D50)–GFP (or wild-type lamin–GFP as control) migrating in pillar arrays with differently sized pores (3 experiments, 606 pore passages; two-way ANOVA with Tukey’s test; ****P < 0.0001). d, Low hydrostatic pushing of cells and cellular fragments through four-way pore-size decision (n = 66). e, DC (nucleus labelled, Hoechst, blue) loaded with a 6-μm polystyrene bead (cyan) migrating through a pillar array with 5 μm and 8 μm pores (3 experiments). f, Graph showing where the intracellular bead gets stuck (3 experiments, 29 cells; one-way ANOVA with Tukey’s test; ****P < 0.0001, **P = 0.0016 (8 μm vs between pillar rows), **P = 0.0035 (5 μm vs between pillar rows)). g, Graph showing intracellular location of the bead when it gets stuck (3 experiments, 29 cells; unpaired t-test; **P = 0.0039). h, Frequency of cellular reorientation of DCs with an intracellular bead after getting stuck (3 experiments, 29 cells; unpaired t-test; **P = 0.0011). Data are mean ± s.d.
Extended Data Fig. 7 |. Nuclear positioning during amoeboid cell migration.
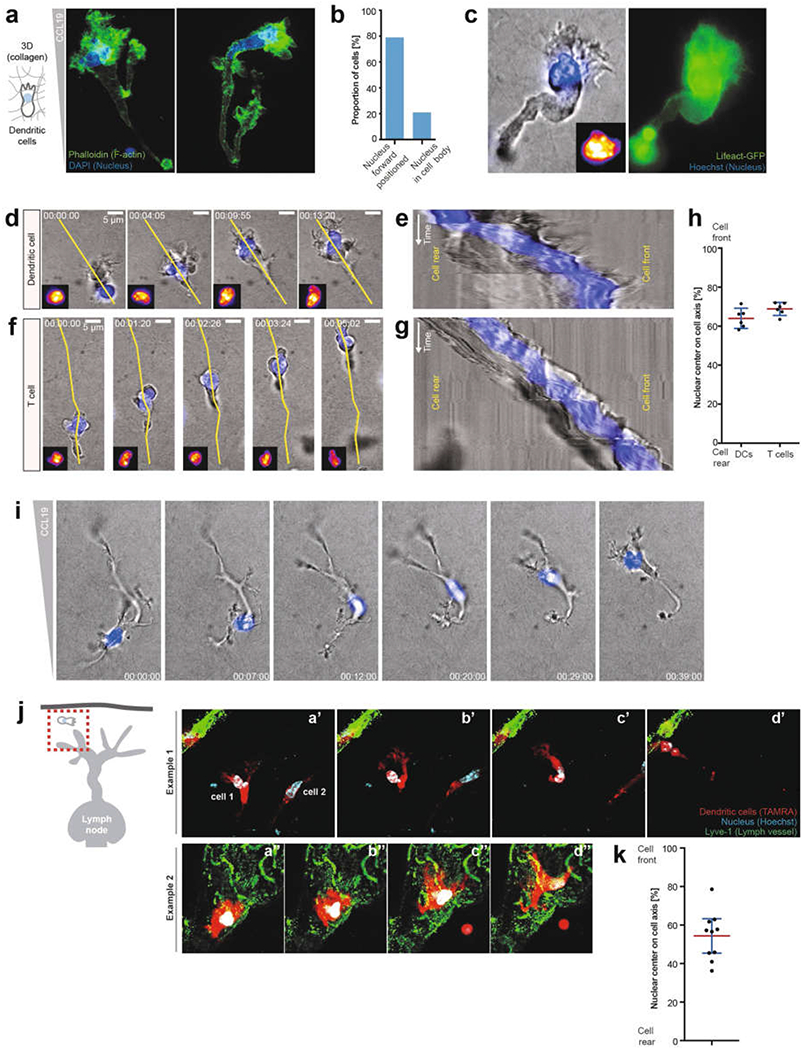
a, DCs migrating in a 3D collagen matrix along a CCL19 gradient, fixed with paraformaldehyde and stained with phalloidin (green) and DAPI (blue). Two examples are shown; note the nuclear positioning close to the cell front directly behind the F-actin-rich lamellipodium (3 experiments). b, Quantification of the nuclear location in a (62 cells). c, Live-cell imaging of a DC labelled with LifeAct–GFP (green) and Hoechst nuclear stain (blue), showing nuclear positioning close to the cell front directly behind the actin-rich lamellipodium (3 experiments). d Temporal analysis of nuclear positioning during DC migration in a 3D collagen matrix along a CCL19 gradient (yellow line depicts the kymographic axis in e). Note that the cell polarizes at time point 0, after which the nucleus quickly positions close to the cell front (3 experiments). e, Kymographic analysis of d (3 experiments). f, Temporal analysis of nuclear positioning during T cell migration in a 3D collagen matrix along a CCL19 gradient (yellow line depicts the kymographic axis in e) (3 experiments). g, Kymographic analysis of f. Note the nuclear positioning close to the cell front (3 experiments). h, Quantification of nuclear positioning along the cell axis (n = 6 cells; data are mean ± 95% CI). i, Representative of a repolarizing DC (the former front becomes the new back edge) migrating in a 3D collagen matrix along a CCL19 gradient. Note that the nucleus translocates through the entire cell body to position to the new cell front (n = 3 experiments). j, Ex vivo DC (TAMRA, red) migration in mouse skin ear explants (scheme, left) towards lymphatic vessels (LYVE1, green). Two exemplary image sequences (n = 3 experiments). k, Quantification of nuclear positioning along the cell axis in j (n = 10 cells; data are mean ± 95% CI).
Extended Data Fig. 8 |. MTOC positioning during DC migration.
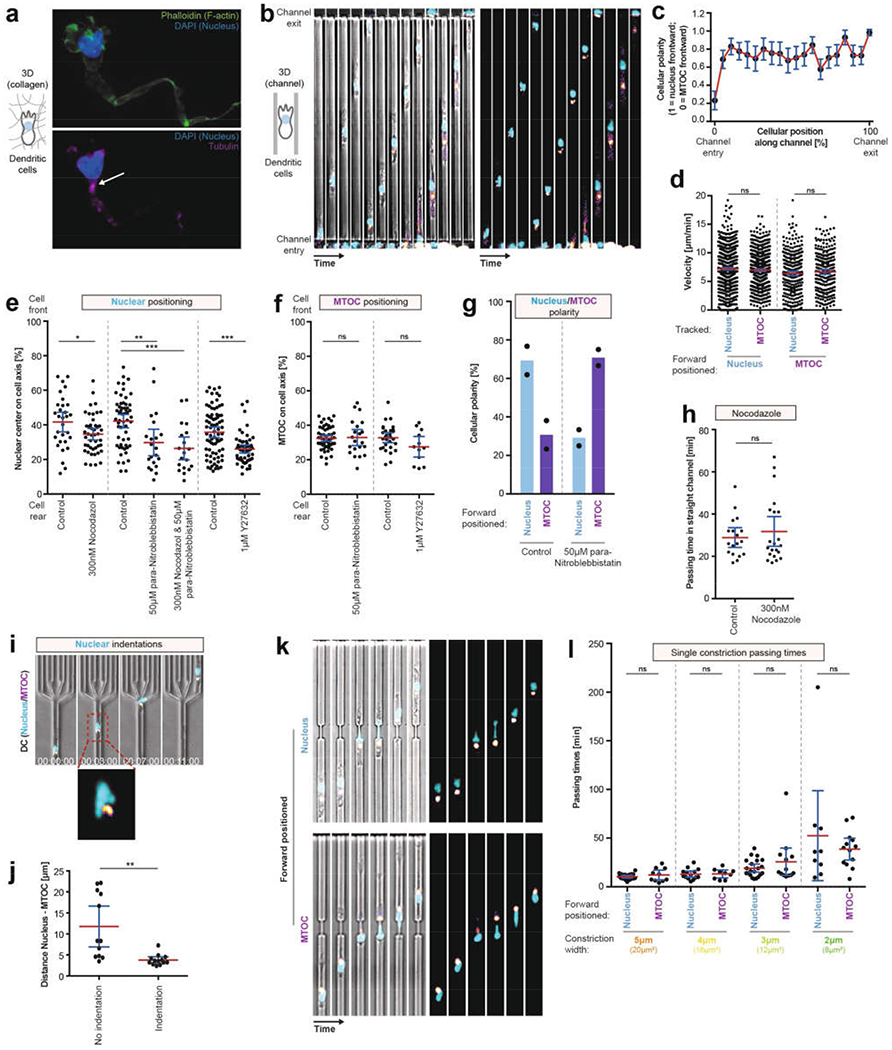
a, DCs migrating in a 3D collagen matrix along a CCL19 gradient were fixed with paraformaldehyde and stained with DAPI (blue), phalloidin (green) and for tubulin immunofluorescence (magenta). The arrow highlights the major tubulin signal (n = 3 experiments). b, Image sequence of three exemplary DCs (Hoechst, nucleus, cyan; EB3–mCherry, fire colour-coded intensity) migrating consecutively in a microchannel along a CCL19 gradient. Note that cells 1 and 3 (counting from left to right) initially enter the channel with forward positioning of the MTOC; however, after a short migration distance the nucleus positions in front of the MTOC (nucleus-first configuration) (n = 5 experiments). c, Quantification of b (n = 1,148 events). d, Quantification of the velocity of the cells, depending on the orientation of the nucleus-MTOC axis, tracking the nucleus or the MTOC location as a velocity reference point (n = 830, 323, 787, 262 events, respectively, left to right; Kruskal–Wallis with Dunn’s test). e, Nuclear positioning in DCs along the cell axis, in the presence of 300 nM nocodazole (with DMSO control), 50 μM para-nitroblebbistatin (with DMSO control) or 1 μM Y27632 (with PBS control) in straight microchannels without constrictions (n = 30, 45, 56, 21, 19, 77, 54 cells, respectively, left to right; one-way ANOVA with Tukey’s test; ***P = 0.0002, **P = 0.0051, *P = 0.0269). f, MTOC positioning in DCs along the cell axis in the presence of 300 nM nocodazole (with DMSO control), 50 μM para-nitroblebbistatin (with DMSO control) or 1 μM Y27632 (with PBS control) in straight microchannels without constrictions (n = 53, 21, 29, 12 cells, respectively, left to right; one-way ANOVA with Tukey’s test). g, Nuclear–MTOC polarity in the presence of 50 μM para-nitroblebbistatin (with DMSO control) in straight microchannels without constrictions (e = 2 experiments). h, Quantification of the passing time of DCs migrating through straight channels in the presence of 300 nM nocodazole (DMSO control) (n = 18 (control) or 21 (nocodazole) cells; unpaired t-test). i, Exemplary DCs migrating in a microchannel with a nuclear indentation in close proximity to the MTOC localization (3 experiments). j, Quantification of i (25 cells; unpaired t-test; *P = 0.0012). k, Image sequences of DCs (Hoechst, nucleus, cyan; EB3–mCherry, fire colour-coded intensity) migrating along a CCL19 gradient in a microchannel with a 2 μm-wide individual pore. Top panels depicts an exemplary DC migrating through the 2-μm pore with the nucleus first, the bottom panels depicts an exemplary DC migrating through the 2-μm pore with the MTOC first (3 experiments). l, Quantification of k, and of DC migration through individual pores 3, 4 or 5 μm wide (n = 20, 10, 14, 9, 21, 13, 9, 13 cells, respectively, left to right; Kruskal–Wallis with Dunn’s test). Data are mean ± 95% CI.
Extended Data Fig. 9 |. Nucleus-first versus MTOC-first cell polarity during pore-size decisions in DCs and fibroblasts.
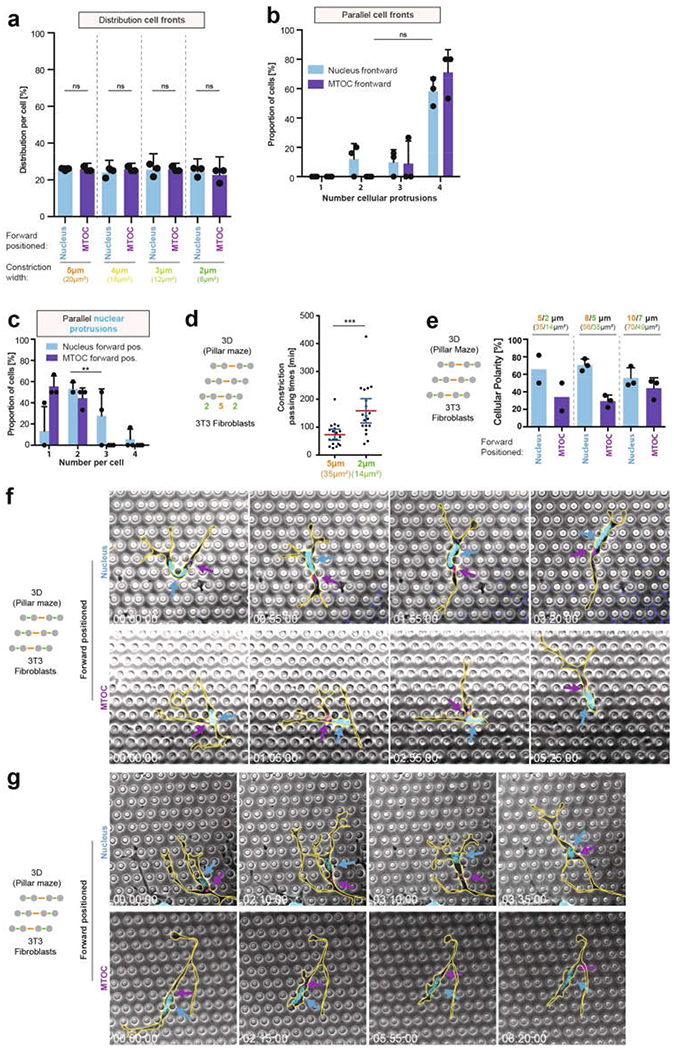
a, Quantification of cell-front pore preference as a function of nucleus–MTOC axis orientation (3 experiments, 26 cells; one-way ANOVA with Tukey’s test). b, Quantification of parallel cell fronts as a function of nucleus–MTOC axis orientation (3 experiments, 26 cells; Mann–Whitney test). c, Number of parallel nuclear protrusion in DCs with nucleus first (cyan) or MTOC first (magenta). (3 experiments, 28 cells; two-way ANOVA, **P = 0.0029). d, Constriction passing times of fibroblasts (38 cells; Mann–Whitney test, ***P = 0.0002) during migration through a pillar array with 2 μm and 5 μm pores. e, Pore-size preference of fibroblasts in pillar arrays with pores of increasing size as a function of the nucleus–MTOC polarity (5/2 μm: 2 experiments; 8/5 μm and 10/7 μm: 3 experiments). f, g Image sequence of two exemplary fibroblasts (nucleus (H2B–GFP) in cyan, EB3–mCherry in magenta, cell outlines in yellow) positioning either the MTOC (lower panel) or the nucleus (upper panel) forward, while migrating in a pillar array with 5 μm and 8 μm pores. Arrows indicate the area of highest EB3–mCherry signal (MTOC; fire colour-coded intensity) and the nucleus (cyan) (3 experiments). Data in a, b, c and e are mean ± s.d.; data in d are mean ± 95% CI.
Extended Data Fig. 10 |. Myosin inhibition during pore decisions in DCs and nucleus-first versus MTOC-first cell polarity during pore-size decisions in neutrophils.
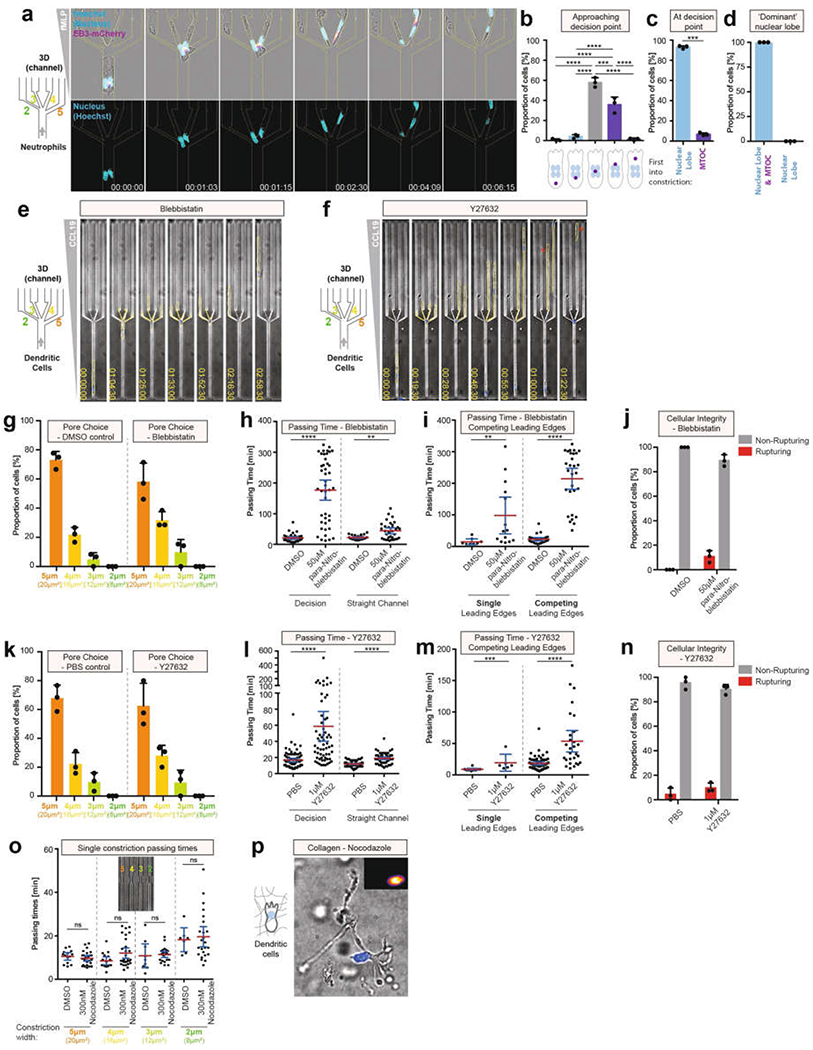
a, Nuclear lobe dynamics (Hoechst stain) and MTOC localization (SiR–tubulin) during neutrophil pore-size decision (3 experiments). b, Quantification of a, immediately before the decision point (3 experiments; 143 cells; one-way ANOVA with Tukey’s test; ****P < 0.0001, ***P = 0.0005, respectively). c, Quantification of a during pore-size decision (3 experiments; 45 cells; paired t-test; ***P = 0.0003). d, Quantification of cells following the nuclear lobe closest to the MTOC when nuclear lobes translocate in parallel in different pores (3 experiments, 26 cells). e, DC migration in the presence of 50 μM para-nitroblebbistatin through a decision point of four pores of 2, 3, 4 and 5 μm wide (3 experiments). f, DC migration in the presence of 1 μM Y27632 through a decision point of four pores 2, 3, 4 and 5 μm wide (3 experiments). The red star highlights loss of cellular integrity. g Quantification of pore preference in e (3 experiments, 79 cells). h Quantification of passing time in e (3 experiments, 79 cells; Mann–Whitney test; ****P < 0.0001, **P = 0.0020). i, Quantification of the passing time in e, depending on whether cells establish a single or multiple competing leading edges during pore decisions (3 experiments, 79 cells; Mann–Whitney test; ****P < 0.0001, **P = 0.0017). j, Quantification of cellular integrity in e (3 experiments, 79 cells). k, Quantification of pore choice preference in f (3 experiments, 140 cells). l, Quantification of passing time in f (3 experiments, 140 cells; Mann–Whitney test; ****P < 0.0001). m, Quantification of passing time in f, depending on whether cells establish a single or multiple competing leading edges during pore decisions (3 experiments, 140 cells; Mann–Whitney test; ****P < 0.0001, ***P = 0.0008). n, Quantification of cellular integrity in f (3 experiments, 140 cells). o, DC passing times through the same pore sizes as in Fig. 4d, but without pore choice possibility, in the presence of 300 nM nocodazole (3 experiments, 147 cells; Kruskal–Wallis test). p, DC migration in a collagen matrix in the presence of nocodazole (3 experiments). Data in b–d, g, j, k and n are mean ± s.d.; data in h, i, l, m and o are mean ± 95% CI.
Supplementary Material
Acknowledgements
We thank F. Gärtner, E. Kiermaier and A. Casano for discussions and critical reading of the manuscript, A. Leithner for primary T cells, A. Reversat for LMR7.5 cell cultures, J. Schwarz and M. Mehling for sharing microfluidics knowledge, K. S. Dean for assistance with light-sheet imaging, T. Goddard from UCSF ChimeraX (P41-GM103311) for assistance with 3D rendering, and the Scientific Service Units of IST Austria for support. This work was supported by the European Research Council (ERC StG 281556 and CoG 724373), a grant from the Austrian Science Foundation (FWF) and the FWF DK ‘Nanocell’ to M.S., National Institutes of Health awards (F32GM116370, K25CA204526) to M.K.D. and E.S.W., the Cancer Prevention Research Institute of Texas recruitment award (R1225) to G.D., the Cancer Prevention Research Institute of Texas recruitment award (RR160057)to R.F., ISTFELLOW funding from the People Programme (Marie Curie Actions) of the European Union’s Seventh Framework Programme (FP7/2007-2013) under REA grant agreement no. 291734 to J.R., and an EMBO long-term fellowship (ALTF 1396-2014) co-funded by the European Commission (LTFCOFUND2013, GA-2013-609409) to J.R.
Footnotes
Online content
Any methods, additional references, Nature Research reporting summaries, source data, statements of data availability and associated accession codes are available at https://doi.org/10.1038/s41586-019-1087-5.
Reviewer information Nature thanks Dennis Discher, Pakom Kanchanawong, Kenneth Yamada and the other anonymous reviewer(s) for their contribution to the peer review of this work.
Competing interests The authors declare no competing interests.
Additional information
Extended data is available for this paper at https://doi.org/10.1038/s41586-019-1087-5.
Supplementary information is available for this paper at https://doi.org/10.1038/s41586-019-1087-5.
Data availability
All data that support the conclusions of this paper are available from the authors on request.
Code availability
All custom-made scripts are available from the authors on request.
References
- 1.Petrie RJ & Yamada KM Multiple mechanisms of 3D migration: the origins of plasticity. Curr. Opin. Cell Biol 42,7–12 (2016). [DOI] [PMC free article] [PubMed] [Google Scholar]
- 2.Friedl P & Weigelin B Interstitial leukocyte migration and immune function. Nat Immunol. 9,960–969 (2008). [DOI] [PubMed] [Google Scholar]
- 3.te Boekhorst V, Preziosi L & Friedl P Plasticity of cell migration in vivo and in silico. Annu. Rev. Cell Dev. Biol, 32,491–526 (2016). [DOI] [PubMed] [Google Scholar]
- 4.Weigelin B, Bakker G-J & Friedl P Intravital third harmonic generation microscopy of collective melanoma cell invasion: Principles of interface guidance and microvesicle dynamics. Intravital 1,32–43 (2012). [DOI] [PMC free article] [PubMed] [Google Scholar]
- 5.Stoitzner P, Pfaller K, Stössel H& Romani N A close-up view of migrating Langerhans cells in the skin. J. Invest. Dermatol 118,117–125 (2002). [DOI] [PubMed] [Google Scholar]
- 6.Wolf K & Friedl P Extracellular matrix determinants of proteolytic and non-proteolytic cell migration. Trends Cell Biol. 21, 736–744 (2011). [DOI] [PubMed] [Google Scholar]
- 7.Wolf K, Müller R, Borgmann S, Bröcker E-B & Friedl P Amoeboid shape change and contact guidance: T-lymphocyte crawling through fibrillar collagen is independent of matrix remodeling by MMPs and other proteases. Blood 102 3262–3269 (2003). [DOI] [PubMed] [Google Scholar]
- 8.Sarris M & Sixt M Navigating in tissue mazes: chemoattractant interpretation in complex environments. Curr. Opin. Ceil Biol 36,93–102 (2015). [DOI] [PubMed] [Google Scholar]
- 9.Giordano GF & Lichtman MA, Marrow cell egress. The central interaction of barrier pore size and cell maturation. J. Clin. Invest 52,1154–1164 (1973). [DOI] [PMC free article] [PubMed] [Google Scholar]
- 10.Pflicke H. & Sixt M Preformed portals facilitate dendritic cell entry into afferent lymphatic vessels. J. Exp. Med 206,2925–2935 (2009). [DOI] [PMC free article] [PubMed] [Google Scholar]
- 11.Dean KM, Roudot P, Welf ES, Danuser G & Fiolka R Deconvolution-free subcellular imaging with axially swept light sheet microscopy. Biophys. J 108 2807–2815(2015). [DOI] [PMC free article] [PubMed] [Google Scholar]
- 12.Renkawitz J, Reversat A, Leithner A, Merrin J & Sixt M Micro-engineered “pillar forests” to study cell migration in complex but controlled 3D environments. Methods Cell Biol. 147, 79–91 (2018). [DOI] [PubMed] [Google Scholar]
- 13.Thiam H-R et al. Perinuclear Arp2/3-driven actin polymerization enables nuclear deformation to facilitate cell migration through complex environments. Nat Commun. 7,10997 (2016). [DOI] [PMC free article] [PubMed] [Google Scholar]
- 14.Raab M et al. ESCRT III repairs nuclear envelope ruptures during cell migration to limit DNA damage and cell death. Science 352,359–362 (2016). [DOI] [PubMed] [Google Scholar]
- 15.Denais CM et al. Nuclear envelope rupture and repair during cancer cell migration. Science 352,353–358 (2016). [DOI] [PMC free article] [PubMed] [Google Scholar]
- 16.Plarada T et al. Nuclear lam in stiffness is a barrier to 3D migration, but softness can limit survival. J. Cell Biol 204, 669–682 (2014). [DOI] [PMC free article] [PubMed] [Google Scholar]
- 17.Irianto J et al. DNA damage follows repair factor depletion and portends genome variation in cancer cells after pore migration. Curr. Biol 27,210–223 (2017). [DOI] [PMC free article] [PubMed] [Google Scholar]
- 18.Le Berre M et al. Geometric friction directs cell migration. Phys. Rev. Lett Ill, 198101 (2013). [DOI] [PubMed] [Google Scholar]
- 19.Rowat AC et al. Nuclear envelope composition determines the ability of neutrophil-type cells to passage through micron-scale constrictions. J. Biol. Chem 288, 8610–8618 (2013). [DOI] [PMC free article] [PubMed] [Google Scholar]
- 20.Dahl KN et al. Distinct structural and mechanical properties of the nuclear lamina in Hutchinson—Gilford progeria syndrome. Proc. Natl Acad. Sci. USA 103 10271–10276(2006). [DOI] [PMC free article] [PubMed] [Google Scholar]
- 21.Verstraeten VLRM, Ji JY, Cummings KS, Lee RT & Lammerding J Increased mechanosensitivity and nuclear stiffness in Hutchinson–Gilford progeria cells: effects of farnesyltransferase inhibitors. Aging Cell 7,383–393 (2008). [DOI] [PMC free article] [PubMed] [Google Scholar]
- 22.Leithner A et al. Diversified actin protrusions promote environmental exploration but are dispensable for locomotion of leukocytes. Nat. Cell Biol 18 1253–1259 (2016). [DOI] [PubMed] [Google Scholar]
- 23.Luxton GW & Gundersen GG Orientation and function of the nuclear-centrosomal axis during cell migration. Curr. Opin. Cell Biol 23, 579–588 (2011). [DOI] [PMC free article] [PubMed] [Google Scholar]
- 24.Krummel MF & Macara I Maintenance and modulation of T cell polarity. Nat. Immunol 7,1143–1149 (2006). [DOI] [PubMed] [Google Scholar]
- 25.Eddy RJ, Pierini LM & Maxfield FR Microtubule asymmetry during neutrophil polarization and migration. Mol. Biol. Cell 13,4470–4483 (2002). [DOI] [PMC free article] [PubMed] [Google Scholar]
- 26.Yoo SK et al. The role of microtubules in neutrophil polarity and migration in live zebrafish. J. Cell Sci 125, 5702–5710(2012). [DOI] [PMC free article] [PubMed] [Google Scholar]
- 27.Bornens M Organelle positioning and cell polarity. Nat. Rev. Mol. Cell Biol 9 874–886 (2008). [DOI] [PubMed] [Google Scholar]
- 28.Liu BP, Chrzanowska-Wodnicka M & Burridge K Microtubule depolymerization induces stress fibers, focal adhesions, and DNA synthesis via the GTP-binding protein Rho. Cell Adhes. Commun 5249–255 (1998). [DOI] [PubMed] [Google Scholar]
- 29.Kwan KM & Kirschner MW A microtubule-binding Rho-GEF controls cell morphology during convergent extension of Xenopus laevis. Development 132, 4599–4610(2005). [DOI] [PMC free article] [PubMed] [Google Scholar]
- 30.Infante E et al. LINC complex-Lis1 interplay controls MT1-MMP matrix digest-on-demand response for confined tumor cell migration. Nat. Commun 9 2443 (2018). [DOI] [PMC free article] [PubMed] [Google Scholar]
- 31.Riedl J et al. Lifeact mice for studying F-actin dynamics. Nat. Methods 7, 168–169 (2010). [DOI] [PubMed] [Google Scholar]
- 32.Redecke V et al. Hematopoietic progenitor cell lines with myeloid and lymphoid potential. Nat. Methods 10, 795–803 (2013). [DOI] [PMC free article] [PubMed] [Google Scholar]
- 33.Leithner A et al. Fast and efficient genetic engineering of hematopoietic precursor cells for the study of dendritic cell migration. Eur. J. Immunol 48 1074–1077 (2018). [DOI] [PubMed] [Google Scholar]
- 34.Sixt M & Lämmermann T In vitro analysis of chemotactic leukocyte migration in 3D environments. Methods Mol. Biol 769,149–165 (2011). [DOI] [PubMed] [Google Scholar]
- 35.Beronja S, Livshits G, Williams S & Fuchs E Rapid functional dissection of genetic networks via tissue-specific transduction and RNAi in mouse embryos. Nat. Med 16,821–827 (2010). [DOI] [PMC free article] [PubMed] [Google Scholar]
- 36.Scaffidi P& Misteli T Lamin A-dependent misregulation of adult stem cells associated with accelerated ageing. Nat. Cell Biol 10,452–459 (2008). [DOI] [PMC free article] [PubMed] [Google Scholar]
- 37.Miller AL & Bement WM Regulation of cytokinesis by Rho GTPase flux. Nat. Cell Biol 11, 71–77 (2009). [DOI] [PMC free article] [PubMed] [Google Scholar]
- 38.Stewart SA et al. Lentivirus-delivered stable gene silencing by RNAi in primary cells. RNA 9, 493–501 (2003). [DOI] [PMC free article] [PubMed] [Google Scholar]
- 39.Leithner A, Merrin J, Reversat A & Sixt M Geometrically complex microfluidic devices for the study of cell migration. Protoc. Exch 10.1038/protex.2016.063 (2016). [DOI] [Google Scholar]
- 40.Lämmermann T et al. Rapid leukocyte migration by integrin-independent flowing and squeezing. Nature 453, 51–55 (2008). [DOI] [PubMed] [Google Scholar]
- 41.Schwarz J et al. A microfluidic device for measuring cell migration towards substrate-bound and soluble chemokine gradients. Sol. Rep 6, 36440 (2016). [DOI] [PMC free article] [PubMed] [Google Scholar]
- 42.Schindelin J et al. Fiji: an open-source platform for biological-image analysis. Nat. Methods 9, 676–682 (2012). [DOI] [PMC free article] [PubMed] [Google Scholar]
- 43.Tinevez J-Y et al. TrackMate: an open and extensible platform for single-particle tracking. Methods 115,80–90 (2017). [DOI] [PubMed] [Google Scholar]
- 44.Elliott H et al. Myosin II controls cellular branching morphogenesis and migration in three dimensions by minimizing cell-surface curvature. Nat. Cell Biol 17,137–147 (2015). [DOI] [PMC free article] [PubMed] [Google Scholar]
- 45.Otsu N A threshold selection method from gray-level histograms. IEEE Trans. Syst. Man Cybern 9,62–66 (1979). [Google Scholar]
- 46.Welf ES et al. Quantitative multiscale cell imaging in controlled 3D microenvironments. Dev. Cell 36,462–475 (2016). [DOI] [PMC free article] [PubMed] [Google Scholar]
- 47.Aguet F, Jacob M & Unser M IEEE International Conference on Image Processing 2005 (IEEE, 2005). [Google Scholar]
- 48.Sommer C, Straehle C, Koethe U & Hamprecht FA IEEE International Symposium on Biomedical Imaging: from Nano to Macro (IEEE, 2011). [Google Scholar]
- 49.Acton SE et al. Dendritic cells control fibroblastic reticular network tension and lymph node expansion. Nature 514, 498–502 (2014). [DOI] [PMC free article] [PubMed] [Google Scholar]
Associated Data
This section collects any data citations, data availability statements, or supplementary materials included in this article.


