

ABSTRACT
Transcription factors have already been proposed to work on some human diseases. Yet the role of translationally controlled tumor protein (TCTP) in cerebral palsy (CP) remains elusive. This study intends to examine the mechanism of TCTP on CP by regulating microRNA-200a (miR-200a).
CP models of rats were established referring to the internationally recognized improved hypoxic ischemic encephalopathy modeling method. The neuroethology of rats, ultrastructure and pathological condition in brain tissues of rats were observed through several assays. The expression of TCTP, miR-200a, myelin transcription factor 1-like (Myt1L), tyrosine hydroxylase (TH) and inducible nitric oxide synthase (iNOS) along with apoptosis in brain tissues of rats was detected. The levels of reactive oxygen species (ROS), malondialdehyde (MDA), glutathione (GSH), glutathione peroxidase (GSH-Px), superoxide dismutase (SOD), tumor necrosis factor-α (TNF-α) and interleukin-6 (IL-6) in brain tissues of rats were determined. The binding site between miR-200a and Myt1L was analyzed.
TCTP and Myt1L were overexpressed and miR-200a was under-expressed in CP rats. Elevated miR-200a ameliorated neurobehavior of CP rats and pathological injury in brain tissues. Elevated miR-200a up-regulated TH, GSH, GSH-Px, and SOD levels, down-regulated iNOS, ROS, MDA, TNF-α, and IL-6 levels, and attenuated neuronal apoptosis in brain tissues of CP rats. Myt1L was a target gene of miR-200a.
Altogether, our study suggested that diminution of transcription factor TCTP up-regulates miR-200a to limit Myt1L expression, thereby improving neurobehavior and oxidative stress injury in CP rats.
KEYWORDS: Translationally controlled tumor protein, MicroRNA-200a, Myt1l, cerebral palsy, neurobehavior, oxidative stress
Introduction
Cerebral palsy (CP) refers to a variety of eternal non-progressive disorders of movement and posture resulting from damage to the developing fetal or infant brain [1]. Clinical features of CP include incremental deep tendon reflexes, weakness, tremors, muscular hypertonicity, aberrantly slow and writhing movements of the limbs, poor balance and coordination, impaired hearing or vision, aberrant touch and pain perceptions [2]. The survival of patients with CP is associated with severity of impairment, birth weight, and to a certain extent, socioeconomic status, and most children with CP can survive to adulthood [3]. However, adults with CP are in a weak position in social life and employment, accompanied by physical fatigue and pain, and psychological difficulties [4]. In view of this, there is a pressing need to seek for more effective treatment for CP.
The translationally controlled tumor protein (TCTP) refers to a highly conserved protein that is extensively expressed in all eukaryotic organisms [5]. Literature has shown that TCTP might be implicated in neurotransmitter release and/or preserving synaptic structures in the brain, and it is likely to function in keeping synaptic functions and synaptic configurations significant for normal stress, cognitive and emotional functions [6]. There has been a study suggesting that the elevation of TCTP is involved in the progression and metastasis of cholangiocarcinoma [7]. An early report has revealed that TCTP can boost epithelial ovarian cancer progression and decline HO8910 cell sensitiveness to cisplatin [8]. MicroRNAs (miRNAs) refer to short non-coding RNAs of about 22 nucleotides, which have increasingly been considered as effective post-transcriptional regulators of gene expression and promising targets for therapeutic regulation in many diseases [9]. MiR-200a, a critical member of the miRNA family, has been discovered to restrain prostate cancer development via the BRD4/AR signaling pathway [10]. Evidence has indicated that in hepatocellular carcinoma, miR-200a depresses cell invasion and migration by modulating GAB1 [11]. Myelin transcription factor 1-like (Myt1L) is one of the three members of the family of zinc finger transcription factors and is capable of regulating neuronal differentiation [12]. A previous study by Wang T et al. has demonstrated that in the Chinese Han population, Myt1L is likely to be a potential risk gene for the major depressive disorder [13]. Nevertheless, no study has focused on the function of TCTP in CP. Therefore, our study is intended for the exploration of the effects of TCTP on rats with CP by modulating miR-200a.
Materials and methods
Ethics statement
All animal experiments were in line with the Guide for the Care and Use of Laboratory Animal by International Committees, and the study was approved by the Ethics Committee of The Second Hospital of Hebei Medical University.
Experimental animals
One hundred male or female Sprague Dawley rats aged 7 days and weighing 13 g-15 g were purchased from Shanghai Xipuer Bikai Experimental Animal Co., Ltd. (Shanghai, China). All rats fed under 45%-60% relative humidity at 23°C-25°C with 12 h of light and had free access to food and water. The environment was regularly disinfected and ventilated.
Modeling
Models were established referring to the internationally recognized improved hypoxic ischemic encephalopathy modeling method. The rats were anesthetized through intraperitoneal injection of 2% pentobarbital sodium (CHEMMART, Beijing, China) at 50 mg/kg. Then, rats were placed on the operating table in a supine position, limbs and head were fixed before iodophor disinfection, and a incision was made along the midline of the neck (5–7 mm). The subcutaneous tissue was separated, and the aorta of the left neck was separated from the triangular region at the junction of the sternocleidomastoid muscle and the anterior cervical muscle, followed by ligation with a No. 0 suture and the suture of the incision. Next, the rats were immediately placed in a water-enclosed anoxic tank of 37°C, which was continuously filled with the mixture of 8% O2 and 92% NO2, and the gas flow rate was 1 to 2 L/min. The rats were taken out after being in an anoxic state for 2 h. During this process, the oxygen content in the tank was continuously monitored with an oxygen meter to be maintained at 8%. The skin of the neck of rats in the sham operation group was cut to expose the left common carotid artery without ligation and anoxic treatment, followed by a suture of the skin.
Grouping
Seventy surviving CP rats successfully modeled were randomly grouped as follows (7 groups, 10 rats in each group): CP group: rat models of anoxic-ischemic CP without any other treatment; agomir negative control (NC) + CP group: rat models of anoxic-ischemic CP injected with agomir NC (5 μL) through the lateral ventricle 3 days after successful modeling; miR-200a agomir + CP group: rat models of anoxic-ischemic CP injected with miR-200a agomir (5 μL) through the lateral ventricle 3 days after successful modeling; antagomir NC + CP group: rat models of anoxic-ischemic CP injected with antagomir NC (5 μL) through the lateral ventricle 3 days after successful modeling; miR-200a antagomir + CP group: rat models of anoxic-ischemic CP injected with miR-200a antagomir (5 μL) through the lateral ventricle 3 days after successful modeling; shTCTP + antagomir NC + CP group: rat models of anoxic-ischemic CP injected with miR-200a antagomir NC (5 μL) + lv-TPTC-shRNA (20 μL) through the lateral ventricle 3 days after successful modeling; shTCTP + miR-200a antagomir + CP group: rat models of anoxic-ischemic CP injected with miR-200a antagomir (5 μL) + lv-TPTC-shRNA (20 μL) through the lateral ventricle 3 days after successful modeling. Injection method: lambdoidal suture was selected as the needle insertion point (2.0 mm beside the mouth, 1.5 mm beside the temple), and the needle was vertically inserted into the harnpan with a micro-injector, with the injection finished within 2 min, and withdrawn after retained for 30 s. All plasmids (miR-200a agomir, miR-200a antagomir, agomir NC, antagomir NC, TCTP-shRNA lentiviral plasmids) were purchased from Shanghai GenePharma Co., Ltd. (Shanghai, China).
Neurobehavioral assessment
The neurobehavioral assessment was performed when rats in each group were at the age of 28 days.
Morris water maze test
The rats were placed in the water facing the pool wall from four different points several times, and the time to find the platform hidden in the water was recorded, namely escape latency.
Suspension test
The rats grasped a 0.5-cm glass rod with front legs and the time of the falling of the glass rod was observed. The rats were scored according to the following standard: 1 point for <10 s, 2 points for 10 s–30 s, 3 points for 31 s–119 s, 4 points for 2 min–5 min, 5 points for 5 min.
Slope test
The rats were placed on a slope with a slope of 45°, and the time to turn the head was recorded.
Open field test
The bottom of a square box without cover with a length, width, and height of 36 cm was divided into 9 wells of equal size, and the activity of the rats was observed and recorded. Rats whose body of over 1/2 entering the adjacent square and that stood on its hind limbs scored 1 point, respectively, and both scores were added as the total score.
Hematoxylin-eosin (HE) staining
After the neurobehavioral assessment, the rats were anesthetized with 2% pentobarbital sodium and the heart was exposed after thoracotomy. The puncture needle was inserted into the left ventricle with a 20 mL syringe for injection of sterile saline, and at the same time the right ventricle was cut until the liquid flowing out became clear, followed by injection of 0.1 moL phosphate buffered saline (PBS) with 4% paraformaldehyde. Then, the rats were euthanized with neck dislocation and the brain tissues were immediately stored in PBS with 4% paraformaldehyde and fixed for more than 72 h. After common dehydration, permeabilization, and paraffin embedment, tissues were cut into 5-μm continuous coronal sections (from bregma to 3 mm beside the bregma), which were then attached to the pretreated slides. The paraffin sections were baked in a 60°C oven for 2 h, dewaxed to water with xylene and gradient alcohol, stained with hematoxylin staining solution for 10 min, and differentiated with hydrochloric acid alcohol, followed by microscopic observation to control the degree of differentiation. Next, after returning blue through tap water rinse, the sections were put in 95% ethanol for a few seconds, stained with eosin-staining solution for 2 min, dehydrated, permeabilized, and sealed with neutral gum. Finally, a light microscope was used for histopathological examination of brain tissues of rats in each group, and photos were taken.
Immunohistochemical staining
The paraffin sections were baked in a 60°C oven for 1 h, dewaxed to water, dehydrated, and placed in H2O2 solution for 10 min. Next, the sections were placed in citrate buffer in the microwave for antigen retrieval, and the antigens were then blocked with 10% normal goat serum working solution, incubated at 37°C for 2 h, and added with the primary antibody tyrosine hydroxylase (TH, 1:100, Boster Biological Technology Co., Ltd., Wuhan, China) and inducible nitric oxide synthase (iNOS, 1:50, Boster Biological Technology Co., Ltd., Wuhan, China) at 4°C overnight. Then, biotin-labeled goat anti-rabbit immunoglobulin G (IgG, Boster Biological Technology Co., Ltd., Wuhan, China) was added for 30-min incubation at 37°C. Then, the sections were stained with diaminobenzidine and hematoxylin before conventional dehydration, neutral gum sealing. The positive expression of TH and iNOS was observed under the microscope. Image analysis was performed with Image-Pro Plus 6.0 software (Media Cybernetics, MD, USA), and the average optical density values of TH- and iNOS-positive cells in each group were calculated.
Nissl staining
The sections were immersed in 0.5% gelatin, attached to gelatin-treated glass slides with a brush, and then air-dried. The sections were stained with Nissl staining solution (Beyotime Institute of Biotechnology, Shanghai, China) at room temperature for 15 min, dehydrated by gradient alcohol, placed in a characteristic color separation solution for color separation, and then dehydrated again. After xylene permeabilization and neutral gum sealing, the distribution of neurons in the brain tissues of rats in each group was observed under a microscope and photographed.
Terminal deoxyribonucleotidyl transferase (TDT)-mediated dUTP-digoxigenin nick end labeling (TUNEL) staining
The paraffin sections were baked in a 60°C oven for 1 h, dewaxed, permeabilized, stained with TUNEL solution based on the introductions of the TUNEL kit (Boster Biological Technology Co., Ltd., Wuhan, China), and slightly counterstained with hematoxylin. Cells whose nucleus was stained brownish yellow under the microscope were TUNEL-positive cells. Three sections were taken from each rat, and five different fields at high magnification (× 400) were randomly selected from each brain tissue section. The images were collected under the microscope with Image-Pro Plus 6.0 software (Media Cybernetics, MD, USA), and TUNEL-positive cells were counted for the calculation of the apoptotic index (AI). AI = number of TUNEL-positive cells/total number of cells × 100%.
Transmission electron microscope (TEM) observation
Brain tissue was taken and cut into 1 mm masses. Tissue masses were randomly selected from each group, double-fixed with 2.5% glutaraldehyde and 1% citric acid, dehydrated with gradient acetol (50%, 70%, 90%, 100%), embedded with embedding medium, and cut into ultra-thin sections (70–90 nm) after positioning. After double staining with uranyl acetate and lead citrate, the sections were observed by a 120KV TEM (Hitachi High-Technologies Corporation, Tokyo, Japan).
Oxygen-free radical detection
Brain tissue homogenate was prepared from 0.3 to 0.4 g brain tissue, and the remaining brain tissue was placed in pre-labeled cryotubes, quickly put into liquid nitrogen, and finally stored at −80°C for subsequent reverse transcription quantitative polymerase chain reaction (RT-qPCR) and western blot analysis. The brain tissue was placed in a small beaker after removing blood, supplemented with cold 0.86% normal saline, and shredded with ophthalmic scissors as soon as possible. The suspension was poured into a homogenate tube, and thoroughly homogenized with 0.86% normal saline. Then, the homogenate was centrifuged at 4000 r/min for 15 min, and the obtained supernatant was placed at −20°C for subsequent use. An appropriate amount of supernatant was taken for the detection of reactive oxygen species (ROS), malondialdehyde (MDA), glutathione (GSH), glutathione peroxidase (GSH-Px), and superoxide dismutase (SOD) according to the procedures of the kits of Nanjing Jiancheng Bioengineering Institute (Nanjing, China).
Inflammatory factor detection
The levels of tumor necrosis factor-α (TNF-α) and interleukin-6 (IL-6) were detected by enzyme-linked immunosorbent assay (ELISA) based on the instructions of the kit (Endogen, MA, USA). Standards of different concentrations of TNF-α and IL-6 were prepared, and added to solid-phase carrier coated with specific antibodies with brain tissue homogenate samples of rats in each group. The corresponding antigen bound to solid-phase antibody through incubation. Then, biotinylated antibody (Boster Biological Technology Co., Ltd., Wuhan, China) was added for reaction with antigen binding to solid-phase antibody after incubation. After removing unbound biotinylated antibody, horseradish peroxidase streptavidin (Shanghai Gaochem Biotechnology Co., Ltd.) was added to directly bind to the biotinylated antibody, followed by staining with tetramethyl benzidine (Sinopharm Chemical Reagent Co., Ltd., Shanghai, China). Finally, the optical density (OD) values were measured with a Bio-Rad Model 550 microplate ELISA reader (Bio-Rad, California, USA) at a dual wavelength of 450 nm to draw a standard curve, and the inflammatory factor contents of each group were calculated.
RT-qPCR
An appropriate amount of liquid nitrogen was pre-cooled in a mortar disinfected at high temperatures, and then an appropriate amount of brain tissue was added to be fully ground and powdered, followed by total RNA extraction from brain tissues in each group with RNA extraction kit (Thermo Fisher Scientific, Waltham, MA, USA) and purity measurement with an ultraviolet spectrophotometer. The miR-200a and U6 primers synthesized by Invitrogen (Shanghai, China) and designed with Primer premier 5.0 according to the gene sequence in GenBank, and TCTP, Myt1L, and glyceraldehyde-3-phosphate dehydrogenase (GAPDH) primers were synthesized by Shanghai GenePharma Co., Ltd. (Shanghai, China) (forward primer of miR-200a: 5'-TAGCAGCACGTAAATATTGGCG-3', reverse primer: the universal primer of EXPRESS SYBR® GreenERTM miRNA RT-qPCR Kit; forward primer of U6: 5'-GCAAGGATGACACGCAAATTC-3', reverse primer: the universal primer for EXPRESS SYBR® GreenERTM miRNA RT-qPCR Kit). Primer sequences of other genes were shown in Table 1. The RNA was reversely transcribed into cDNA with a reverse transcription kit (Takara, Dalian, China). U6 was employed as the internal reference for miR-200a, and GAPDH as that of TCTP and Myt1L. The relative expression of target genes was calculated by relative quantitative method 2−△△Ct [14]: △△Ct = △Ct experimental group – △Ct control group, ΔCt = Ct target gene-Ct reference gene.
Table 1.
Primer sequence.
| Gene | Primer sequence |
| TCTP | Forward: 5ʹ-AAAGCACAGTAGTCACCGGTGTTG-3’ |
| Reverse: 5'-TTGCTCTGCAGCTCCAGTCATAA-3’ | |
| Myt1L | Forward: 5'-GGACCAGTCTCCAAGACAGC-3’ |
| Reverse: 5'-ATTTACGTGGCCGGTTCCAT-3’ | |
| GAPDH | Forward: 5'-ACAGCAACAGGGTGGTGGAC-3’ |
| Reverse: 5'-TTTGAGGGTGCAGCGAACTT-3’ |
Note: TCTP, translationally controlled tumor protein; Myt1L, myelin transcription factor 1-like; GAPDH, glyceraldehyde-3-phosphate dehydrogenase.
Western blot analysis
The spare brain tissue was supplemented with the mixture of cell lysis buffer phenylmethanesulfonyl fluoride and radio-immunoprecipitation assay for grinding, followed by centrifugation, protein extraction, and boiling for total protein extraction of samples in each group. Then, the bicinchoninic acid protein quantification kit (Beijing ComWin Biotech Co. Ltd., Beijing, China) was used for protein quantification. Samples of each group were prepared according to the quantitative results, and then loaded for sodium dodecyl sulfate polyacrylamide gel electrophoresis, transferred to a polyvinylidene fluoride membrane, and blocked with a blocking solution for 2 h. Then primary antibody TCTP (1:500), Myt1L (1:300, Abcam, Cambridge, UK) and GAPDH (1:1000, ZSGB-Bio, Beijing, China) were added and kept at 4°C overnight, followed by adding secondary antibody, horseradish peroxidase-labeled IgG (goat anti-rat, 1:10,000) for 2-h incubation at room temperature. Next, the samples were exposed in a dark room for development, and analyzed by gel electrophoresis imager and Quantity One software. The relative protein expression of TCTP and Myt1L was calculated with GAPDH as the internal reference.
Dual luciferase reporter gene assay
The target site between Myt1L and miR-200a was predicted by online prediction software miRWalk. The primers were designed and synthetized with the 3-’Untranslated Region (UTR) sequence of Myt1L, and the forward and reverse primers were independently introduced into the cleavage sites of restriction endonuclease Hind III and Spe I. The mutant sequence of the binding site was designed, and the target sequence fragment was synthesized by Nanjing Genscript Biotechnology Co., Ltd. (Nanjing, China). The amplified target fragment and the pMIR-REPORTTM luciferase vector plasmid (Thermo Fisher Scientific, Massachusetts, USA) were digested with both Hind III and Spe I. The digested products were recovered to transform competent DH5α Escherichia coli after ligated with T4 DNA ligase. The monoclonal bacterial strain was selected and shaken for plasmid extraction, and the correct recombinant plasmid was obtained after enzyme digestion and sequencing. The wild type (WT) and Myt1L 3ʹ-UTR containing mutant sequence were cloned to the downstream of the open reading frame of the renilla luciferase of the psiCHECK-2 vector, and a dual luciferase reporter vector containing the wild and mutant vector was constructed. Subsequently, the cells were inoculated in a 12-well plate at 1 × 10⁵ 293T cells/well and co-transfected with the recombinant plasmid and miR-200a mimics before cell culture medium removal 48 h later. Then, each well was supplemented with 100 μL cell lysate of the luciferase kit for 30 min cell lysis. Finally, 20 μL cell lysate was mixed with 100 μL LARII for fluorescence value (A) measurement, and then mixed with 100 μL Stop&Glo reagent for fluorescence value (B) measurement; the luciferase activity value C = B/A, with firefly fluorescence value as the internal reference.
Statistical analysis
Statistical analysis was performed with SPSS 19.0 software (IBM Corp. Armonk, NY, USA). The measurement data were expressed as mean ± standard deviation. The data in the normal distribution in the comparison between two groups was performed by an independent sample t-test, and that among multiple groups was analyzed by one-way analysis of variance (ANOVA), followed by pairwise comparison by Tukey’s multiple comparisons test. The difference was considered statistically significant at P < 0.05.
Result
TCTP and Myt1L are overexpressed and miR-200a is under-expressed in CP rats
RT-qPCR and western blot analysis showed that miR-200a, TCTP, and Myt1L expression in brain tissue among CP group, agomir NC + CP group and antagomir NC + CP group was almost identical (P > 0.05); in relation to the sham group, miR-200a expression in brain tissue in the CP group reduced greatly, while TCTP and Myt1L expression increased substantially (all P < 0.05). miR-200a expression in the miR-200a agomir + CP group rose a lot, and Myt1L expression was decreased clearly versus the agomir NC + CP group (both P < 0.05); miR-200a expression in brain tissue declined obviously, and Myt1L expression grew palpably in the miR-200a antagomir + CP group versus the antagomir NC + CP group, and in the shTCTP + miR-200a antagomir + CP group versus the shTCTP + antagomir NC + CP group (all P < 0.05; Figure 1).
Figure 1.
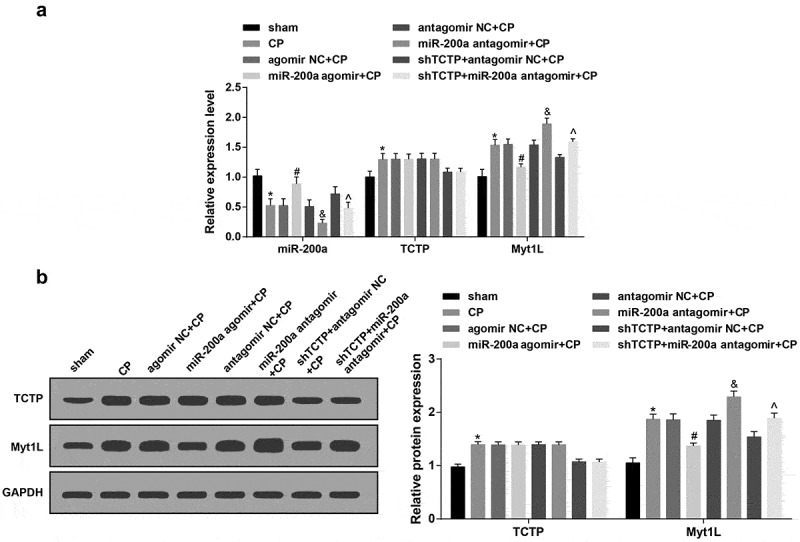
TCTP and Myt1L are overexpressed and miR-200a is underexpressed in CP rats. (a) Relative expression of miR-200a, TCTP and Myt1L in brain tissue in each group; (b) TCTP and Myt1L protein expression in brain tissue in each group; *, P < 0.05 versus the sham group; #, P < 0.05 vs. the agomir NC + CP group; &, P < 0.05 vs. the antagomir NC + CP group; ^, P < 0.05 vs. the shTCTP + antagomir NC + CP group; n = 5. Comparison among multiple groups was analyzed by one-way ANOVA, followed by pairwise comparison by Tukey’s multiple comparisons test.
Elevation of miR-200a ameliorates neurobehavior of CP rats
After modeling, the rats in the sham group were all alive and flexible, and they licked the hair for cleaning and fed and drank water normally. In the CP group, the rats had less activity and walked with a pronounced limp; there was also flexion and spasm of forelimbs and forepaws, poor mental and self-cleaning condition, and reduced intake of food and water, yet no death. Compared to the agomir NC + CP group, the condition of rats in the miR-200a agomir + CP group was a little better: they were all alive and could lick the hair for cleaning, and the condition of physical activity and intake of food and water was similar to that in the sham group. Versus the antagomir NC + CP group, the condition of rats in the miR-200a antagomir + CP group was slightly worse, with less behavior of licking the hair for cleaning, declined physical activity, and decreased intake of food and water, and there was no death. Relative to the shTCTP + antagomir NC + CP group, the condition of rats in the shTCTP + miR-200a antagomir + CP group was slightly worse, with less behavior of licking the hair for cleaning, reduced physical activity, and decreased intake of food and water, and there was no death.
Morris water maze test and slope test suggested that the escape latency and the time to turn the head upwards of rats in the CP group, agomir NC + CP group and antagomir NC + CP group prolonged relative to the sham group. The escape latency and the time to turn the head upwards shortened in the miR-200a agomir + CP group versus the agomir NC + CP group, and prolonged in the miR-200a antagomir + CP group versus the antagomir NC + CP group as well as in the shTCTP + miR-200a antagomir + CP group versus the shTCTP + antagomir NC + CP group (all P < 0.05; Figure 2(a,c))
Figure 2.
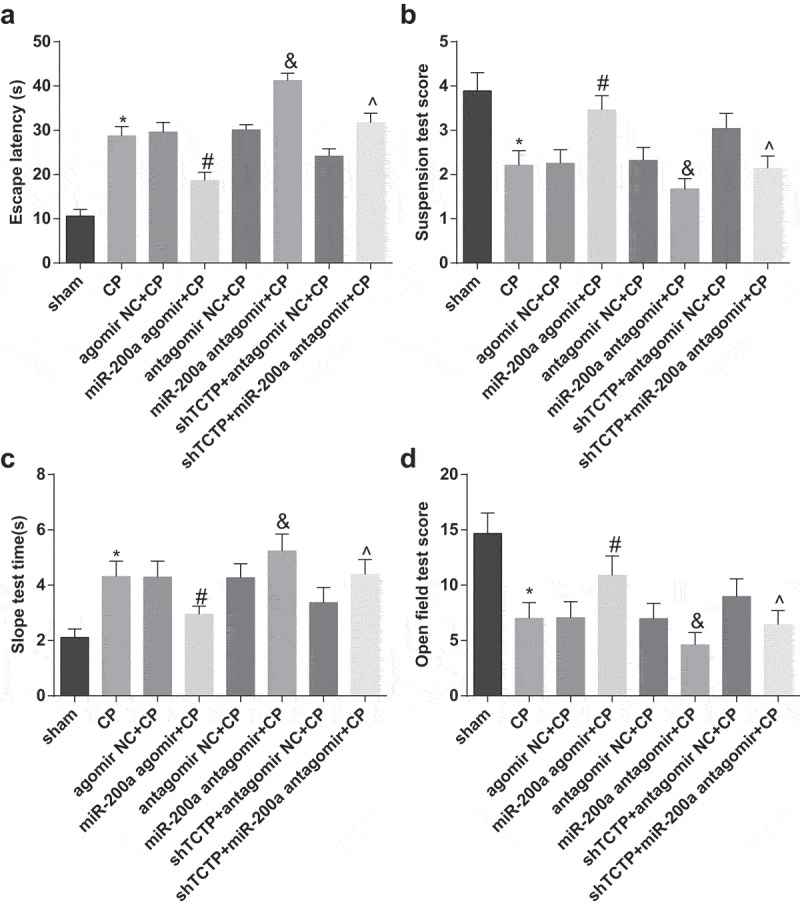
Elevation of miR-200a ameliorates the neurobehavior of CP rats. (a) Detection of the escape latency of rats in each group by Morris water maze test; (b) Neurobehavioral detection of rats in each group by suspension test; (c) Neurobehavioral detection of rats in each group by slope test; (d) Neurobehavioral detection of rats in each group by open field test; *, P < 0.05 vs. the sham group; #, P < 0.05 vs. the agomir NC + CP group; &, P < 0.05 vs. the antagomir NC + CP group; ^, P < 0.05 vs. the shTCTP + antagomir NC + CP group. n = 10. Comparison among multiple groups was analyzed by one-way ANOVA, followed by pairwise comparison by Tukey’s multiple comparisons test.
The results of the suspension test and open field test indicated that the scores of both tests of rats in all CP model groups lowered conspicuously in relation to the sham group. The scores of suspension test and open field test of rats ascended noticeably in the miR-200a agomir + CP group versus the agomir NC + CP group, and descended pronouncedly in the miR-200a antagomir + CP group versus the antagomir NC + CP group as well as in the shTCTP + miR-200a antagomir + CP group versus the shTCTP + antagomir NC + CP group (all P < 0.05; Figure 2(b,d)).
Elevation of miR-200a attenuates pathological injury in brain tissues of CP rats
Ultrastructure observation of brain tissue by TEM showed intact neurons in the sham group: rich rough endoplasmic reticula, free ribosomes and mitochondria, clear and regularly arranged mitochondrial cristae, clear nuclear membranes, and evenly distributed chromatin. In all model groups, neuronal edema was observed, and organelles were much less than those in the sham group; most of the mitochondrial cristae were fused with membranes or disappeared, and some mitochondria were cavitated; the rough endoplasmic reticula expanded conspicuously, and some double nuclear membranes were fused and fuzzy with reduced free ribosomes. In the miR-200a agomir + CP group and shTCTP + antagomir NC + CP group, organelles were far more clearer than those in the CP group, along with less mitochondrial sputum rupture and cavitation. In the miR-200a antagomir + CP group, the number of organelles diminished versus the CP group, along with shrunken nuclear membranes, condensed chromatin, and most cavitated mitochondria. No pronounced difference in the ultrastructure of brain tissue was witnessed in the agomir NC + CP group, the antagomir NC + CP group and the shTCTP + miR-200a antagomir + CP group in relation to the CP group (Figure 3(a)).
Figure 3.
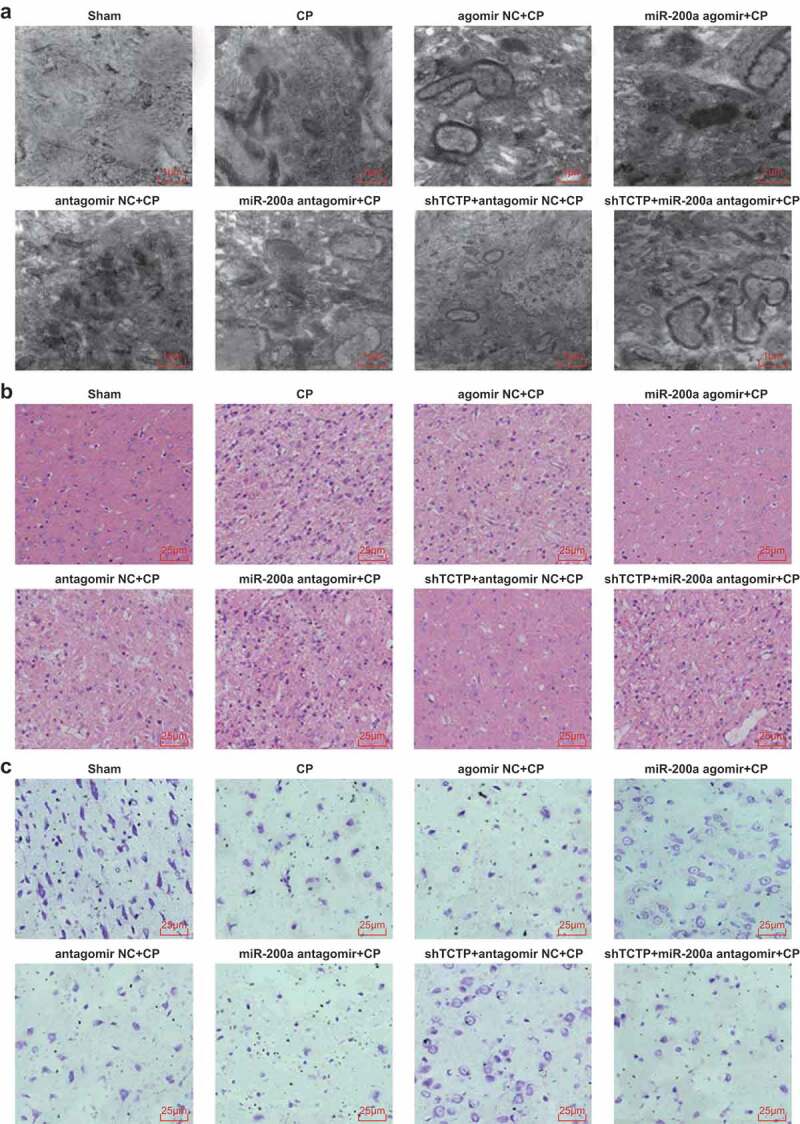
Elevation of miR-200a attenuates pathological injury in brain tissues of CP rats. (a) Observation of ultrastructure of brain tissues of rats in each group by the TEM; (b) Observation of the pathological condition of brain tissues of rats in each group by HE staining; (c) Observation of the pathological condition of brain tissues of rats in each group by Nissl staining; n = 5. Comparison among multiple groups was analyzed by one-way ANOVA, followed by pairwise comparison by Tukey’s multiple comparisons test.
HE staining revealed that cells of brain tissue in the sham group were arranged orderly with clear and normal morphology and structure. In the CP group, the residual cells were disordered, and shrunken, with local cystic degeneration and inflammatory cell accumulation, and cerebral cortical neurons were degenerated and necrotic so that the number of neurons was lessened. In contrast to the agomir NC + CP group, the degeneration and necrosis of residual cells in the miR-200a agomir + CP group were alleviated, with clearer cell morphology and elevated neurons. Relative to the antagomir NC + CP group, the degeneration and necrosis of residual cells in the miR-200a antagomir + CP group were aggravated, with disordered cell morphology and arrangement, and increased necrotic neurons. Versus the shTCTP + antagomir NC + CP group, degeneration, and necrosis of residual cells in the shTCTP + miR-200a antagomir + CP group were aggravated, with disordered cell morphology and arrangement and increased necrotic neurons (Figure 3(b)).
Nissl staining indicated that the cortical neurons in the sham group were dense and relatively uniformly distributed with regular morphological structure, a great number of clearly distinguishable lump or granular Nissl corpuscles, lightly stained nuclei located in the center of the cell body, and clear nucleoli, around which Nissl particles were large, no necrotic cells existed. Neurons in the CP group, agomir NC + CP group, antagomir NC + CP group, and shTCTP + miR-200a antagomir + CP group evidently dropped, and smaller cell bodies were witnessed, along with slight staining, disordered cell arrangement, large cell gap, obscure boundary between nucleus and cytoplasm, axons indistinguishable from dendrites, and distinctly decreased Nissl bodies. In the miR-200a agomir + CP group and shTCTP + antagomir NC + CP group, the neuronal staining was slightly shallower, and neurons were less than those of the sham group, and axons could be distinguished from dendrites. In the miR-200a antagomir + CP group, smaller cell bodies were seen, together with lighter staining of cytoplasm, slightly disordered cell arrangement, enlarged cell gap, blurred contours of Nissl bodies, and some missing neurons, and neurons were less than those of the CP group (Figure 3(c)).
Elevation of miR-200a upregulates TH and downregulates iNOS in brain tissues of CP rats
Comparison of the number of TH positive cells: in the substantia nigra pars compacta of the sham group, brown cells were observed, with high density, large number, clear contour, and normal morphology. Versus the sham group, the TH cells in all CP model groups reduced visibly (P < 0.05), and shallower staining and irregular cell distribution were observed. The same parameter grew markedly in the miR-200a agomir + CP group versus the agomir NC + CP group, and fell apparently in the miR-200a antagomir + CP group versus the antagomir NC + CP group as well as in the shTCTP +miR-200a antagomir + CP group versus the shTCTP + antagomir NC + CP group (all P < 0.05; Figure 4(a)).
Figure 4.
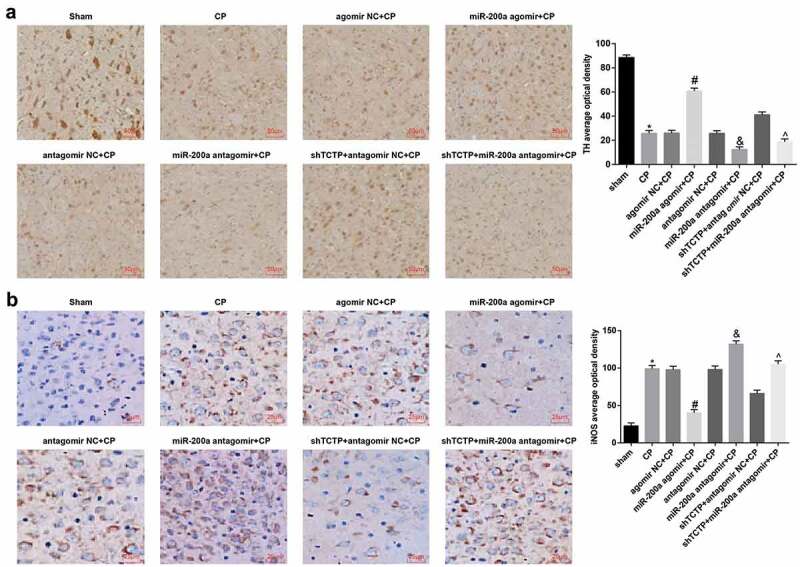
Elevation of miR-200a upregulates TH and downregulates iNOS in brain tissues of CP rats. (a) Number of TH-positive cells of brain tissues in each group; (b) The positive expression of iNOS of brain tissues in each group; *, P < 0.05 vs. the sham group; #, P < 0.05 vs. the agomir NC + CP group; &, P < 0.05 vs. the antagomir NC + CP group; ^, P < 0.05 vs. the shTCTP + antagomir NC + CP group; n = 5. Comparison among multiple groups was analyzed by one-way ANOVA, followed by pairwise comparison by Tukey’s multiple comparisons test.
Comparison of iNOS expression changes: little or no immunopositive expression of iNOS protein in the brain tissues were observed in the sham group. Versus the sham group, iNOS expression of all CP model groups began to increase, and the cell cytoplasm or membrane were heavily stained brownish yellow (P < 0.05). The same parameter descended noticeably in the miR-200a agomir + CP group versus the agomir NC + CP group, and ascended conspicuously in the miR-200a antagomir + CP group versus the antagomir NC + CP group as well as in the shTCTP + miR-200a antagomir + CP group versus the shTCTP + antagomir NC + CP group (all P < 0.05; Figure 4(b)).
Elevation of miR-200a abates neuronal apoptosis in brain tissues of CP rats
TUNEL staining showed hardly any apoptotic neurons in brain tissues of the sham group. The AI of brain tissues increased pronouncedly in all CP model groups versus the sham group, declined markedly in the miR-200a agomir + CP group versus the agomir NC + CP group, and rose evidently in the miR-200a antagomir + CP group versus the antagomir NC + CP group as well as in the shTCTP + miR-200a antagomir + CP group versus the shTCTP + antagomir NC + CP group (all P < 0.05; Figure 5).
Figure 5.
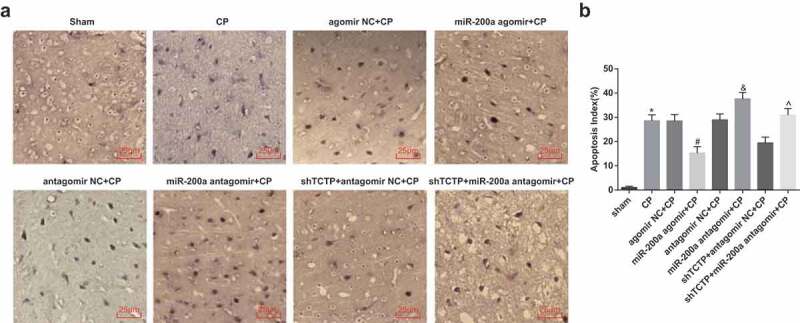
Elevation of miR-200a abates neuronal apoptosis in brain tissues of CP rats. Detection of neuronal apoptosis in brain tissues of rats in all groups by TUNEL staining. (a) TUNEL staining of rats in each group. (b) Comparison of AI of brain tissues in each group of rats. *, P < 0.05 vs. the sham group; #, P < 0.05 vs. the agomir NC + CP group; &, P < 0.05 vs. the antagomir NC + CP group; ^, P < 0.05 vs. the shTCTP + antagomir NC + CP group; n = 5. Comparison among multiple groups was analyzed by one-way ANOVA, followed by pairwise comparison by Tukey’s multiple comparisons test.
Elevation of miR-200a downregulates ROS and MDA levels and enhances GSH, GSH-Px and SOD levels in brain tissues of CP rats
ROS and MDA levels went up clearly, and GSH, GSH-Px and SOD levels went down significantly in the brain tissues of each CP model group in relation to the sham group. Moreover, ROS and MDA levels diminished noticeably and GSH, GSH-Px and SOD levels grew apparently in the miR-200a agomir + CP group versus the agomir NC + CP group, while ROS and MDA activity ascended significantly, and GSH, GSH-Px and SOD activity dropped visibly in the miR-200a antagomir + CP group versus the antagomir NC + CP group as well as in the shTCTP + miR-200a antagomir + CP group versus the shTCTP + antagomir NC + CP group (all P < 0.05; Figure 6(a,b)).
Figure 6.
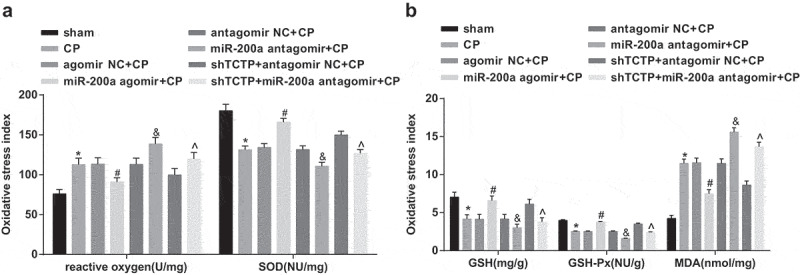
Elevation of miR-200a downregulates ROS and MDA levels and enhances GSH, GSH-Px and SOD levels in brain tissues of CP rats. (a) Detection of ROS and SOD levels in brain tissues of rats in all groups; (b) Detection of GSH, GSH-Px, and MDA levels in brain tissues of rats in all groups. *, P < 0.05 vs. the sham group; #, P < 0.05 vs. the agomir NC + CP group; &, P < 0.05 vs. the antagomir NC + CP group; ^, P < 0.05 vs. the shTCTP + antagomir NC + CP group; n = 5. Comparison among multiple groups was analyzed by one-way ANOVA, followed by pairwise comparison by Tukey’s multiple comparisons test.
Elevation of miR-200a downregulates TNF-α and IL-6 levels in the brain tissues of CP rats
ELISA suggested that TNF-α and IL-6 levels of brain tissues of rats rose pronouncedly in all CP model groups versus the sham group, went down obviously in the miR-200a agomir + CP group versus the agomir NC + CP group, and went up palpably in the miR-200a antagomir + CP group versus the antagomir NC + CP group as well as in the shTCTP + miR-200a antagomir + CP group versus the shTCTP + antagomir NC +CP group (all P < 0.05; Figure 7).
Figure 7.
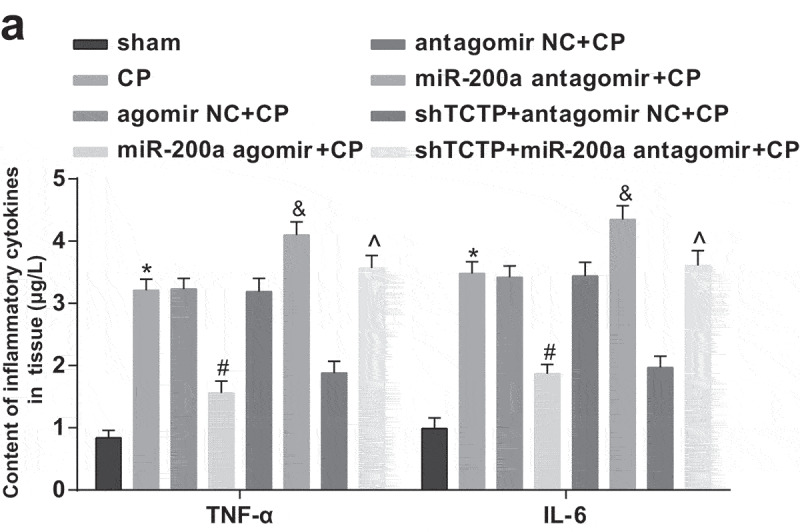
Elevation of miR-200a downregulates TNF-α and IL-6 levels in the brain tissues of CP rats. Detection of TNF-α and IL-6 levels in brain tissues of rats in all groups by ELISA. *, P < 0.05 vs. the sham group; #, P < 0.05 vs. the agomir NC + CP group; &, P < 0.05 vs. the antagomir NC + CP group; ^, P < 0.05 vs. the shTCTP + antagomir NC + CP group; n = 5. Comparison among multiple groups was analyzed by one-way ANOVA, followed by pairwise comparison by Tukey’s multiple comparisons test.
Myt1L is a target gene of miR-200a
Prediction by miRanda (a bioinformatics software) revealed that there were two miR-200a target sequences in Myt1L (Figure 8(a)). To confirm that the predicted binding sites of miR-200a resulted in a change in luciferase activity, WT and MUT sequences of the deletion of miR-200a binding site in Myt1L 3ʹ-UTR were separately designed and inserted into the reporter plasmid. MiR-200a mimics and WT-miR-200a/Myt1L or MUT-miR-200a/Myt1L recombine plasmids were separately co-transfected into 293T cells. The dual luciferase reporter gene assay indicated that in 293T cells, miR-200a mimics had no pronounced effect on the luciferase activity of MUT-miR-200a/Myt1L plasmids (P > 0.05), but diminished evidently the luciferase activity of WT-miR-200a/Myt1L plasmids (P < 0.05; Figure 8(b,c)).
Figure 8.
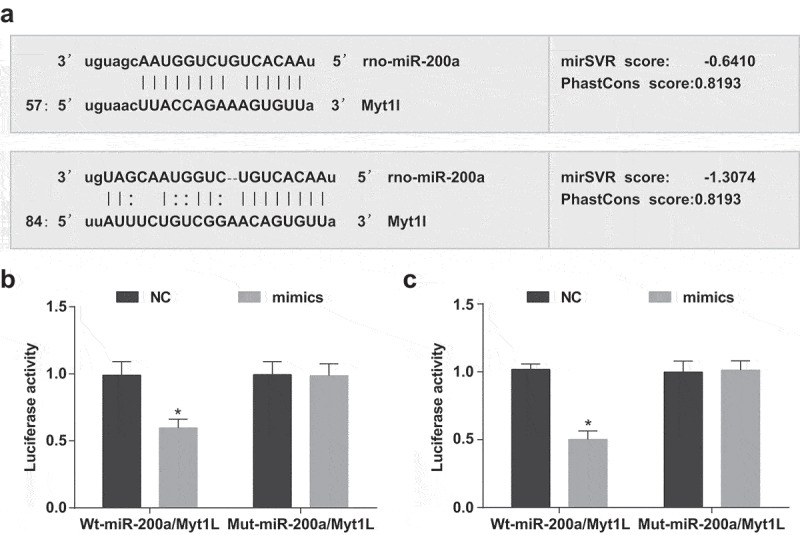
Myt1L is a target gene of miR-200a. (a) The predicted binding sites of miR-200a in Myt1L 3-’UTR; (b) Detection of binding site 1 between miR-200a and Myt1L by dual luciferase reporter gene assay; (c) Detection of binding site 2 between miR-200a and Myt1L by dual luciferase reporter gene assay; *, P < 0.05 vs. the NC group, the comparison between two groups was performed by independent sample t-test.
Discussion
CP is known as a collection of eternal disorders of movement and posture arising from a non-progressive damage to an immature brain [15]. There are no cure and few disease-modifying interventions of CP, and symptom management is the major treatment [16]. Lately, transcription factor TCTP has been reported to be involved in cholangiocarcinoma development [7]. Nevertheless, there was no literature probing into the function of TCTP in CP. Thus, our study is meant to discuss the effects of TCTP on rats with CP by regulating miR-200a. Collectively, our study indicates that diminution of transcription factor TCTP up-regulates miR-200a to limit Myt1L expression, thereby improving neurobehavior and oxidative stress injury in CP rats.
Through several assays, we discovered that TCTP and Myt1L expression was high while miR-200a expression was low in CP rats. Meanwhile, we found that Myt1L is a target gene of miR-200a. In accordance with our study, previous studies have proved that TCTP expression was substantially enhanced in glioma [17,18]. A similar study by Du J et al. has showed overexpression of TCTP in human lung cancer [19]. There has been report suggesting that in mice infected by murine hepatitis virus, the density of Myt1 expressing cells ascended evidently in injured areas of spinal cord white matter [20]. It is reported that Myt1L depletion in primary postmitotic neurons is able to de-repress non-neuronal programs and damnify neuronal expression and function, implying that Myt1L might actively and persistently repress many somatic lineage programs to maintain neuronal identity [21]. Ke pa A et al. have found that reduced Myt1L expression in the hippocampus is capable of declining expression of genes implicated in cancer and neurodegeneration [22]. It has been revealed that miR-200a expression in glioma is down-regulated in relation to normal tissues and cells [23]. Also, under-expressed miR-200a has been documented in breast cancer [24]. The above findings are all in favor of our results in the present study.
In addition, we also demonstrated that enhancement of miR-200a expression ameliorated the neurobehavior of CP rats and pathological injury in brain tissues. At the same time, we revealed that elevation of miR-200a expression up-regulated TH, GSH, GSH-Px, and SOD levels, down-regulated iNOS, ROS, MDA TNF-α and IL-6 levels, and abated neuronal apoptosis in brain tissues of CP rats. In line with our study, the results in a previous study indicated that neural stem cells modified by lentivirus-mediated miR-26a attenuate brain injury in rats with CP [25]. Similarly, there has been report illustrating that, in liver cancer, enhanced miR-200a expression negatively functions in the epithelial-mesenchymal transition of cancer stem cells [26]. Study has also documented that miR‑200a modulates FOXA1 expression to exert inhibitory effects on glioma progression [27]. Tsouko E et al. have also demonstrated that miR-200a constrains cell migration of triple-negative breast cancer by directly suppressing EPH receptor A2 [28]. A recent study has suggested that the elevation of miR-188-3p in ApoE-deficient mice results in a decrease in iNOS expression [29]. Evidence has indicated that miR-133a overexpression augments TH expression in diabetic rat’s heart [30]. In rats suffering from renal ischemia-reperfusion injury, incremental miR-204-5p expression leads to a decrease in MDA content and a rise in GSH-Px and SOD levels, as demonstrated by Zhu Y et al. [31]. Moreover, it has been proposed that in ovarian cancer, the miR-29b expression is negatively related to ROS levels [32]. Furthermore, miR-26 limits TNF-α/NF-кB signaling and IL-6 expression via the diminution of HMGA1 and MALT1 [33], which is consistent with what we have obtained in the present study.
Taken together, our study demonstrates that a decrease of transcription factor TCTP elevates miR-200a expression to down-regulate Myt1L, thus ameliorating neurobehavior and oxidative stress injury in CP rats. Our study offers new clues for the role of the TCTP/miR-200a/Myt1L axis in rats with CP and highlights a new direction for the clinical treatment of CP. However, more studies are expected to thoroughly elucidate the mechanism of transcription factor TCTP on CP.
Acknowledgments
We would like to acknowledge the reviewers for their helpful comments on this pap.
Disclosure statement
No potential conflict of interest was reported by the authors.
Ethical statement
All animal experiments were in line with the Guide for the Care and Use of Laboratory Animal by International Committees, and the study was approved by the Ethics Committee of The Second Hospital of Hebei Medical University.
Authors’ contributions
Guarantor of integrity of the entire study: Xiaoxia He
Study design: Hongling Li, Zibo Liu
Experimental studies: Yatao Pang, Wei Xu
Manuscript editing: Long Zhao
References
- [1].Nahm NJ, Graham HK, Gormley ME, et al. Management of hypertonia in cerebral palsy. Curr Opin Pediatr. 2018;30(1):57–64. [DOI] [PubMed] [Google Scholar]
- [2].Krigger KW. Cerebral palsy: an overview. Am Fam Physician. 2006;73(1):91–100. [PubMed] [Google Scholar]
- [3].Gulati S, Sondhi V. Cerebral palsy: an overview. Indian J Pediatr. 2018;85(11):1006–1016. [DOI] [PubMed] [Google Scholar]
- [4].Colver A, Fairhurst C, Pharoah POD. Cerebral palsy. Lancet. 2014;383(9924):1240–1249. [DOI] [PubMed] [Google Scholar]
- [5].Bommer UA, Thiele BJ. The translationally controlled tumour protein (TCTP). Int J Biochem Cell Biol. 2004;36(3):379–385. [DOI] [PubMed] [Google Scholar]
- [6].Bae SY, Sheverdin V, Maeng J, et al. Immunohistochemical localization of translationally controlled tumor protein in axon terminals of mouse hippocampal neurons. Exp Neurobiol. 2017;26(2):82–89. [DOI] [PMC free article] [PubMed] [Google Scholar]
- [7].Phanthaphol N, Techasen A, Loilome W, et al. Upregulation of TCTP is associated with cholangiocarcinoma progression and metastasis. Oncol Lett. 2017;14(5):5973–5979. [DOI] [PMC free article] [PubMed] [Google Scholar]
- [8].Chen C, Deng Y, Hua M, et al. Expression and clinical role of TCTP in epithelial ovarian cancer. J Mol Histol. 2015;46(2):145–156. [DOI] [PubMed] [Google Scholar]
- [9].Mellis D, Caporali A. MicroRNA-based therapeutics in cardiovascular disease: screening and delivery to the target. Biochem Soc Trans. 2018;46(1):11–21. [DOI] [PubMed] [Google Scholar]
- [10].Guan H, You Z, Wang C, et al. MicroRNA-200a suppresses prostate cancer progression through BRD4/AR signaling pathway. Cancer Med. 2019;8(4):1474–1485. [DOI] [PMC free article] [PubMed] [Google Scholar]
- [11].Wang J, Song W, Shen W, et al. MicroRNA-200a Suppresses Cell Invasion and Migration by Directly Targeting GAB1 in Hepatocellular Carcinoma. Oncol Res. 2017;25(1):1–10. [DOI] [PMC free article] [PubMed] [Google Scholar]
- [12].Melhuish TA, Kowalczyk I, Manukyan A, et al. Myt1 and Myt1l transcription factors limit proliferation in GBM cells by repressing YAP1 expression. Biochim Biophys Acta Gene Regul Mech. 2018;1861(11):983–995. [DOI] [PMC free article] [PubMed] [Google Scholar]
- [13].Wang T, Zeng Z, Li T, et al. Common SNPs in myelin transcription factor 1-like (MYT1L): association with major depressive disorder in the Chinese Han population. PLoS One. 2010;5(10):e13662. [DOI] [PMC free article] [PubMed] [Google Scholar]
- [14].Livak KJ, Schmittgen TD. Analysis of relative gene expression data using real-time quantitative PCR and the 2(-Delta Delta C(T)) Method. Methods. 2001;25(4):402–408. [DOI] [PubMed] [Google Scholar]
- [15].Akhter N, Khan AA, Ayyub A. Motor impairment and skeletal mineralization in children with cerebral palsy. J Pak Med Assoc. 2017;67(2):200–203. [PubMed] [Google Scholar]
- [16].Wimalasundera N, Stevenson VL. Cerebral palsy. Pract Neurol. 2016;16(3):184–194. [DOI] [PubMed] [Google Scholar]
- [17].Gu X, Yao L, Ma G, et al. TCTP promotes glioma cell proliferation in vitro and in vivo via enhanced beta-catenin/TCF-4 transcription. Neuro Oncol. 2014;16(2):217–227. [DOI] [PMC free article] [PubMed] [Google Scholar]
- [18].Miao X, Chen Y-B, Xu S-L, et al. TCTP overexpression is associated with the development and progression of glioma. Tumour Biol. 2013;34(6):3357–3361. [DOI] [PubMed] [Google Scholar]
- [19].Du J, Yang P, Kong F, et al. Aberrant expression of translationally controlled tumor protein (TCTP) can lead to radioactive susceptibility and chemosensitivity in lung cancer cells. Oncotarget. 2017;8(60):101922–101935. [DOI] [PMC free article] [PubMed] [Google Scholar]
- [20].Vana AC, Lucchinetti CF, Le TQ, et al. Myelin transcription factor 1 (Myt1) expression in demyelinated lesions of rodent and human CNS. Glia. 2007;55(7):687–697. [DOI] [PMC free article] [PubMed] [Google Scholar]
- [21].Mall M, Kareta MS, Chanda S, et al. Myt1l safeguards neuronal identity by actively repressing many non-neuronal fates. Nature. 2017;544(7649):245–249. [DOI] [PMC free article] [PubMed] [Google Scholar]
- [22].Kepa A, Martinez Medina L, Erk S, et al. Associations of the Intellectual Disability Gene MYT1L with Helix-Loop-Helix Gene Expression, Hippocampus Volume and Hippocampus Activation During Memory Retrieval. Neuropsychopharmacology. 2017;42(13):2516–2526. [DOI] [PMC free article] [PubMed] [Google Scholar]
- [23].Wang C, Kang L, Wang X, et al. Expression of miR-200a and chemotherapeutic treatment efficacy of glioma. Oncol Lett. 2018;15(4):5767–5771. [DOI] [PMC free article] [PubMed] [Google Scholar]
- [24].Zou Q, Zhou E, Xu F, et al. A TP73-AS1/miR-200a/ZEB1 regulating loop promotes breast cancer cell invasion and migration. J Cell Biochem. 2018;119(2):2189–2199. [DOI] [PubMed] [Google Scholar]
- [25].Guo Q, Zhang J, Zheng Z, et al. Lentivirus-mediated microRNA-26a-modified neural stem cells improve brain injury in rats with cerebral palsy. J Cell Physiol. 2020;235(2):1274–1286. [DOI] [PubMed] [Google Scholar]
- [26].Wang J, Yang X, Ruan B, et al. Overexpression of miR-200a suppresses epithelial-mesenchymal transition of liver cancer stem cells. Tumour Biol. 2015;36(4):2447–2456. [DOI] [PubMed] [Google Scholar]
- [27].Chen X, Liu K, Yang P, et al. microRNA-200a functions as a tumor suppressor by targeting FOXA1 in glioma. Exp Ther Med. 2019;17(1):221–229. [DOI] [PMC free article] [PubMed] [Google Scholar]
- [28].Tsouko E, Wang J, Frigo DE, et al. miR-200a inhibits migration of triple-negative breast cancer cells through direct repression of the EPHA2 oncogene. Carcinogenesis. 2015;36(9):1051–1060. [DOI] [PMC free article] [PubMed] [Google Scholar]
- [29].Zhang XF, Yang Y, Yang X-Y, et al. MiR-188-3p upregulation results in the inhibition of macrophage proinflammatory activities and atherosclerosis in ApoE-deficient mice. Thromb Res. 2018;171:55–61. [DOI] [PubMed] [Google Scholar]
- [30].Nandi SS, Zheng H, Sharma NM, et al. Lack of miR-133a Decreases Contractility of Diabetic Hearts: A Role for Novel Cross Talk Between Tyrosine Aminotransferase and Tyrosine Hydroxylase. Diabetes. 2016;65(10):3075–3090. [DOI] [PMC free article] [PubMed] [Google Scholar]
- [31].Zhu Y, Yin X, Li J, et al. Overexpression of microRNA-204-5p alleviates renal ischemia-reperfusion injury in mice through blockage of Fas/FasL pathway. Exp Cell Res. 2019;381(2):208–214. [DOI] [PubMed] [Google Scholar]
- [32].Hou M, Zuo X, Li C, et al. Mir-29b Regulates Oxidative Stress by Targeting SIRT1 in Ovarian Cancer Cells. Cell Physiol Biochem. 2017;43(5):1767–1776. [DOI] [PubMed] [Google Scholar]
- [33].Chen CY, Chang JT, Ho Y-F, et al. MiR-26 down-regulates TNF-alpha/NF-kappaB signalling and IL-6 expression by silencing HMGA1 and MALT1. Nucleic Acids Res. 2016;44(8):3772–3787. [DOI] [PMC free article] [PubMed] [Google Scholar]