Abstract
We propose an efficient and accurate measure for ranking spreaders and identifying the influential ones in spreading processes in networks. While the edges determine the connections among the nodes, their specific role in spreading should be considered explicitly. An edge connecting nodes and may differ in its importance for spreading from to and from to . The key issue is whether node , after infected by through the edge, would reach out to other nodes that itself could not reach directly. It becomes necessary to invoke two unequal weights and characterizing the importance of an edge according to the neighborhoods of nodes and . The total asymmetric directional weights originating from a node leads to a novel measure , which quantifies the impact of the node in spreading processes. An -shell decomposition scheme further assigns an -shell index or weighted coreness to the nodes. The effectiveness and accuracy of rankings based on and the weighted coreness are demonstrated by applying them to nine real-world networks. Results show that they generally outperform rankings based on the nodes' degree and -shell index while maintaining a low computational complexity. Our work represents a crucial step towards understanding and controlling the spread of diseases, rumors, information, trends, and innovations in networks.
I. INTRODUCTION
The structural properties of complex networks and the intricate interplay between the structure and spreading dynamics lead to highly diversified spreading capabilities among individual nodes. From the perspective of the severity of a spreading process, the most influential spreaders are those resulting in a much larger final infected proportion of the whole system when the spread of a disease or a piece of information originates from them than from other nodes. Centrality measures such as the degree [1], betweenness [2], closeness [3], eigenvector centrality [4], and -shell coreness [5] have been used to identify the most influential spreaders. The degree is the simplest measure. In social networks, for example, an individual with a large degree has more direct contact with other people and is thus likely to be more influential than one with a small degree for transmitting disease or information. Subsequent research indicates that the core nodes as identified by the -shell decomposition are the most influential spreaders [6]. Algorithms based on other centrality measures have been proposed to improve the accuracy of identifying influential spreaders [7–10]. They include the neighborhood coreness [11], improved eigenvector centrality [12,13], index [14,15], and nonbacktracking centrality [16].
Methods other than centrality-based algorithms have also been proposed for predicting how influential a node can be in a spread. For example, by counting the number of possible infection paths of various lengths, the final infection range can be estimated for a spread originated from any node [17]. The degree distribution of clusters of infected nodes after certain transmission events leads to a node property called the expected force, which can be applied to predict the spreading influence of all nodes under different epidemiological models [18]. The dynamic-sensitive centrality is able to locate influential nodes from both topological features and the dynamical parameters, such as the infection and recovery rates in a susceptible-infected-recovered (SIR) spreading model [19]. In the -truss decomposition, which is a triangle-based extension of -shell decomposition, the maximal -truss subgraph contains the most influential spreaders [20].
In most studies on identifying influential spreaders so far, the networks are taken to be unweighted and undirected. Each edge is treated as being equivalent in its function, as in the centrality and ranking methods [10]. However, edges in a network could be quite different [21]. In weighted networks, the weight of an edge reflects the strength of the interaction between the connected nodes, as in situations concerning the number of communications, size of trade, intimacy of friendship, frequency of cooperation, etc. [22–24]. In addition, edges may not be equally important in keeping the network robust [25]. An example is the small influence on network robustness in food web networks when redundant links are removed [26]. In terms of network functionality, differences among edges are also observed. For example, removing redundant links has no effect on network synchronization [27], but closing specific routes in air transportation networks can minimize the spreading of a disease [28]. To quantify the weight of an edge, a class of measures relying on its importance in the network structure has been defined [29]. For example, the edge betweenness counts the number of shortest paths between any two nodes that go through the edge and it can be regarded as the weight of an edge [30]. Immunizing edges of high betweenness was found to be effective in suppressing epidemics [31], but deleting such edges in scale-free networks would enhance the transmission efficiency dramatically [32]. In a global air transportation network, the strength of an edge that reflects the volume of passengers traveling between two airports was found to correlate positively with the product of the degree of the connected nodes. Thus, a measure [33] was introduced as the weight of an edge. This measure has been adopted in many works for distinguishing the importance among edges in unweighted networks [34–36].
In the present work we propose a measure to quantify the importance of an edge when spreading processes are concerned. As spreading is necessarily directional, e.g., only an infected node would spread a disease to a neighboring susceptible node but not the other way round, our measure stresses the importance of an edge in the spreading dynamics in the vicinity of the two nodes connected by the edge and it has the general property of . The sum of asymmetric weights of links originated from a node defines a measure of the strength of a node , which is shown to be an efficient quantity for identifying influential spreaders with a low computational complexity. Based on the node strength, an -shell decomposition scheme is proposed for assigning an -shell index to every node, which provides a more accurate ranking of the nodes in their influence in spreading processes.
The paper is organized as follows. In Sec. II the degree centrality, -shell index, the spreading model used in the study, and the methods of evaluating the performance of measures for identifying influential spreaders are introduced for completeness. In Sec. III we propose a measure that focuses on the importance of an edge in the dynamics of a spreading process. The measure is then applied to define a node strength for every node. An -shell decomposition method that emphasizes the importance of a node in the spreading dynamics is proposed. In Sec. IV we apply the node strength and -shell index to rank and identify influential spreaders in nine real-world networks and demonstrate their effectiveness. A summary is given in Sec. V.
II. CENTRALITIES, SPREADING MODEL, AND EVALUATION METHODS
We review briefly the degree centrality and the -shell index for completeness. They are efficient measures for identify influential spreaders [37–39]. We will compare the performance of our presently defined node strength and -shell index with these methods. The SIR model is adopted to simulate the spreading dynamics on networks. To quantify the performance of our measures in predicting the influence of the nodes and identifying influential spreaders, Kendall's correlation and the imprecision function are introduced.
A. Degree and -shell centrality
In a graph , where is the set of nodes and is the set of edges, the degree of a node is the number of links it carries. It is given by , where is an element of the adjacent matrix, with if there is a link between nodes and and otherwise. The -shell decomposition method decomposes the network into hierarchical shells in a progressive process. Initially, nodes with degree are removed from the network together with their links. After the process, nodes with only one link left may appear. These nodes and their links are then removed and the process is repeated until there are no nodes left in the network with only one link. The removed nodes and links form the 1-shell, and these nodes are assigned an index . Next, nodes with degree are removed in a similar way and the set of removed nodes are assigned an index . This pruning process is continued until all nodes are removed and assigned a index. This index is called the -shell index or coreness of a node. It represents the core position of a node in the network. Nodes with a large are considered to be at the core of the network, while nodes with a small form the peripheral part of the network.
Nodes with a large degree and large coreness are considered the most influential spreaders in networks. These measures have a low computational complexity of and , respectively, where and are the number of nodes and edges in the network, respectively. By using the bin-sort structure, the complexity of the -shell decomposition can even reduce to [40].
B. The SIR model
The SIR model is chosen to simulate spreading on complex networks. In the model, the nodes have three possible states: susceptible, infected, and recovered. At each time step, the infected nodes infect their susceptible neighbors with a probability and then recover with a probability . To quantify the influence of each node on spreading, we let one node, say, node , be infected and all the other nodes be susceptible initially. The SIR dynamics proceeds from the seed-infected node to other nodes until there is no infected node in the network. The recovered nodes at the end are those once infected and the fraction of recovered nodes gives the final infected range of the initial seed. For an initially infected node , the spreading dynamics is repeated for 100 times. The average infected range of node is recorded and taken to reflect the influence or the spreading efficiency of the node . This quantity can be obtained for any node in the network and used as a measure to rank the nodes on their importance in the spreading dynamics. This dynamics-based list is taken to be the exact ranking that gauges the accuracy of other topology-based measures.
While the final infected ranges for the nodes vary with the parameters and in the SIR model, the relative ranking of spreading efficiency of the nodes remains unchanged in a wide range of infection probabilities [38]. Thus, we take the recovered probability to be for simplicity. The infection probability should be chosen more carefully. On the one hand, it should be above the epidemic threshold to ensure that the disease can spread to a large part of the network [41]. On the other hand, too large an infection probability gives spreading efficiencies of the nodes that are too close to each other to clearly distinguish their relative importance. In the results that follow, we choose an infection probability that is above the epidemic threshold and makes the final infected range amount to – of the system for most nodes as the spreading origins [6].
C. Kendall's correlation and imprecision function
Two figures of merit are used to quantify the performance of different topology-based measures for predicting the spreading efficiency of the nodes. Kendall's correlation coefficient measures the ranking consistency of two lists that rank the same set of objects. By referring to the number of concordant ranking pairs and the number of discordant ranking pairs in two ranking lists of objects, the correlation coefficient is evaluated as
| (1) |
where sgn(x) is the sign function, which returns 1 if , if , and 0 if , and the summation is over all distinguished pairs and . Here is the rank of node in ranking list 1, while is the rank of node in ranking list 2. In the present context, list 1 is a topology-based ranking and list 2 is the SIR dynamics-based ranking. If has the same sign as , the two lists give the same relative ranking of node and node . Therefore, a large implies a more concordant relation between two methods of ranking the nodes.
For spreading processes, it is also important to quantify the accuracy in pinpointing the most influential spreaders. For a topology-based measure , e.g., some kind of node centrality, let be the average spreading efficiency of the nodes carrying the highest measure . Similarly, let be the average spreading efficiency of nodes carrying the highest actual spreading efficiency according to the SIR dynamics. The imprecision function [6]
| (2) |
quantifies how close to the actual spreading is the average spreading of the nodes based on centrality measure. A smaller represents a higher accuracy of in identifying the most influential spreaders.
III. DYNAMICAL IMPORTANCE OF EDGES AND WEIGHTED NODE CENTRALITY
The dynamical importance of an edge is analyzed by focusing on the spreading dynamics and the edge's local structure. This leads to the necessity of assigning bidirectional and asymmetric weights to an edge. A node strength can then be defined to quantify the impact of a node on spreading. An -shell decomposition method is proposed to be a reliable way of ranking the nodes for spreading processes.
A. Dynamical importance of edges
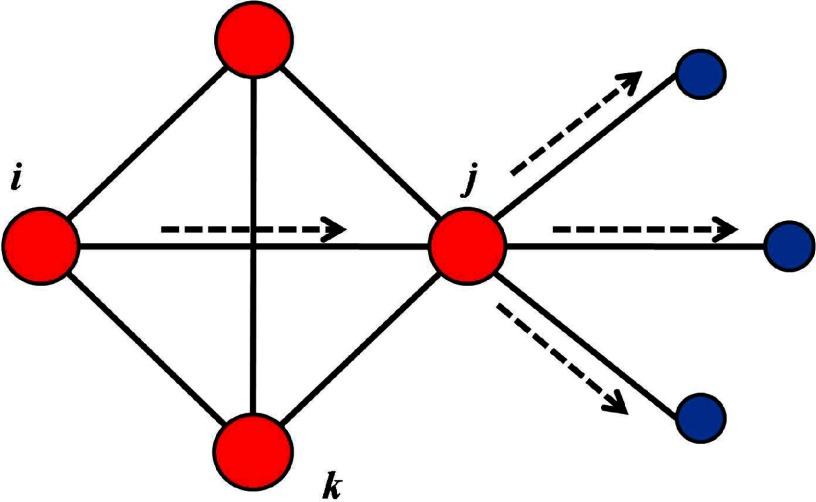
Figure 1 shows part of a network. When a disease originates from node and spreads along the edge , node will be infected first. Once node is infected, it could spread to other parts of the network through node 's outgoing edges, which are edges that connect node to nodes that are not in 's neighborhood. The number of outgoing edges from is denoted by and it is 3 in the example of Fig. 1. Note that should depend on the node , as must be a neighboring node of . In contrast, the edge has zero outgoing edges after it is infected by node . Therefore, the edge is expected to be more important in that it is more likely to lead to a larger infected area than confining the infection to node 's neighborhood as does [18,39]. We are therefore motivated to introduce a measure to distinguish the different importance of edges in a spreading process, even though the links may be unweighted in the construction of the network.
FIG. 1.
Local structure of a network emphasizing the role of the link in spreading a disease from node to node and then to reach out to nodes that node itself cannot reach. The same link , however, plays a different role as it does not help spread the disease to nodes beyond the reach of node after it infects node . The asymmetry requires the assignment of directional weights with .
For our purpose, we define a weight for an edge by
| (3) |
to represent its importance in a spreading process from node to node . The first term stands for the basic effect of infecting the direct neighbor of node through the edge. We test the result of neglecting this element and find that the ranking accuracy is not as good as keeping it, implying that the basic effect of an edge on the direct neighbor should not be neglected. The factor is included to reflect the potential impact of node through infecting its neighbor . The product include the degree of node in the consideration. The idea can be illustrated by considering a leaf node (node of degree 1) connected to a hub (a node of large degree), the number of outgoing links is very large for this leaf node. However, its impact is not necessarily high because only when it and its neighboring hub are infected could the infection spread to the other part of the network. The parameter serves to tune the contribution of to the importance of edge .
The presence of emphasizes the asymmetric importance of an edge. The weight is different from for the same link connecting node and node . From Eq. (3), , which measures the importance of the edge when a spread goes from node to node along the link and then moves on to other parts of the network. Note that generally as they are defined by considering the neighborhoods of the neighbors of node and node , respectively. Given a network, and can be evaluated entirely based on the network topology and they label every edge to better reflect the bidirectional and yet asymmetric contributions of the edge in spreading processes. There are many other ways to define the edge weight from the network topology [30,33]. For example, the edge multiplicity is defined as the number of triangles an edge participates in Ref. [42]. This method defines the weight symmetrically in both directions and focuses on the influence of clustering, i.e., counting the number of nodes that are both first and second neighbors. This idea is partly in contrast to our method of weakening the effect of nodes that are both first and second neighbors. While the edge multiplicity focuses on the effect of spreading in the first neighborhood, our way of defining the link impact considers further steps of spreading out of the first neighborhood, thus resulting in asymmetrically defined weights.
B. Node strength and -shell decomposition
It will be advantageous to introduce a node-level quantity analogous to the degree to quantify the importance of a node in spreading dynamics. This will put the computational complexity at the same level as those based on the degree and -shell decomposition. Motivated by the idea of a weighted degree [22] that the strength of a node in a weighted graph is the sum of the weights of its edges, we define the strength of a node by
| (4) |
where the summation is over the nodes belonging to the neighborhood of node . Invoking in the definition of makes it a better measure in quantifying a node's importance in spreading dynamics.
We propose an -shell decomposition method as an extension of the -shell decomposition. The algorithm is as follows. With the strengths evaluated for all nodes, the algorithm starts with removing the nodes with the smallest strength and the links associated with the nodes. Let node be removed. The strength of its neighboring node is then updated to as the edge is removed. Continue to remove nodes with strength less than or equal to until no such nodes remains. The deleted nodes are assigned an -shell index of , where the variable emphasizes that the decomposition is based on the nodes' strength and the subscript represents a shell. Next find the smallest strength in the remaining network and remove nodes in the same way as before; the nodes so removed are assigned the index . This pruning process is continued until all nodes are removed and assigned an index. This -shell index of a node reflects the order (hierarchy) of a node being removed in the pruning process and can be regarded the weighted coreness of the node, emphasizing its importance in the spreading dynamics.
IV. PERFORMANCE IN IDENTIFYING INFLUENTIAL SPREADERS IN REAL-WORLD NETWORKS
To examine the effectiveness of using the node strength and weighted coreness in identifying influential spreaders, we apply the measures to nine real-world networks as listed in Table I. The networks studied are CA-Hep (giant connected component of collaboration network of arXivs in high-energy physics theory) [43], Astro (collaboration network of astrophysics scientists) [44], Emailcontact (email contacts at Computer Science Department of University College London) [6], PGP (an encrypted communication network) [45], Blog [the communication relationships between owners of blogs on the MSN (Windows Live) Spaces website] [46], AS (Internet at the autonomous system level) [47], Router (the router level topology of the Internet, collected by the Rocketfuel Project) [48], Hamster (friendships and family links between users of the website hamsterster.com) [49], and (9) Netsci (collaboration network of network scientists) [50]. Our measures are found to outperform predictions based on the degree centrality and -shell decomposition, as we now show.
TABLE I.
Properties of the real-world networks studied in this work. Structural properties of the number of nodes , number of edges , average degree , degree assortativity , clustering coefficient , epidemic threshold , infection probability used in the SIR dynamics, and the optimal value of as given by Kendall's correlation coefficient .
| Network | ||||||||
|---|---|---|---|---|---|---|---|---|
| CA-Hep | 8638 | 24806 | 5.7 | 0.239 | 0.482 | 0.08 | 0.12 | 1.0 |
| Astro | 14845 | 119652 | 16.1 | 0.228 | 0.670 | 0.02 | 0.05 | 0.9 |
| Emailcontact | 12625 | 20362 | 3.2 | 0.109 | 0.01 | 0.10 | 0.3 | |
| PGP | 10680 | 24340 | 4.6 | 0.240 | 0.266 | 0.06 | 0.19 | 1.0 |
| Blog | 3982 | 6803 | 3.4 | 0.284 | 0.08 | 0.27 | 0.9 | |
| AS | 22963 | 48436 | 4.2 | 0.230 | 0.004 | 0.13 | 0.2 | |
| Router | 5022 | 6258 | 2.5 | 0.012 | 0.08 | 0.27 | 0.7 | |
| Hamster | 2000 | 16097 | 16.1 | 0.023 | 0.540 | 0.02 | 0.04 | 0.8 |
| Netsci | 379 | 914 | 4.8 | 0.741 | 0.14 | 0.30 | 0.8 |
A. Performance of node strength
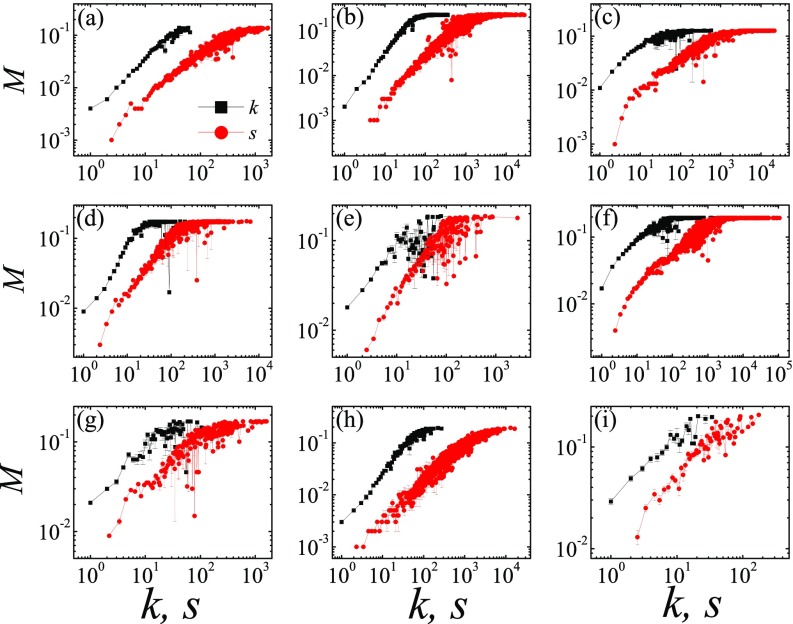
From the structure of each network, every node carries a degree and a node strength . Using the SIR dynamics, the spreading efficiency of each node can be obtained by simulations. Figure 2 compares the correlations between the spreading efficiency with the node strength and with the degree in nine real-world networks. Here we set in Eq. (3) in determining for the edges. The sensitivity to the parameter will be discussed later. The strength and the degree are both positively correlated with the spreading efficiency. The merit of using the strength over the degree as a measure is that its value covers a much wider range and it can distinguish the spreading efficiency more specifically. This advantage is built into the definition of the node strength as it captures the key elements in the spreading dynamics.
FIG. 2.
Mean spreading efficiency of nodes as classified by their degree (black squares) or their node strength s (red circles) in nine real-world networks. As the node strengths are real numbers instead of integers, data are grouped in intervals of size unity. The corresponding average spreading efficiency and node strength in each interval are displayed, starting from the minimal strength. The real-world networks are (a) CA-Hep, (b) Astro, (c) Emailcontact, (d) PGP, (e) Blog, (f) AS, (g) Router, (h) Hamster, and (i) Netsci.
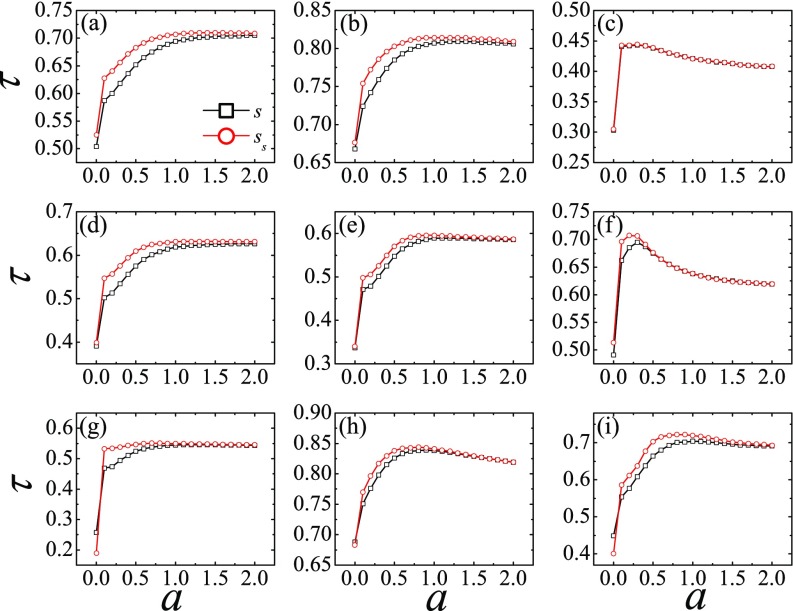
The node strength provides a ranking of the nodes. This list can be compared with the list based on the actual spreading efficiency by calculating Kendall's correlation coefficient. We calculate the ranking correlation of nodes' spreading efficiency and their strength for different values of and obtained , as shown in Fig. 3 (squares). For [see Eq. (4)], reduces to the degree and thus measures the correlation between the rankings based on the degree and the spreading efficiency. Note that is significantly enhanced for , implying that the node strength, which includes the bidirectional and asymmetric weights of the edges, ranks the nodes more accurately. Results in Fig. 3 further show that there exists an optimal value of for each network at which is a maximum. The optimal value of each network is given in Table I, together with the other network properties. Figure 3 also shows the obtained by ranking the nodes according to the -shell index. The results will be discussed later.
FIG. 3.
Kendall's correlation coefficients evaluated between the actual spreading efficiency of the nodes and the ranking based on node strength (black square) and based on the -shell index (red circle) for different values of the parameter in Eq. (3). The real-world networks are (a) CA-Hep, (b) Astro, (c) Emailcontact, (d) PGP, (e) Blog, (f) AS, (g) Router, (h) Hamster, and (i) Netsci.
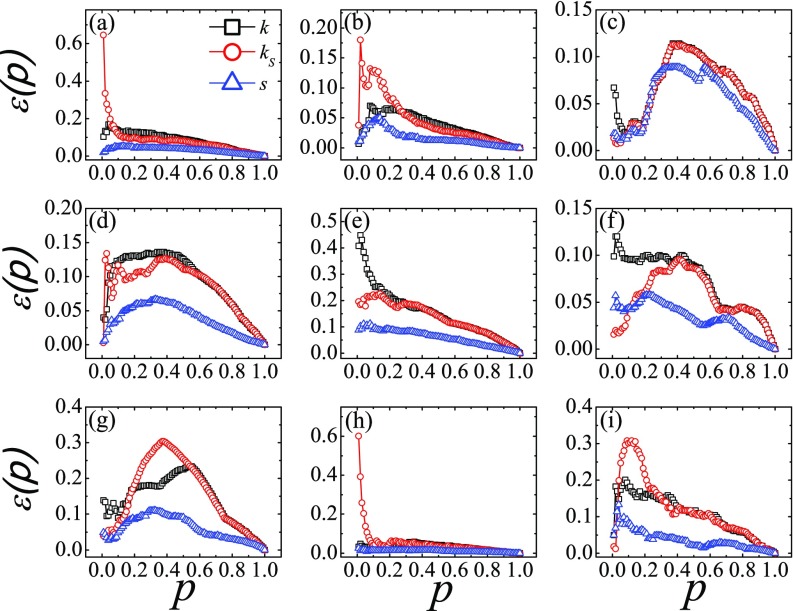
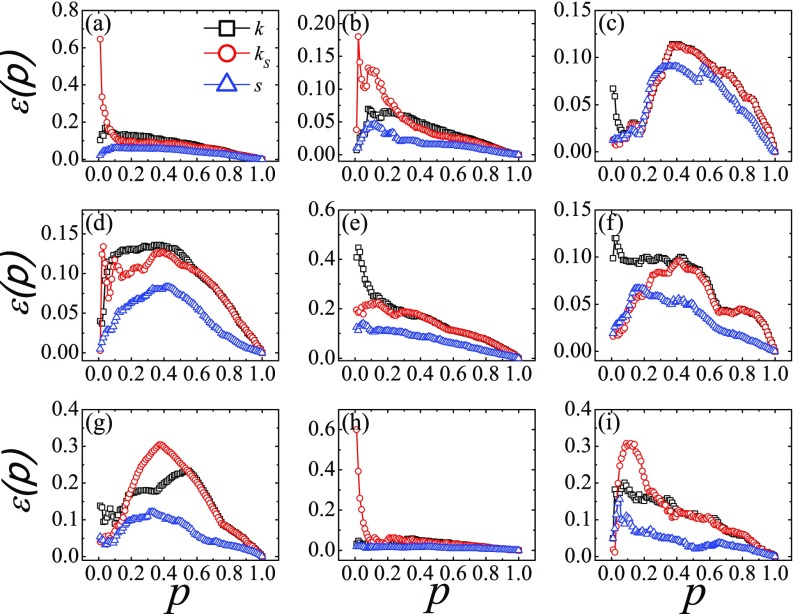
Figure 4 shows the imprecision function of the ranking based on the node strength, together with the results based on the degree and -shell index for comparison. Recall that a lower imprecision implies a higher accuracy in identifying the influential spreaders. The node strength (triangles) give an imprecision that is less than 0.1 for all in nearly all cases. Only in the network Netsci is the imprecision slightly larger than 0.1 for a few values of . The results show that the node strength outperforms the degree (squares) in almost all networks. Only in the network Hamster do the imprecisions based on node strength and on the degree become comparable, but they are both small. The node strength is therefore a better index for pinpointing the influential spreaders than the degree. More noticeable is that the node strength performs even better than the -shell index in most cases, except at some small values of in the AS and Netsci networks. The -shell index is regarded as an efficient measure for identifying influential spreaders and it is widely used in ranking algorithms. However, the assignment of a -shell index requires a complete network structure rather than indices relying solely on the local structure such as the degree or the node strength. The node strength introduced here provides not only a more accurate measure, but also a computationally efficient method in handling large-scale networks.
FIG. 4.
Imprecision of rankings based on the degree (, black squares), -shell index (, red circles), and node strength (, blue triangles) evaluated at the optimal value of as a function of for nine real-world networks. The node strength provides a better measure for identifying influential spreaders. The real-world networks are (a) CA-Hep, (b) Astro, (c) Emailcontact, (d) PGP, (e) Blog, (f) AS, (g) Router, (h) Hamster, and (i) Netsci.
B. Performance of weighted coreness
The -shell index works better than the degree in identifying influential spreaders [39]. Here we investigate how the -shell index or weighted coreness works in comparison to the other measures. The results of Kendall's correlation of ranking in Fig. 3 suggest that it is a better measure than using the node strength in eight systems out of nine. In the Emailcontact network, and rankings work equally well. In fact, the and rankings approach the same value of as increases. Given that the optimal values of in the networks are less than or equal to 1, the weighted coreness gives a better ranking. Note that the case gives the value of corresponding to the -shell index . Using to rank the nodes always gives a higher than the value, implying that the -shell index is also a better measure than the -shell index.
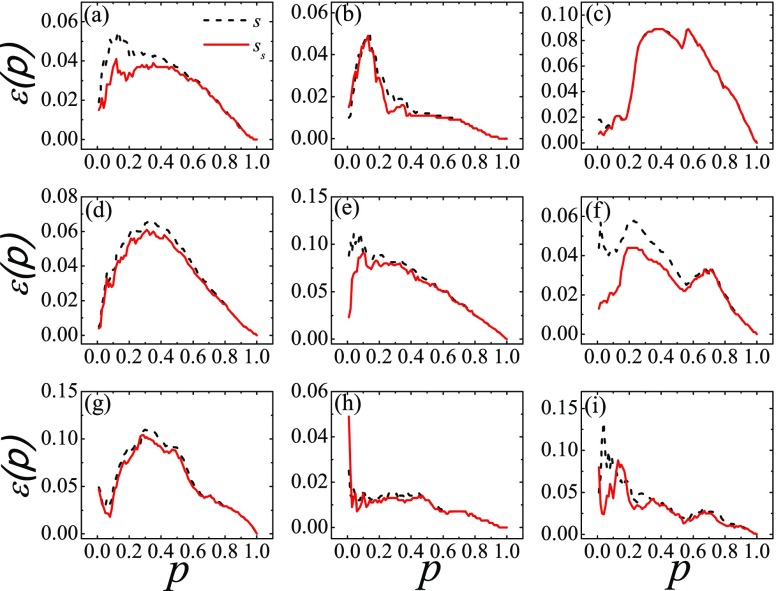
The imprecision functions of rankings using and are compared in Fig. 5. Their performances are comparable and they both work better than measures based on the degree alone (see Fig. 4). Looking closer, the lower imprecision of ranking in six (CA-Hep, PGP, Blog, AS, Router, and Netsci) out of nine cases suggests that the -shell decomposition method is more accurate in identifying influential spreaders in real-world networks. Even in the networks of Astro, Emailcontact, and Hamster in which and work almost equally well, the imprecision of is slightly lower than or equal to that of . Only in the Hamster network does work slightly better than at ; even so the imprecision functions are small (under 0.05) on the absolute scale.
FIG. 5.
Imprecision of rankings based on the node strength (, black dash) and weighted coreness (, red solid) obtained by -shell decomposition as a function of . The weighted coreness provides a further improvement over in identifying influential spreaders. The real-world networks are (a) CA-Hep, (b) Astro, (c) Emailcontact, (d) PGP, (e) Blog, (f) AS, (g) Router, (h) Hamster, and (i) Netsci.
We analyze the reason why the proposed node strength and -shell index outperform the degree and -shell index. First, the method proposed herein can identify weak nodes, which have a low degree but are influential spreaders [51]. For example, a node of degree 2 has two neighbors with large outgoing links. The edges connecting and its neighbors will be assigned a large link weight, thus resulting in a large strength, as well as a large -shell index. If evaluated by degree and the -shell index, node will be ranked low as a less important node. Second, the methods proposed herein can identify nodes that are in fact not influential spreaders but are ranked high by degree and -shell index, which form a local clique structure [39]. For example, in the real-world network CA-Hep, there exists a cliquelike local structure composed of 32 mutually connected nodes with very few outgoing links. In our methods, the edges of these nodes will be assigned low weights, due to the very few or even no outgoing links, thus having a low strength and -shell index. If evaluated by the -shell index, these nodes have the maximal -shell index of 31 in the network.
Though we use the SIR spreading dynamics to obtain the spreading influence of each node, which can be interpreted as a percolation process, previous researches have pointed out the correlation between the existence of a large component and the ratio of the average number of second and first neighbors [52,53]. In Ref. [53] the authors indicated that clustering strongly affects the percolation properties and size of a giant component. By avoiding the edges that are responsible for clustering, the percolation properties of clustered random networks can be computed correctly. This idea is very similar to our way of defining the dynamical importance of edges, which synthesizes the first and second neighbors but neglects the nodes that are both first and second neighbors. This guarantees that the contribution of triangles is not overcounted. How to use the percolation theory to distinguish the influence of each node requires further exploration [54,55]. For example, researchers used the optimal percolation and message-passing method to predict the spreading influence of nodes and the proposed index counts the degree of nodes that is at a certain distance from the central node [51].
C. Robustness of proposed weighted centrality
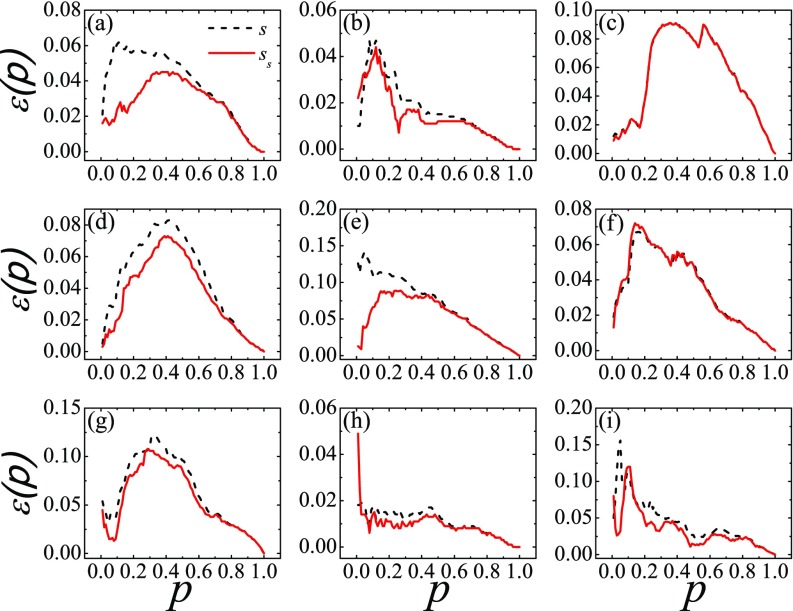
So far, we have used the optimal value of to evaluate and and compared our results with other measures. However, the optimal value is not often known precisely in real applications. It will be useful to examine the performance of the node strength for some arbitrarily chosen value of . Let us set so that the term in represents a geometric mean. The comparison in Fig. 6 of the imprecision function shows that ranking gives a lower imprecision than the degree and -shell index. An interesting point is that the imprecision of node strength evaluated at is even lower than that evaluated at the optimal value of in the AS network for . The result indicates that although the best performing overall ranking correlation coefficient occurs at some optimal , the same value does not necessarily give the best identification of the most influential spreaders.
FIG. 6.
Imprecision of rankings based on the degree (, black squares), -shell index (, red circles), and node strength (, blue triangles) evaluated by for nine real-world networks as a function of . The real-world networks are (a) CA-Hep, (b) Astro, (c) Emailcontact, (d) PGP, (e) Blog, (f) AS, (g) Router, (h) Hamster, and (i) Netsci.
Figure 7 compares the effectiveness of the node strength and the -shell decomposition for . Again, the -shell index works better in most cases. In fact, the results resemble those in Fig. 5 when the optimal is used. These results further support the assertion that the node strength and the corresponding -shell index are better measures for spreading processes than methods based on the degree. Between them, the -shell index performs slightly better, but evaluating the index requires more computing effort than the node strength alone.
FIG. 7.
Imprecision of rankings based on the node strength (, black dashed line) and weighted coreness (, red solid line) obtained by -shell decomposition for as a function of . The real-world networks are (a) CA-Hep, (b) Astro, (c) Emailcontact, (d) PGP, (e) Blog, (f) AS, (g) Router, (h) Hamster, and (i) Netsci.
V. CONCLUSION
The roles of nodes and edges in deciding the structural properties of a network should be carefully distinguished from their roles in determining the extent of spreading processes. Although an edge between nodes and certainly helps spread a disease, its role may be different when the infection goes from to than in the other direction. This is because what matters is whether the node , after infected by , would reach out to other nodes that node itself could not reach. If so, the link carries a greater importance for infection from to , which is quantified by a higher weight for the link. It is therefore necessary to invoke asymmetric and bidirectional weights with for a link so as to capture the dynamics in spreading processes. Here we introduced a form of [see Eq. (3)] and showed that it facilitates accurate ranking in the node's importance. Pictorially, the network is better described by the nodes connected by links with asymmetric weights in different directions when spreading dynamics is concerned.
To establish the effectiveness of our method, the weights of the links were used to construct a node strength that predicts the importance of a node in spreading processes. An -shell decomposition scheme based on the node strength was then introduced. The -shell index of the nodes provides another way of ranking them. Applying and rankings to nine real-world networks, it was found that our measures generally outperform the standard rankings based on the degree of the nodes and the -shell decomposition method. Superiority is shown in both the overall performance of the ranking as indicated by Kendall's correction coefficient and in identifying the influential spreaders as indicated by the imprecision.
The success of our measure relies on the asymmetry in the weights contained in and . To stress the point, we constructed a related network with weighted links, but the weights are symmetric by assigning a weight to a link according to
| (5) |
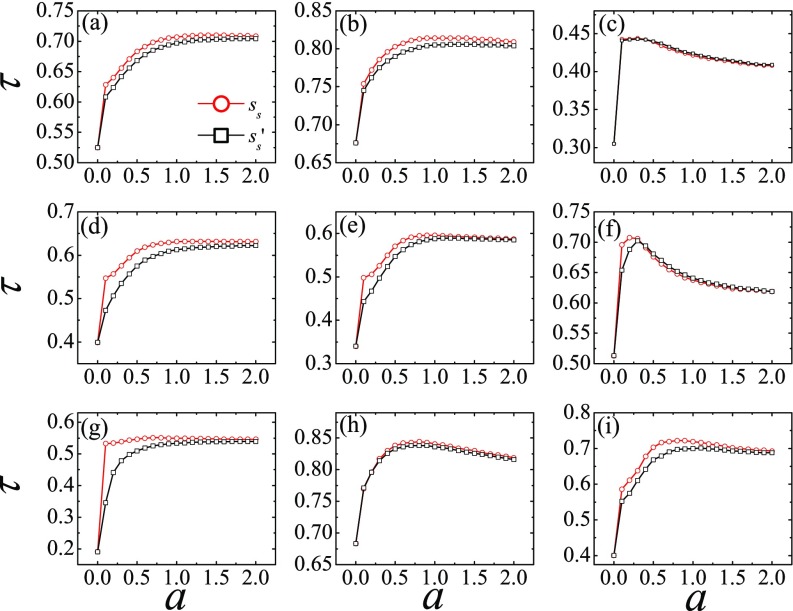
with given by Eq. (3). The weights can then be used to assign a strength to the nodes and a corresponding -shell decomposition based on can be carried out to assign an index to each node. Figure 8 compares Kendall's correlation of rankings based on and with the actual SIR spreading efficiency for different values of the parameter . In all cases, the measure with asymmetric weights works better than that without the asymmetry. In the Emailcontact and Hamster networks, the two measures are equally accurate. The results confirm that it is important to include the different roles of a link in spreading a disease between nodes and in two different directions into the construction of a reliable measure.
FIG. 8.
Kendall's correlation coefficients evaluated between the actual spreading efficiency of the nodes and the rankings based on weighted coreness (red circles) as obtained by assigning asymmetric weighting of Eq. (3) to the links and based on weighted coreness (black square) by assigning symmetric weighting of Eq. (5) to the links. The necessity of invoking asymmetric weights is demonstrated by the higher accuracy in the ranking based on rather than on . The real-world networks are (a) CA-Hep, (b) Astro, (c) Emailcontact, (d) PGP, (e) Blog, (f) AS, (g) Router, (h) Hamster, and (i) Netsci.
In summary, we proposed a node strength as an alternative centrality measure for efficient and accurate identification of influential spreaders. The idea of examining the functionality of a link in spreading in either direction is a general one and thus could be further developed for ranking a set of objects. As the current method only considers one step, it may be extended to further steps. Consider if node in Fig. 1 has three outgoing nodes that are leaf nodes, while node has only one outgoing node which further connects to many nodes. Whether taking further steps into consideration is a better choice for defining the dynamical link weights needs to be verified in future research. Previous results indicated that taking the two-step neighborhood into consideration balanced the calculation cost and ranking accuracy the best in a ranking method [56]. Although we work on defining the link weight from the network structure, it is worth considering how to integrate the artificial link weight with real weight on weighted networks. We think that the formation of a network structure depends on the function of the network elements of nodes and links. Thus, the artificial link weight defined by the structure and the real weight on weighted networks that reflects the function may be highly correlated. How to merge and balance these two features in weighted networks is a valuable question to be explored in future work. In addition, we used the SIR model as the spreading dynamics. However, the idea of invoking asymmetric weights for a link remains valid for other processes such as rumor spreading and information diffusion, although the exact form of the weights may depend on the details of the process under consideration.
ACKNOWLEDGMENTS
This work was jointly funded by the National Natural Science Foundation of China (Grants No. 11575041 and No. 61672238), the Scientific Research Starting Program of Southwest Petroleum University (Grant No. 2014QHZ024), the Data Intelligence Academic Innovation Team of Southwest Petroleum University (Grant No. 2015CXTD06), and the Fundamental Research Funds for the Central Universities (Grant No. ZYGX2015J153).
REFERENCES
- [1].L. C. Freeman, Soc. Networks 1, 215 (1978). 10.1016/0378-8733(78)90021-7 [DOI] [Google Scholar]
- [2].L. C. Freeman, Sociometry 40, 35 (1977). 10.2307/3033543 [DOI] [Google Scholar]
- [3].G. Sabidussi, Psychometrika 31, 581 (1966). 10.1007/BF02289527 [DOI] [PubMed] [Google Scholar]
- [4].P. Bonacich and P. Floyd, Soc. Networks 23, 191 (2001). 10.1016/S0378-8733(01)00038-7 [DOI] [Google Scholar]
- [5].B. Bollobás, in Graph Theory and Combinatorics: Proceedings of the Cambridge Combinatorial Conference in Honour of Paul Erdős, edited by B. Bollobás (Academic, New York, 1984). [Google Scholar]
- [6].M. Kitsak, L. K. Gallos, F. Havlin, L. Liljeros, H. E. Muchnik, H. E. Stanley, and H. A. Makse, Nat. Phys. 6, 888 (2010). 10.1038/nphys1746 [DOI] [Google Scholar]
- [7].S. Pei and H. A. Makse, J. Stat. Mech. (2013) P12002. 10.1088/1742-5468/2013/12/P12002 [DOI] [Google Scholar]
- [8].D.-B. Chen, H. Gao, L. Lü, and T. Zhou, PLoS One 8, e77455 (2013). 10.1371/journal.pone.0077455 [DOI] [PMC free article] [PubMed] [Google Scholar]
- [9].Z.-M. Ren, A. Zeng, D.-B. Chen, H. Liao, and J.-G. Liu, Europhys. Lett. 106, 48005 (2014). 10.1209/0295-5075/106/48005 [DOI] [Google Scholar]
- [10].L. Lü, D.-B. Chen, X.-L. Ren, Q.-M. Zhang, Y.-C. Zhang, and T. Zhou, Phys. Rep. 650, 1 (2016). 10.1016/j.physrep.2016.06.007 [DOI] [Google Scholar]
- [11].J. Bae and S. Kim, Physica A 395, 549 (2014). 10.1016/j.physa.2013.10.047 [DOI] [Google Scholar]
- [12].T. Martin, X. Zhang, and M. E. J. Newman, Phys. Rev. E 90, 052808 (2014). 10.1103/PhysRevE.90.052808 [DOI] [PubMed] [Google Scholar]
- [13].A. J. Alvarez-Socorro, G. C. Herrera-Almarza, and L. A. González-Díaz, Sci. Rep. 5, 17095 (2015). 10.1038/srep17095 [DOI] [PMC free article] [PubMed] [Google Scholar]
- [14].J. E. Hirsch, Proc. Natl. Acad. Sci. USA 102, 16569 (2005). 10.1073/pnas.0507655102 [DOI] [Google Scholar]
- [15].L. Lü, T. Zhou, Q. M. Zhang, and H. E. Stanley, Nat. Commun. 7, 10168 (2016). 10.1038/ncomms10168 [DOI] [PMC free article] [PubMed] [Google Scholar]
- [16].F. Radicchi and C. Castellano, Phys. Rev. E 93, 062314 (2016). 10.1103/PhysRevE.93.062314 [DOI] [PubMed] [Google Scholar]
- [17].F. Bauer and J. T. Lizier, Europhys. Lett. 99, 68007 (2012). 10.1209/0295-5075/99/68007 [DOI] [Google Scholar]
- [18].G. Lawyer, Sci. Rep. 5, 8665 (2015). 10.1038/srep08665 [DOI] [PMC free article] [PubMed] [Google Scholar]
- [19].J.-G. Liu, J.-H. Lin, Q. Guo, and T. Zhou, Sci. Rep. 6, 21380 (2016). 10.1038/srep21380 [DOI] [PMC free article] [PubMed] [Google Scholar]
- [20].F. D. Malliaros, M.-E. G. Rossi, and M. Vazirgiannis, Sci. Rep. 6, 19307 (2016). 10.1038/srep19307 [DOI] [PMC free article] [PubMed] [Google Scholar]
- [21].D. Grady, C. Thiemann, and D. Brockmann, Nat. Commun. 3, 864 (2012). 10.1038/ncomms1847 [DOI] [PubMed] [Google Scholar]
- [22].T. Opsahl, F. Agneessens, and J. Skvoretz, Soc. Networks 32, 245 (2010). 10.1016/j.socnet.2010.03.006 [DOI] [Google Scholar]
- [23].A. Garas, F. Schweitzer, and S. Havlin, New J. Phys. 14, 083030 (2012). 10.1088/1367-2630/14/8/083030 [DOI] [Google Scholar]
- [24].M. Eidsaa and E. Almaas, Phys. Rev. E 88, 062819 (2013). 10.1103/PhysRevE.88.062819 [DOI] [PubMed] [Google Scholar]
- [25].Z.-X. Wu and P. Holme, Phys. Rev. E 84, 026106 (2011). 10.1103/PhysRevE.84.026106 [DOI] [PubMed] [Google Scholar]
- [26].S. Allesina, A. Bodini, and M. Pascual, Philos. Trans. R. Soc. B 364, 1701 (2009). 10.1098/rstb.2008.0214 [DOI] [PMC free article] [PubMed] [Google Scholar]
- [27].C.-J. Zhang and A. Zeng, Physica A 402, 180 (2014). 10.1016/j.physa.2014.02.002 [DOI] [Google Scholar]
- [28].N. N. Chung, L. Y. Chew, J. Zhou, and C. H. Lai, Europhys. Lett. 98, 58004 (2012). 10.1209/0295-5075/98/58004 [DOI] [Google Scholar]
- [29].D. Brockmann and D. Helbing, Science 342, 1337 (2013). 10.1126/science.1245200 [DOI] [PubMed] [Google Scholar]
- [30].U. A. Brandes, J. Math. Sociology 25, 163 (2001). 10.1080/0022250X.2001.9990249 [DOI] [Google Scholar]
- [31].P. Holme, B. J. Kim, C. N. Yoon, and S. K. Han, Phys. Rev. E 65, 056109 (2002). 10.1103/PhysRevE.65.056109 [DOI] [PubMed] [Google Scholar]
- [32].G.-Q. Zhang, D. Wang, and G.-J. Li, Phys. Rev. E 76, 017101 (2007). 10.1103/PhysRevE.76.017101 [DOI] [Google Scholar]
- [33].A. Barrat, M. Barthélemy, R. Pastor-Satorras, and A. Vespignani, Proc. Natl. Acad. Sci. USA 101, 3747 (2004). 10.1073/pnas.0400087101 [DOI] [PMC free article] [PubMed] [Google Scholar]
- [34].W.-X. Wang, B.-H. Wang, B. Hu, G. Yan, and Q. Ou, Phys. Rev. Lett. 94, 188702 (2005). 10.1103/PhysRevLett.94.188702 [DOI] [PubMed] [Google Scholar]
- [35].M. Tang and T. Zhou, Phys. Rev. E 84, 026116 (2011). 10.1103/PhysRevE.84.026116 [DOI] [Google Scholar]
- [36].H. F. Zhang, J. R. Xie, M. Tang, and Y. C. Lai, Chaos 24, 043106 (2014). 10.1063/1.4896333 [DOI] [PMC free article] [PubMed] [Google Scholar]
- [37].C. Castellano and R. Pastor-Satorras, Sci. Rep. 2, 371 (2012). 10.1038/srep00371 [DOI] [PMC free article] [PubMed] [Google Scholar]
- [38].Y. Liu, M. Tang, T. Zhou, and Y. Do, Sci. Rep. 5, 9602 (2015). 10.1038/srep09602 [DOI] [PMC free article] [PubMed] [Google Scholar]
- [39].Y. Liu, M. Tang, T. Zhou, and Y. Do, Sci. Rep. 5, 13172 (2015). 10.1038/srep13172 [DOI] [PMC free article] [PubMed] [Google Scholar]
- [40].V. Batagelj and M. Zaveršnik, Adv. Data Anal. Class. 5, 129 (2011). 10.1007/s11634-010-0079-y [DOI] [Google Scholar]
- [41].W. Wang, M. Tang, H. E. Stanley, and L. A. Braunstein, Rep. Prog. Phys. 80, 036603 (2017). 10.1088/1361-6633/aa5398 [DOI] [PubMed] [Google Scholar]
- [42].M. A. Serrano and M. Boguñá, Phys. Rev. E 74, 056114 (2006). 10.1103/PhysRevE.74.056114 [DOI] [PubMed] [Google Scholar]
- [43].J. Leskovec, J. Kleinberg, and C. Faloutsos, ACM Trans. Knowl. Discov. Data 1, 1 (2007). 10.1145/1217299.1217300 [DOI] [Google Scholar]
- [44].M. E. J. Newman, Proc. Natl. Acad. Sci. USA 98, 404 (2001). 10.1073/pnas.98.2.404 [DOI] [Google Scholar]
- [45].M. Boguñá, R. Pastor-Satorras, A. Diaz-Guilera, and A. Arenas, Phys. Rev. E 70, 056122 (2004). 10.1103/PhysRevE.70.056122 [DOI] [PubMed] [Google Scholar]
- [46].N. Xie, Social network analysis of blogs, M.Sc. thesis, University of Bristol, 2006. [Google Scholar]
- [47].M. E. J. Newman, Network data, available at http://www-personal.umich.edu/%7Emejn/netdata (accessed 12/12/2012).
- [48].N. Spring, R. Mahajan, D. Wetherall, and T. Anderson, IEEE/ACM Trans. Networking 12, 2 (2004). 10.1109/TNET.2003.822655 [DOI] [Google Scholar]
- [49].J. Kunegis, Hamsterster full network dataset, KONECT, available at http://konect.uni-koblenz.de/networks/petster-hamster (accessed 01/03/2014).
- [50].M. E. J. Newman, Phys. Rev. E 74, 036104 (2006). 10.1103/PhysRevE.74.036104 [DOI] [Google Scholar]
- [51].F. Morone and H. A. Makse, Nature (London) 524, 65 (2015). 10.1038/nature14604 [DOI] [PubMed] [Google Scholar]
- [52].M. E. J. Newman, S. H. Strogatz, and D. J. Watts, Phys. Rev. E 64, 026118 (2001). 10.1103/PhysRevE.64.026118 [DOI] [PubMed] [Google Scholar]
- [53].M. A. Serrano and M. Boguñá, Phys. Rev. Lett. 97, 088701 (2006). 10.1103/PhysRevLett.97.088701 [DOI] [PubMed] [Google Scholar]
- [54].S. N. Dorogovtsev and A. V. Goltsev, Rev. Mod. Phys. 80, 1275 (2008). 10.1103/RevModPhys.80.1275 [DOI] [Google Scholar]
- [55].F. Radicchi and C. Castellano, Phys. Rev. E 93, 030302 (2016). 10.1103/PhysRevE.93.030302 [DOI] [PubMed] [Google Scholar]
- [56].Y. Liu, M. Tang, T. Zhou, and Y. Do, Physica A 452, 289 (2016). 10.1016/j.physa.2016.02.028 [DOI] [Google Scholar]


