Abstract
We study SIS epidemic spreading processes unfolding on a recent generalization of the activity-driven modeling framework. In this model of time-varying networks, each node is described by two variables: activity and attractiveness. The first describes the propensity to form connections, while the second defines the propensity to attract them. We derive analytically the epidemic threshold considering the time scale driving the evolution of contacts and the contagion as comparable. The solutions are general and hold for any joint distribution of activity and attractiveness. The theoretical picture is confirmed via large-scale numerical simulations performed considering heterogeneous distributions and different correlations between the two variables. We find that heterogeneous distributions of attractiveness alter the contagion process. In particular, in the case of uncorrelated and positive correlations between the two variables, heterogeneous attractiveness facilitates the spreading. On the contrary, negative correlations between activity and attractiveness hamper the spreading. The results presented contribute to the understanding of the dynamical properties of time-varying networks and their effects on contagion phenomena unfolding on their fabric.
I. INTRODUCTION
Many social, natural, and technological systems can be modeled as networks. The structure of such systems is often not fixed and exhibits complex temporal dynamics [1–4]. However, the large majority of studies revolve around representations that neglect the role of time [5–7]. In particular, connections are typically approximated as either static or annealed [8,9]. Since networks are often used as an environment for the study of dynamical processes, the choice concerning which approximation to adopt is a matter of time scales: when the process is faster than the network evolution, the network structure can be assumed static; in the opposite conditions, networks can be effectively described by annealed representations. However, when the time scale of the process studied is comparable to the one characterizing the network evolution, static or annealed approximations are not viable and can lead to incorrect conclusions such as misrepresenting (i) the spreading potential of a disease [8,10–28], (ii) the exploring capabilities of random walkers [29–33], (iii) the features of social interactions [34–47], or the processes of (iv) information spreading [48–52], (v) synchronization [53], (vi) percolation [54], (vii) consensus [55], (viii) competition [56], (ix) social contagion [57], and (x) innovation [58].
Thanks to the unprecedented availability of large and longitudinal datasets, in recent years a great effort has been put into the development of temporal network representations and models. See Refs. [1–3] for detailed reviews on the subject.
One proposal for an analytical model of a temporal network comes from the activity-driven model [18], which relates the temporal structure of the connections to one fundamental quantity, the activity. This feature represents the propensity of a node to establish connections per unit time. In the model, each node is equipped with an activity extracted from a distribution . At any time step , nodes are active and thus willing to establish connections with probability proportional to their activity. One praise of this simple mechanism is that it relates the contact dynamics to the structure of the time-integrated network: the resulting degree distribution depends on the form of , and in particular a power-law distributed activity produces a power-law degree distribution [18]. This fact is particularly significant in relation to social networks, which are known to exhibit distributions of this kind both for the degree [5,59] and for the activity [18,30,34,46,60].
In its original form, the activity-driven model is extremely simple, thus it is relatively lightweight for performing calculations. Nonetheless, it gives rise to a nontrivial temporal structure having an impact on the unfolding of dynamical processes [18,30,31,61]. Precisely because of its simplicity, and in particular its reliance on only one node property (the activity), the original activity-driven model is not able to reproduce other widespread properties of social networks, namely finite clustering, assortative mixing, a bursty contact sequence, and memory effects [62–64]. For these reasons, and also thanks to its flexibility, modifications to the original model have been introduced and investigated [26,34,46,47,65,66].
Here, we consider a recent extension of the model [67] in which beyond the activity distribution, the network is characterized by an attractiveness distribution [67]. This feature accounts for the fact that some nodes may be a preferential target of interactions (i.e., they may be more popular), in the same way that activity accounts for the fact that some nodes are more inclined to be their initiators. The attractiveness of a node is a measure of its propensity to attract contacts. Therefore, it is to some extent the reciprocal of the activity, and a natural complement to it within the model. Heterogeneous attractiveness distributions have been observed in different networks, such as online communities [67–69], face-to-face interactions [70], and animal hierarchies [71].
In Ref. [67], besides the introduction of the model, the authors studied the effects of the attractiveness and of its interplay with the activity on the fundamental dynamical processes: the random walk. Here, we continue to investigate how attractiveness and activity affect spreading processes on temporal networks, focusing on contagion phenomena. In particular, we consider SIS epidemic models in the case of a generic joint activity-attractiveness distribution deriving an analytic expression for the epidemic threshold. We give a detailed treatment of three scenarios. First, we examine the case of uncorrelated activity and attractiveness. Second, inspired by observations on real data [67], we study the case of positive correlation between the two variables. Finally, we complete our analysis considering the case of negative correlation. In all cases, we use numerical simulations to validate our results.
The shape of the activity distribution, and its second moment in particular, has been shown to influence the unfolding of different kinds of processes on activity-driven networks [18,26,31,38,61,72]. In the case of spreading phenomena, the more heterogeneous the activity distribution (i.e., the larger its variance), the easier it is for a disease to reach a finite portion of the network [18,26,61,72]. Here, we found how the presence of a heterogeneous attractiveness has an analogous impact. The presence of positive correlations between activity and attractiveness further facilitates the contagion, while the presence of negative correlations, conversely, hinders it.
The paper is structured as follows: in Sec. II we present the model and we discuss the attractiveness and its correlation with the activity; in Sec. III we study the epidemic threshold for an SIS process in the case of an absence of activity-attractiveness correlation (Sec. III A) and in the case of deterministic correlation (Sec. III B), treating all cases both analytically and with simulations; Sec. IV contains the conclusions and a discussion of possible future works.
II. THE MODEL
In the original activity-driven model (AD), a network of nodes is characterized by an activity distribution from which the activity, , of each node is extracted. The model uses a discrete time framework, with time steps of duration . At the beginning of each time step, a node may activate; the activation happens with probability ; if a node activates, it will form a fixed number of connections toward randomly selected nodes (multiple connections, as well as self-connections, are forbidden, and in general ); the connections remain active for the duration of the time step, at the end of which they are all reset, and the process starts again.
The model depicted above is the original version of the model, as proposed in Ref. [18]. There, when a node activates, it chooses the targets of its connections among all other members of the network with equal probability. In the version of the model we consider here, which we will call activity-driven with attractiveness (ADA), the network is also characterized by an attractiveness distribution [67]. In general, the two values of activity and attractiveness for the same node are not necessarily uncorrelated, and are sampled from a joint probability distribution . Interestingly, recent observations on online social networks have shown both variables to behave according to a power law with similar exponents and an approximately linear correlation [67].
The ADA works like the AD, except that when a node activates it chooses another node as a target of one of its connections with probability proportional to the second node's attractiveness, . As the probability of choosing any node must be equal to 1, the correct normalization for the probability is , where is the mean value of the attractiveness:
| (1) |
The model thus behaves similarly to a linear preferential attachment, as the overall number of contacts received by a node during any time window is linearly proportional to its attractiveness; the total number of contacts (received and initiated), on the other hand, depends on both activity and attractiveness.
By time-integrating the connections obtained at different time steps, we can study the emergent topological properties of the network. In particular, the time-integrated network over time steps is defined as the union of the instantaneous networks obtained at different time steps, i.e., two nodes figure as connected in the integrated network if they are connected in at least one of the instantaneous networks. A weight, equal to the number of instantaneous networks in which the edge appears, can also be associated to each edge. For the AD, the degree distribution of the integrated network is connected to the activity distribution through the relation , as long as it holds that [18]. The study of the time-integrated properties of ADA networks will be a matter of future work.
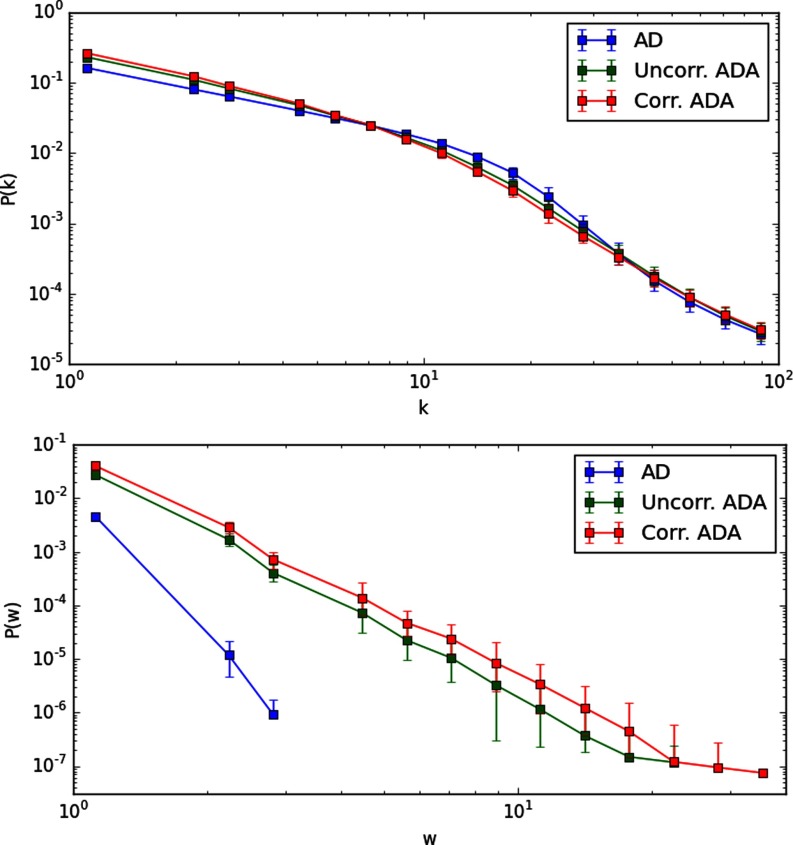
Figure 1 illustrates the degree distribution and the edge weight distribution obtained for two ADA networks and an AD network of size after a time integration of time steps. We used an activity distribution . In the AD model, all nodes have equal attractiveness; in the uncorrelated ADA we used an attractiveness distribution independent of, but identical to, the activity distribution: ; for the correlated ADA we set the attractiveness of every node to be proportional to its activity: . The exponents are chosen to be representative of typical values encountered in social networks [6,63]. The plot of the degree distribution shows that the presence of heterogeneous attractiveness in ADA networks does not induce dramatic changes. However, the inspection of the weight distribution highlights the difference between the two models. The presence of heterogeneous attractiveness induces heterogeneity in the partner selection that reverberates in the weight distribution. As we will see later, such heterogeneity favors the contagion process.
FIG. 1.
Degree and edge weight distribution for time-integrated ADA and AD. Both distributions show long tails. We used an activity distribution for all three networks. For the uncorrelated ADA, the attractiveness distribution is also . For the correlated case, we set for each node . We run our simulations on networks of nodes with , integrated over time steps and averaged over 100 runs.
The ADA model differs from recent generalizations of AD networks introduced in [34] and further expanded in [46,47,65]. In fact, in these extensions local reinforcement mechanisms have been used as a way to model the emergence and evolution of strong or weak ties [62]. However, local mechanisms alone cannot explain the dynamics of ties, especially in the current social media landscape where people can easily be in contact with celebrities or access information provided by popular accounts. The attractiveness describes scenarios of global popularity, as opposed to cases of local reinforcement in which the perceived attractiveness of a node may change between its peers, so that the contact probability is encoded in pairs rather than in the single nodes; also, we model the attractiveness as constant in time, not being strengthened or weakened by the occurrence of contacts—or the lack thereof.
III. EPIDEMIC THRESHOLD
As we discussed above, the presence of a heterogenous attractiveness affects the temporal structure of contacts. We want to quantify this phenomenon by studying its impact on a dynamical process, i.e., we choose to evaluate the epidemic threshold for an SIS process. The fact that the analytical value of such a threshold has already been calculated and tested for the original activity-driven model in Ref. [18] allows us to straightforwardly draw a comparison between the AD and the ADA.
The SIS is an example of a compartmental epidemic model [5,73,74]; in this framework, every node belongs to a certain class with respect to the disease status: susceptible (S) or infected (I). When a susceptible node contacts (or is contacted by) an infected one, it may itself become infected, with probability . Meanwhile, infected nodes can undergo spontaneous recovery at a rate and become susceptible again.
In general, contagion processes are characterized by a threshold that determines whether the disease is able to spread in the system affecting a macroscopic fraction of nodes [5,25,73–75]. In the limit of static networks, the epidemic threshold of a SIS processes is determined by the spectral properties of the adjacency matrix [76]. In the limit of annealed networks and uncorrelated topologies the threshold is defined by the moments of the degree distribution [77]. Interestingly, a closed expression for the threshold of a SIS process unfolding on a general time-varying network has been obtained [12,13]. This can be expressed in terms of the spectral properties of the system-matrix, which is defined as (where is the adjacency matrix at time ). Despite its generality, this expression hides the physics of the process behind the computation of eigenvalues, which is typically done numerically.
The AD framework allows an explicit mathematical derivation [18]. In particular, the threshold for SIS models depends on the moments of the activity distribution:
| (2) |
at the first order in and activity [18]. We have introduced , which denotes the value of the epidemic threshold for the activity-driven model and depends on the properties of the network, which in turn are determined by the moments of the activity distribution.
It is important to stress how in the expression of the threshold, the time-integrated properties of the network (such as the degree distribution) do not appear. The dynamical properties are defined only by the activity distribution.
Here, we extend the literature by providing an explicit analytical expression for the epidemic threshold for an SIS process in the ADA model for any form of the probability distribution . To do so, we assume nodes to be characterized by their activity and attractiveness values alone, and accordingly we group them in classes; nodes within each class are considered statistically equivalent (mean-field assumption). We also assume that the two variables are discretely distributed, but the derivation would apply as well to the case of continuous variables. We denote with the number of nodes of activity and attractiveness , with the condition . The number of susceptible and infected nodes of activity and attractiveness at time is indicated as and , respectively. A master equation for the temporal evolution of the number of infected nodes in each class can be written, again, in the limit of large size , where the probability of having repeated contacts between the same two nodes can be neglected. Without a lack of generality, in the following we will set . The master equation reads
| (3) |
The first term on the right side accounts for the infected nodes inherited from the previous time step, minus the cases of spontaneous recovery. The first term in the brackets represents the probability for a susceptible node in the class to activate and contact an infected node in any other class, while the second term represents the probability for an infected node in any other class to activate and contact a susceptible node in the class ; the difference with the AD model is that now the probability for a node in the class to be contacted depends on , and the probability for it to contact a node in the class depends on . We can define two auxiliary functions to simplify what follows:
| (4) |
| (5) |
In considering the initial phase of the spreading, when , we can take ; the master equation becomes
| (6) |
From the last one, we can obtain three more equations: one by summing aver all classes, and two more by first multiplying by and , respectively, and then summing.
Switching to a continuous-time regime, we obtain a system of three linear differential equations,
| (7) |
| (8) |
| (9) |
of eigenvalues:
| (10) |
The outbreak prevails when at least one eigenvalue is positive. The recover the eigenvalues of the AD if we use a constant attractiveness; is not a candidate for being the largest eigenvalue, unless ; so the epidemic threshold is determined by the positivity of , leading to
| (11) |
where we have used [18], and we introduced as the per capita spreading rate. As for the AD (above), we use to denote the value of the epidemic threshold encoded in the features of node activity and attractiveness.
Equation (11) is valid for any form of ; in particular, the expression recovers the value from Eq. (2) if a constant attractiveness is used, so that and . In the remainder of this section, we focus on two scenarios: (i) when activity and attractiveness are uncorrelated, and (ii) when they are instead deterministically correlated—either positively or negatively.
To provide a precise estimation of the threshold value when simulating an SIS process, we use the lifetime-based method introduced in Ref. [9] and also used in Ref. [26] for the same purpose. The lifetime is defined as the amount of time elapsed before the disease either dies out or spreads to a finite fraction of the network. The rationale behind this definition is the following: when the system is below threshold, the disease is not able to spread and dies out in a short time; above threshold, the lifetime is also short, as the disease can quickly reach a finite fraction of nodes. Only for values of close to the threshold do we expect to observe a longer lifetime, as the contrasting effects of contagion and spontaneous recovery are almost equally strong and they struggle to prevail on each other; we can thus take the value of corresponding to the maximum in as an estimation of . Indeed, the lifetime, obtained by averaging over many realizations, is equivalent to the susceptibility in standard percolation theory [9], thus it provides a precise method to detect the threshold numerically.
The peak in the lifetime is more pronounced for larger values of as, for power-law activity and attractiveness distributions, the heterogeneity effects lowering the epidemic threshold are constrained by the finite size of the system [78]. For this reason, we run our simulations on networks of increasing size, and we expect to observe the peak increase and occur at lower values of , converging to the theoretical value as . In particular, here we chose to use equal to , and ; we also set as the target value for the network coverage (fraction of infected nodes).
A. Uncorrelated distributions
In the absence of correlations, can be written as a product , where is the activity distribution and is the attractiveness distribution. In Eq. (11), the mean value of the product can be factorized to obtain
| (12) |
We can see that, once the average values are fixed, the threshold can be made arbitrarily small by increasing either or both of the second moments, i.e., introducing heterogeneity. As the threshold depends on the moments of the two distributions in the same way, the case with constant attractiveness and generic (the AD) can be mapped to the one with constant activity and attractiveness distribution .
As always holds, the threshold can only be lower than or equal to the one found in the AD; this means that the introduction of any amount of heterogeneity in the attractiveness helps the epidemic spreading.
As an example of uncorrelated distributions, let us consider two power laws: and ; in both cases, and are bounded inside the interval to avoid divergences.
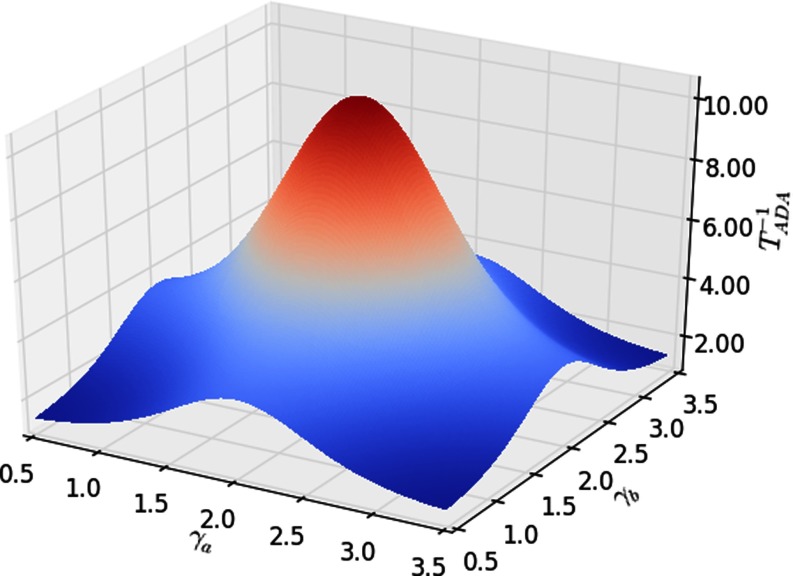
Figure 2 illustrates the behavior of the epidemic threshold obtained from Eq. (12); we report the values of —so that the plot shows a maximum when the spreading potential is maximum (the threshold shows a minimum)—as a function of the two exponents and . The threshold exhibits the same dependence on each of the two exponents, as the analytic expression also shows, with local maxima for (and ) and a global maximum in . The function is symmetric around such a value.
FIG. 2.
Value of for the case of uncorrelated distributions: , where both variables are distributed according to a power law with values in the range : and . The threshold depends on the exponents and via the moments of the two distributions. We plot the reciprocal of the epidemic threshold, so that the larger the plotted value is, the easier it is for the disease to spread. has the same dependence on the two exponents and it is symmetric around its maximum in .
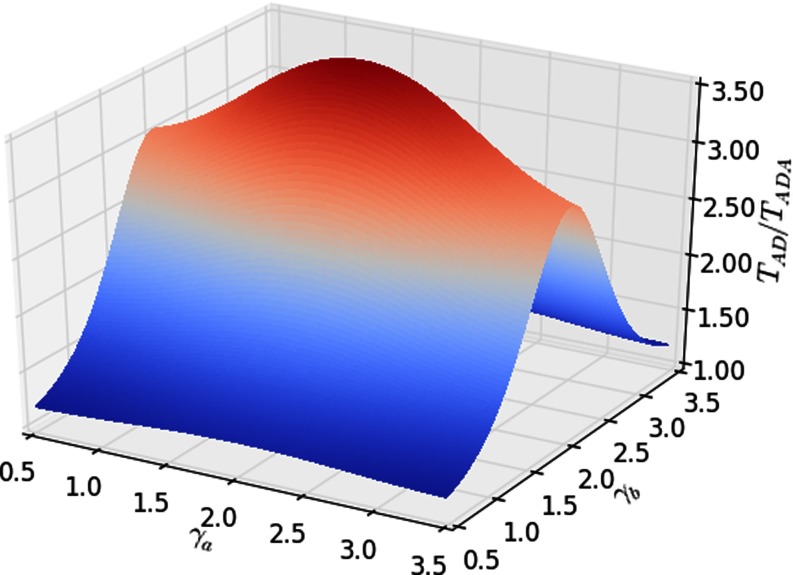
In Fig. 3 we show an analytical comparison between the ADA and the AD by plotting —the ratio between the epidemic threshold in the original model and the epidemic threshold with attractiveness computed following the analytical solution—as a function of the two power-law exponents. As expected from the equations, we find that, for values of either very large or close to zero, the ratio tends to 1 as and consequently . Otherwise, the attractiveness always lowers the threshold, thus facilitating the spreading of the epidemic phenomenon.
FIG. 3.
Plot of , the ratio of the epidemic threshold in the original model and the epidemic threshold with attractiveness, for the case of uncorrelated distributions: on the ADA. The activity on the AD in distributed according to the same law as on the ADA: . The ratio is a function of the two exponents ( depends on only). When diverges or tends to zero, the attractiveness distribution loses heterogeneity and the ADA converges to the AD. The difference is maximal for .
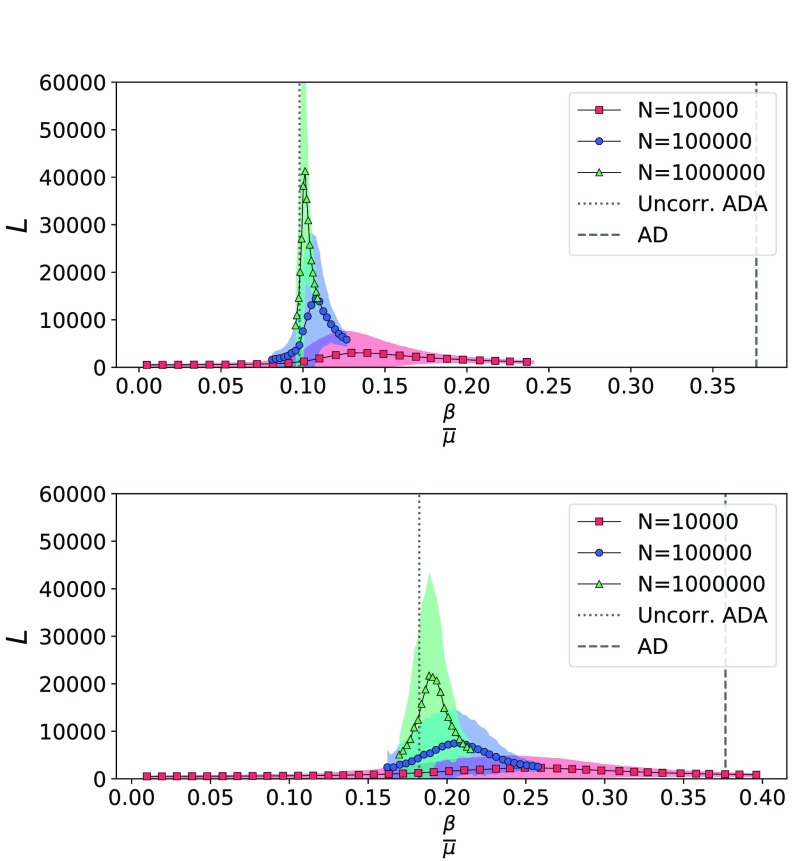
We tested the validity of our findings by simulating an SIS process with two different choices of the exponents: one with and , the other with the same and ; in both cases we set and took the median value over a number realizations of the process varying between 500 and 5000 (depending on the size). The results are shown in Fig. 4, where we plotted the lifetime of the process for different values of . In particular, we let vary while keeping fixed, and also does not change, being determined by the relation . The lifetime exhibits a peak converging toward the theoretical prediction (dotted line) for increasing values of . Also, the comparison with the AD (dashed line) shows that the epidemic threshold is appreciably lower in the ADA setting, as the heterogeneity due to the attractiveness distribution facilitates the spreading.
FIG. 4.
Lifetime of SIS processes on an ADA uncorrelated network with power-law distributed activity () and attractiveness (top: , bottom: ), plotted for different values of . We let vary while we keep fixed, and is determined by the relation . The theoretical epidemic threshold (dotted line) is appreciably lower than the threshold for the AD (dashed line), and it is in accordance with the simulations. We used . In the upper plot, we used the following: for simulations (red); for simulations (blue); for simulations (green). In the lower plot, we used the following: for simulations (red); for simulations (blue); for simulations (green). Solid lines with markers and shaded areas represent the mean and confidence interval separately.
B. Deterministic correlation
As a second example, we study the case of a deterministic activity-attractiveness correlation, where the value of one variable uniquely determines the value of the other one for any given node. The joint distribution can be expressed in the form
| (13) |
where is the Dirac delta and is the function that determines the attractiveness of a node given its activity: . Using the relation we can obtain an expression for [provided has an inverse]:
| (14) |
A case of interest is , so that if one of the variables is power-law distributed, the other is too, with a different exponent: if, for example, , then the attractiveness will be distributed as . This also includes the case of identical correlation for . A generic moment of the joint distribution can be expressed as
| (15) |
and Eq. (11) becomes
| (16) |
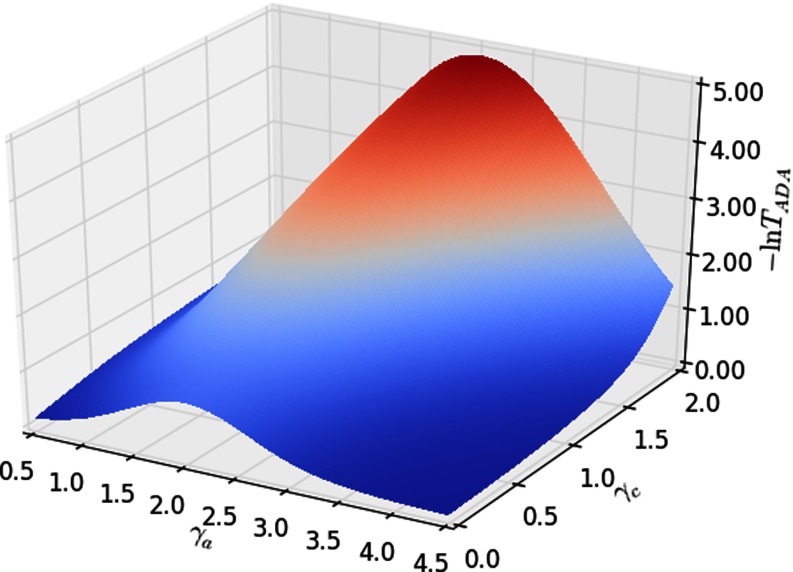
Figure 5 shows the behavior of the threshold as a function of the exponents , governing the activity distribution, and , which determines the activity-attractiveness relation as depicted above. We report the values of the logarithm of : as in previous plots, we choose to show the reciprocal of the epidemic threshold. In this case, we also choose to take the logarithm, as the value of changes considerably in the range studied. For , which is equivalent to the AD as is constant, the threshold shows a maximum for as expected; as increases, the maximum increases very quickly as the most active nodes become more and more popular, greatly facilitating the spreading of the disease.
FIG. 5.
For the case of deterministic activity-attractiveness correlation of the form , with activity distribution , the plot shows the logarithm of as a function of the two exponents and . Higher values in the plot correspond to a lower epidemic threshold, thus to an easier spreading. In particular, when , which corresponds to the AD case as the attractiveness is constant, the spreading is maximal for as expected. When increases, the threshold value decreases very rapidly, as the most active nodes also become the most popular ones.
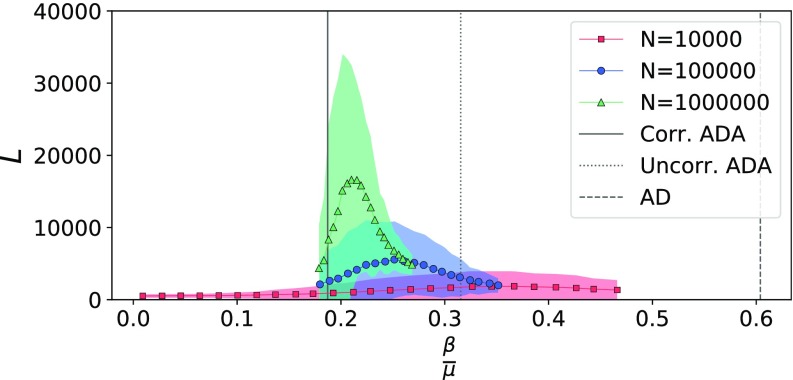
We validated the case of identical correlation with computer simulations by studying an SIS process. In Fig. 6 we plotted the lifetime for different values of . For increasing values of , the lifetime exhibits a peak that converges toward the predicted threshold (solid line)—which is significantly lower than the one obtained in the AD (dashed line), and also lower than the threshold for uncorrelated distributions (dotted line)—thus confirming our analytical predictions. We let vary while keeping fixed , taking the median over a number of realizations ranging between 500 and 3000, depending on the size of the network.
FIG. 6.
Lifetime of an SIS process on an ADA network with identical activity-attractiveness correlation (), plotted for different values of and different network sizes; we used a power-law distributed activity with and let vary while keeping fixed and . The theoretical epidemic threshold (solid line) is lower than the threshold for the AD (dashed line). The case of identical but uncorrelated distributions (, dotted line) is also significantly different from the correlated case. We used , and run the following: for simulations (red); for simulations (blue); for simulations (green). Solid lines with markers and shaded areas represent the mean and confidence interval separately.
As a second instance of the deterministically correlated case, we consider . This form of the function accounts for a case of negative activity-attractiveness correlation, where the most active nodes are the least attractive and vice versa. The same formulas hold as for the case of positive above, leading to the expressions
| (17) |
for a generic moment, and
| (18) |
for the threshold. In this scenario, opposite to the case of positive correlation considered above, we expect the correlations to work against the epidemic, as the most active potential spreaders are also the least attractive and hence the least likely to be infected in the first place.
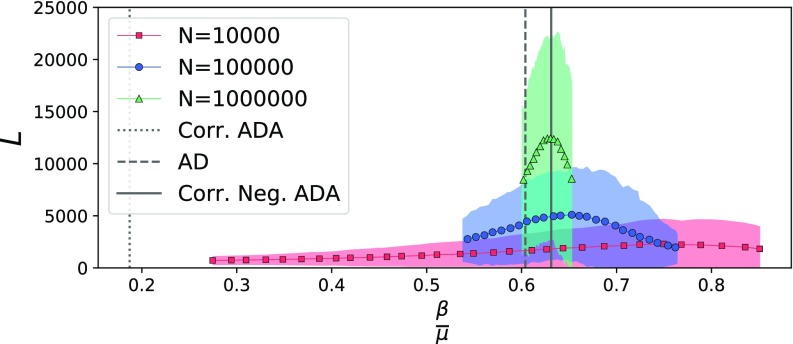
Our expectation is corroborated by the experiments described in Fig. 7, where we study the lifetime of a SIS process on an ADA network characterized by an activity-attractiveness correlation of the form for all nodes, the activity being distributed as a power law with exponent . We used and a number of realizations ranging from 2000 to 3000 for different sizes. The outcome of the simulations matches well the theoretical threshold (solid line), and the comparison with the case of identical correlation (i.e., the same activity distribution with , and attractiveness ; dotted line) shows a stark difference between the two cases, highlighting the contrasting effects of the two phenomena. The threshold for an analogous AD network (with activity distribution of power and constant attractiveness; dashed line) is close to the negatively correlated case.
FIG. 7.
Lifetime of an SIS process on an ADA network with negative deterministic activity-attractiveness correlation of the type , plotted for different values of and different network sizes; we used a power-law distributed activity with exponent and let vary while keeping fixed and . We set , and run the following: for simulations (red); for simulations (blue); for simulations (green). Solid lines with markers and shaded areas represent the mean and confidence interval separately. The results match the theoretical prediction for the epidemic threshold (solid line). The comparison with the case of identical correlation shows how the two scenarios produce contrasting effects, with a negative correlation hindering the spreading phenomenon.
IV. CONCLUSIONS
We studied a recent generalization (labeled ADA for simplicity) of the activity-driven model where a second node's property, called attractiveness, is added. This variable accounts for the fact that not all nodes are as likely to be the target of interactions initiated by others. The original activity-driven model (labeled AD for simplicity) would only account for heterogeneity in nodes' behavior by distinguishing between more and less active ones, while implicitly assuming constant attractiveness. Observations in different types of real networks show this is not always the case.
We studied the unfolding of epidemic processes on ADA networks. In particular, we derived analytically an expression for the epidemic threshold of SIS models. The analytical and numerical comparison between spreading dynamics unfolding on ADA and AD networks shows how the introduction of a new grade of heterogeneity due to a nonconstant attractiveness can significantly alter the spreading of a disease. To precisely quantify the interplay between the activity and attractiveness, we considered three cases. In the first case, we used two power-law uncorrelated distributions. The results in this setting show that the introduction of heterogeneity in the attractiveness of nodes facilitates the spreading. In the second, instead, we considered a scenario capturing observations in real networks [67] in which the two quantities follow heterogeneous and correlated distributions. In this case, we found that correlations between the two variables facilitate the spreading process even further. Finally, we completed our analysis by considering a case of negative correlations; opposite to the previous case, we found that these types of correlations hinder the spreading phenomenon.
Many of the limits of the AD model are still present in the ADA, i.e., the absence of high-order correlations, or the absence of burstiness. These properties will be the subject of future extensions of the model. An investigation of the topology of the time-integrated network could also provide some interesting insight, particularly by determining whether the introduction of the attractiveness, and of an appropriate activity-attractiveness correlation, can lead to the emergence of the desired properties that characterize most real social systems (assortativity and clustering).
Overall, our results contribute to the recent discussion around the effects of temporal connectivity patterns on dynamical processes unfolding on their fabrics.
REFERENCES
- [1].P. Holme, Eur. Phys. J. B 88, 1 (2015). 10.1140/epjb/e2015-60657-4 [DOI] [Google Scholar]
- [2].P. Holme and J. Saramäki, Phys. Rep. 519, 97 (2012). 10.1016/j.physrep.2012.03.001 [DOI] [Google Scholar]
- [3].N. Masuda and R. Lambiotte, A Guide to Temporal Networks (World Scientific, Singapore, 2016). [Google Scholar]
- [4].M. A. Porter and J. P. Gleeson, in Dynamical Systems on Networks (Springer, Cham, 2016), pp. 49–51. [Google Scholar]
- [5].A. Barrat, M. Barthélemy, and A. Vespignani, Dynamical Processes on Complex Networks (Cambridge University Press, Cambridge, 2008). [Google Scholar]
- [6].S. Boccaletti, V. Latora, Y. Moreno, M. Chavez, and D.-U. Hwang, Phys. Rep. 424, 175 (2006). 10.1016/j.physrep.2005.10.009 [DOI] [Google Scholar]
- [7].M. Newman, Networks: An Introduction (Oxford University Press, Oxford, 2010). [Google Scholar]
- [8].A. Vespignani, Nat. Phys. 8, 32 (2012). 10.1038/nphys2160 [DOI] [Google Scholar]
- [9].M. Boguñá, C. Castellano, and R. Pastor-Satorras, Phys. Rev. Lett. 111, 068701 (2013). 10.1103/PhysRevLett.111.068701 [DOI] [PubMed] [Google Scholar]
- [10].M. Morris, Nature (London) 365, 437 (1993). 10.1038/365437a0 [DOI] [PubMed] [Google Scholar]
- [11].M. Morris, Sexually Transmitted Diseases, edited by K. K. Holmes, et al. (McGraw-Hill, New York, 2007). [Google Scholar]
- [12].E. Valdano, L. Ferreri, C. Poletto, and V. Colizza, Phys. Rev. X 5, 021005 (2015). 10.1103/PhysRevX.5.021005 [DOI] [Google Scholar]
- [13].B. Prakash, H. Tong, N. Valler, M. Faloutsos, and C. Faloutsos, in Joint European Conference on Machine Learning and Knowledge Discovery in Databases (Springer, Berlin, 2010), pp. 99–114. [Google Scholar]
- [14].L. E. C. Rocha, F. Liljeros, and P. Holme, PLoS Comput. Biol. 7, e1001109 (2011). 10.1371/journal.pcbi.1001109 [DOI] [PMC free article] [PubMed] [Google Scholar]
- [15].P. Bajardi, A. Barrat, F. Natale, L. Savini, and V. Colizza, PLoS One 6, e19869 (2011). 10.1371/journal.pone.0019869 [DOI] [PMC free article] [PubMed] [Google Scholar]
- [16].P. Vanhems, A. Barrat, C. Cattuto, J.-F. Pinton, N. Khanafer, C. Régis, B.-A. Kim, B. Comte, and N. Voirin, PLoS One 8, e73970 (2013). 10.1371/journal.pone.0073970 [DOI] [PMC free article] [PubMed] [Google Scholar]
- [17].J. Stehlé, N. Voirin, A. Barrat, C. Cattuto, V. Colizza, L. Isella, C. Régis, J.-F. Pinton, N. Khanafer, W. van den Broeck, and P. Vanhems, BMC Med. 9, 87 (2011) 10.1186/1741-7015-9-87. [DOI] [PMC free article] [PubMed] [Google Scholar]
- [18].N. Perra, B. Gonçalves, R. Pastor-Satorras, and A. Vespignani, Sci. Rep. 2, 469 (2012). 10.1038/srep00469 [DOI] [PMC free article] [PubMed] [Google Scholar]
- [19].T. Takaguchi, N. Masuda, and P. Holme, PLoS One 8, e68629 (2013). 10.1371/journal.pone.0068629 [DOI] [PMC free article] [PubMed] [Google Scholar]
- [20].P. Holme and F. Liljeros, Sci. Rep. 4, 4999 (2014) 10.1038/srep04999. [DOI] [PMC free article] [PubMed] [Google Scholar]
- [21].M. Karsai, M. Kivelä, R. K. Pan, K. Kaski, J. Kertész, A.-L. Barabási, and J. Saramäki, Phys. Rev. E 83, 025102 (2011). 10.1103/PhysRevE.83.025102 [DOI] [PubMed] [Google Scholar]
- [22].Z. Toroczkai and H. Guclu, Physica A 378, 68 (2007). 10.1016/j.physa.2006.11.088 [DOI] [Google Scholar]
- [23].S.-Y. Liu, A. Baronchelli, and N. Perra, Phys. Rev. E 87, 032805 (2013). 10.1103/PhysRevE.87.032805 [DOI] [Google Scholar]
- [24].P. Holme and N. Masuda, PLoS One 10, e0120567 (2015). 10.1371/journal.pone.0120567 [DOI] [PMC free article] [PubMed] [Google Scholar]
- [25].Z. Wang, C. T. Bauch, S. Bhattacharyya, A. d'Onofrio, P. Manfredi, M. Perc, N. Perra, M. Salathé, and D. Zhao, Phys. Rep. 664, 1 (2016). 10.1016/j.physrep.2016.10.006 [DOI] [Google Scholar]
- [26].K. Sun, A. Baronchelli, and N. Perra, Eur. Phys. J. B 88, 326 (2015). 10.1140/epjb/e2015-60568-4 [DOI] [Google Scholar]
- [27].D. Han, M. Sun, and D. Li, Physica A 432, 354 (2015). 10.1016/j.physa.2015.03.062 [DOI] [Google Scholar]
- [28].A. Rizzo, B. Pedalino, and M. Porfiri, J. Theor. Biol. 394, 212 (2016). 10.1016/j.jtbi.2016.01.015 [DOI] [PubMed] [Google Scholar]
- [29].M. Starnini, A. Baronchelli, A. Barrat, and R. Pastor-Satorras, Phys. Rev. E 85, 056115 (2012). 10.1103/PhysRevE.85.056115 [DOI] [PubMed] [Google Scholar]
- [30].B. Ribeiro, N. Perra, and A. Baronchelli, Sci. Rep. 3, 3006 (2013). 10.1038/srep03006 [DOI] [PMC free article] [PubMed] [Google Scholar]
- [31].N. Perra, A. Baronchelli, D. Mocanu, B. Gonçalves, R. Pastor-Satorras, and A. Vespignani, Phys. Rev. Lett. 109, 238701 (2012). 10.1103/PhysRevLett.109.238701 [DOI] [PubMed] [Google Scholar]
- [32].T. Hoffmann, M. A. Porter, and R. Lambiotte, Phys. Rev. E 86, 046102 (2012). 10.1103/PhysRevE.86.046102 [DOI] [PubMed] [Google Scholar]
- [33].N. Masuda, M. A. Porter, and R. Lambiotte, Phys. Report (2017) 10.1016/j.physrep.2017.07.007, doi: 10.1016/j.physrep.2017.07.007. [DOI] [Google Scholar]
- [34].M. Karsai, N. Perra, and A. Vespignani, Sci. Rep. 4, 4001 (2014). 10.1038/srep04001 [DOI] [PMC free article] [PubMed] [Google Scholar]
- [35].A. Clauset and N. Eagle Persistence and periodicity in a dynamic proximity network, in DIMACS Workshop on Computational Methods for Dynamic Interaction Networks (IEEE, Piscataway, 2007), pp. 1–5. [Google Scholar]
- [36].L. Isella, J. Stehlé, A. Barrat, C. Cattuto, J.-F. Pinton, and W. V. den Broeck, J. Theor. Biol. 271, 166 (2011). 10.1016/j.jtbi.2010.11.033 [DOI] [PubMed] [Google Scholar]
- [37].R. Pfitzner, I. Scholtes, A. Garas, C. J. Tessone, and F. Schweitzer, Phys. Rev. Lett. 110, 198701 (2013). 10.1103/PhysRevLett.110.198701 [DOI] [PubMed] [Google Scholar]
- [38].M. Starnini and R. Pastor-Satorras, Phys. Rev. E 87, 062807 (2013). 10.1103/PhysRevE.87.062807 [DOI] [PubMed] [Google Scholar]
- [39].T. Takaguchi, N. Sato, K. Yano, and N. Masuda, New J. Phys. 14, 093003 (2012). 10.1088/1367-2630/14/9/093003 [DOI] [Google Scholar]
- [40].B. Gonçalves and N. Perra, Social Phenomena: From Data Analysis to Models (Springer, Berlin, 2015). [Google Scholar]
- [41].J. Fournet and A. Barrat, PLoS One 9, e107878 (2014). 10.1371/journal.pone.0107878 [DOI] [PMC free article] [PubMed] [Google Scholar]
- [42].A. Barrat and C. Cattuto, in Social Phenomena (Springer International Publishing, Berlin, 2015), pp. 37–57. [Google Scholar]
- [43].V. Sekara, A. Stopczynski, and S. Lehmann, Proc. Natl. Acad. Sci. USA 113, 9977 (2016). 10.1073/pnas.1602803113 [DOI] [PMC free article] [PubMed] [Google Scholar]
- [44].P. Holme, Europhys. Lett. 64, 427 (2003). 10.1209/epl/i2003-00505-4 [DOI] [Google Scholar]
- [45].H.-H. Jo, M. Karsai, J. Kertész, and K. Kaski, New J. Phys. 14, 013055 (2012). 10.1088/1367-2630/14/1/013055 [DOI] [Google Scholar]
- [46].E. Ubaldi, N. Perra, M. Karsai, A. Vezzani, R. Burioni, and A. Vespignani, Sci. Rep. 6, 35724 (2016). 10.1038/srep35724 [DOI] [PMC free article] [PubMed] [Google Scholar]
- [47].E. Ubaldi, A. Vezzani, M. Karsai, N. Perra, and R. Burioni, Sci. Rep. 7, 46225 (2017). 10.1038/srep46225 [DOI] [PMC free article] [PubMed] [Google Scholar]
- [48].G. Miritello, E. Moro, and R. Lara, Phys. Rev. E 83, 045102 (2011). 10.1103/PhysRevE.83.045102 [DOI] [PubMed] [Google Scholar]
- [49].M. Kivelä, R. K. Pan, K. Kaski, J. Kertész, J. Saramäki, and M. Karsai, J. Stat. Mech. (2012) P03005. 10.1088/1742-5468/2012/03/P03005 [DOI] [PubMed] [Google Scholar]
- [50].A. Panisson, A. Barrat, C. Cattuto, W. V. den Broeck, G. Ruffo, and R. Schifanella, Ad Hoc Netw. 10, 1532 (2012) 10.1016/j.adhoc.2011.06.003. [DOI] [Google Scholar]
- [51].L. Weng, J. Ratkiewicz, N. Perra, B. Gonçalves, C. Castillo, F. Bonchi, R. Schifanella, F. Menczer, and A. Flammini, in Proceedings of the 19th ACM SIGKDD International Conference on Knowledge Discovery and Data Mining (ACM, Berlin, 2013), pp. 356–364. [Google Scholar]
- [52].J. P. Gleeson, K. P. O'Sullivan, R. A. Baños, and Y. Moreno, Phys. Rev. X 6, 021019 (2016). 10.1103/PhysRevX.6.021019 [DOI] [Google Scholar]
- [53].N. Fujiwara, J. Kurths, and A. Díaz-Guilera, Phys. Rev. E 83, 025101(R) (2011). 10.1103/PhysRevE.83.025101 [DOI] [PubMed] [Google Scholar]
- [54].R. Parshani, M. Dickison, R. Cohen, H. E. Stanley, and S. Havlin, Europhys. Lett. 90, 38004 (2010). 10.1209/0295-5075/90/38004 [DOI] [Google Scholar]
- [55].A. Baronchelli and A. Díaz-Guilera, Phys. Rev. E 85, 016113 (2012). 10.1103/PhysRevE.85.016113 [DOI] [PubMed] [Google Scholar]
- [56].O. Artime, J. Fernández-Gracia, J. J. Ramasco, and M. S. Miguel, Sci. Rep. 7, 7166 (2017) 10.1038/s41598-017-07031-z. [DOI] [PMC free article] [PubMed] [Google Scholar]
- [57].M.-X. Liu, W. Wang, Y. Liu, M. Tang, S.-M. Cai, and H.-F. Zhang, Phys. Rev. E 95, 052306 (2017). 10.1103/PhysRevE.95.052306 [DOI] [PubMed] [Google Scholar]
- [58].A. Rizzo and M. Porfiri, Eur. Phys. J. B 89, 1 (2016). 10.1140/epjb/e2015-60933-3 [DOI] [Google Scholar]
- [59].A.-L. Barabási, Network Science (Cambridge University Press, Cambridge, 2008). [Google Scholar]
- [60].M. V. Tomasello, N. Perra, C. J. Tessone, M. Karsai, and F. Schweitzer, Sci. Rep. 4, 5679 (2014) 10.1038/srep05679. [DOI] [PMC free article] [PubMed] [Google Scholar]
- [61].S. Liu, N. Perra, M. Karsai, and A. Vespignani, Phys. Rev. Lett. 112, 118702 (2014). 10.1103/PhysRevLett.112.118702 [DOI] [PubMed] [Google Scholar]
- [62].M. S. Granovetter, Am. J. Sociol. 78, 1360 (1973). 10.1086/225469 [DOI] [Google Scholar]
- [63].M. E. J. Newman, SIAM Rev. 45, 167 (2003). 10.1137/S003614450342480 [DOI] [Google Scholar]
- [64].A.-L. Barabási, Nature (London) 435, 207 (2005). 10.1038/nature03459 [DOI] [PubMed] [Google Scholar]
- [65].G. Laurent, J. Saramäki, and M. Karsai, Eur. Phys. J. B 88, 301 (2015). 10.1140/epjb/e2015-60481-x [DOI] [Google Scholar]
- [66].A. Moinet, M. Starnini, and R. Pastor-Satorras, Phys. Rev. Lett. 114, 108701 (2015). 10.1103/PhysRevLett.114.108701 [DOI] [PubMed] [Google Scholar]
- [67].L. Alessandretti, K. Sun, A. Baronchelli, and N. Perra, Phys. Rev. E 95, 052318 (2017). 10.1103/PhysRevE.95.052318 [DOI] [PubMed] [Google Scholar]
- [68].G. Ghoshal and P. Holme, Physica A 364, 603 (2006). 10.1016/j.physa.2005.04.047 [DOI] [Google Scholar]
- [69].S. Valverde and R. V. Solé, Phys. Rev. E 76, 046118 (2007). 10.1103/PhysRevE.76.046118 [DOI] [PubMed] [Google Scholar]
- [70].M. Starnini, A. Baronchelli, and R. Pastor-Satorras, Phys. Rev. Lett. 110, 168701 (2013). 10.1103/PhysRevLett.110.168701 [DOI] [PubMed] [Google Scholar]
- [71].R. M. Sapolsky, Science 308, 648 (2005). 10.1126/science.1106477 [DOI] [PubMed] [Google Scholar]
- [72].M. Starnini and R. Pastor-Satorras, Phys. Rev. E 89, 032807 (2014). 10.1103/PhysRevE.89.032807 [DOI] [PubMed] [Google Scholar]
- [73].W. O. Kermack and A. G. McKendrick, Proc. R. Soc. London, Ser. A 115, 700 (1927). 10.1098/rspa.1927.0118 [DOI] [Google Scholar]
- [74].M. Keeling and P. Rohani, Modeling Infectious Disease in Humans and Animals (Princeton University Press, Princeton, NJ, 2008). [Google Scholar]
- [75].R. Pastor-Satorras, C. Castellano, P. van Mieghem, and A. Vespignani, Rev. Mod. Phys. 87, 925 (2015). 10.1103/RevModPhys.87.925 [DOI] [Google Scholar]
- [76].Y. Wang, D. Chakrabarti, C. Wang, and C. Faloutsos, Epidemic spreading in real networks: an eigenvalue view-point, in Proceedings of 22nd International Symposium on Reliable Distributed Systems, 2003 (IEEE, Piscataway, 2003), pp. 25–34. [Google Scholar]
- [77].R. Pastor-Satorras and A. Vespignani, Phys. Rev. E 63, 066117 (2001). 10.1103/PhysRevE.63.066117 [DOI] [PubMed] [Google Scholar]
- [78].R. Pastor-Satorras and A. Vespignani, Phys. Rev. E 65, 035108 (2002). 10.1103/PhysRevE.65.035108 [DOI] [PubMed] [Google Scholar]


