Abstract
Patient safety is a great concern of healthcare institutions and the correct reporting and management of adverse events is a key element for supporting safety improvement efforts. Patient falls are the most frequent adverse event in hospitals and often cause serious patient outcomes. In this work, we describe the experience of the Local Healthcare Authority of Romagna, Italy that, within the framework of a quality and safety improvement programme, designed, developed and implemented a desktop application for monitoring inpatient falls. A multidisciplinary team created a software tool based on R, an open source software for statistical computing that, appropriately combined with the existing hospital information system, is used to obtain Shewhart u-control charts for monitoring the monthly fall rates. The tool had been implemented in twenty nine hospital units. The results indicate that the proposed application gave a valuable contribution in the safety improvement activities. Its usefulness extended beyond the “safety problem” as it also enabled hospital managers to identify a number of critical issues in data collection. As a result, where necessary, improvement actions had been implemented. Furthermore, the use of open source software led to a considerable cost reduction and facilitated customization of the software tool.
Keywords: Adverse events, Control charts, Desktop application, Hospital information system, Patient safety
Introduction
Healthcare organizations are continuously engaged in increasing or maintaining high levels of quality and safety of care. Among the many activities carried out to sustain these programs, the correct reporting and management of adverse events is a key element for supporting all improvement efforts. In order to ensure patient safety, evidence-based systems are implemented and the monitoring of adverse events constitutes one of an array of methods used by hospital management teams in the pursuit of safety [1].
Patient falls are one of the most frequent adverse events in healthcare institutions [2]. A patient fall often causes serious consequences which include an increase in the period of hospitalization and a reduction in the quality of life of the person that had suffered the fall. Furthermore, it increases hospital costs and can result in legal disputes.
In this framework, the challenge is to select suitable statistical tools to accurately monitor adverse events and to provide benchmarks for safety performance assessments.
Statistical process control (SPC) provides methods both for assessing undisturbed, or steady-state, process behavior and for detecting positive or negative changes in performance [3].
The relevance of SPC in the healthcare context is confirmed in reviews by Benneyan et al. [4], Thor et al. [5], Noyez [6] and Woodall et al. [7]; in books by Carey [8], Winkel and Zhang [9], Faltin et al. [10], Morton et al. [11], and Melo and Beck [12]; and in methodological notes by Mohammed et al. [13], Mohammed and Worthington [14] and Mohammed et al. [15].
Control charts are one of the primary tools used in SPC and are being increasingly adopted in healthcare to aid in process understanding, to assess process stability and to identify changes that indicate either the improvement or deterioration in quality [16].
The AUSL (Azienda Unità Sanitaria Locale/Local Healthcare Authority) of Romagna, Italy started a quality improvement project aimed at increasing knowledge on process performance and at improving patient safety. Within this framework, the availability, for nursing and medical staff, of a tool for continuous surveillance of inpatient hospital falls was considered one of the important aspects.
In this work we outline the design and implementation of a software tool that is used to obtain control charts for monitoring the monthly fall rates, we provide evidence of its functionality and we give an overview on the current developments of the present research.
The project was developed in collaboration with the Department of Statistical Sciences of the University of Bologna and involved a multidisciplinary team of healthcare professionals including, nurses, hospital information technology (I.T.) personnel, clinicians, risk managers and administrators.
Twenty-nine hospital units were involved. For each hospital unit a Shewhart u-control chart, for the number of falls per 1000 patient-days, was suitably calibrated and implemented.
Statistical analyses were performed using R [17], a free software environment for statistical computing and graphics. The R code was appropriately combined with the hospital information systems to automatically obtain a control chart, upon request, by the users.
The final product is a user-friendly desktop application that had been installed locally in each hospital unit using a Terminal Server environment.
The real-time monitoring of the fall rates has made a valuable contribution in the safety improvement activities.
Furthermore, the use of the proposed tool enabled hospital safety managers to identify a number of critical issues in data collection. Therefore, where necessary, improvement actions were implemented.
Finally, the adoption of open source software allowed an appreciable cost reduction and makes customization for each hospital unit easy to implement.
It should also be pointed out that the project is still evolving. We are currently comparing several alternative monitoring schemes in order to improve the detection ability of the software tool.
The paper is organized as follows. In Section 2, we introduce the Local Healthcare Authority of Romagna and provide a brief overview of the quality improvement project in question. In Section 3, we describe the software tool design and its implementation. In Section 4, we review the theoretical background of the monitoring algorithm of interest and show how the calibration (Phase I) of the control chart was performed. In Section 5, we describe how the application works and the actions required from the user. Our concluding remarks are reported in Section 6. Finally, in Appendix A we provide an overview of the current developments of the project.
The Local Healthcare Authority of Romagna
The AUSL (Azienda Unità Sanitaria Locale/Local Healthcare Authority) of Romagna serves a population of approximately 1,100,000 inhabitants (the provinces of Forlì-Cesena, Ravenna and Rimini), employs 15,302 staff and houses 2908 inpatient beds.
In 2018 the AUSL of Romagna started a quality and safety improvement programme and within this framework, the availability, for nursing and medical staff, of suitable methods for continuous surveillance of the occurrence of adverse events was considered of great importance in order to increase process understanding, enabling thoughtful management, and eventually leading to improvement.
Some of the most common adverse events in healthcare settings are medication errors, inpatient falls, catheter dislodgements and transfusion-related adverse events. Of all these, inpatient falls are the most frequent as well as the most serious adverse events, constituting 24%–84% of overall healthcare adverse events [18–21]. The fall rate in acute-care hospitals is between 1.3 and 8.9, mainly ranging from 3 to 5 per 1000 patient days. A fall with injury adds on average 6.3 days to the hospital stay, increases hospital costs, leads to legal disputes and reduces the quality of life of the person that suffered the fall [22].
Considering the relevance of the “fall event” in the healthcare context, the AUSL of Romagna gave priority to the monitoring of monthly fall rates in its hospitals. The project involved twenty-nine hospital units distributed across seven hospitals and six healthcare facilities (Table 1).
Table 1.
Hospitals, Healthcare facilities, Hospital Units. The provinces are Forlì-Cesena (FC), Ravenna (RA) and Rimini (RN)
| Hospital/Healthcare Facility | City/Town (Province) | Hospital Units |
|---|---|---|
| “M. Bufalini” Hospital | Cesena (FC) | Geriatrics |
| Internal Medicine | ||
| Long-term Care | ||
| Healthcare facility of the “M. Bufalini” Hospital | ||
| “G. Marconi” Hospital | Cesenatico (FC) | Rehabilitative Medicine |
| “Morgagni-Pierantoni” Hospital | Forlì (FC) | Geriatrics |
| Internal Medicine “Allende” | ||
| Rehabilitative Medicine | ||
| Healthcare facility of the “Morgagni-Pierantoni” Hospital | ||
| “Nefetti” Hospital | Santa Sofia (FC) | Internal Medicine/Rehabilitative Medicine |
| “Santa Maria delle Croci” Hospital | Ravenna (RA) | Internal Medicine (First Floor) |
| Internal Medicine (Fourth Floor) | ||
| Post-Acute Care | ||
| Healthcare facility of the “Santa Maria delle Croci” Hospital | ||
| “San Giorgio” Hospital | Cervia (RA) | Long-term Care |
| “degli Infermi” Hospital | Faenza (RA) | Geriatrics |
| Internal Medicine | ||
| Long-term Care | ||
| Post-Acute Care | ||
| “Umberto I” Hospital | Lugo (RA) | Internal Medicine |
| Long-term Care | ||
| Post-Acute Care | ||
| “Infermi” Hospital | Rimini (RN) | Geriatrics |
| Internal Medicine 1 | ||
| Internal Medicine 2 | ||
| Nephrology | ||
| Post-Acute Care | ||
| Healthcare facilities of the “Infermi” Hospital | ||
| “Franchini” Hospital | Santarcangelo di Romagna (RN) | Internal Medicine |
| Post-Acute Care | ||
| “Sacra Famiglia” Hospital | Novafeltria (RN) | Internal Medicine |
| “Ceccarini” Hospital | Riccione (RN) | Internal Medicine |
| Healthcare facility of the “Ceccarini” Hospital | ||
| “Cervesi” Hospital | Cattolica (RN) | Internal Medicine |
To monitor the adverse event in question the Shewhart u-chart for the number of falls per 1000 patient-days was used. Given the different characteristics of the hospitals/healthcare facilities (dimensions, number and type of units, catchment areas) and the heterogeneity of the hospital units involved, it was decided not to impose the same reference value for all the units. For each hospital unit the control chart was tailored by performing a Phase I using a suitable time period. In such a way each hospital unit has a control chart with a central line which represents its “in-control” or steady state performance. As a result, each unit is able to set up a monitoring and improvement policy designed on the basis of its own characteristics. Details about how Phase I was performed are reported in Section 4.
Software Design and Implementation
The software tool was designed in such a way as to be combined in the hospital information system where patient falls, as other relevant adverse events, are promptly recorded by each unit.
The desktop application was developed and installed in a Windows 2003 Server Platform using a Terminal Server environment.
Hospital software engineers opted for the Terminal Server environment due to the high number of hospital units involved and their location over a wide geographical territory. In this way, by centralizing the installation and the users’ configuration, simple distribution and management of the application was obtained.
The environment consists of one or more central servers, which are responsible for performing the statistical analyses, and of client workstations, located in the various hospital facilities.
The sole function of the client workstations is to receive the final result, without the need for hardware requirements and complex software configurations, as the software tool is installed and runs on the central server.
The software consists of two major scripts of code: a script for the client-server communications and a script for the statistical elaborations.
The statistical computations are performed using R [17] and the R package “qcc” [23].
The application was designed in such a way as to offer a certain degree of flexibility: the user can choose the date range for which to display the control chart. For this reason, hospital information technology staff designed a query interface where the user can specify the temporal range of interest.
By clicking on the application icon on the client’s desktop, the code for the client-server communications sends the falls-related data, extracted by the user, to the server for the statistical analyses.
The R code for the statistical computations was suitably tailored for each hospital unit and, using the data extracted by the user, automatically produces the control chart in pdf format, which is sent to the client, displayed to the user and automatically saved in a specific directory.
Shewhart u-Control Chart: Theoretical Background
An inpatient fall, as the majority of adverse events in the healthcare framework, has the following peculiarities: it is a rare event and the area of opportunity, i.e. the size of the at-risk population, is not constant over time. Control charts are effective methods in statistical process control (SPC) for monitoring rare events data in situations where the area of opportunity (sample size) is not constant over time as for example the monitoring of an adverse event when the size of the at-risk population changes randomly from month to month.
The issue of statistical monitoring of the occurrence rate of an event with time varying population sizes can be formalized as follows.
Let X1, X2, …Xi… be a sequence of event counts observed during fixed time periods. We assume that the Xi‘s are independent Poisson observations with mean niθ0, where θ0 is the incidence rate of the event in question and n1, n2, …ni… are the size of the population at time i, respectively.
It is assumed that θ0 changes to another unknown value θ1 at some an unknown time tc and the objective is to detect the change as early as possible while controlling the false alarms rate.
The Shewhart u-control chart is likely the most used monitoring algorithm at handling such changes in the area of opportunity (i.e. the changes in sample sizes). The u-chart is based on the average number of non-conformities (or adverse events) per inspection unit, i.e. ui = (Xi/ni), with central line and control limits (with the usual 3-sigma rule) given by
| 1 |
| 2 |
| 3 |
respectively [3]. There is no LCL for sample i if LCLi < 0. The u-chart signals an out-of-control situation when one of the plotted points ui exceeds the control limits.
In practice the parameter θ0 is often unknown therefore it should be estimated by performing a “Phase I” on m in-control-samples. In this case the estimator of θ0 is
| 4 |
and the estimated value replaces θ0 in the above formulas.
To describe how the control chart was set up we considered, without the loss of any generality, the hospital unit of Medicine 1 of the “Infermi Hospital” in Rimini.
The inpatient fall-related adverse events data were collected from the Hospital Patient-Safety reporting System: for each month the number of falls (xi) and the number of patient days () are available.
To monitor the adverse event in question a u-chart for the number of falls per 1000 patient-days was implemented thus the control chart plots the statistic ui = (xi/ni) where .
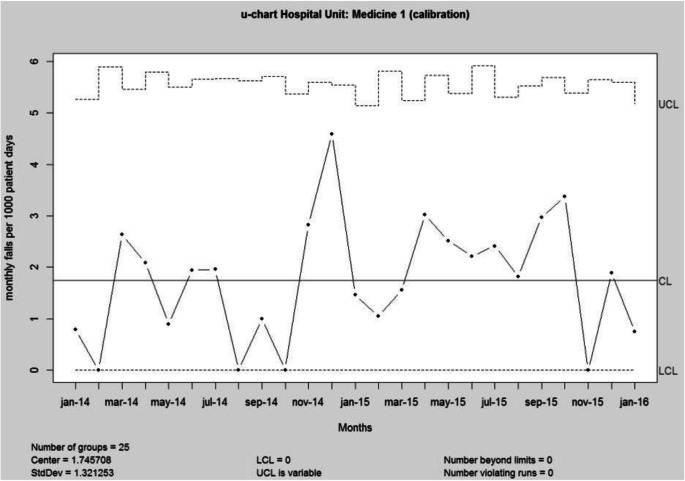
To estimate the unknown falls rate θ0 for this hospital unit a “Phase I” was performed on the period January 2014 – January 2016 (m = 25 months).
In Phase I, historical data were analyzed in a retrospective analysis, constructing trial control limits to determine if the process was in control over the period of time during which the data were collected and to ascertain if reliable control limits can be established. Points that are outside the control limits are investigated, seeking potential assignable causes. Any assignable causes or occurrences of irregular variation are identified and eliminated from the process and a new set of revised control limits are calculated. The goals of a Phase I analysis include process parameters estimation, quantifying the current process quality performance and better understanding the nature of variation over time.
Figure 1 depicts the u-chart, obtained using the R package “qcc” [23], for the m = 25 preliminary samples of Phase I.
Fig. 1.
u-chart for Phase I.
Phase 1 was carried out with great attention because the sensitivity of parameter estimates to observation noise or disturbances critically affects the performance of control charts designed for prospective monitoring (Phase II). Note also that m = 20 or 25 subgroups are usually recommended in order to conclude that the process was in statistical control and, as a result, to obtain reliable parameter estimates [3].
As the m = 25 samples of Phase I didn’t show any out of control signals or particular systematic pattern, we considered a reliable estimate of the monthly fall rate for 1000 patient days.
Phase I was performed for each of the twenty-nine hospital units: for each unit, on the basis of the available data and using at least 25 months, a reliable estimate of the monthly fall rate for 1000 patient days was obtained. This allowed each hospital unit to assess its “in-control” or steady state performance and to monitor the current performance for detecting process improvement or deterioration.
The results of “Phase I” are not shown to the users. They are reported here for descriptive purposes only.
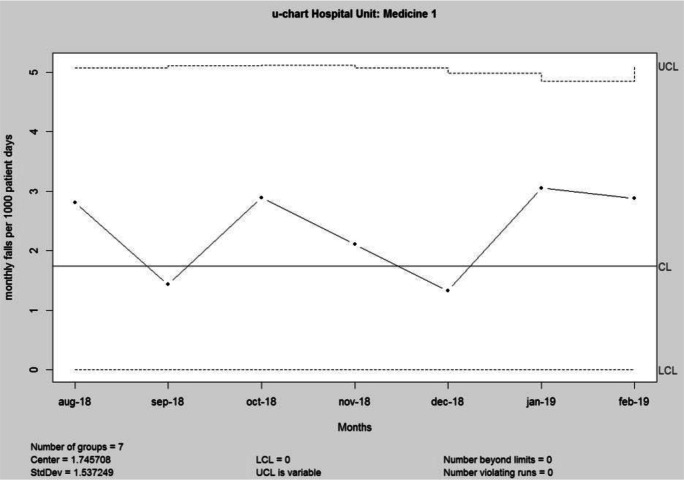
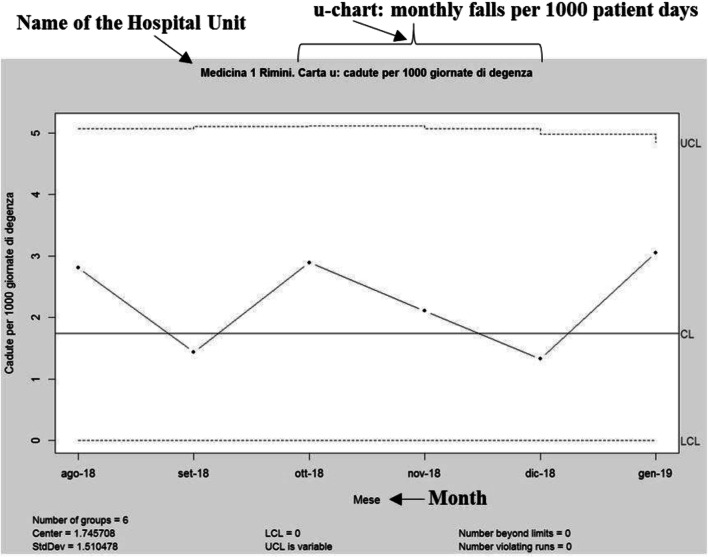
Once the user has selected the date range of interest, the application automatically produces the control chart. As an example, let us suppose that the user selected the period August 2018–February 2019: the resulting control chart is showed in Fig. 2. For the sake of completeness the corresponding data are reported in Table 2.
Fig. 2.
u-chart for Phase II (August 2018–February 2019).
Table 2.
patient days and xi monthly falls for the period August 2018–February 2019
| Month | xi | |
|---|---|---|
| Aug-18 | 1424 | 4 |
| Sep-18 | 1395 | 2 |
| Oct-18 | 1382 | 4 |
| Nov-18 | 1423 | 3 |
| Dec-18 | 1505 | 2 |
| Jan-19 | 1637 | 5 |
| Feb-19 | 1390 | 4 |
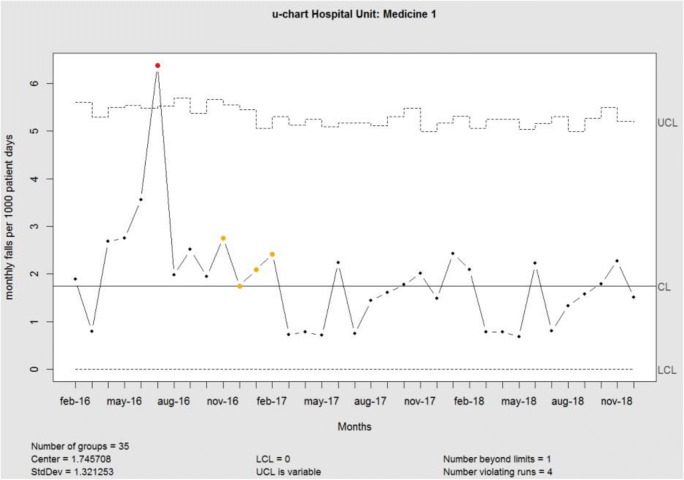
In the control charts, colors are used to help users to interpret the results: special causes of variation are marked in red; sequences of observations (run), above or below the center line of length equal or greater than 8, are marked in yellow. As an example, in Fig. 3 a control chart based on simulated data is shown with the sole purpose of showing the colors that may appear.
Fig. 3.
u-chart for simulated data.
The Desktop Application
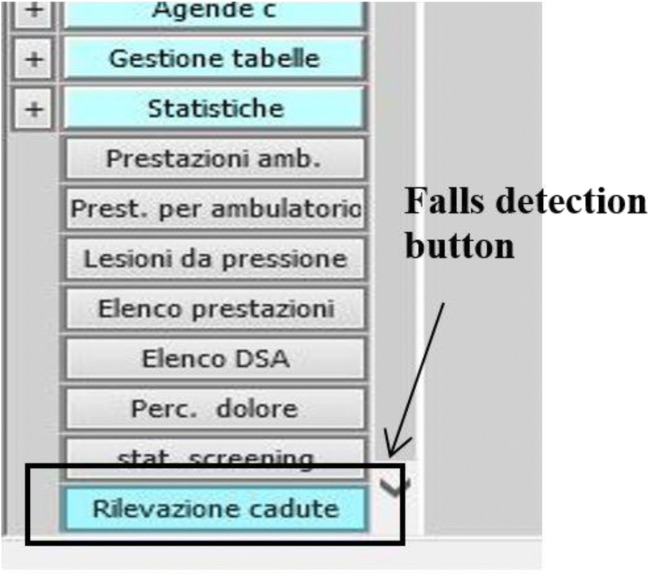
The actions required from users can be divided in two steps. The first step is combined in the hospital information system. Once logged-in, the user (Nurse or Doctor) can identify on the relevant menu the “Falls Detection” button. Figure 4 shows a screenshot of the user’s menu as it appears to the user: it is in Italian however to help the readers we introduced, in Fig. 4 and in the Figures which follows, where necessary, the English translation.
Fig. 4.
A screenshot of hospital information system menu as it appears to the user
By clicking on the Falls Detection button (Fig. 4) the query interface opens (Fig. 5) and the user is asked to select the period of time for which to display the control chart. In Fig. 5 the selected period is from August 1st 2018 (in Italian: Dal 01/08/18) to 31st January 2019 (in Italian: Al 31/01/19).
Fig. 5.
A screenshot of the query interface as it appears to the user
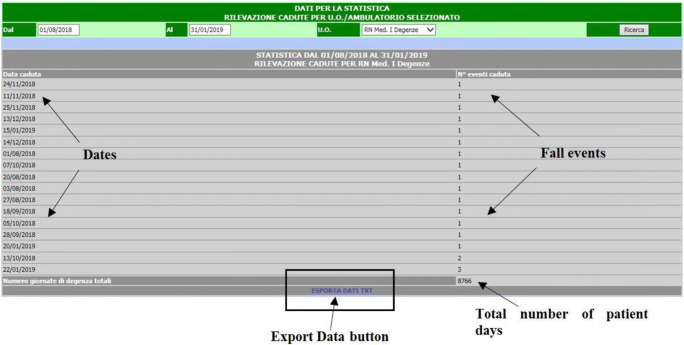
Therefore, by clicking on the Research button (Fig. 5) the application will display, just below the query interface, all the falls events with the correspondent occurrence dates and, highlighted in blue, the Export Data button (Fig. 6).
Fig. 6.
A screenshot of the query interface as it appears to the user, with the fall events and the corresponding dates
By clicking on the Export Data button in Fig. 6 a file, with the data that will be elaborated by the software, is automatically generated and saved in the appropriate directory.
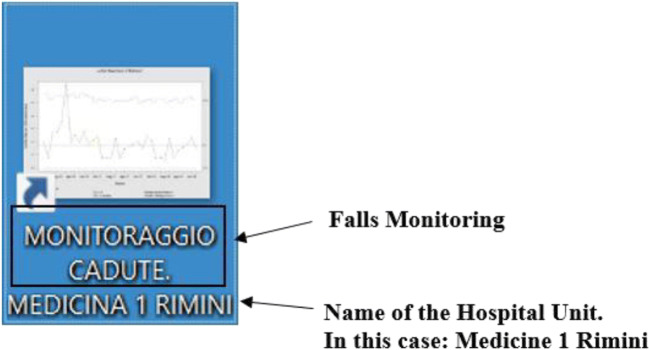
In the second step the users can click on the application icon on their desktop (Fig. 7). In this way, the extracted data will be elaborated, the software will display on the user’s monitor the Shewhart u-control chart (Fig. 8) and will automatically save the control chart, in pdf format, in a specified directory.
Fig. 7.
Screenshot of application icon as it appears to the user
Fig. 8.
u-control chart as it appears to the user.
Concluding Remarks
Implementation of the software tool began in the autumn of 2018 and was initially tested in the following units of the Rimini Hospital: Geriatrics, Internal Medicine 1, Internal Medicine 2, Nephrology and Post-Acute Care.
During the test phase a number of critical issues in data collection method emerged. Therefore, where necessary, improvement actions, concerning the adverse events reporting procedure, were implemented.
The feedback of nurses and doctors indicated that user interface was sufficiently intuitive and easy to use as, except for the period of time for which it is necessary to display the control chart, the user is not required to enter any data. The flexibility offered by being able to choose the period of time for which to display the control chart was much appreciated by users participating in the test phase.
In general, user acceptance, an important hurdle for successful implementation of a performance monitoring system, was excellent with minimal training.
Currently the application is running in all the hospital units. Each unit has a customized control chart where the central line represents the average performance of its stable, or in-control, process. This allowed each unit: to assess if the monitored process is stable and predictable; to perform a self-assessment to understand whether it is performing, on average, at an acceptable level of safety; to promptly detect significant changes in the fall rates enabling nursing and medical staff to investigate the reasons for these changes and if necessary to respond adequately; to test whether changes to the existing processes actually result in improvements and whether the improvement goals have been reached.
To ensure effective monitoring, the adequacy of the estimates obtained in Phase I will be verified every 12 months for each unit. In the event of evident changes in the unit performance, a recalibration of the control chart will be performed.
It should be noted that the use of open source software allowed a considerable cost reduction and facilitated customization of the tool.
Given the valuable results obtained the AUSL of Romagna decided to continue its support to the project and further developments are underway (although slowed down by the current Covid-19 emergency). At present, we are considering other monitoring schemes and we are comparing their statistical properties with those of the u-chart. In Appendix A we outline the current status of the research while same preliminary results were presented in Scagliarini et al. [27].
Appendix A. Current project developments
It is well known that the u-control chart has several shortcomings. For example, it is not sensitive enough to detect small parameter shifts in real-time monitoring. To improve the detection capability relative to that of the Shewhart control charts, several alternative monitoring schemes have been developed. Among them, the cumulative sum (CUSUM) and the exponentially weighted moving average (EWMA) charts are popular [3]. Therefore, we are currently examining also several EWMA monitoring schemes which can be used jointly with the u-control chart. For this phase of the project we limit ourselves to EWMA-type control charts given the easy implementation and interpretation. We will consider the CUSUM-topic in a future piece of research.
The first EWMA-chart that we considered was proposed by Dong et al. [24]. The EWMA statistic, in the following EWMA_D, is
| 5 |
where λD ∈ (0, 1] is a smoothing parameter, which determines the weights assigned to the past observations, and Z0 = θ0. The exact variance of the EWMA_D is
| 6 |
and the EWMA_D-chart is
| 7 |
| 8 |
| 9 |
The factor LD is the width of the control limits. It is possible to choose the design parameters λD and LD that provide the desired average run length (ARL) performance of the chart [3, 24]. A reasonable, often-used rule of thumb is to choose λD ∈ [0.05, 0.2] and to look for the control limits coefficient LD to achieve a specific value of the in-control (IC) ARL. In practice λD = 0.05, λD = 0.1 andλD = 0.2 are the most used values.
The EWMA methods were developed for Phase II monitoring. When the parameter θ0 is unknown it can be estimated through a Phase I usually performed using a Shewhart u-chart [3].
Ryan and Woodall [25], to avoid a possible problem of inertia in detecting increases in the incidence rate, modified the EWMA_D control chart by introducing a lower reflecting barrier at Zi = θ0. Their proposed EWMA statistic, in the following EWMA_RW, is
| 10 |
where λRW ∈ (0, 1] and . The upper control limit is given by
| 11 |
Also for the EWMA_RW, λRW and LRW can be chosen as to obtain the desired ARL performance of the chart.
Zhou et al [26] proposed an EWMA control chart (EWMA_W) derived under the framework of a weighted likelihood ratio test WLRT for monitoring Poisson count data with varying sample size. For the authors the monitoring task is to test H0 : θ = θ0 versus H1 : θ = θ1. By ignoring two constant terms with respect to θ, the log-likelihood of the observation Xj can be expressed as
| 12 |
At any time point t, consider the following exponentially weighted log-likelihood over samples 1 to t
| 13 |
where λz ∈ (0, 1] is the smoothing parameter, and is a sequence of constants to ensure that all the weights add up to 1 as t → ∞. For j = 0, (X0, n0) can be viewed as a pseudo “sample” and is chosen as (n1θ0, n1). Given the value of λz, the maximum weighted likelihood estimate (MWLE) of θ at time point t is defined as the solution to the following maximization problem
| 14 |
Since can be written as [26].
| 15 |
it follows that the −2 × logarithm of weighted LRT (WLRT) statistic is
| 16 |
where Yc,t and Yp,t are the exponentially weighted average of counts and populations, respectively. The WLRT statistic can thus be used for monitoring and the corresponding control chart triggers a signal if exceeds a specified control limit. Note that Yc,t and Yp,t can be written according to the recursive formulations
| 17 |
| 18 |
where the initial values are Yc,0 = θ0n1 and Yp,0 = n1 respectively based on the pseudosample (X0, n0) defined earlier. The chart can be implemented for detecting positive and negative shifts.
For positive shifts, H0 : θ = θ0 versus H1 : θ > θ0, the monitoring test statistic is
| 19 |
and the EWMA_W control chart is
| 20 |
where Lz, p > 0 is chosen to achieve a specific value of IC ARL.
For negative shifts, H0 : θ = θ0versus H1 : θ< θ0 the monitoring test statistic is and the EWMA_W control chart is
| 21 |
where Lz, n > 0 and is chosen to achieve a specific value of IC ARL.
Also for the EWMA_W a reasonable rule-of-thumb used in practice for designing the control chart is to choose λz ∈ [0.05, 0.2] and to look for the control limits coefficient Lz, p (or Lz, n) to achieve a specific value of the IC ARL.
In the current research developments we are designing a simulation study to compare the monitoring schemes of interest. Since to perform the comparisons all the control charts examined must have the same IC performance, we will first investigate how set up the alternative monitoring schemes with the same in-control performances. Once obtained comparable control chart we will study and compare their out-of-control (OC) properties. The aim is to identify the most suitable control chart considering jointly: the ability to detect unexpected changes (usually worsening), the ability to test the impact of interventions (usually improvements), the ease of use and clarity of interpretation. Preliminary results from the simulation study indicate that the EWMA control chart derived under the framework of weighted likelihood ratio test seems to be the most promising in terms of overall performance [27].
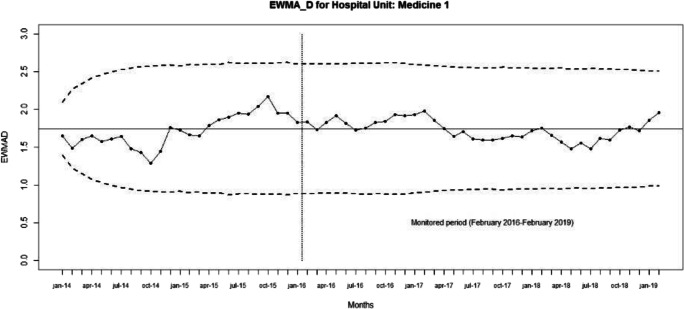
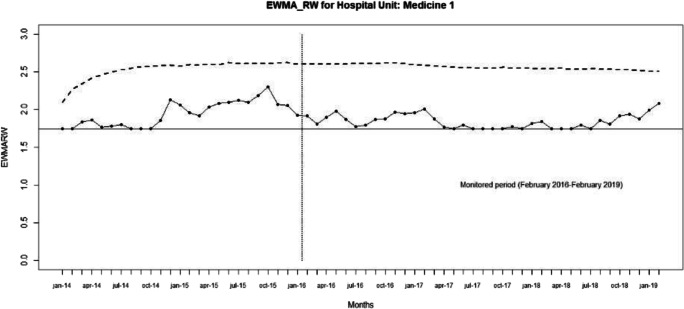
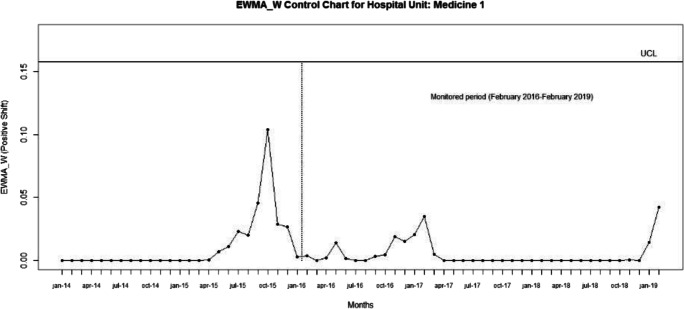
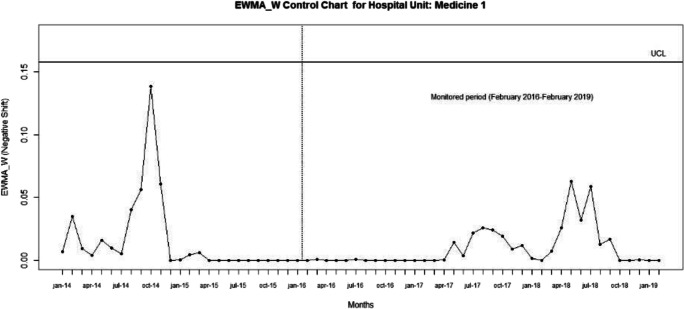
Here, only for illustrative purposes, we set up the EWMA_D, EWMA_RW, EWMA_W (for positive shifts) and EWMA_W (for negative shift) control charts with the same value for the smoothing parameter λD = λRW = λz = 0.1 and, to be consistent with the 3-sigma rule used for the u-chart, we used for the control limits coefficients LD = LRW = Lz, p = Lz, n = 3.
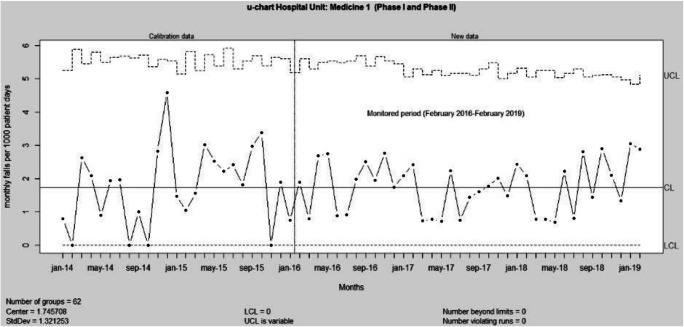
We considered the hospital unit of Medicine 1 of the “Infermi Hospital” in Rimini and the results of Phase I obtained in Section 4. As monitored period we considered the data from February 2016 to February 2019.
The u, EWMA_D, EWMA_W, and EWMA_W (for positive and negative shifts) control charts are shown in Figs 9, 10, 11, 12, 13, respectively.
Fig. 9.
u-control chart for the monitored period February 2016–February 2019.
Fig. 10.
EWMA_D-control chart (λD = 0.1 and LD = 3) for the monitored period February 2016–February 2019
Fig. 11.
EWMA_RW-control chart (λRW = 0.1 and LRW = 3) for the monitored period February 2016–February 2019
Fig. 12.
EWMA_W-control chart (positive shifts) with λw = 0.1 and Lp,n = 3 for the monitored period February 2016–February 2019
Fig. 13.
EWMA_W-control chart (negative shifts) with λw = 0.1 and Lz,n = 3 for the monitored period February 2016–February 2019
Compliance with ethical standards
Conflict of interest
The authors declare that they have no conflict of interest.
Ethical approval
This article does not contain any studies with human participants or animals performed by any of the authors.
Footnotes
Publisher’s note
Springer Nature remains neutral with regard to jurisdictional claims in published maps and institutional affiliations.
Contributor Information
Michele Scagliarini, Email: michele.scagliarini@unibo.it.
Nunzia Boccaforno, Email: nunzia.boccaforno@auslromagna.it.
Roberto Donati, Email: roberto.donati3@auslromagna.it.
Marco Vandi, Email: marco.vandi@auslromagna.it.
Elisa Ponti, Email: elisa.ponti@auslromagna.it.
Simona Nanni, Email: simona.nanni@auslromagna.it.
References
- 1.Barker A, Morton A, Gatton M, Tong E, Clements A. Sequential monitoring of hospital adverse events when control charts fail: the example of fall injuries in hospitals. Qual Saf Health Care. 2009;18:473–477. doi: 10.1136/qshc.2007.025601. [DOI] [PubMed] [Google Scholar]
- 2.Chang CM, Kao CH, Sha WS, Wu WH, Chen JC. Multilevel control chart and fuzzy set theory to monitor inpatient falls. J Bus Res. 2016;69:2284–2288. doi: 10.1016/j.jbusres.2015.12.043. [DOI] [Google Scholar]
- 3.Montgomery DC. Introduction to statistical quality control, 7th edn. John Wiley & Sons, New York; 2012.
- 4.Benneyan JC, Lloyd RC, Plsek PE. Statistical process control as a tool for research and healthcare improvement. Qual. Saf. Health Care. 2003;12(6):458–464. doi: 10.1136/qhc.12.6.458. [DOI] [PMC free article] [PubMed] [Google Scholar]
- 5.Thor J, Lundberg J, Ask J, Olsson J, Carli, C., Hnstam, K.P., Brommels, M. Application of statistical process control in healthcare improvement: systematic review. Qual Saf Health Care 2007; 16(5), 387–399. [DOI] [PMC free article] [PubMed]
- 6.Noyez L. Control charts, Cusum techniques and funnel plots. A review of methods for monitoring performance in healthcare. Interact. Cardiovasc. Thorac. Surg. 2009;9(3):494–499. doi: 10.1510/icvts.2009.204768. [DOI] [PubMed] [Google Scholar]
- 7.Woodall WH, Adams BM, Benneyan JC. The Use of Control Charts in Healthcare. In Faltin, F., Kenett, R. and Ruggeri, F. (Eds.) Statistical Methods in Healthcare, pp. 253–267. Wiley, New York; 2012.
- 8.Carey RG. Improving healthcare with control charts. Basic and advanced SPC methods and case studies. ASQ-Quality Press, Milwaukee; 2003.
- 9.Winkel P, Zhang NF. Statistical development of quality in medicine. John Wiley and Sons Ltd., Chichester; 2007.
- 10.Faltin F, Kenett R, Ruggeri F. Statistical methods in healthcare. John Wiley and Sons Ltd, Chichester; 2012.
- 11.Morton A, Mengersen K, Whitby M, Playford G. Statistical methods for hospital monitoring with R. John Wiley and Sons Ltd, Chichester; 2013.
- 12.Melo S, Beck M. Quality management and Managerialism in healthcare, Palgrave Macmillan, Basingstoke; 2014.
- 13.Mohammed MA, Worthington P, Woodall W. Tutorial notes on how to plot some basic control charts. Qual. Saf. Health Care. 2008;17(2):137–145. doi: 10.1136/qshc.2004.012047. [DOI] [PubMed] [Google Scholar]
- 14.Mohammed MA, Worthington P. Why traditional statistical process control charts for attribute data should be viewed alongside an xmr-chart. Brit Med J Quality & Safety. 2013;22(3):263–269. doi: 10.1136/bmjqs-2012-001324. [DOI] [PubMed] [Google Scholar]
- 15.Mohammed MA, Panesar JS, Laney DB, Wilson R. Statistical process control charts for attribute data involving very large sample sizes: a review of problems and solutions. Brit. Med. J Quality & Safety. 2013;22(4):362–368. doi: 10.1136/bmjqs-2012-001373. [DOI] [PubMed] [Google Scholar]
- 16.Benneyan JC. The design, selection and performance of statistical control charts for healthcare process improvement. International Journal of Six Sigma and Competitive Advantage. 2008;4(4):209–239. doi: 10.1504/IJSSCA.2008.021837. [DOI] [Google Scholar]
- 17.R Core Team. R: A language and environment for statistical computing. R Foundation for Statistical Computing, Vienna; 2017.
- 18.Akihito N. Incidence and risk factors for inpatient falls in an academic acute-care hospital. J Nippon Med Sch. 2006;73(5):265–270. doi: 10.1272/jnms.73.265. [DOI] [PubMed] [Google Scholar]
- 19.Haines TP, Hill K, Walsh W, Osborne R. Design-related bias in hospital fall risk screening tool predictive accuracy evaluations: systematic review and meta-analysis. J Gerontol A Biol Sci Med Sci. 2007;62(6):664–672. doi: 10.1093/gerona/62.6.664. [DOI] [PubMed] [Google Scholar]
- 20.Tzeng HM, Yin CY. The extrinsic risk factors for inpatient falls in hospital patient rooms. J Nurs Care Qual. 2008;23(3):233–241. doi: 10.1097/01.NCQ.0000324588.91837.84. [DOI] [PubMed] [Google Scholar]
- 21.Chang CM, Kao CH, Sha WS, Wu WH, Chen JC. Multilevel control chart and fuzzy set theory to monitor inpatient falls. J Bus Res. 2016;69(6):2284–2288. doi: 10.1016/j.jbusres.2015.12.043. [DOI] [Google Scholar]
- 22.Kang H, Zhou S, Yao B, Gong Y. A prototype of knowledge-based patient safety event reporting and learning system. BMC Med Inform Decis Mak. 2018;18(Suppl 5):110. doi: 10.1186/s12911-018-0688-5. [DOI] [PMC free article] [PubMed] [Google Scholar]
- 23.Scrucca L. Qcc: an R package for quality control charting and statistical process control. R News. 2004;4(1):11–17. [Google Scholar]
- 24.Dong Y, Hedayat AS, Sinha BK. Surveillance strategies for detecting Changepoint in incidence rate based on exponentially weighted moving average methods. J Am Stat Assoc. 2008;103(482):843–853. doi: 10.1198/016214508000000166. [DOI] [Google Scholar]
- 25.Ryan AG, Woodall WH. Control charts for Poisson count data with varying sample sizes. J Qual Technol. 2010;42(3):260–274. doi: 10.1080/00224065.2010.11917823. [DOI] [Google Scholar]
- 26.Zhou Q, Zou C, Wang Z, Jiang W. Likelihood-based EWMA charts for monitoring Poisson count data with time-varying sample sizes. J Am Stat Assoc. 2012;107(499):1049–1062. doi: 10.1080/01621459.2012.682811. [DOI] [Google Scholar]
- 27.Scagliarini M, Boccaforno N, Vandi M (2019) Control charts for monitoring hospital adverse events: a comparative study. In: Bischoff J, Backhausz Á, Berni R, Kuhnt S, Marco-Almagro L, Pievatolo A, Seabra dos Reis MP, Caner Testik M (eds) ENBIS 2019, Programme and abstracts of the 19th annual ENBIS conference, Budapest Hungary, 2–4 September 2019. CIP, Mathematical Institute of Eötvös Loránd University, Budapest, pp 60–61


