Abstract
Objective
To identify and characterize myeloid cell populations within the CSF of patients with MS and anti-myelin oligodendrocyte glycoprotein (MOG) disorder by high-resolution single-cell gene expression analysis.
Methods
Single-cell RNA sequencing (scRNA-seq) was used to profile individual cells of CSF and blood from 2 subjects with relapsing-remitting MS (RRMS) and one with anti-MOG disorder. Publicly available scRNA-seq data from the blood and CSF of 2 subjects with HIV were also analyzed. An informatics pipeline was used to cluster cell populations by transcriptomic profiling. Based on gene expression by CSF myeloid cells, a flow cytometry panel was devised to examine myeloid cell populations from the CSF of 11 additional subjects, including individuals with RRMS, anti-MOG disorder, and control subjects without inflammatory demyelination.
Results
Common myeloid populations were identified within the CSF of subjects with RRMS, anti-MOG disorder, and HIV. These included monocytes, conventional and plasmacytoid dendritic cells, and cells with a transcriptomic signature matching microglia. Microglia could be discriminated from other myeloid cell populations in the CSF by flow cytometry.
Conclusions
High-resolution single-cell gene expression analysis clearly distinguishes distinct myeloid cell types present within the CSF of subjects with neuroinflammation. A population of microglia exists within the human CSF, which is detectable by surface protein expression. The function of these cells during immunity and disease requires further investigation.
CSF evaluation is used to aid in the diagnosis and differentiation of CNS disorders. In inflammatory CNS diseases, the CSF is typically used to assess the immunopathophysiologic processes because biopsy of CNS tissue carries significant potential for harm.1 However, relatively few cells are obtained from CSF, usually on the order of 1–5 cells/μL. Recent refinements in next-generation sequencing have enabled the efficient determination of individual cell gene expression within biospecimens with relatively sparse cell populations, such as the CSF. Patterns identified using single-cell RNA sequencing (scRNA-seq) can uncover distinct cell types present at low levels within cellular communities and tissues.2 scRNA-seq was used to assess inflammatory changes within the CSF of subjects with HIV infection, identifying the presence of a “microglial-like” cell,3 and more recently to explore the clonal expansion of CSF lymphocytes in MS-discordant monozygotic twin pairs.4 scRNA-seq has also been used to address the issue of microglial heterogeneity within the human brain.5–7 In addition, using the primary animal model of MS, experimental autoimmune encephalomyelitis, scRNA-seq has been used to identify several populations of myeloid cells, both endogenous to the CNS and from peripheral blood.8 New methods for characterization of myeloid populations within the CNS during disease offer the opportunity to dissect the origin, function, and pathogenicity of each cell type with much greater resolution than previous methods.
MS is the most common inflammatory demyelinating disease of the CNS, affecting over 600,000 people in the United States.9 Anti-myelin oligodendrocyte glycoprotein (MOG) disorder is a newly described CNS demyelinating disease that shares clinical and pathologic characteristics with MS.10,11 MS and anti-MOG disorder appear to be distinct from one another and from aquaporin 4 antibody-positive neuromyelitis optica (NMO).10,12 We have applied scRNA-seq to examine the CSF and mononuclear cells of the peripheral blood of subjects with relapsing-remitting MS (RRMS) and anti-MOG disorder. Individual spinal fluid samples from 2 subjects with RRMS and 1 subject with anti-MOG disorder were analyzed by using scRNA-seq. In all 3 subjects, we uncovered CSF populations of immune cells including microglial cells, monocytes, and dendritic cells (DCs) based on gene expression. Using CSF and blood from 7 additional subjects with RRMS, another subject with anti-MOG disorder, and 3 control subjects, we designed and tested a flow cytometry strategy that confirmed the presence in CSF of these cell types.
Methods
Subjects
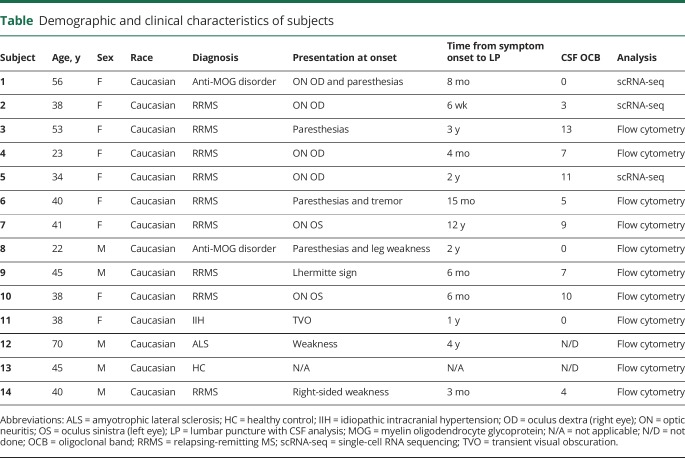
Eleven subjects with inflammatory demyelinating disease (9 with RRMS and 2 with anti-MOG disorder) and 3 control subjects (1 with amyotrophic lateral sclerosis [ALS], 1 with idiopathic intracranial hypertension [IIH], and 1 healthy control [HC]) were recruited for a study to assess the characteristics of CSF and blood cells (table). The institutional review board of Washington University in St. Louis approved study protocols, and each subject provided informed consent. Nine subjects had RRMS based on the current diagnostic criteria.13 Two additional subjects were diagnosed with anti-MOG disorder: one presented with optic neuritis and the other with partial transverse myelitis. Anti-MOG disorder was diagnosed based on the 6-month sustained positive cell-based assays for MOG IgG1 antibody, absence of antibodies to aquaporin 4 (NMO-IgG), and absence of CSF-restricted oligoclonal bands.11
Table.
Demographic and clinical characteristics of subjects
To prevent alterations because of disease-modifying therapies, we selected subjects either on no therapy or remote from therapy. Seven subjects with RRMS were naive to therapy, including corticosteroids. Of the remaining 2 subjects with RRMS, 1 (subject 7) had received fingolimod, stopping 9 months before CSF testing, and the other (subject 10) was treated with glatiramer acetate for 5 months and had received IV steroids 2 months before CSF analysis. The subject with transverse myelitis due to anti-MOG disorder (subject 8) had received mycophenolate and then azathioprine but had discontinued these 6 months before CSF analysis and had received a course of corticosteroids 4 months before CSF examination. Subject 1 with anti-MOG disorder had received no treatment before the examination of CSF. Control specimens were obtained from a subject with IIH who presented with visual disturbances, a patient diagnosed with ALS, and a HC. Each contributed blood and CSF cells for scRNA-seq or flow cytometry studies (table and figure e-1, links.lww.com/NXI/A244).
Standard protocol approvals, registrations, and patient consents
Informed consent was obtained from all participants and approved by the Human Research Protection Office of Washington University in St. Louis.
CSF and peripheral blood mononuclear cell preparation
CSF was collected in a 50-mL conical tube on ice and centrifuged for 10 minutes at 400g. Supernatant was removed without disrupting the cell pellet, which was resuspended in 400 μL of PBS containing 0.04% bovine serum albumin. The CSF cells were counted with a hemocytometer and resuspended in a volume of PBS/0.04% bovine serum albumin to achieve a cell concentration of 700–1,000 cells/μL for scRNA-seq. Peripheral blood mononuclear cells (PBMCs) were isolated by Ficoll density centrifugation and then processed alongside CSF cells for scRNA-seq or flow cytometry.
Flow cytometry
Flow cytometry analysis was performed using antihuman antibodies to BDCA-2 (clone 201A; BioLegend, San Diego, CA), CD33 (clone P67.6; BioLegend), CD14 (clone 61D3; eBioscience, San Diego, CA), Lyve-1 (clone 537028; R&D Systems, Minneapolis, MN), CD3 (clone SK7; BioLegend), CD19 (clone HIB19; eBioscience), CD16 (clone B73.1; BioLegend), CD1c (clone L161; BioLegend), Lox-1 (clone 15C4; BioLegend), and human leukocyte antigen DR (HLA-DR) (clone Immu-357; Beckman Coulter, Brea, CA). One million PBMCs and between 2 × 10⁴ and 40 × 104 CSF cells were incubated with human-Fc block (BD Biosciences, San Jose, CA) for 10 minutes at RT and then with antibodies for 20 minutes at 4°C. Subsequently, the samples were washed with PBS + 2% FBS (flow buffer) for 5′, spun at 500g, and resuspended in 200 μL of flow buffer. The samples were run on a Gallios flow cytometer (Beckman Coulter Life Sciences) on the same day of the collection. The cells were analyzed using FlowJo software (Tree Star, Ashland, OR).
RNA sequencing and analysis
On the day of cell collection using fresh cells, droplet-based 3′ (for anti-MOG disorder subject 1) and 5′ (for subjects 2 and 5 with RRMS) libraries were prepared using Chromium Single Cell 3′ v2 or 5′ Reagent Kits according to the manufacturer's protocol from 10× Genomics. The generated scRNA libraries were sequenced using an Illumina HiSeq4000 or Novaseq sequencer. Cell Ranger Single-Cell Software 2.2 was used to perform sample demultiplexing, barcode processing, and single-cell 3′ and 5′ counting. Afterward, fastq files for each sample were processed with a cellranger count, which was used to align the samples to GRCh38 genome, filter, and quantify reads. For each sample, the recovered-cells parameter was specified as 10,000 cells that we expected to recover for each individual library.
To reanalyze scRNA-seq data performed with SeqWell publicly available from GSE117397, we downloaded count tables from 2 subjects with HIV for whom both CSF and blood samples were available from GEO DataSets (GSM3293822, HIV1_Bld; GSM3293823, HIV1_CSF; GSM3293824, HIV2_Bld; GSM3293825, HIV2_CSF). To combine data from all samples together, we used the canonical correlation analysis (CCA) algorithm from Seurat 3.14 Before applying CCA, we removed cells from the 3′ and 5′ data sets that contain more than 10% of mitochondrial RNA. Cells from SeqWell data sets with less than 20% of RNA from mitochondrial genes and more than 500 but less than 2,500 expressed genes were considered viable cells.
After CCA data were scaled, principal component analysis (PCA) was performed with RunPCA function. A Uniform Manifold Approximation and Projection (UMAP) dimensionality reduction was performed on the scaled matrix using the first 20 PCA components to obtain a 2-dimensional representation of the cell states.15 For clustering, we used FindNeighbours and FindClusters functions on 20 PCA components with a resolution of 0.5. FindAllMarkers function was used to characterize clusters. For heatmap representation, the mean expression of markers inside each cluster was used. Heatmaps were built with Phantasus software (artyomovlab.wustl.edu/phantasus/).
Data availability
Anonymized scRNA-seq is available to qualified investigators at synapse.org (syn21904732).
Results
Discrete immune cell populations can be identified in the CSF and blood of subjects with neuroinflammatory diseases using scRNA-seq
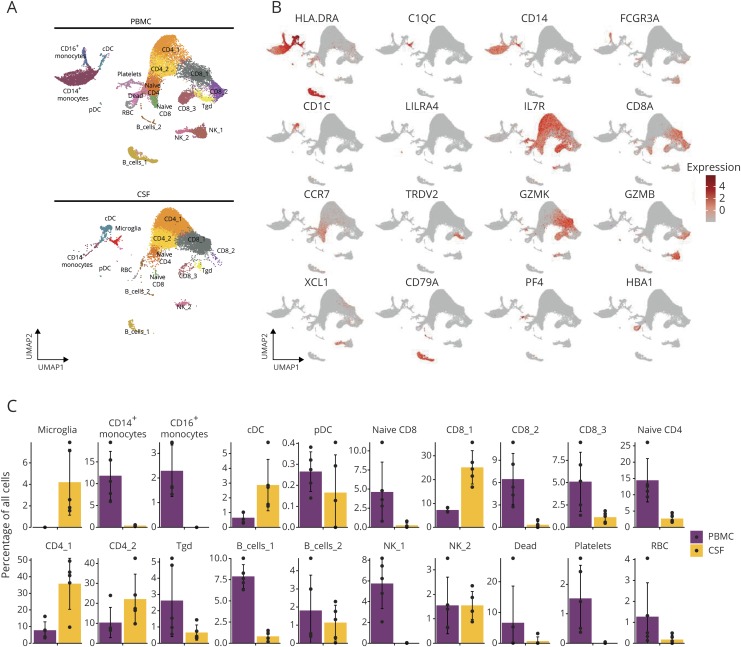
To explore the extent, diversity, and phenotype of leukocyte infiltration into the CNS compartment during CNS demyelination, we performed scRNA-seq of CSF cells and PBMCs from 1 subject with anti-MOG disorder (subject 1) and 2 subjects with RRMS (subjects 2 and 5). During the course of our data collection, scRNA-seq of immune cells isolated from the blood and CSF of subjects with HIV was reported.3 Given the small number of data sets on CSF, a difficulty to access tissue, we sought to optimally identify populations of immune cells reflective of neuroinflammation using a recently described computational method, CCA, that allows integration across different scRNA-seq technologies.14 Applying this method, data from a total of 23,363 PBMCs and 14,179 CSF cells were combined and visualized using the UMAP technique15 and unsupervised clustering.16,17
Twenty clusters representing distinct cell populations were identified (figure 1A). We used the characteristic marker gene expression to assign cellular identities to each cluster (figure 1B). Several distinct lymphoid cell clusters, including CD8+ T cells, CD4+ T cells, γδ T cells, NK cells, and B cells, could be discriminated in both PBMCs and CSF. Myeloid populations were also identified, including microglia, CD14+ and CD16+ monocytes, and 2 distinct groups of DCs—plasmacytoid (pDCs) and conventional (cDCs). Examining each subject individually, there were no meaningful disparities in cell clusters between the subjects (figure e-2, links.lww.com/NXI/A244).
Figure 1. scRNA-seq characterization of leukocytes from MS, anti-MOG disorder, and HIV.
(A) UMAP of immune cell clusters from the blood (top) and CSF (bottom) of all subjects merged. (B) Characteristic marker gene expression assigned to each cluster displayed by UMAP. (C) Proportional abundance of 20 cell clusters within the blood (purple) and CSF (yellow). Y axis represents the percentage of all cells. cDC = conventional DC; PBMC = peripheral blood mononuclear cell; pDC = plasmacytoid DC; RBC = red blood cell; Tgd = γδ T cells; UMAP = Uniform Manifold Approximation and Projection.
We also compared the proportional abundance of specific cell clusters within either the CSF or blood (figure 1C). We identified a cluster of cells that exhibited features of cell stress, including expression of the mitochondrial genes MTRNR2L8 and MTRNRL12, which are indicative of low quality or dying cells (labeled “Dead” in figure 1).7 These dead cells, as well as red blood cells and platelets, were found almost solely within the blood. Similarly, we observed one population of NK cells (NK_1) that was exclusively present in the blood. This population shows a gene expression profile matching the recently defined blood NK1 cells, which align with previously described CD56dim NK cells (figure e-3, links.lww.com/NXI/A244).18
Among the T and B cell clusters, several exist in higher abundance in the blood (naive CD8, CD8_2, CD8_3, naive CD4, γδ T cells, and B_cells_1). CD14+ and CD16+ monocytes were more prevalent in blood than CSF, with the latter being entirely absent from the CSF. cDCs were a smaller fraction among PBMC relative to CSF cells, whereas pDCs were found in both compartments in similar proportions. Microglia were exclusively found in the CSF. Given the complexity of cells with myeloid characteristics in neuroinflammatory diseases and the historic difficulty of studying these cells in CSF by conventional methods because of limited cell numbers, we dedicated subsequent analyses of our data to CSF myeloid cell populations.
CSF microglia and other myeloid cell types in neuroinflammation
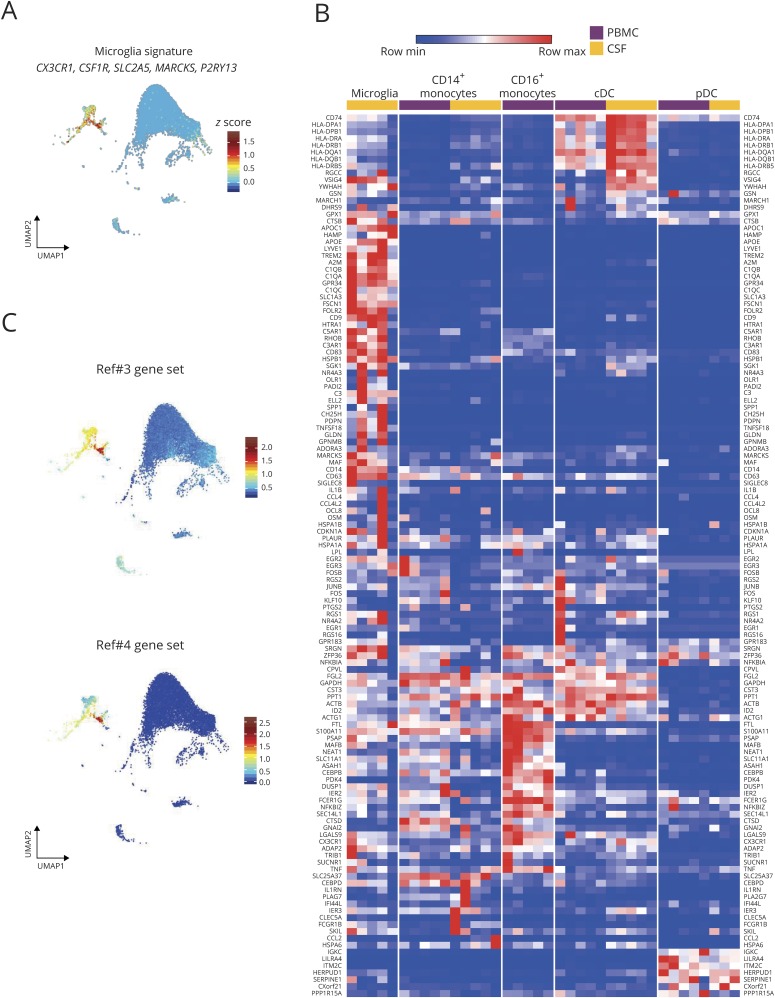
Analyzing the genes expressed by the cluster of CSF cells that we term microglia revealed high expression of genes from the microglial homeostatic gene signature, including CX3CR1, CSF1R, SLC2A5, MARCKS, and P2RY13 (figure 2A).7,19,20 Recent scRNA-seq analyses of human brain microglia have defined heterogeneity among microglia.6,7 Sankowski et al.7 defined 8 clusters of human brain microglia (termed C1–C3, C5–C9) with differential gene expression among these clusters. Expression of these microglia cluster-specific genes across the myeloid cell populations from our scRNA-seq composite data set was next examined. Many of these genes were found to be strikingly microglia-specific, including APOC1, APOE, LYVE1, TREM2, C1QB, GPR34, OLR1, and C3 (figure 2B). Sankowski et al. also created a classifier tool to discriminate microglial clusters, which they successfully applied to publicly available scRNA-seq data sets of brain microglia. When we applied this classifier to the 394 CSF cells in our data set that were grouped as microglia, 88% of these were classified as belonging to C6, with 10% belonging to C7. C6 and C7 were characterized by Sankowski et al. as having high expression of genes in the Gene Ontology pathway 0048002 (“antigen processing and presentation of peptide antigen”). In sum, these data strongly support our conclusion that the myeloid cell populations we find exclusively in the CSF are microglial cells and suggest that they may be involved in antigen presentation.
Figure 2. Relative expression of myeloid population-defining genes in neuroinflammation.
(A) Expression of canonical microglial genes within the UMAP of CSF immune cell clusters. (B) Heatmap representation of gene expression in blood (purple) and CSF (yellow) myeloid populations. Gene list derived from Sankowski et al.7 (C) Top genes reported by Farhadian et al.3 as specific for “microglia-like cells” (top) and Beltran et al.4 as specific for “monocytes” (bottom) displayed in the UMAP of immune cell clusters in the CSF of all subjects. cDC = conventional DC; PBMC = peripheral blood mononuclear cell; pDC = plasmacytoid DC; UMAP = Uniform Manifold Approximation and Projection.
Two previous studies using scRNA-seq to classify CSF immune cells, each identified a discrete cell population that was categorized as either “microglia-like” cells3 or “monocytes.”4 Each study produced a list of genes that discriminated these differently named clusters from other CSF immune cells. When we visualized these gene sets among the clusters of CSF cells in our composite data set, which includes a reanalysis of the cells from 2 subjects included in the work of Farhadian et al., we found markedly enriched expression in the cluster that we term microglia (figure 2C). With this, we mean that all 3 studies are in fact referring to the same subset of CSF cells, and given their expression of core microglial genes, we prefer to classify these as microglia.
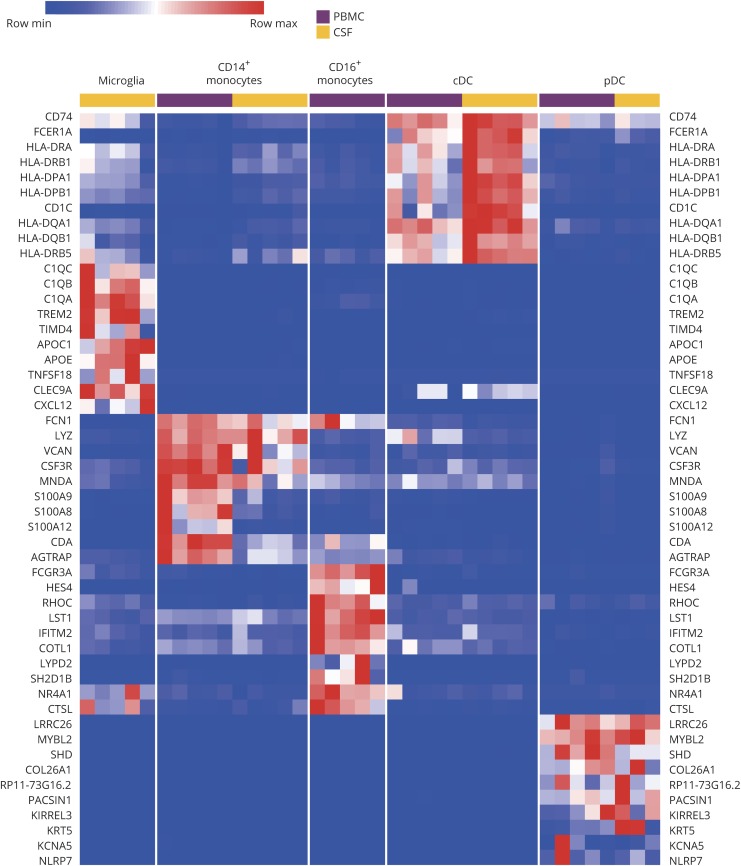
Other myeloid populations could also be distinctly classified by their transcriptional profiles. Figure 3 is a heatmap of the expression of 10 genes per cell type, which discriminated each myeloid population. Some of these genes were known to discriminate myeloid cell types, yet others are new and could be revealing different classifiers. Notably, expression of major histocompatibility complex class II genes was higher in CSF cDCs than blood cDCs, possibly indicating a compartmental influence on the antigen presentation function of these cells. These transcriptomic data establish the presence of one monocyte subset, 2 types of DCs, and microglia within the CSF during neuroinflammation.
Figure 3. Discrimination of myeloid cell populations in neuroinflammation by gene expression.
Heatmap of 10 genes that discriminate myeloid cell types within the blood (purple) and CSF (yellow). Columns represent individual subjects. cDC = conventional DC; PBMC = peripheral blood mononuclear cell; pDC = plasmacytoid DC.
Flow cytometric characterization of CSF cells validates scRNA-seq identification of microglia and myeloid cell types
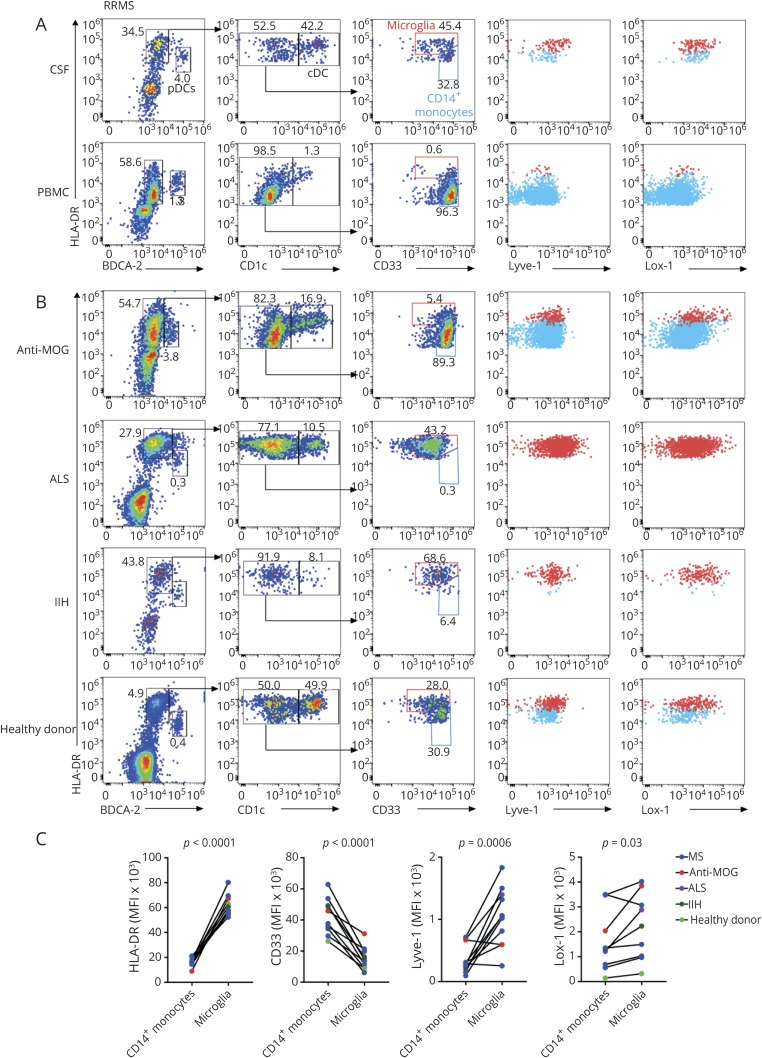
We sought to create a flow cytometric-based strategy for the quantification of various CSF myeloid cell types, including microglia, using commercially available antibodies specific for surface markers identified by our gene expression studies (figure e-4, links.lww.com/NXI/A244) and the literature.21 PBMCs and CSF cells were stained for CD3 and CD19 to gate out T and B cells. Within the remaining cells in both CSF and blood, pDCs were identified as being HLA-DR+ and BDCA-2+ (encoded by CLEC4C), whereas cDCs were identified as HLA-DR+BDCA-2−CD1c+ cells (figure 4A). In the CSF, non-DCs could be seen to resolve as 2 distinct cell types based on the HLA-DR and CD33 levels. PBMCs only contained HLA-DRmidCD33high cells, which were defined as monocytes. The CSF additionally contained a population of HLA-DRhighCD33mid cells, which we interpreted as microglia, further confirmed by their expression of Lyve-1 and Lox-1 (encoded by OLR1). CSF from subjects with other neurologic conditions (anti-MOG disorder, ALS, and IIH) and a HC subject also contained similarly staining populations of pDCs, cDCs, monocytes, and microglia (figure 4B). The staining intensity of HLA-DR, CD33, Lyve-1, and Lox-1 discriminated CD14+ monocytes from microglia in the CSF of all subjects (figure 4C). Overall, flow cytometric characterization of myeloid cells demonstrated the protein expression of various microglial genes identified by transcriptomic profiling, confirmed the presence of microglia within the CSF, and offered a ready means for identifying this cell type.
Figure 4. Flow cytometric identification of microglia and myeloid cells within the blood and CSF.
(A and B) Plots were obtained by gating on CD3−CD19− singlets. HLA-DR+BDCA-2hi cells represent pDCs. cDCs are represented as HLA-DR+BDCA-2−CD1chi. Red gates in the third column represent microglia, whereas blue gates represent monocytes. The fourth column shows HLA-DR and Lyve-1 staining of microglia (red) and monocytes (blue). The fifth column shows HLA-DR and Lox-1 staining of microglia (red) and monocytes (blue). (A) Flow cytometry on CSF and blood samples from a subject with RRMS. (B) Flow cytometry on CSF from subjects with anti-MOG disorder (anti-MOG), ALS, IIH, and a healthy control. (C) Mean fluorescence intensity (MFI) of HLA-DR, CD33, Lyve-1, and Lox-1 of CSF monocytes and microglia from subjects. Each pair of connected circles represents one CSF sample. Statistical significance was determined using a paired Student t test. ALS = amyotrophic lateral sclerosis; cDC = conventional DC; IIH = idiopathic intracranial hypertension; MOG = myelin oligodendrocyte glycoprotein; PBMC = peripheral blood mononuclear cell; pDC = plasmacytoid DC.
Discussion
We performed scRNA-seq to identify the cell types present within the CSF of 2 subjects with RRMS and 1 person with anti-MOG disorder, with comparative analysis to paired PBMCs. These and subsequent subjects were not taking disease-modifying therapies or corticosteroids. Subsequently, we integrated publicly available data on 2 subjects with HIV on whom scRNA-seq was performed on paired PBMCs and CSF immune cells. We then focused on CSF myeloid cell types because less work has been carried out to characterize these populations in part because of their lower abundance. We found that (1) scRNA-seq identifies a diverse set of myeloid cell types within the CSF, including microglia; (2) flow cytometry is a feasible technique for the discrimination of these populations of CSF myeloid cells; and (3) scRNA-seq data can be integrated across technologies to allow for optimal discrimination of cell populations.
Because the data sets we analyzed were derived from different technologies, we used a recently described technique, CCA, to integrate scRNA-seq data sets. This allowed for an increased number of cells used in the analysis, facilitating the optimal discrimination of cell clusters. All CSF samples in the combined analysis contained cells within each cluster, suggesting that among the diseases examined herein, a common set of leukocytes inhabit this critical immune space within the CNS. One limitation of CCA involves the exclusion of some genes from downstream analysis. Nevertheless, in our case, 2,000 genes were still available for use in our assessment of PBMCs and CSF cells from 5 individuals. Our results demonstrate the feasibility of using CCA to integrate the growing number of scRNA-seq data sets that will continue to be made publicly available using different platforms.
Our scRNA-seq analysis identified microglia in human CSF with a gene expression pattern overwhelmingly similar to that described for parenchymal microglia.7,19,22,23 We used genes from a recent study describing the transcriptional profile of human tissue-resident microglia as a comparison for the CSF microglia identified in our subjects.7 The top genes identified in tissue-resident microglia were also highly abundant in our CSF microglia populations (figure 2). Owing to their low abundance in the CSF, this subset of cells has apparently been overlooked in most previous CSF studies using less powerful techniques. One previous report using a different scRNA-seq platform, SeqWell, also identified this population of cells in human CSF and termed them “microglia-like.”3 Our reanalysis of the published data from the latter study confirmed the presence of cells expressing hallmark microglial genes and lacking expression of genes that identify other myeloid cell types. A more recently published study involving patients with MS also identified several distinct myeloid cell types within the CSF.24 Based on the analysis of our data, we believe this group used the term “Mono2” in reference to a population encompassing CSF microglia. Indeed, they describe a subset of monocytes that expressed microglial-associated genes, including TREM2, TMEM119, and GPR34, and concluded that these cells share features with both border-associated macrophages (BAMs), which have been ascribed immunoregulatory functions within the CNS,22 and homeostatic microglia. In the future, it will be important to devise nomenclature which prudently encompasses the appropriate degree of segregation among various myeloid cell populations. In particular, BAMs share substantial transcriptional overlap with microglia,25 prompting the consideration of how CSF microglia differ in ontogeny and function from BAMs that will need to be resolved with further investigation into the ontogeny and function of each cell type.
Microglia are long-lived, self-replicating, yolk sac-derived immune cells of the CNS parenchyma involved in CNS development and neuropathology.26,27 Disruption of the blood-brain barrier can allow the replacement of microglia by blood-derived progenitors, with the latter eventually taking on the near-complete gene expression profile of fetal-derived microglia.28 Our studies of CSF microglia cannot determine their ontogeny or how they gained access to the CSF. Microglia from the CNS parenchyma might traverse the pia mater or choroid plexus or traffic into CSF through perivascular spaces or via lymphatic drainage.29,30 Migration of parenchymal microglia or blood-derived progenitor cells that become microglia may occur in response to chemokines, which is supported by our finding of chemokine receptors on these cells, including CCR1, CCR5, CXCR4, and CX3CR1. It is also possible that a unique microglial subset exists that develops and permanently resides in the CSF. CSF microglia also may not be singular in origin.31
The source of CSF microglia may have functionally relevant implications. Microglia are known to be critical modulators of CNS developmental processes, such as synaptic pruning.32,33 Recent data reveal the subsets of microglia with distinct functions. In the scRNA-seq analysis of rodent CNS, BAMs and other myeloid populations have been identified within brain, choroid plexus, and leptomeningeal tissue at steady-state and in the experimental autoimmune encephalomyelitis model of MS.8 Studies using animal models for Alzheimer disease (AD) have identified a phagocytic subset of microglia termed “disease-associated microglia” (DAM).23 DAM appear to reduce disease severity in the model and express genes associated with AD such as Apoe and Trem2. In addition, homeostatic microglia and a subpopulation transitioning between homeostatic microglia and DAM were identified in mouse AD models. Experiments such as these in mice highlight not only the high resolution of CNS myeloid cell subtypes that can be obtained using scRNA-seq but also the apparent dynamic nature of myeloid populations.
Using a flow cytometric panel with commercially available reagents, our data demonstrated the protein expression of some of the microglial genes identified by RNA and indicate that microglia range from 0.2% to 5.5% of CSF mononuclear cells. Overall, the presence of microglia within the CSF was not disease-dependent or disease-activity dependent because they were detected in the CSF of a healthy subject as well as in subjects with noninflammatory neurologic diseases (IIH, ALS) and in 2 distinct neuroinflammatory diseases (MS and anti-MOG disorder). Comparison of CSF microglial frequencies between diseases could not be performed because of low cell numbers. It is possible that subtle differences in the numbers or subtypes of CSF microglia could reflect the state of disease in MS or other diseases. Neither of the subjects with RRMS nor the subject with anti-MOG disorder analyzed for our study was undergoing acute relapse, which may have influenced the presence or number of CSF microglia. Our data demonstrate the feasibility of using standard flow cytometry in the future to address the association of CSF myeloid populations, including CSF microglia, with the clinical state of inflammatory demyelination within the CNS.
cDCs and pDCs were each identified in CSF by both scRNA-seq and flow cytometry. Previous studies have identified these cell types in CSF using lower resolution flow cytometry with fewer markers for discrimination of these myeloid populations and have reported an increased number of pDCs in the CSF during MS relapses.21,34 Recent scRNA-seq analysis examined DCs and monocytes in human blood, identifying 6 discrete subsets of blood DCs, including 4 subsets of cDCs, a subset of classical pDCs, and a new subset termed AXL+SIGLEC6+ (AS) DCs.35 ScRNA-seq analysis of the samples in our study did not result in discrete clusters of DC subsets in the blood or CSF, perhaps owing to their low abundance. A dedicated scRNA-seq study focused on sorted CSF DCs would likely reveal additional heterogeneity in these populations. More importantly, our analyses of differentially expressed genes between cDCs in the CSF compared with cDCs in the blood reveal that these populations, although still fundamentally cDCs, may alter some of their gene expression based on their microenvironment. Interestingly, those genes that most discriminated CSF cDCs were more highly expressed by CSF microglia, whereas those that discriminated blood cDCs were more highly expressed by blood monocytes. These results suggest that environmental signals may result in shared tissue-specific gene expression patterns across myeloid cell populations.
Using gene expression-based methods to categorize cell types, we identified microglia, monocytes, cDCs, and pDCs within the CSF. The recognition that microglia are present in CSF may have important clinical implications. Abnormally functioning microglia are believed to contribute to the pathogenesis and/or regulation of several diseases, including AD and MS. Our results indicate that it may be possible to analyze microglial abnormalities directly from the CSF without requiring biopsies.
Acknowledgment
The authors thank Drs. Salim Chahin, Cynthia Montana, and Timothy Miller for referring subjects to these studies and for helpful discussions.
Glossary
- AD
Alzheimer disease
- ALS
amyotrophic lateral sclerosis
- BAM
border-associated macrophage
- CCA
canonical correlation analysis
- cDC
conventional DC
- DAM
disease-associated microglia
- DC
dendritic cell
- HC
healthy control
- HLA-DR
human leukocyte antigen DR
- IIH
idiopathic intracranial hypertension
- MOG
myelin oligodendrocyte glycoprotein
- NMO
neuromyelitis optica
- PBMC
peripheral blood mononuclear cell
- PCA
principal component analysis
- pDC
plasmacytoid DC
- RRMS
relapsing-remitting MS
- scRNA-seq
single-cell RNA sequencing
- UMAP
Uniform Manifold Approximation and Projection
Appendix. Authors
Study funding
G.F.W. was supported by the NINDS (R01NS106289) and the National Multiple Sclerosis Society (RG-1802-30253). A.H.C. was supported in part by The Manny and Rosalyn Rosenthal and Dr. John L. Trotter, Chair in Neuroimmunology of the Foundation for Barnes-Jewish Hospital. B.T.E. was supported by the Washington University Institute of Clinical and Translational Science Clinical and Translational Research Funding Program supported by the Foundation for Barnes-Jewish Hospital. E.E. was supported by Shawn Hu and Angela Zeng graduate fellowship. C.C. was supported by the National MS Society Career Transition Fellowship (TA-1805-31003). Research reported in this publication was supported by generous donations from the Lisa Novelly Fund of the John Trotter MS Center and the Frala Osherow Fund for MS Research. Research was also supported by the Washington University Institute of Clinical and Translational Sciences grant UL1TR002345 from the National Center for Advancing Translational Sciences (NCATS) of the NIH. The content is solely the responsibility of the authors and does not necessarily represent the official view of the NIH.
Disclosure
E. Esaulova, C. Cantoni, I. Shchukina, and K. Zaitsev report no disclosures. R.C. Bucelli received compensation from MT Pharma for advisory board and private funding for Parsonage-Turner syndrome for research; equity in NeuroQuestions, LLC. G.F. Wu received honoraria for consulting for Novartis and Genentech; received research funding from Biogen, EMD Serono, and Roche. M.N. Artyomov reports no disclosures. A.H. Cross received honoraria for consulting for Biogen, Celgene, EMD Serono, Genentech, Novartis, Roche, and TG Therapeutics; received compensation for speaking for Genentech. B.T. Edelson reports no disclosures. Go to Neurology.org/NN for full disclosures.
References
- 1.Alvermann S, Hennig C, Stüve O, Wiendl H, Stangel M. Immunophenotyping of cerebrospinal fluid cells in multiple sclerosis: in search of biomarkers. JAMA Neurol 2014;71:905–912. 10.1001/jamaneurol.2014.395. [DOI] [PubMed] [Google Scholar]
- 2.Papalexi E, Satija R. Single-cell RNA sequencing to explore immune cell heterogeneity. Nat Rev Immunol 2018;18:35–45. 10.1038/nri.2017.76. [DOI] [PubMed] [Google Scholar]
- 3.Farhadian SF, Mehta SS, Zografou C, et al. Single-cell RNA sequencing reveals microglia-like cells in cerebrospinal fluid during virologically suppressed HIV. JCI Insight 2018;3:121718 10.1172/jci.insight.121718. [DOI] [PMC free article] [PubMed] [Google Scholar]
- 4.Beltrán E, Gerdes LA, Hansen J, et al. Early adaptive immune activation detected in monozygotic twins with prodromal multiple sclerosis. J Clin Invest 2019;129:4758–4768. 10.1172/JCI128475. [DOI] [PMC free article] [PubMed] [Google Scholar]
- 5.Masuda T, Sankowski R, Staszewski O, et al. Spatial and temporal heterogeneity of mouse and human microglia at single-cell resolution. Nature 2019;566:388–392. 10.1038/s41586-019-0924-x. [DOI] [PubMed] [Google Scholar]
- 6.Geirsdottir L, David E, Keren-Shaul H, et al. Cross-species single-cell analysis reveals divergence of the primate microglia program. Cell 2019;179:1609–1622.e16. 10.1016/j.cell.2019.11.010. [DOI] [PubMed] [Google Scholar]
- 7.Sankowski R, Böttcher C, Masuda T, et al. Mapping microglia states in the human brain through the integration of high-dimensional techniques. Nat Neurosci 2019;22:2098–2110. 10.1038/s41593-019-0532-y. [DOI] [PubMed] [Google Scholar]
- 8.Jordão MJC, Sankowski R, Brendecke SM, et al. Neuroimmunology: single-cell profiling identifies myeloid cell subsets with distinct fates during neuroinflammation. Science 2019;363:eaat7554 10.1126/science.aat7554. [DOI] [PubMed] [Google Scholar]
- 9.Wallin MT, Culpepper WJ, Campbell JD, et al. The prevalence of MS in the United States: a population-based estimate using health claims data. Neurology 2019;92:e1029–e1040. 10.1212/WNL.0000000000007035. [DOI] [PMC free article] [PubMed] [Google Scholar]
- 10.Kitley J, Woodhall M, Waters P, et al. Myelin-oligodendrocyte glycoprotein antibodies in adults with a neuromyelitis optica phenotype. Neurology 2012;79:1273–1277. 10.1212/WNL.0b013e31826aac4e. [DOI] [PubMed] [Google Scholar]
- 11.Kim SM, Woodhall MR, Kim JS, et al. Antibodies to MOG in adults with inflammatory demyelinating disease of the CNS. Neurol Neuroimmunol Neuroinflamm 2015;2:e163 doi: 10.1212/NXI.0000000000000163. [DOI] [PMC free article] [PubMed] [Google Scholar]
- 12.Hyun JW, Huh SY, Shin HJ, et al. Evaluation of brain lesion distribution criteria at disease onset in differentiating MS from NMOSD and MOG-IgG-associated encephalomyelitis. Mult Scler J 2019;25:585–590. 10.1177/1352458518761186. [DOI] [PMC free article] [PubMed] [Google Scholar]
- 13.Thompson AJ, Banwell BL, Barkhof F, et al. Diagnosis of multiple sclerosis: 2017 revisions of the McDonald criteria. Lancet Neurol 2018;17:162–173. 10.1016/S1474-4422(17)30470-2. [DOI] [PubMed] [Google Scholar]
- 14.Butler A, Hoffman P, Smibert P, Papalexi E, Satija R. Integrating single-cell transcriptomic data across different conditions, technologies, and species. Nat Biotechnol 2018;36:411–420. 10.1038/nbt.4096. [DOI] [PMC free article] [PubMed] [Google Scholar]
- 15.Becht E, McInnes L, Healy J, et al. Dimensionality reduction for visualizing single-cell data using UMAP. Nat Biotechnol 2019;37:38–47. 10.1038/nbt.4314. [DOI] [PubMed] [Google Scholar]
- 16.Amir EAD, Davis KL, Tadmor MD, et al. ViSNE enables visualization of high dimensional single-cell data and reveals phenotypic heterogeneity of leukemia. Nat Biotechnol 2013;31:545–552. 10.1038/nbt.2594. [DOI] [PMC free article] [PubMed] [Google Scholar]
- 17.Van Der Maaten L, Hinton G. Visualizing data using t-SNE. J Mach Learn Res 2008;9:2579–2625. [Google Scholar]
- 18.Crinier A, Milpied P, Escalière B, et al. High-dimensional single-cell analysis identifies organ-specific signatures and conserved NK cell subsets in humans and mice. Immunity 2018;49:971–986.e5. 10.1016/j.immuni.2018.09.009. [DOI] [PMC free article] [PubMed] [Google Scholar]
- 19.Butovsky O, Jedrychowski MP, Moore CS, et al. Identification of a unique TGF-β-dependent molecular and functional signature in microglia. Nat Neurosci 2014;17:131–143. 10.1038/nn.3599. [DOI] [PMC free article] [PubMed] [Google Scholar]
- 20.Gautier EL, Shay T, Miller J, et al. Gene-expression profiles and transcriptional regulatory pathways that underlie the identity and diversity of mouse tissue macrophages. Nat Immunol 2012;13:1118 10.1038/ni.2419. [DOI] [PMC free article] [PubMed] [Google Scholar]
- 21.Pashenkov M, Huang YM, Kostulas V, Haglund M, Söderström M, Link H. Two subsets of dendritic cells are present in human cerebrospinal fluid. Brain 2001;124:480–492. 10.1093/brain/124.3.480. [DOI] [PubMed] [Google Scholar]
- 22.Mrdjen D, Pavlovic A, Hartmann FJ, et al. High-dimensional single-cell mapping of central nervous system immune cells reveals distinct myeloid subsets in health, aging, and disease. Immunity 2018;48:380–395.e6. 10.1016/j.immuni.2018.01.011. [DOI] [PubMed] [Google Scholar]
- 23.Keren-Shaul H, Spinrad A, Weiner A, et al. A unique microglia type associated with restricting development of Alzheimer's disease. Cell 2017;169:1276–1290.e17. 10.1016/j.cell.2017.05.018. [DOI] [PubMed] [Google Scholar]
- 24.Schafflick D, Xu CA, Hartlehnert M, et al. Integrated single cell analysis of blood and cerebrospinal fluid leukocytes in multiple sclerosis. Nat Commun. 2020;11:247. doi: 10.1038/s41467-019-14118-w. [DOI] [PMC free article] [PubMed] [Google Scholar]
- 25.Brioschi S, Zhou Y, Colnna M. Brain parenchymal and extraparenchymal macrophages in development, homeostasis, and disease. Review. J Immunol 2020;204:294–305. 10.4049/jimmunol.1900821. [DOI] [PMC free article] [PubMed] [Google Scholar]
- 26.Ginhoux F, Greter M, Leboeuf M, et al. Fate mapping analysis reveals that adult microglia derive from primitive macrophages. Science 2010;330:841–845. 10.1126/science.1194637. [DOI] [PMC free article] [PubMed] [Google Scholar]
- 27.Colonna M, Butovsky O. Microglia function in the central nervous system during health and neurodegeneration. Annu Rev Immunol 2017;35:441–468. 10.1146/annurev-immunol-051116-052358. [DOI] [PMC free article] [PubMed] [Google Scholar]
- 28.Shemer A, Grozovski J, Tay TL, et al. Engrafted parenchymal brain macrophages differ from microglia in transcriptome, chromatin landscape and response to challenge. Nat Commun 2018;9:5206 10.1038/s41467-018-07548-5. [DOI] [PMC free article] [PubMed] [Google Scholar]
- 29.Louveau A, Smirnov I, Keyes TJ, et al. Structural and functional features of central nervous system lymphatic vessels. Nature 2015;523:337–341. 10.1038/nature14432. [DOI] [PMC free article] [PubMed] [Google Scholar]
- 30.Ransohoff RM, Kivisäkk P, Kidd G. Three or more routes for leukocyte migration into the central nervous system. Nat Rev Immunol 2003;3:569–581. 10.1038/nri1130. [DOI] [PubMed] [Google Scholar]
- 31.Li Q, Cheng Z, Zhou L, et al. Developmental heterogeneity of microglia and brain myeloid cells revealed by deep single-cell RNA sequencing. Neuron 2019;101:207–223.e10. 10.1016/j.neuron.2018.12.006. [DOI] [PMC free article] [PubMed] [Google Scholar]
- 32.Schafer DP, Lehrman EK, Kautzman AG, et al. Microglia sculpt postnatal neural circuits in an activity and complement-dependent manner. Neuron 2012;74:691–705. 10.1016/j.neuron.2012.03.026. [DOI] [PMC free article] [PubMed] [Google Scholar]
- 33.Paolicelli RC, Bolasco G, Pagani F, et al. Synaptic pruning by microglia is necessary for normal brain development. Science 2011;333:1456–1458. 10.1126/science.1202529. [DOI] [PubMed] [Google Scholar]
- 34.Longhini ALF, von Glehn F, Brandão CO, et al. Plasmacytoid dendritic cells are increased in cerebrospinal fluid of untreated patients during multiple sclerosis relapse. J Neuroinflammation 2011;8:2 10.1186/1742-2094-8-2. [DOI] [PMC free article] [PubMed] [Google Scholar]
- 35.Villani A-C, Satija R, Reynolds G, et al. Single-cell RNA-seq reveals new types of human blood dendritic cells, monocytes, and progenitors. Science 2017;356:eaah4573 10.1126/science.aah4573. [DOI] [PMC free article] [PubMed] [Google Scholar]
Associated Data
This section collects any data citations, data availability statements, or supplementary materials included in this article.
Data Availability Statement
Anonymized scRNA-seq is available to qualified investigators at synapse.org (syn21904732).


