Abstract
Arthrofibrosis is an abnormal histopathologic response, debilitating for patients, and poses a substantial unsolved clinical challenge. This study aims to identify possible molecular pathways responsible for arthrofibrosis between fibrotic and non-fibrotic human knee tissue. The fibrotic group encompasses 4 patients undergoing a revision total knee arthroplasty (TKA) for arthrofibrosis (RTKA-A) while the non-fibrotic group includes 4 patients undergoing primary TKA for osteoarthritis (PTKA) and 4 patients undergoing revision TKA for non-arthrofibrotic and non-infectious etiologies (RTKA-NA). RNA-sequencing of posterior capsule revealed distinct clustering for each patient group by hierarchical clustering, principal component, and correlation analyses. Multiple differentially expressed genes (DEGs) were defined in RTKA-A versus PTKA patients (i.e., 2059 up-regulated and 1795 down-regulated genes) and RTKA-A versus RTKA-NA patients (i.e., 3255 up-regulated and 3683 down-regulated genes). Our findings define molecular and pathological markers of arthrofibrosis, as well as novel potential targets for risk profiling, early diagnosis and pharmacological treatment of patients.
Keywords: Acquired Idiopathic Stiffness, Joint Stiffness, Total Knee Arthroplasty, DEGs, RNA-seq
1. Introduction
Arthrofibrosis is characterized by the production of excessive extracellular matrix (ECM) proteins in a joint and may occur as a complication after routine total knee arthroplasty (TKA) [1–2]. Arthrofibrosis reduces the arc of motion, and can impact either extension (i.e. flexion contracture) or flexion (limited flexion) or a combination of both, which interferes with patients’ abilities to perform activities of daily living [3]. Hence, there is a compelling clinical need to prevent or mitigate the occurrence of arthrofibrosis.
Acquired idiopathic stiffness occurs in approximately 4% of patients after a primary TKA [4–8], with a subset of these patients developing an abnormal histopathologic response, and thus, true arthrofibrosis. We recently showed that female gender and body mass index (BMI) ≥30 kg/m2 are risk factors for acquired idiopathic stiffness after primary TKA [8]. As the volume of primary and revision TKAs is expected to rise in the coming years, the absolute number of individuals suffering from arthrofibrosis will become increasingly problematic [9, 10].
The current diagnosis of acquired idiopathic stiffness, and thus the subset of patients with true arthrofibrosis, is based on history and physical examination with a goniometer. While gentle physical therapy is typically the first line of treatment for arthrofibrosis, it is often not successful. More invasive approaches such as manipulation under anesthesia (MUA), arthroscopic or open lysis of adhesions, and revision TKA are used as a second line of treatment to improve range of motion, but these procedures come with their own complication profile and are costly [7,9,10]. As such, fundamental understandings of the cellular and molecular mechanisms that contribute to the disease process are essential to not only identify at risk patients, but also develop pharmacologic prevention and treatment modalities.
The clinical etiology of acquired idiopathic stiffness, and thus arthrofibrosis, is multifactorial [11]. Decreased preoperative knee range of motion, post-traumatic etiologies, history of prior surgery, and more complex surgery all, increase the risk of arthrofibrosis after TKA. Additionally, intraoperative factors contributing to arthrofibrosis include poor implant coronal, sagittal, and rotational alignment, suboptimal implant positioning, and/or inappropriate sizing, while postoperative factors such as hematoma, periprosthetic joint infection (PJI), lack of patient mobility and motivation, and poor pain control may also contribute [9,10,12–14]. Likewise, current smokers have been shown to have an increased risk of developing arthrofibrosis after TKA [15, 16]. There are limited data regarding diabetes status and arthrofibrosis, although a few studies have shown increased rates of arthrofibrosis in patients with diabetes mellitus [17,18].
While the exact pathophysiology of arthrofibrosis is not completely clear [6], the cellular response involves coordination of inflammatory cytokine release, endothelialmesenchymal transition, and growth factor signaling [19]. Disruption of these processes directly affects joint capsule homeostasis and organization, thus provoking uninhibited mesenchymal cell proliferation and formation of myofibroblasts [20–23].
ECM components, produced by myofibroblasts, aggressively accumulate in the intercellular space, stiffen, and generate excessive disorganized and noncompliant fibrotic tissues that prevent normal joint function through mechanical interference [20,22]. Interventions directed at potential biological targets that may be causative to the disease process have had limited success, and therefore it is valuable to explore the molecular mechanisms of arthrofibrosis to consider potential novel pharmacological therapies that might prevent, reduce or reverse arthrofibrosis [20,24].
Our group has successfully identified global transcriptome differences between normal and pathologic tissues using RNA-sequencing (RNA-seq) [19, 25–27]. Identifying differentially expressed genes (DEGs) in patients with arthrofibrosis after a primary or revision TKA can reveal specific genes and biological pathways implicated in arthrofibrosis development. This study evaluated DEGs in intraoperative specimens in three clinically distinct patient groups undergoing knee arthroplasty to understand the mechanisms mediating knee arthrofibrosis. Elucidation of these mechanisms will permit more accurate diagnosis and classification of arthrofibrosis progression, as well as assist in the development of targeted treatment approaches.
2. Materials & Methods
2.1. Patient enrollment & selection
All patients in this study were verbally-informed and signature consented according to our approved Institutional Review Board (IRB) protocol (Mayo Clinic Rochester IRB #09–000115) prior to enrollment. There were 3 distinct groups for RNA-seq. The experimental group included patients undergoing revision TKAs due to the development of arthrofibrosis (hereafter referred to RTKA-A). Patients considered eligible for this study met specific inclusion criteria. Only patients with arthrofibrosis without a history of PJI, malalignment, implant failure (e.g. aseptic loosening or fractured prosthesis), or history of other fibrotic diseases and/or neuromuscular disorders were included. We then 1:1 matched these patients based on age, sex, BMI, smoking status, and diabetes status to the two control groups. The first control group was assembled from patients undergoing primary TKAs (PTKAs) for osteoarthritis, and the second control group was from patients undergoing revision TKA for non-arthrofibrotic and non-infectious etiologies (RTKA-NA) (n = 4 for each group). These control groups represent patients who have orthopedic implants similar to the RTKA-A group, but no evidence of excessive development of capsular fibrotic tissue (Figure 1A). Each of these groups contains at least three nominal patients with an otherwise unremarkable clinical history based on their medical records. A small subset of patients had anecdotal clinical incidents that are unlikely to have a major impact on our conclusions. For example, two patients experienced, respectively, joint contracture or loosening after an initial periprosthetic fracture. One patient was unique in having experienced only a unilateral arthroplasty, while a fourth patient developed a joint contracture that most likely developed after an initial bacterial infection was treated. Relevant details on the medical history of our patients are provided in Supplemental Table 1.
Figure 1.
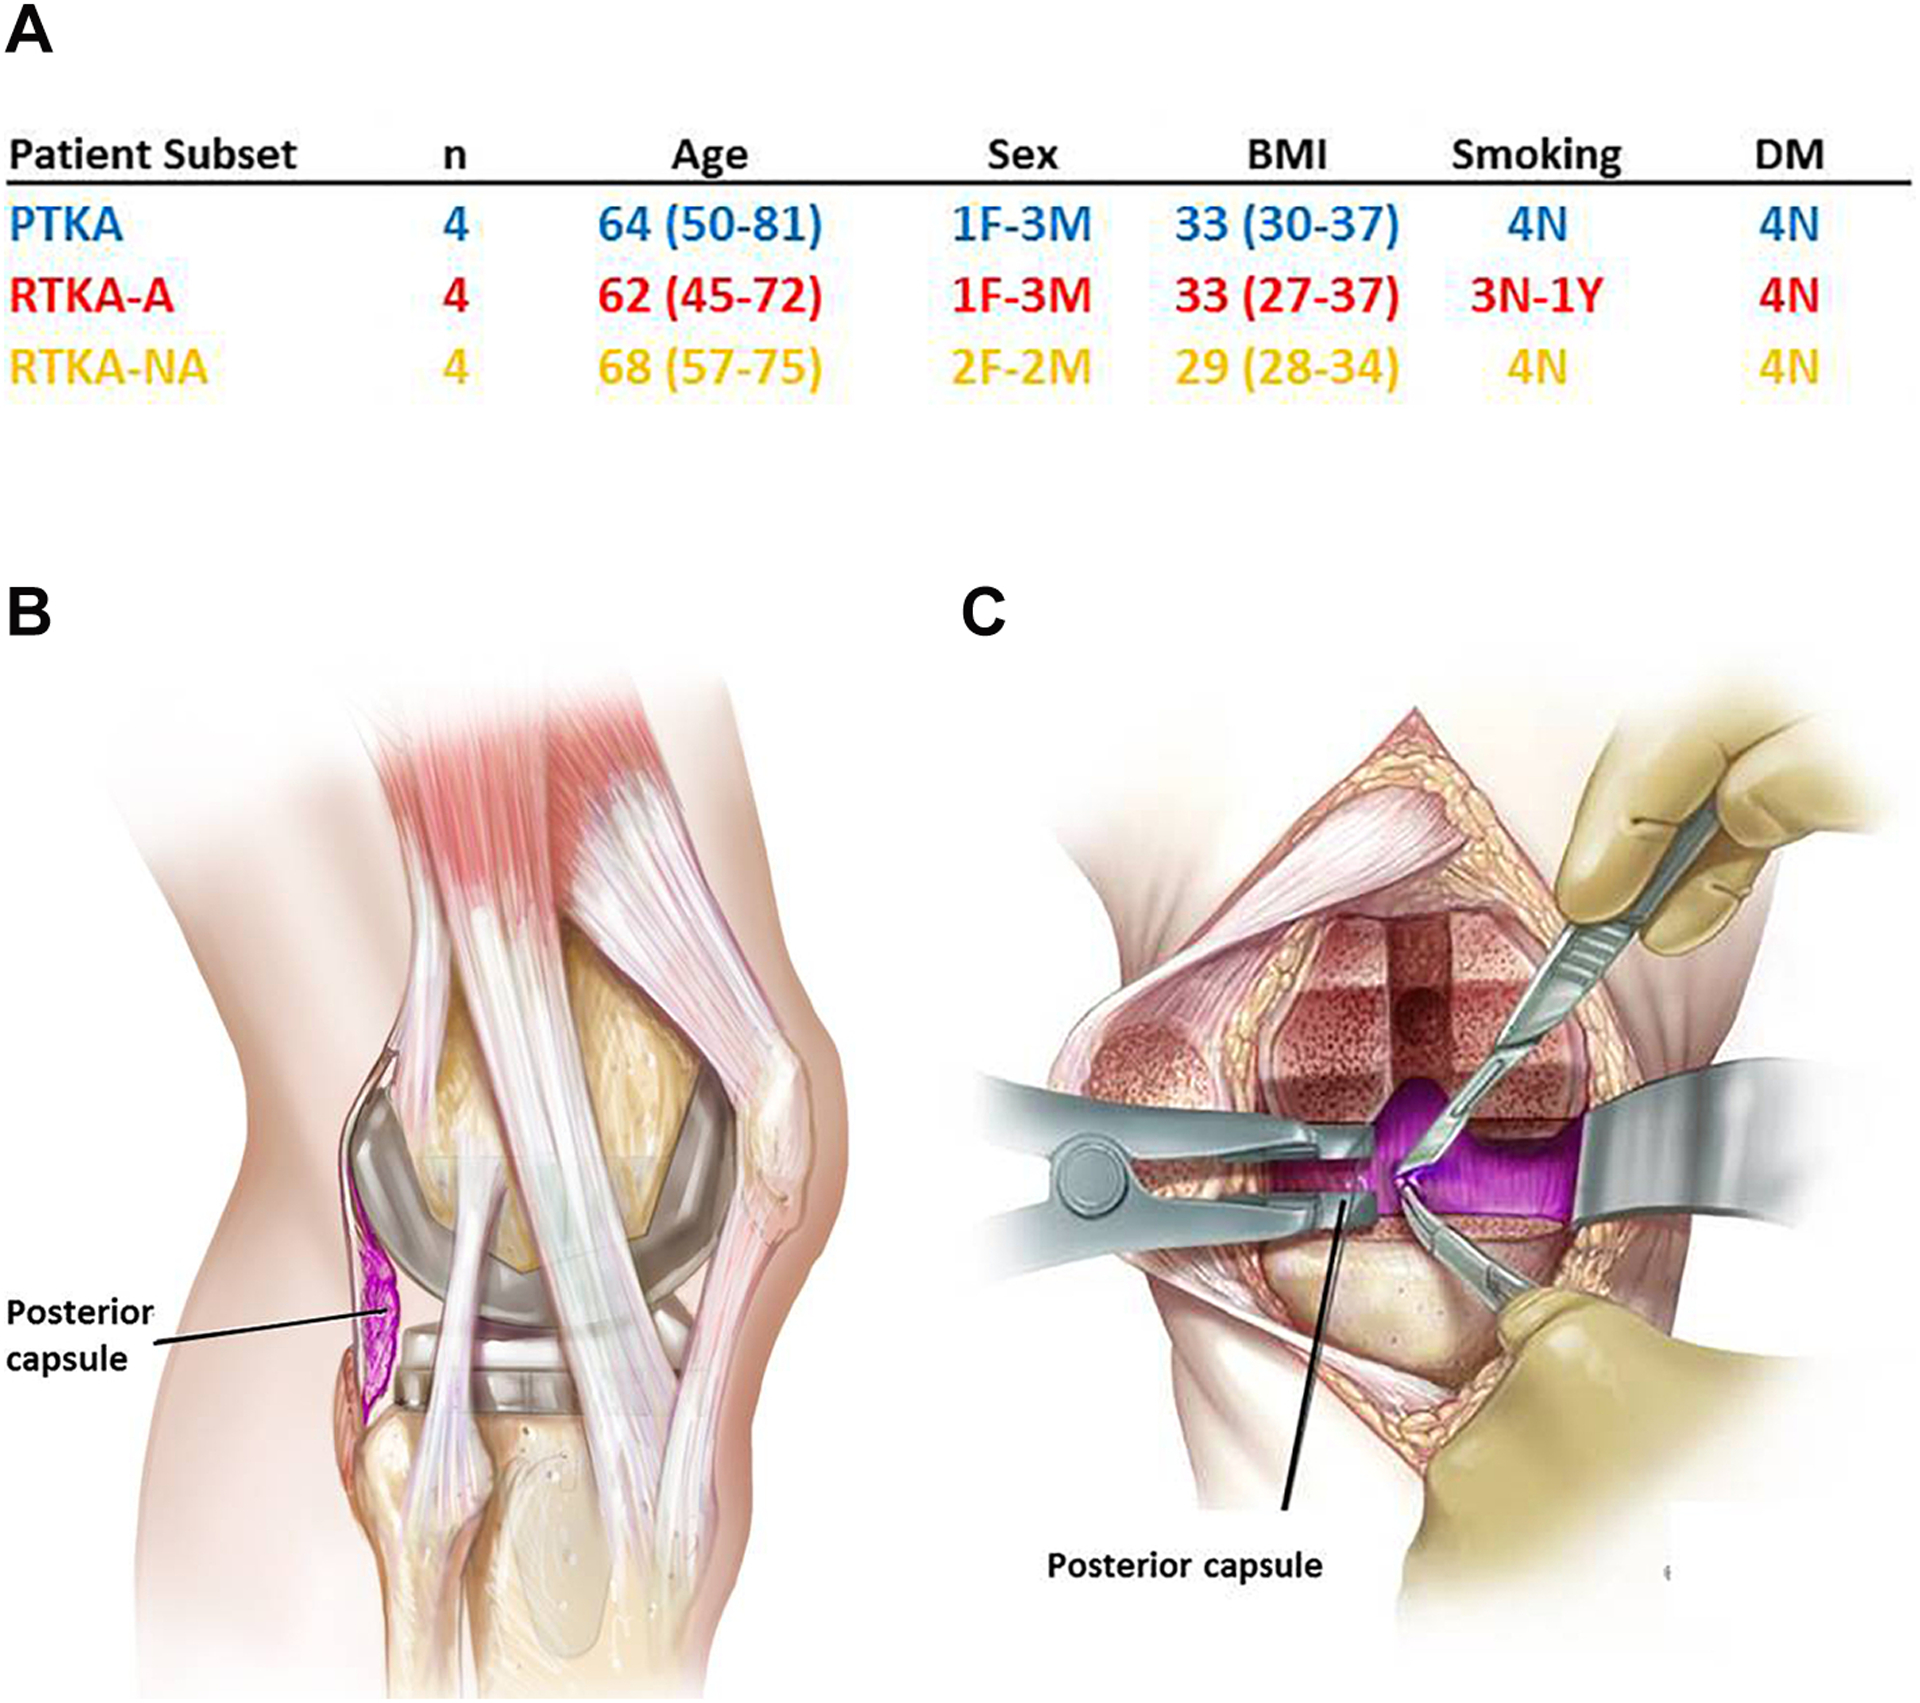
Characteristics of patient subset involved in RNA-seq analysis (A), Sagittal illustration of the posterior capsule (B), The coronal illustration of the posterior capsule (C).
Beyond these three patients groups, we validated differentially expressed genes (DEGs) established by RNA-seq analysis using a second cohort of patients (n = 4 for each group). These patients were selected based on the same inclusion and exclusion criteria as described above (i.e., PTKA, RTKA-NA and RTKA-A). For all patients used in our study, the average time from PTKA to RTKA-A was 5 years (range, 1–10 years), while the average time from PTKA to RTKA-NA was 7.5 years (range, 5–11 years).
2.2. Tissue Collection and Processing
During primary or revision TKAs, intraoperative tissue was obtained from the posterior capsule of the knee by the same surgeon, who represents one of nine high-volume revision surgeons at our institution. Tissues were carefully excised by the operative surgeon using a scalpel to remove a 2 cm × 2 cm specimen from the posterior capsule (Figure 1B, 1C). Excised specimens were rinsed in a 50 mL conical tube filled with phosphate buffered saline (PBS), transferred to RNase/DNase-free containers, immediately frozen in liquid nitrogen, and stored at −80 °C.
2.3. RNA Isolation
RNA was extracted from frozen tissue using the miRNeasy mini kit (Qiagen, Germantown, MD) according to the manufacturer’s protocol. RNA concentration and purity were initially monitored for ultraviolet absorbance by NanoDrop (Thermo Fisher Scientific, Waltham, MA). Samples with sufficient yield and purity were subjected to additional RNA quality assessment (Agilent Technologies, Santa Clara, CA) by RNA integrity number (RIN) as a tool for prioritization of samples. Samples with acceptable ultraviolet absorbance values (i.e., percentage of RNA fragments>200 nucleotides; DV200 score) and RIN scores were selected for RNA-seq by an intramural core facility (Advanced Genomics Technology Center, Mayo Clinic, Rochester, MN). One sample was excluded from RNA sequencing because the RNA was of insufficiently quality (e.g., low RIN and DV200; see Supplemental Table 2).
2.4. Next generation mRNA-sequencing (RNA-seq)
RNA sequencing and following bioinformatics analysis were completed in collaboration with the Mayo Clinic RNA sequencing and bioinformatics cores [28]. TruSeq Kits were used for indexing to permit multiplex sample loading on the flow cells. Paired-end sequencing reads were generated on the Illumina HiSeq 2000 sequencer. Quality control for concentration and library size distribution was performed using an Agilent Bioanalyzer DNA 1000 chip and Qubit fluorometry (Invitrogen, Carlsbad, CA). Sequence alignment of reads and determination of normalized gene counts were performed using the MAP-RSEq. (v.1.2.1) workflow, utilizing TopHat [28] and HTSEq [29]. Normalized read counts were expressed as reads per kilobasepair per million mapped reads (RPKM).
2.5. Computational analysis and statistics
To obtain uniform sampling, we examined all specimens by RNA-seq (postvalidation) using classical mRNA biomarkers (e.g., β-hemoglobin/HBB, myoglobin/MB) that can account for presence of extraneous cells and tissues (e.g., blood, muscle). We excluded samples with higher than expected expression of these biomarkers (Supplemental Table 2). Genes with highest levels of expression were identified based on the mean RPKMs of genes in each patient group after discarding common housekeeping genes curated in the molecular signatures database (MSigDB). Differential expression analysis was carried out using edgeR1based on a likelihood ratio test assuming a negative binomial distribution (version 3.20.1). p values were adjusted for multiple hypothesis testing based on the Benjamini-Hochberg method. DEGs were identified with average expression larger than 1 counts per million (CPM), absolute log2 fold change larger than 1 and adjusted p value smaller than 0.05. All statistical analysis, including hierarchical clustering, principal component and correlation analysis, was carried out in R (version 3.4.2) [30]. Pathway analysis of DEGs was performed based on over-representation based method Enrichr [31]. Pathways with adjusted p value smaller than 0.05 were identified as significantly perturbed. Protein-protein interaction networks were generated using STRING Database version 10.5 [32].
2.6. Validation of DEGs
Isolated RNA was transcribed into cDNA using the SuperScript III First- Strand Synthesis System (Invitrogen, Carlsbad, CA). Gene expression was quantified by using real-time qPCR reactions performed with 15 ng of cDNA per 10 μl using the QuantiTect SYBR Green PCR Kit (Qiagen, Hilden, Germany) and CFX384 Real Time System (BioRad, Hercules, CA). Gene-specific primers are shown in Supplemental Table 3. Gene expression levels were normalized to the housekeeping gene, GAPDH, and quantified using the 2ΔΔCt method. GraphPad Prism version 7.03 for Windows was used to create graphs.
3. Results
3.1. Posterior capsule specimens from different patient groups have distinct molecular signatures
From the RNA-seq data of 4 PTKA, 4 RTKA and 4 RTKA-NA samples, hierarchical clustering (Figure 2A), principal component (Figure 2B) and correlation analyses (Figure 2C) were generated to gain an understanding of how the transcriptomes of the three different patient groups compared across all expressed genes and patient groups. Each of the three analyses, which detect global sample similarity and variation, revealed that transcriptomes for each set of four specimens form distinct clusters according to each patient group.
Figure 2.

Comparative analysis of mRNA expressions in PTKA, RTKA-A and RTKA-NA via hierarchical clustering (A), Principal component (B) and correlation (C) analysis.
3.2. Determination of Highest Expressed Genes
To determine molecular signatures for arthrofibrosis, we selected genes with the highest expression level in all three patient groups. Venn diagrams were generated to identify common highest expressed genes among three patients groups (Figure 3A). RPKM, fold change and p-values of the unique genes for each group are provided in Supplemental Table 4. This analysis revealed five common genes in capsular tissue regardless of tissue origin (i.e., S100A4, S100A6, TIMP1, CTSD, CRIP1). Of these, two S100 genes (S100A4 and S100A6) have diverse roles in cell growth, differentiation and survival, while the matrix metalloproteinase inhibitor TIMP1 and Cathepsin D/CTSD have prominent roles in ECM remodeling; the function of cysteine-rich intestinal protein (CRIP/CRIP1) is not yet understood.
Figure 3.
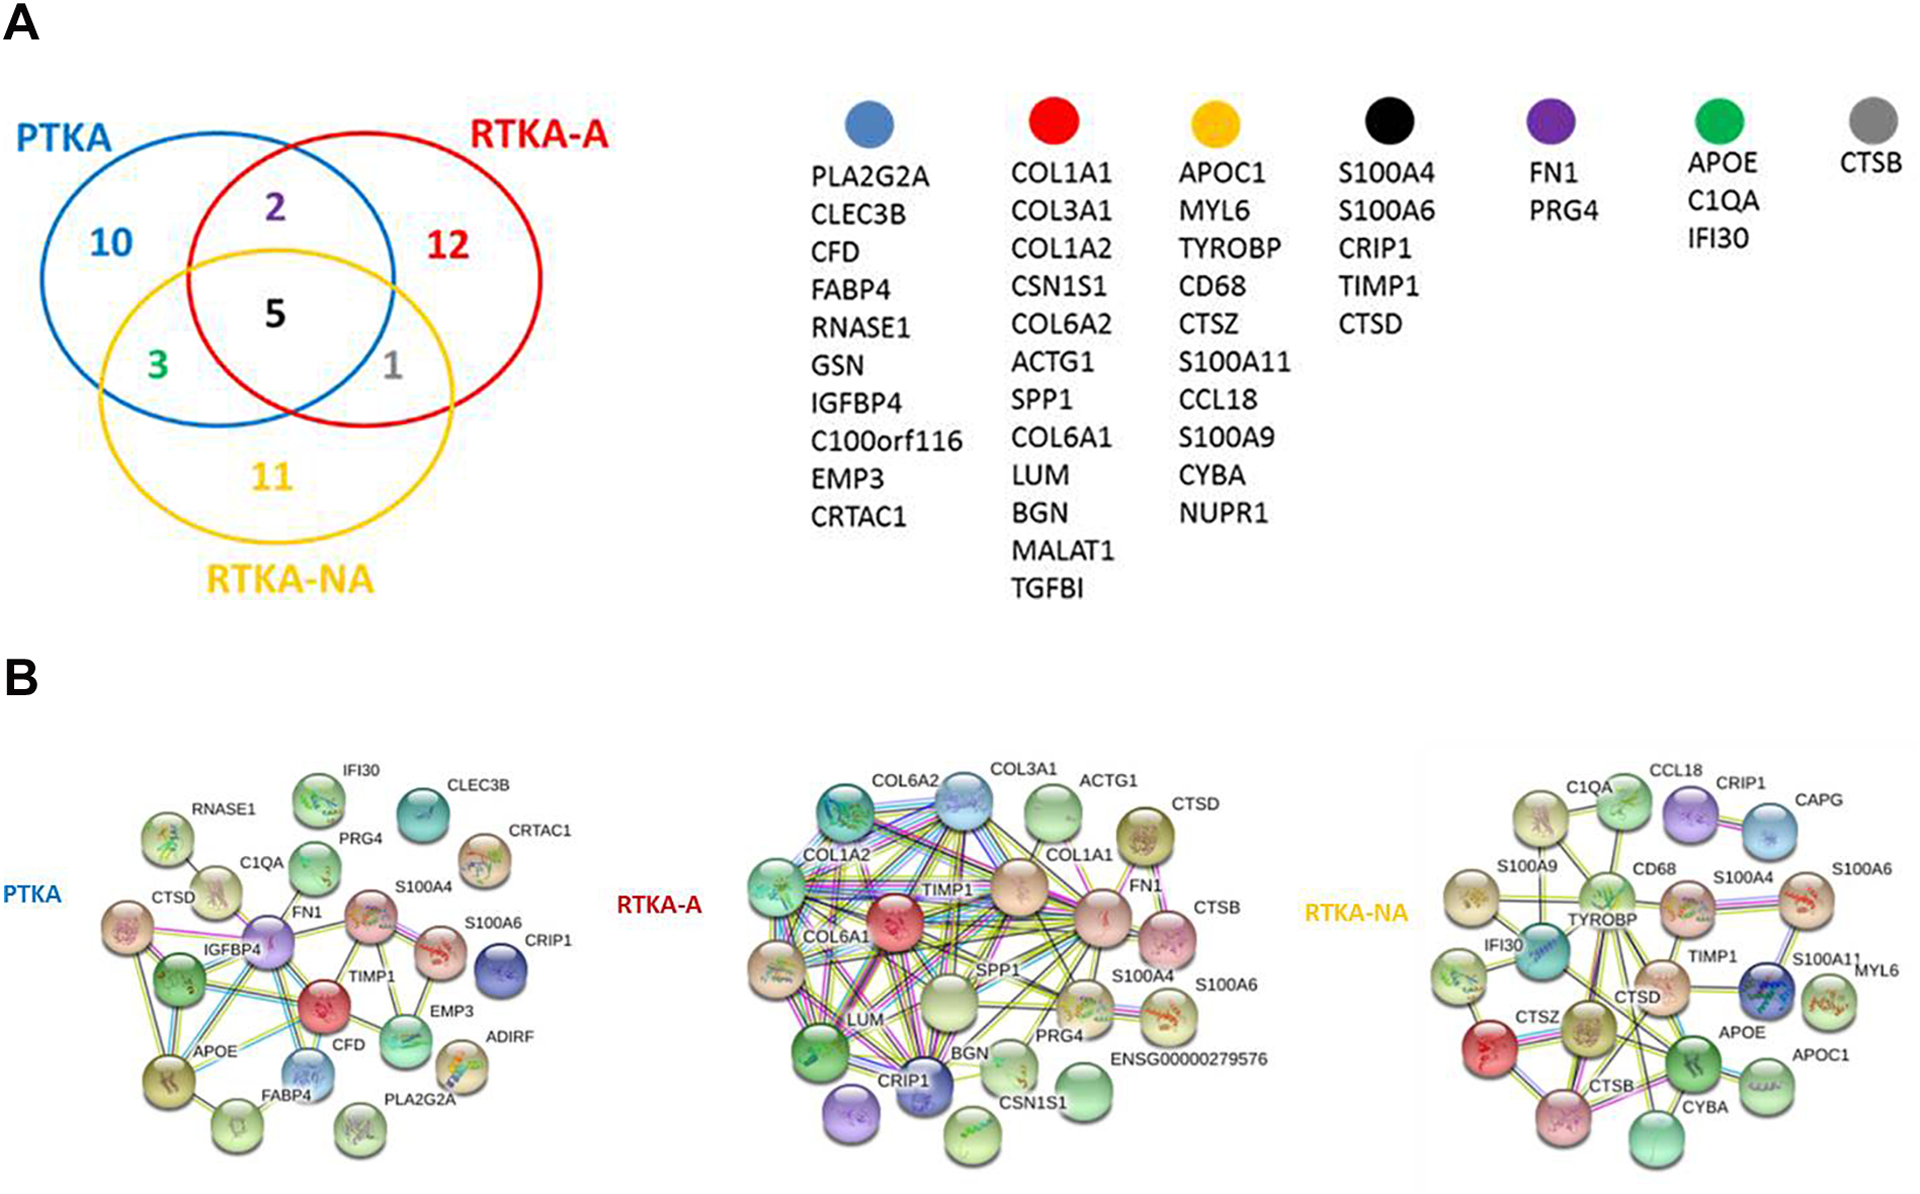
Overlap within the 20 highest expressed genes identified for PTKA, RTKA-A and RTKA-NA (A), STRING protein-protein interaction network analysis for the top 20 highest expressed genes of PTKA, RTKA-A and RTKA-NA (B).
STRING analysis of the 20 highest expressed genes in each patient group revealed several protein-protein interaction networks that reflect expression of programs of genes with shared functions (Figure 3B). The 20 highest expressed gene set in RTKA-A patients contains multiple collagens and non-collagenous genes that are abundant in fibrous and fibrotic tissues (e.g., COL1A1, COL1A2, COL6A1, COL6A2, FN, SPP1, BGN).
3.3. Definition of genes specific for patients with arthrofibrosis
Comparing RTKA-A versus PTKA and RTKA-A versus RTKA-NA patients separately demonstrated statistically significant alterations in expression levels in RTKA-A compared to the PTKA and RTKA-NA control groups. We identified 2059 up-regulated and 1795 down-regulated DEGs in RTKA-A versus PTKA patients (Figure 4A, 4C) and 3255 up-regulated and 3683 down-regulated DEGs in RTKA-A versus RTKA-NA patients (Figure 4B,4D) (Supplemental Table 5). Detectable differences in the transcriptomes of patient groups highlight key biological differences among joint capsular tissues at the time of specimen collection.
Figure 4.
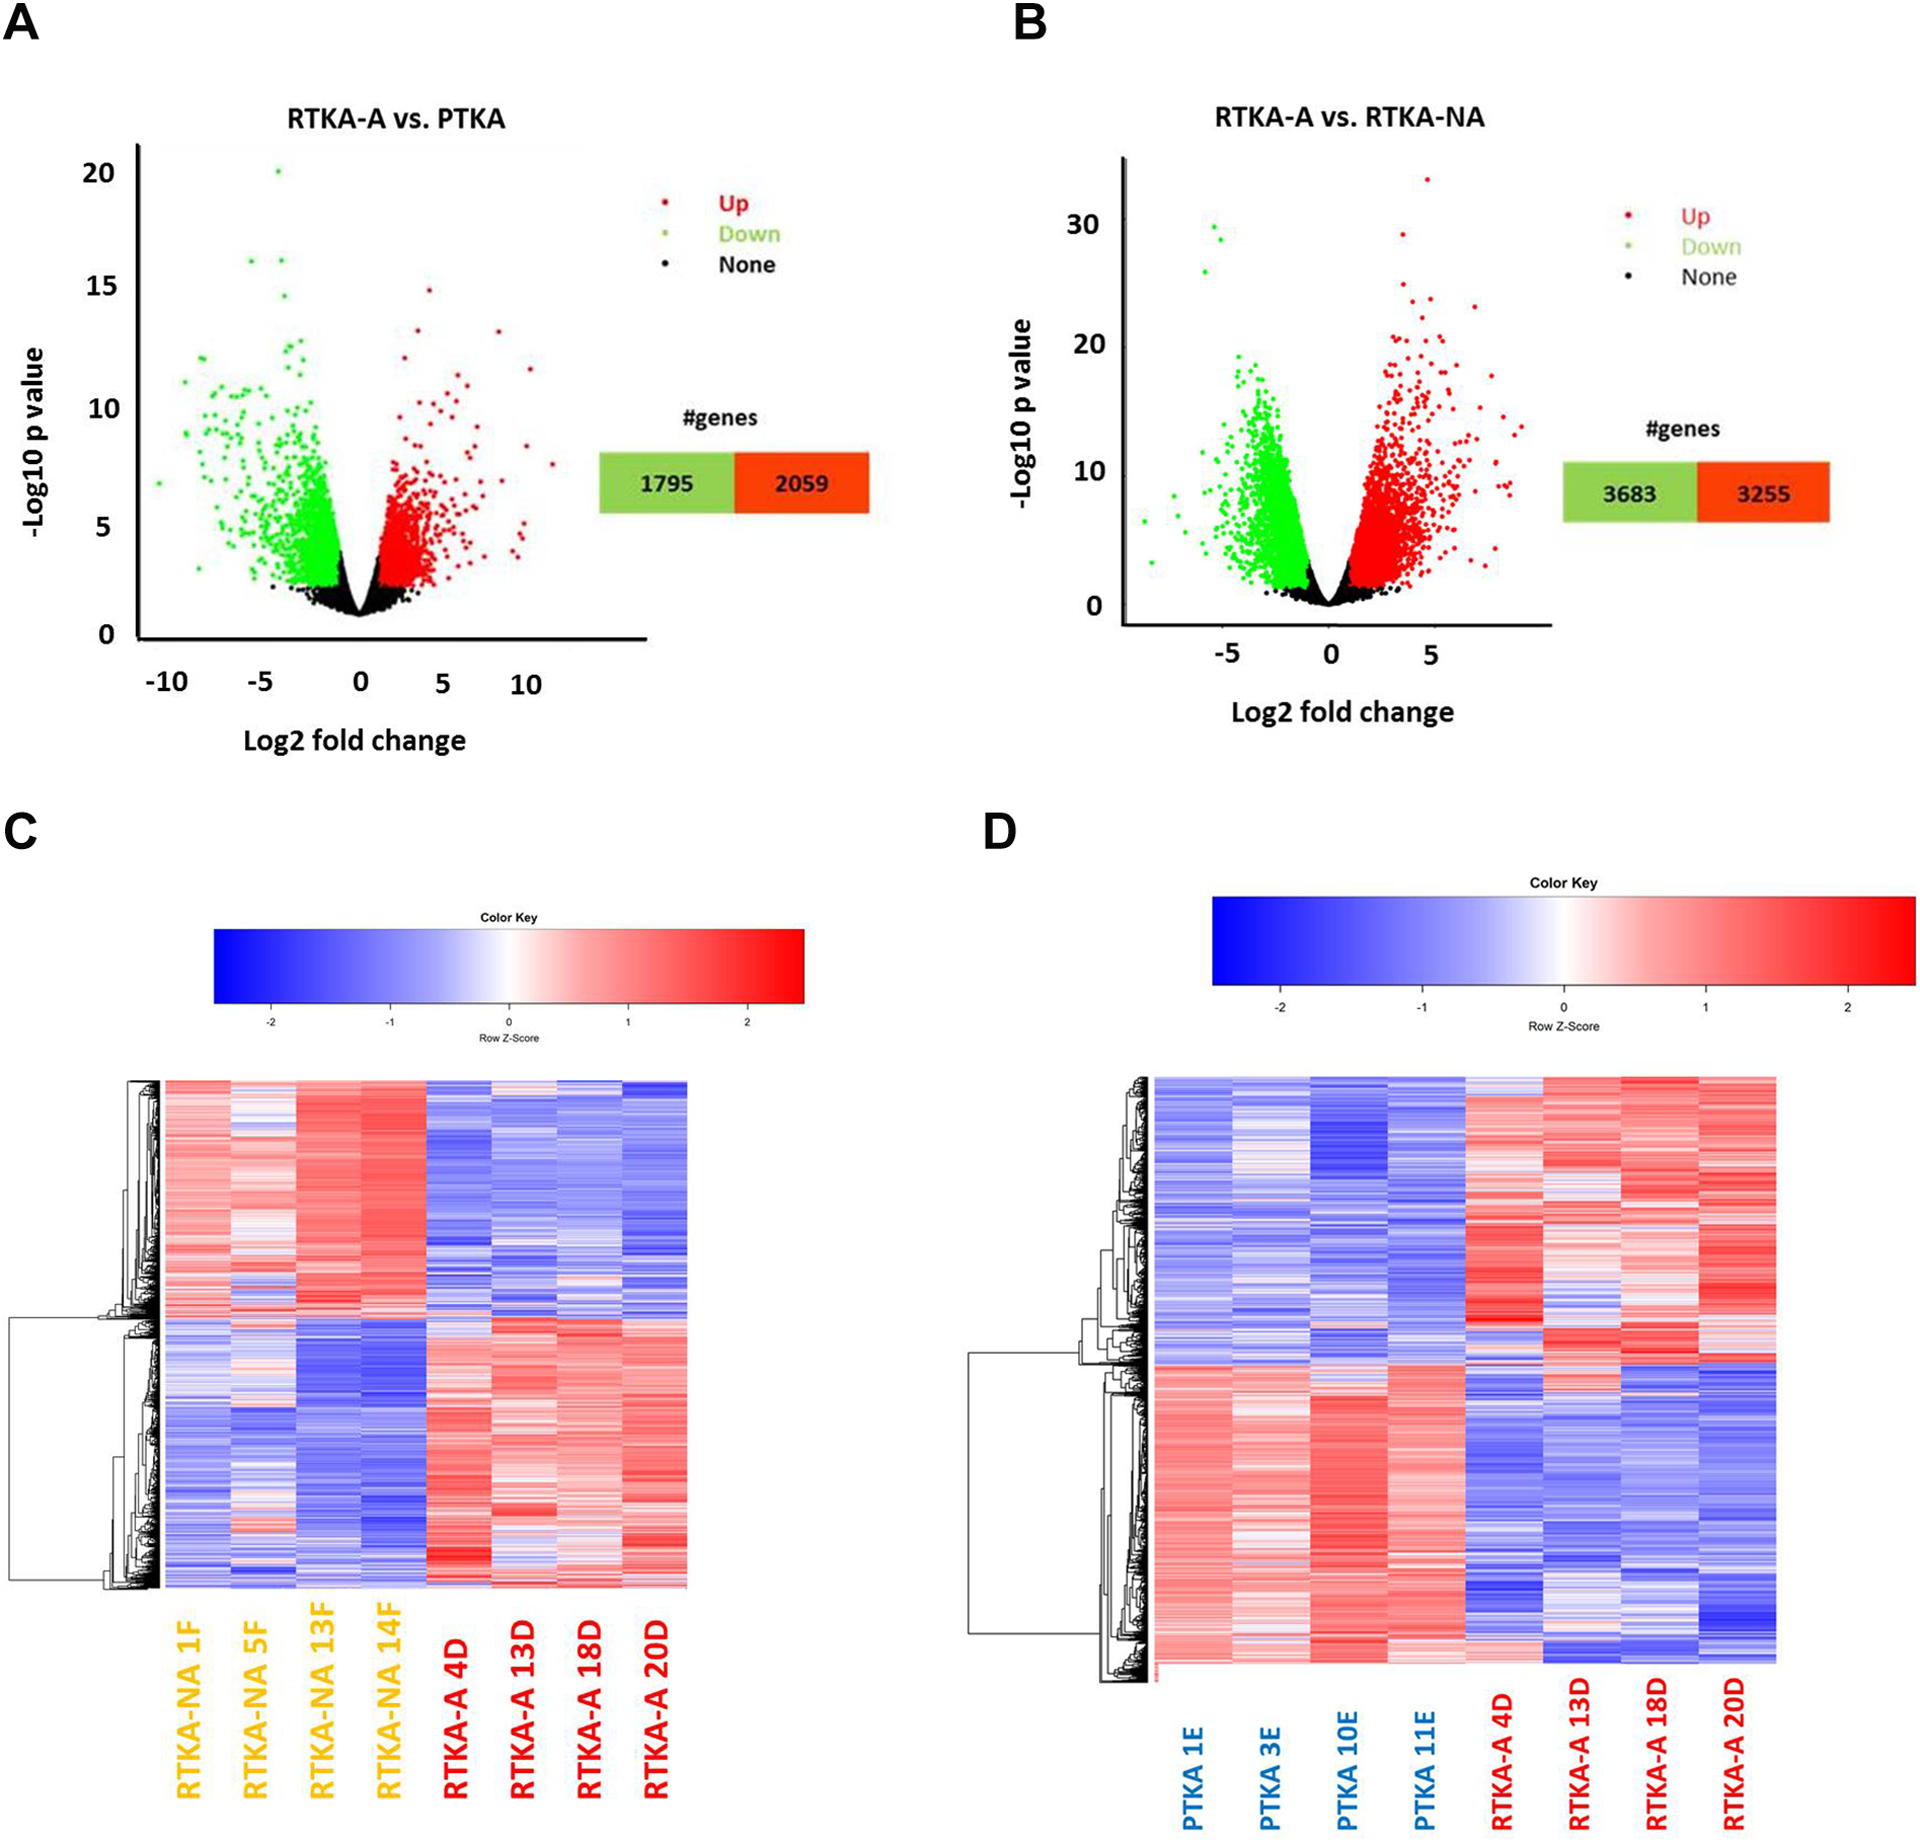
Volcano plot depicting DEGs in RTKA-A versus PTKA (A) and RTKA-A versus RTKA-NA (B), Hierarchical clustering analysis of DEGs in RTKA-A versus PTKA (C) and RTKA-A versus RTKA-NA (D).
3.4. Gene ontology analysis of differentially expressed genes in patients undergoing primary total knee arthroplasty or revision surgery
Genes differentially expressed in arthrofibrosis patients (compared to control patients) represent possible diagnostic parameters or molecular targets for intervention at the onset or progression of arthrofibrosis. Using the up-regulated and down-regulated gene sets identified in the comparative analysis of the three patient groups (PTKA, RTKA-A and RTKA-NA), we consulted the pathway analysis which is a repository of previously established gene lists that are annotated using gene GO terms for different biological, cellular or molecular characteristics.
2059 up-regulated DEGs in RTKA-A vs PTKA and 3255 up-regulated DEGs in RTKA-A vs RTKA-NA had both enrichment of GO term extracellular matrix organization (GO:0030198) (Figure 5A, 5B) (Supplemental Table 6). This finding is consistent with the description of arthrofibrosis by the production of excessive ECM proteins in a joint. To investigate the relationships between the proteins encoded by the genes involved in extracellular matrix organization, STRING network analysis was conducted for RTKA-A vs PTKA (Figure 5C) and RTKA-A vs RTKA-NA (Figure 5D). This comparison showed a highly interactive protein-protein interaction network in which most of the genes are members of Collagen and Integrin families.
Figure 5.
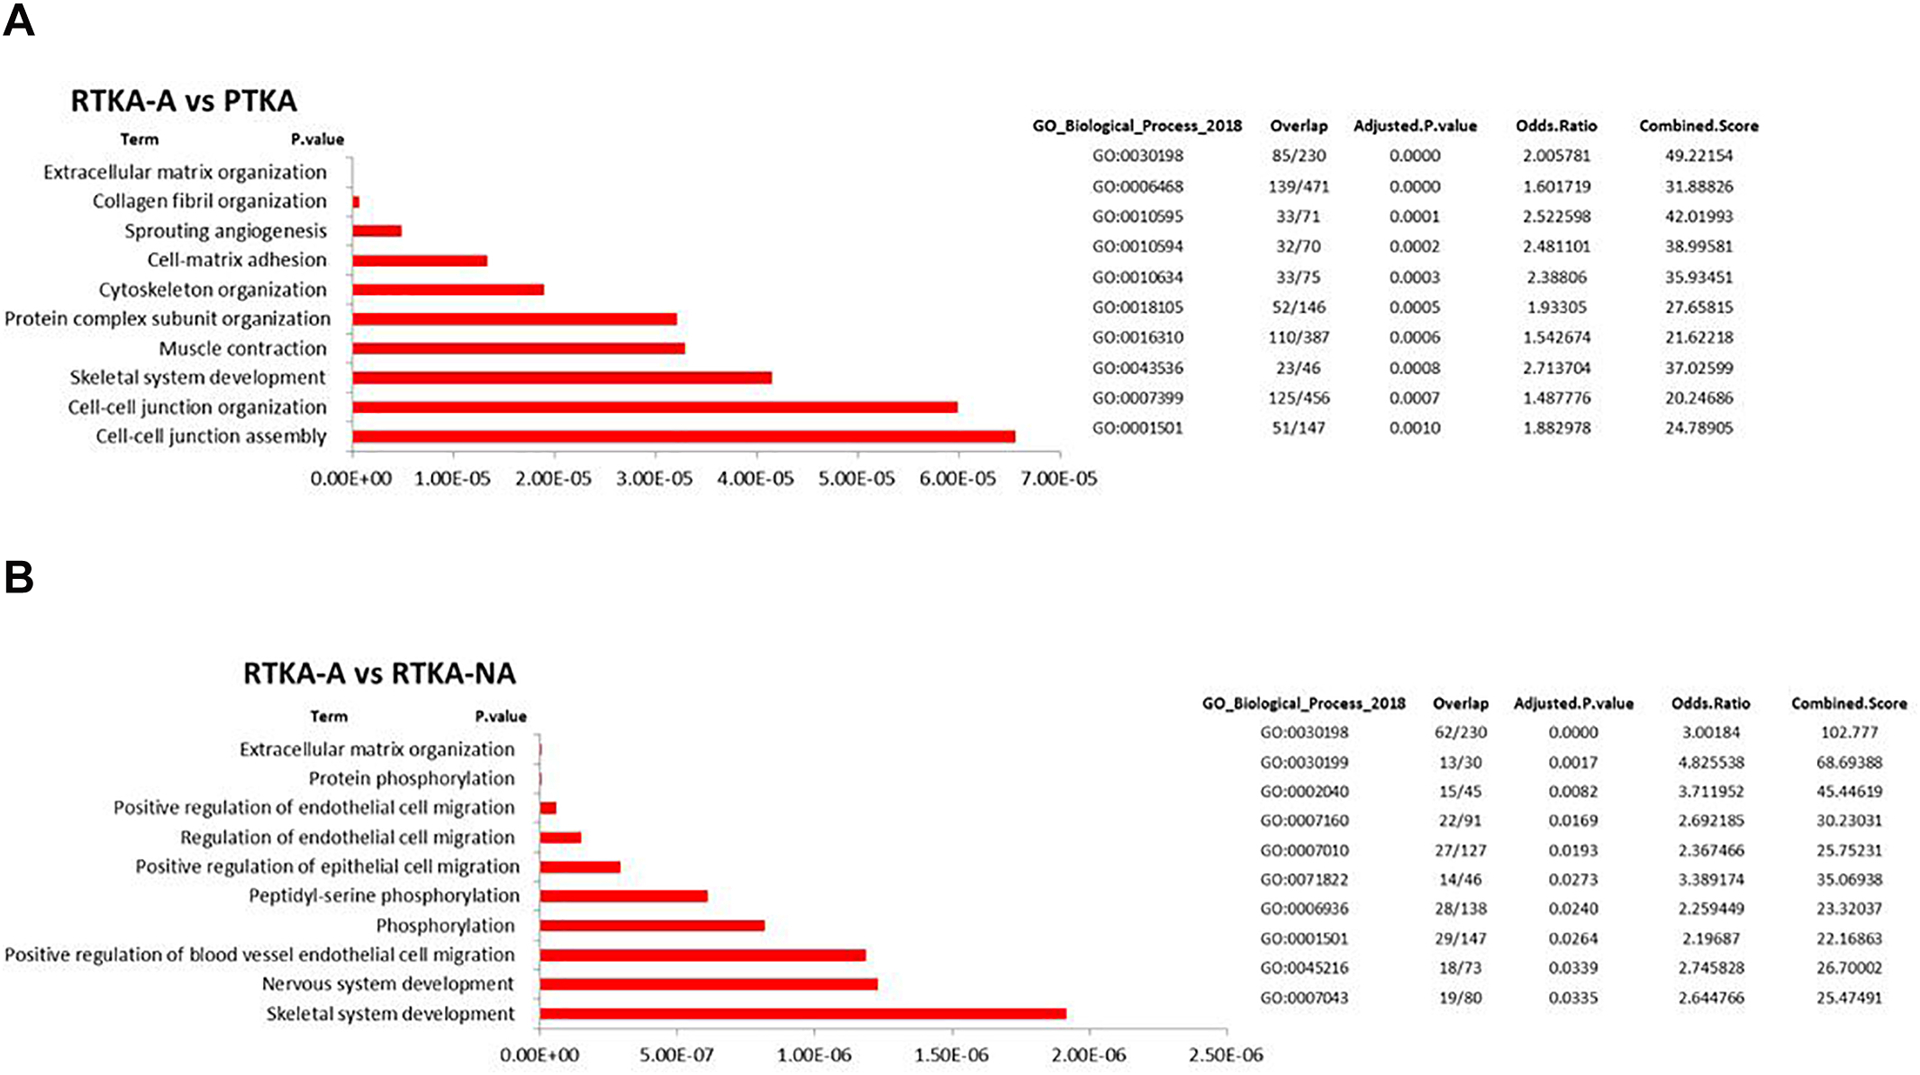
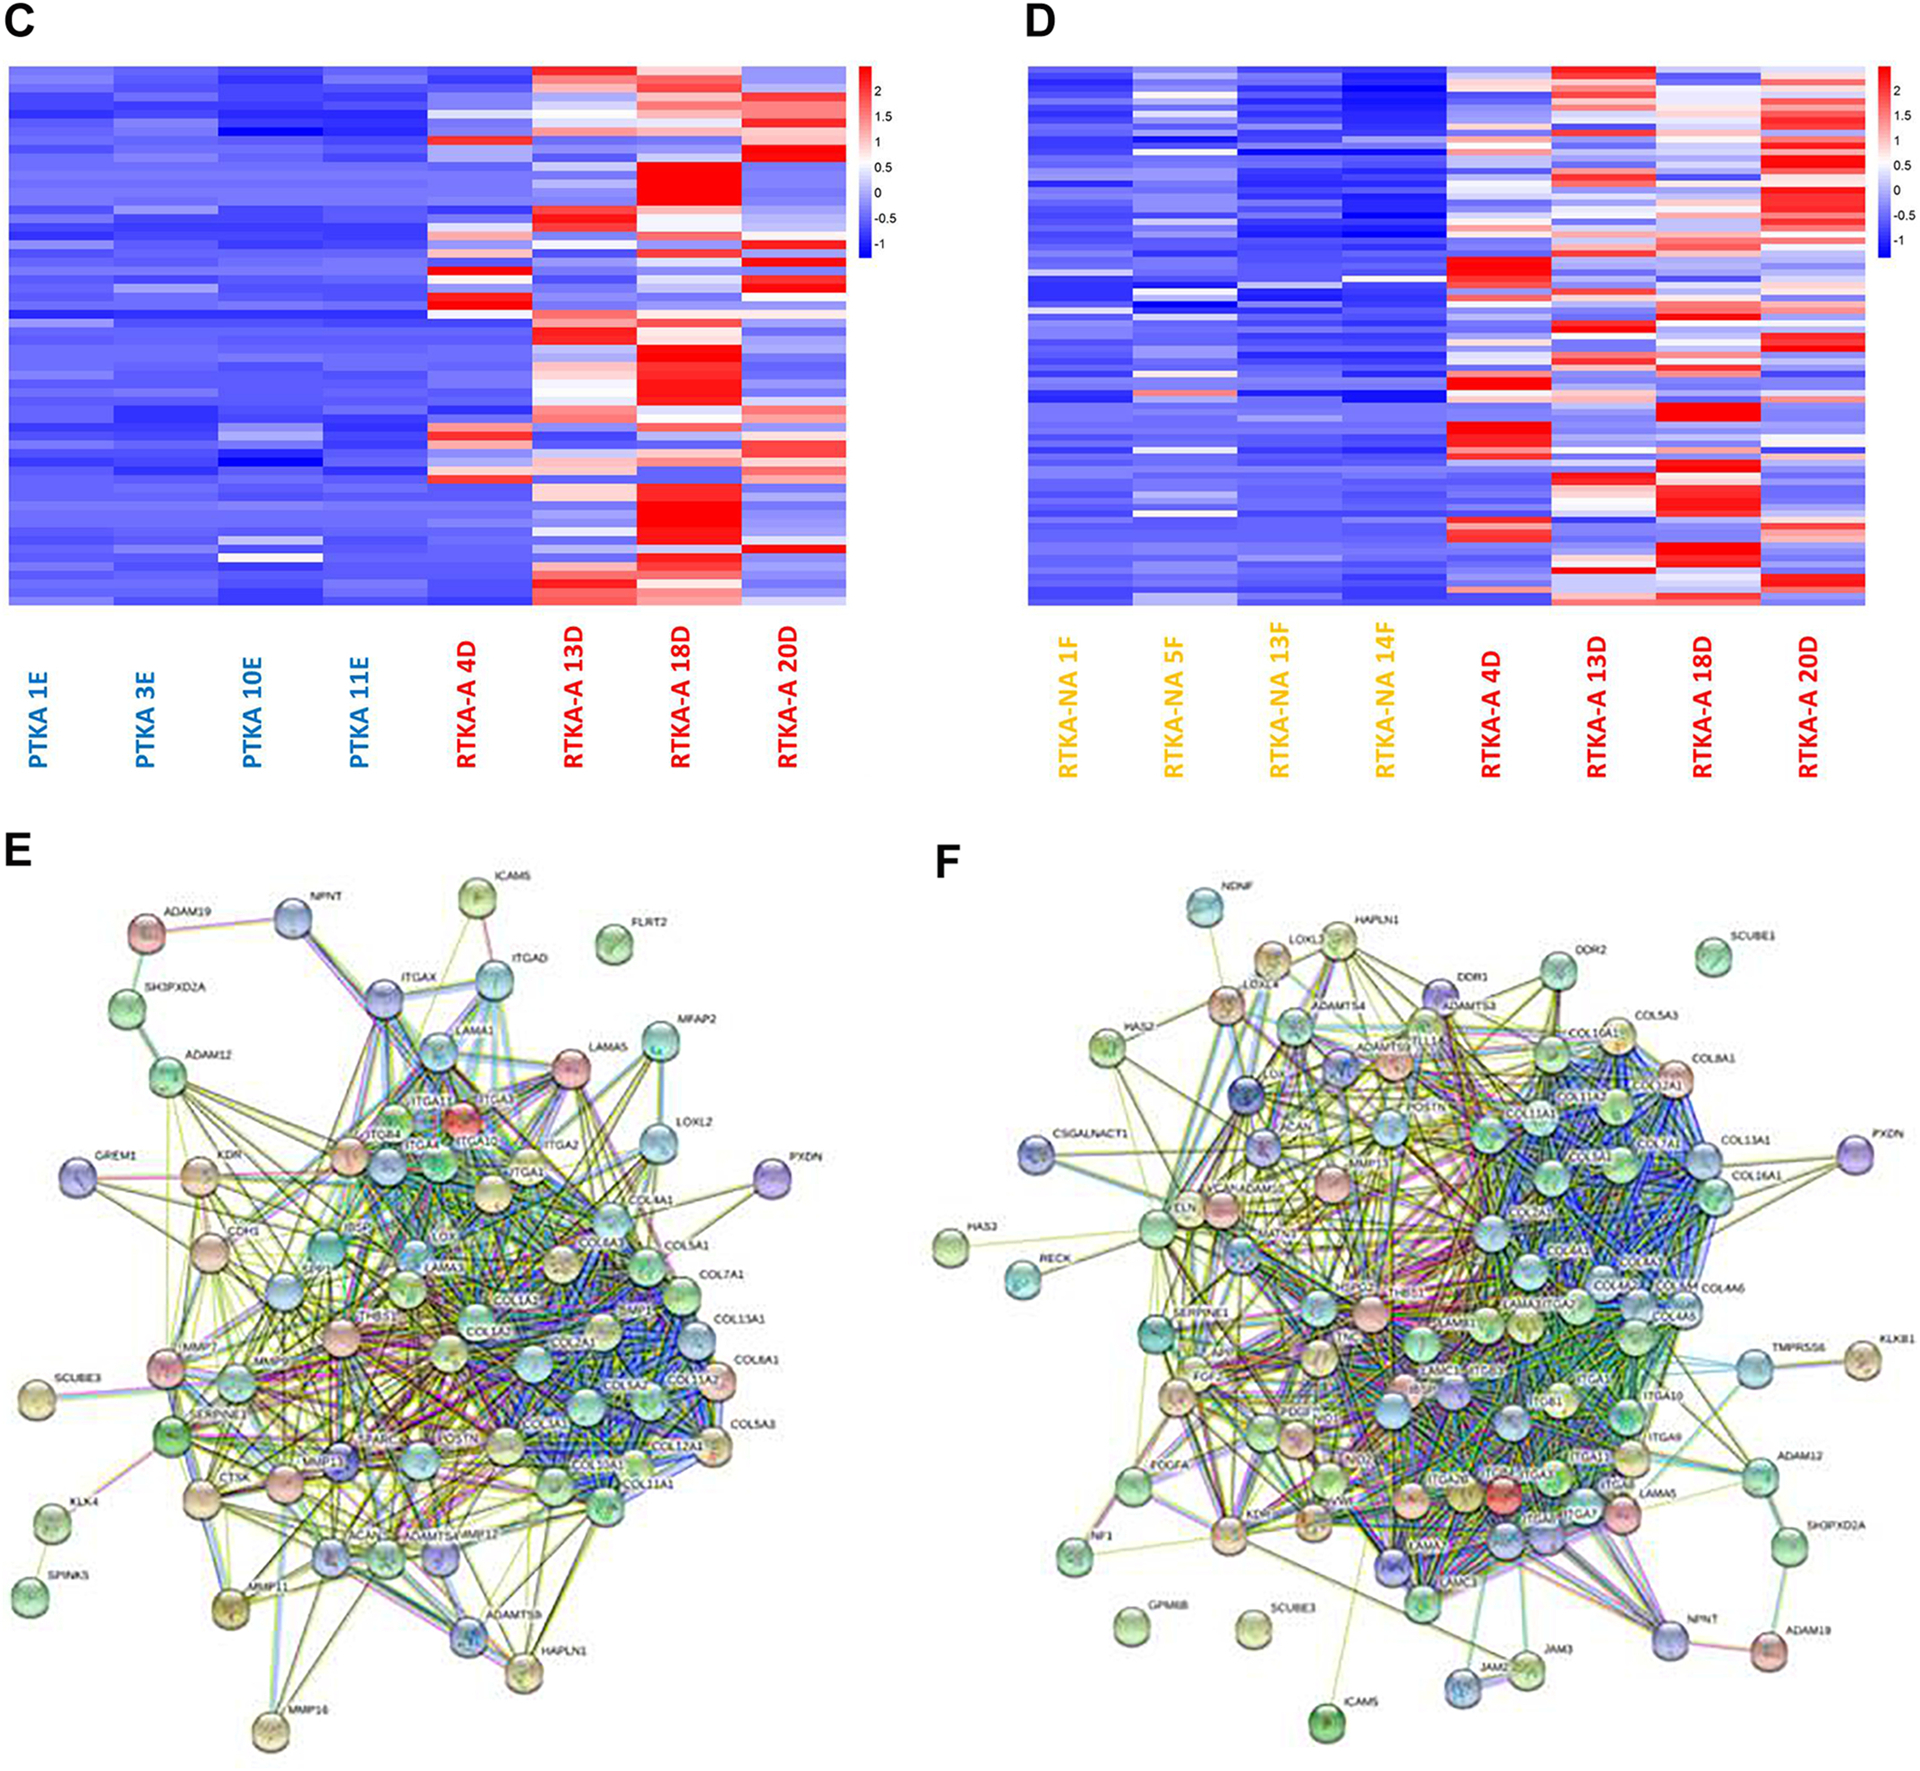
Pathway analysis of the 2059 up-regulated DEGs identified for RTKA-A versus PTKA (A) and the 3255 up-regulated DEGs identified for RTKA-A versus RTKA-NA (B), Heatmap of expression levels for genes related to extracellular matrix organization in patients with RTKA-A versus PTKA (C) and RTKA-A versus RTKA-NA, as well as STRING protein-protein interaction network analysis of up-regulated DEGs involved in extracellular matrix organization in RTKA-A versus PTKA (D) and RTKA-A versus RTKA-NA (E)
To understand which up-regulated extracellular matrix organization DEGs are unique to arthrofibrosis patients, Venn diagram was utilized to establish the gene intersect (Figure 6A) (Supplemental Table 6). This analysis revealed 37 up-regulated extracellular matrix organization DEGs in common when RTKA-A patients are compared with either PTKA or RTKA-NA. Similar to our observations above (see Figs. 5C and 5D), STRING network analysis of these 37 genes also revealed a highly interactive protein network, especially between Collagen and Integrin family members as well (Figure 6B).
Figure 6.
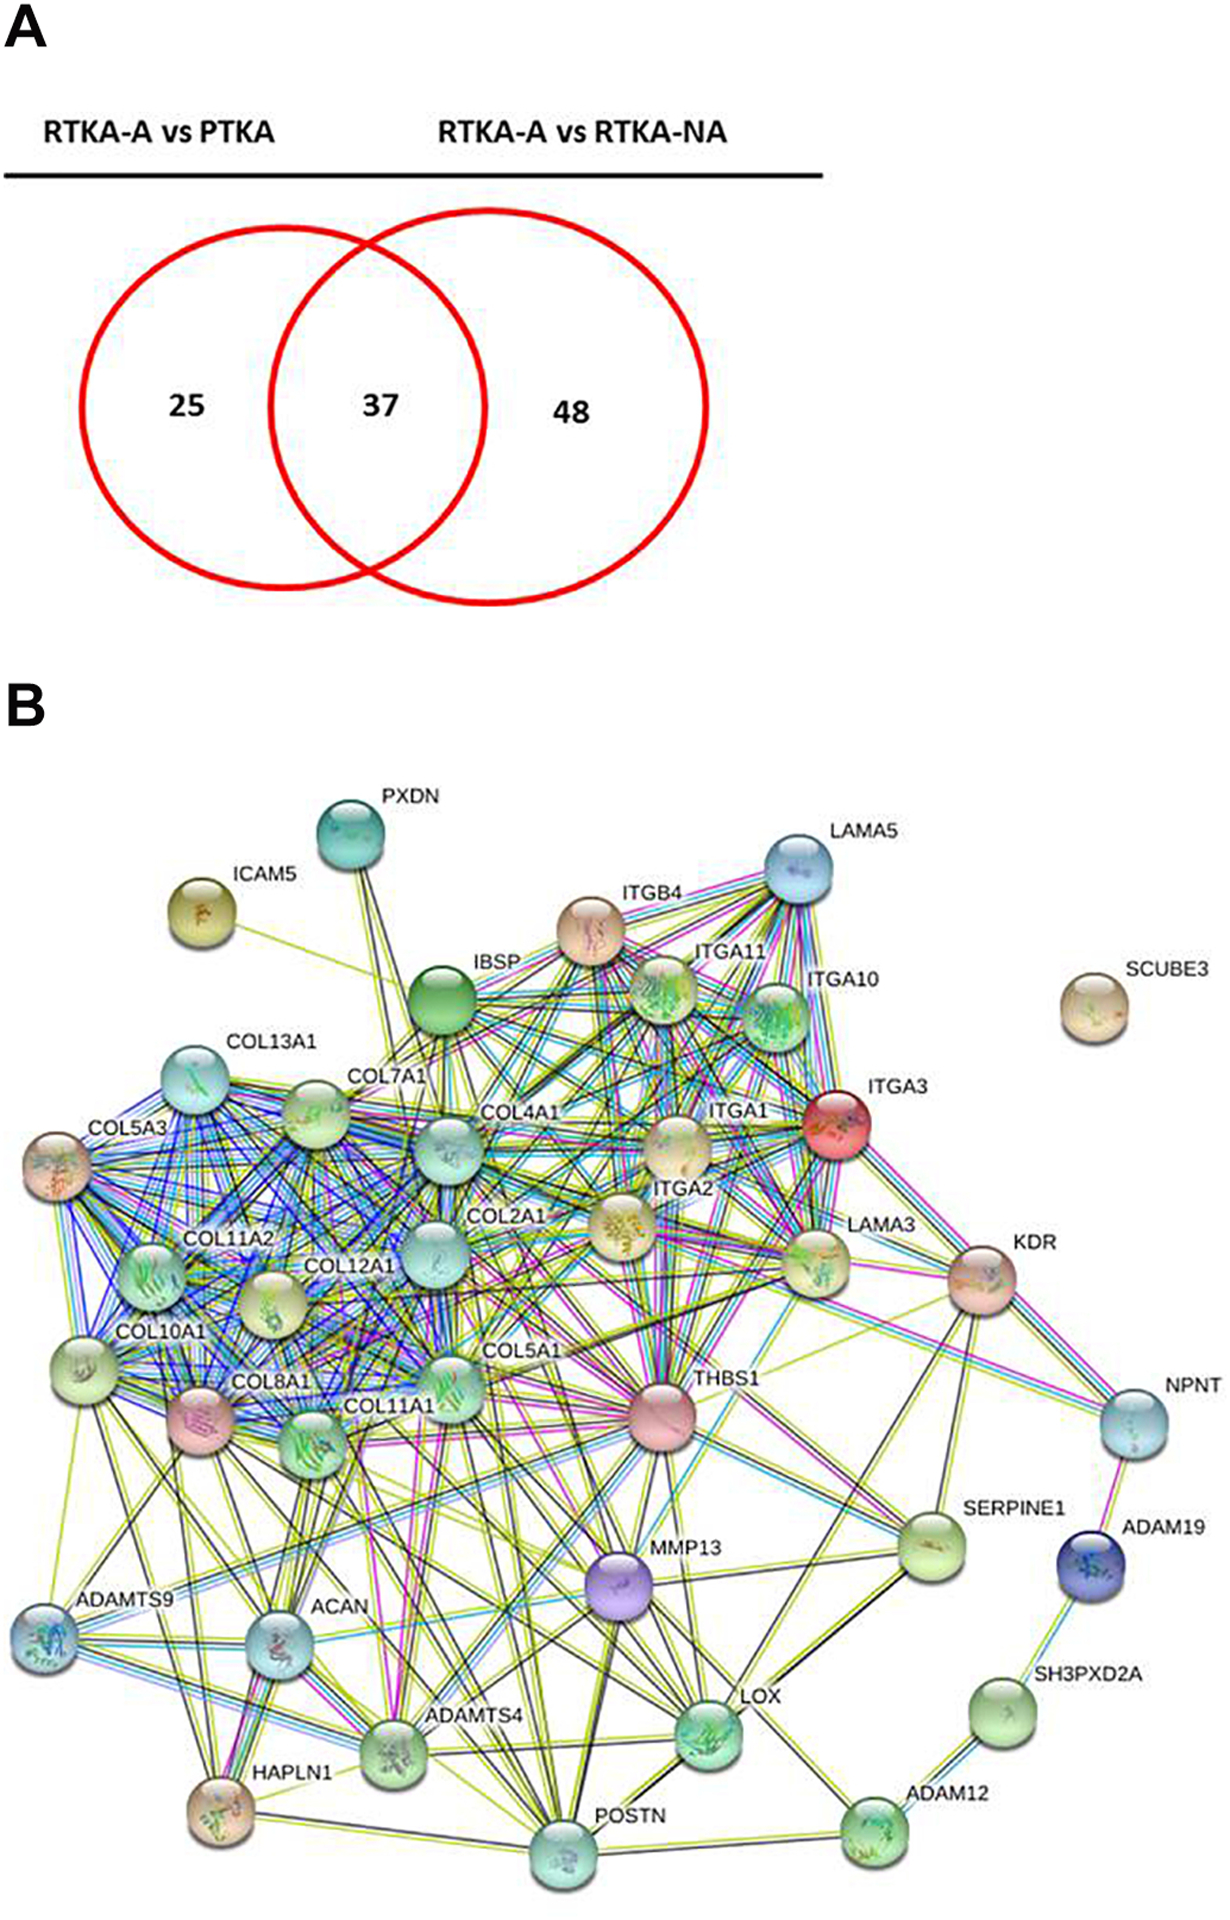
Overlap of common up-regulated extracellular matrix organization DEGs in RTKA-A versus PTKA and RTKA-A versus RTKA-NA (A), STRING protein-protein interaction network analysis of common up-regulated extracellular matrix organization DEGs (B).
Although, 1795 down-regulated DEGs in RTKA-A vs PTKA and 3683 down-regulated DEGs in RTKA-A vs RTKA-NA had both enrichment of GO term SRP-dependent co-translational protein targeting to membrane (GO:0006614) (Supplemental Table 7). In this study because of potent effects of up-regulated genes on arthrofibrosis development, further analyses were performed on them.
3.5. Validation of DEGs in another patient set
Determination of extracellular matrix organization genes unique to arthrofibrosis patients revealed genes especially involved in Collagen and Integrin families. To validate up-regulated expression of these genes in another patient subset (4 PTKA, 4 RTKA and 4 RTKA-NA) we performed qPCR analysis of COL11A1 and ITGA11 representing each gene family, and also SERPINE1 (Figure 7B). Thus, these RNA-seq analysis results corroborate expression of these genes in another patient subset.
Figure 7.
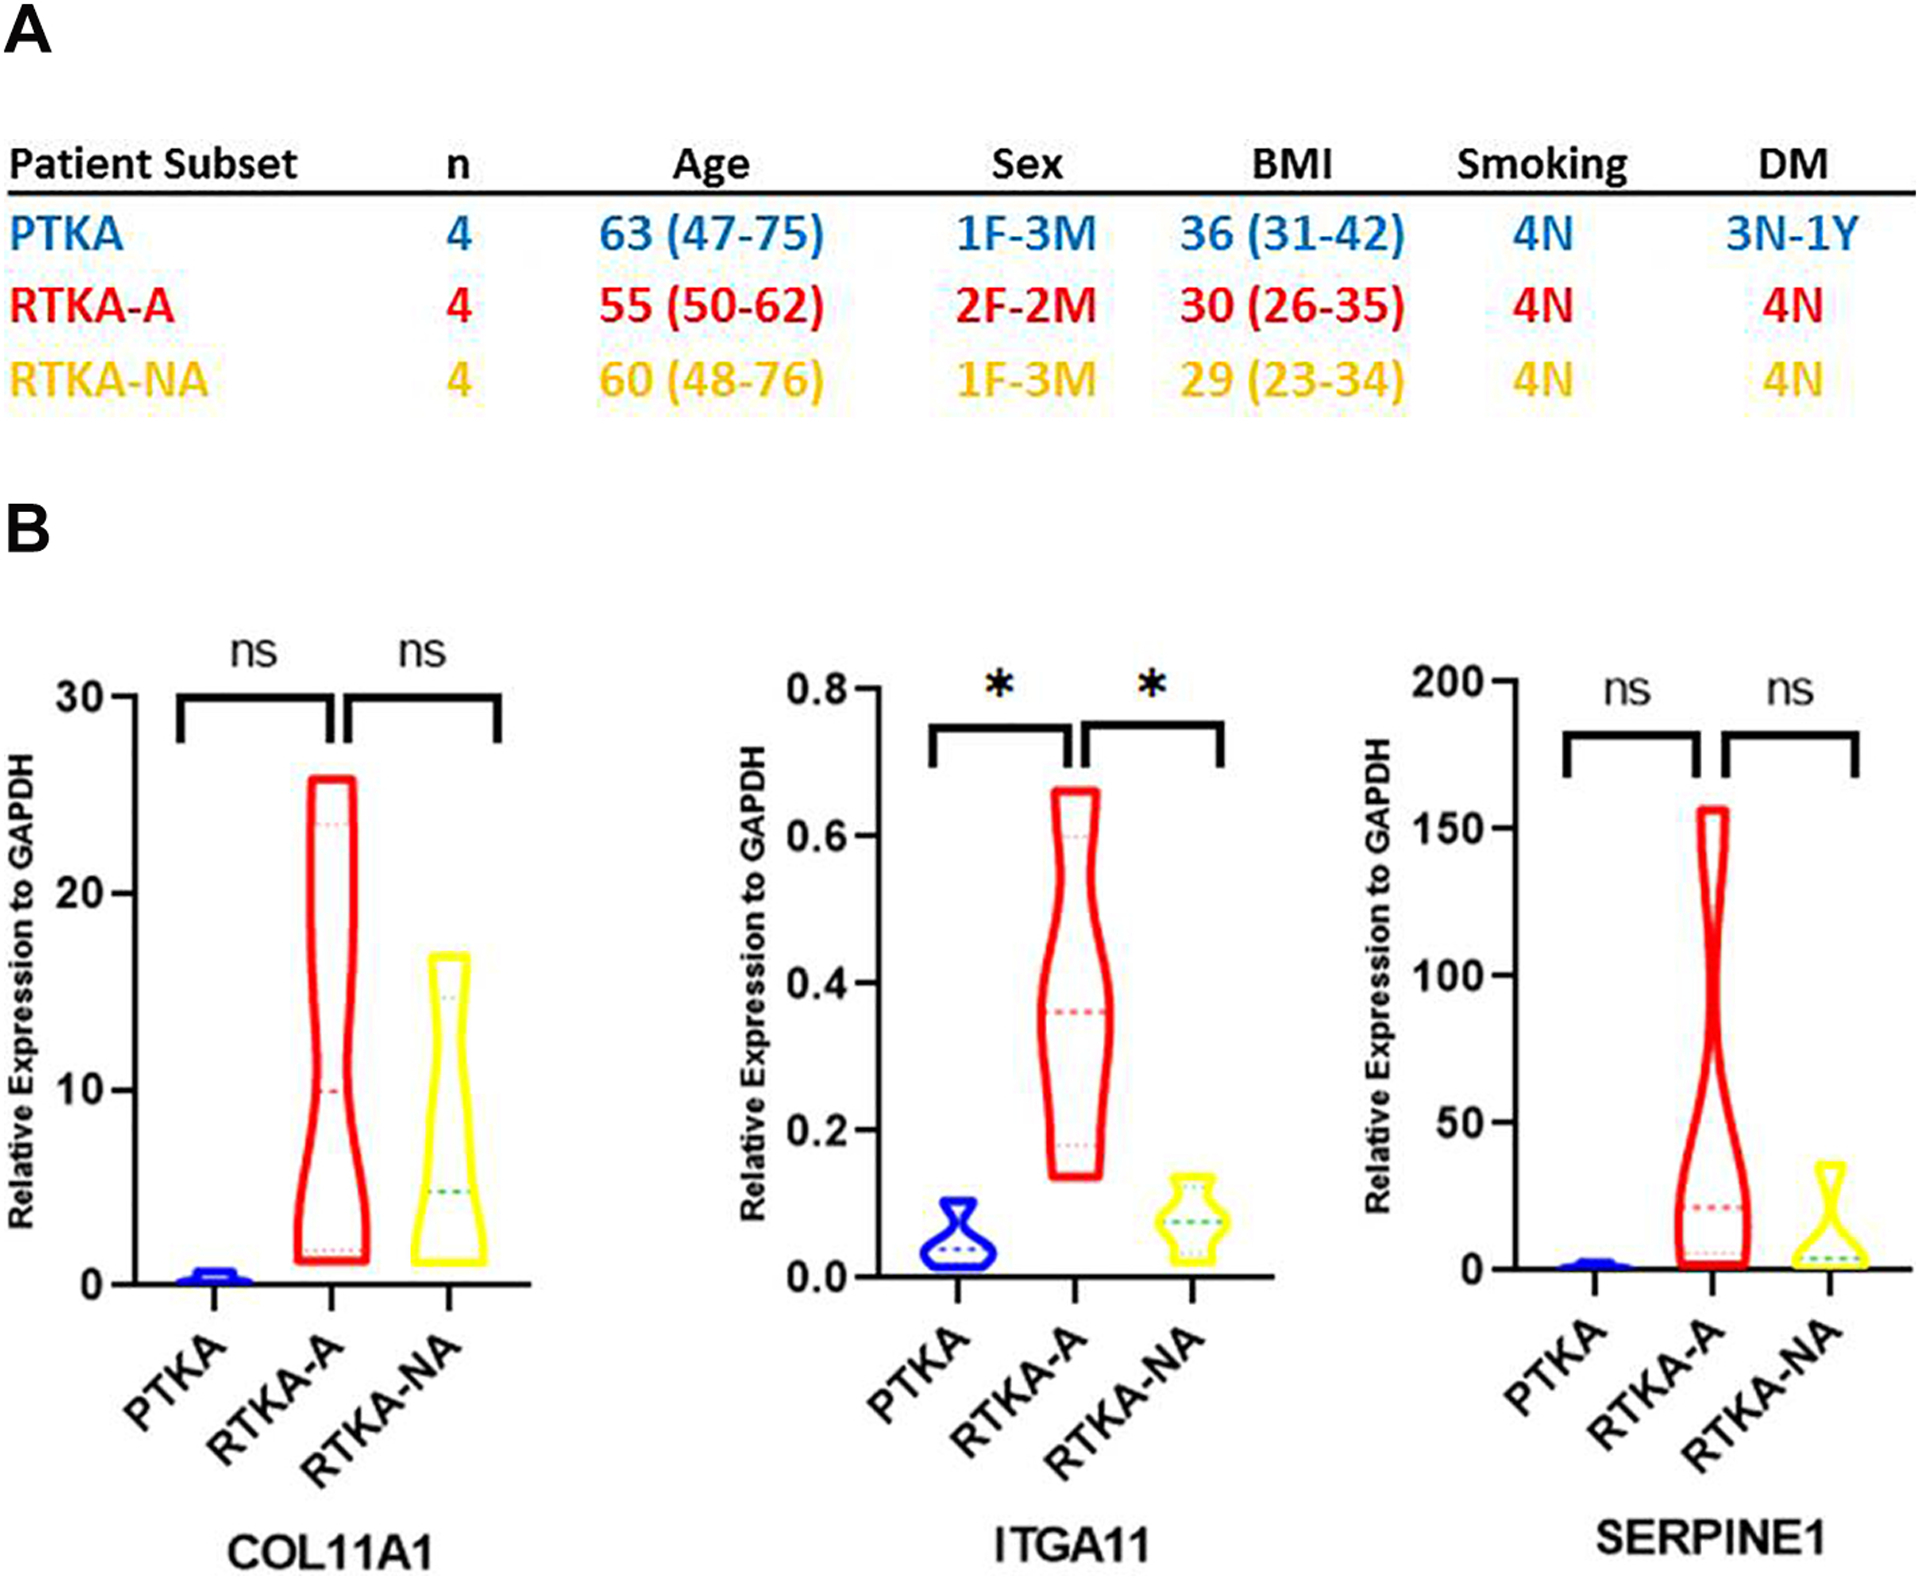
Characteristics of patient subset involved in DEGs qPCR analysis (A), Expression of selected up-regulated DEGs by quantitative PCR (qPCR) in another patient subset (B).
4. Discussion
4.1. Strategy for definition of a specific transcriptome in capsular tissues of arthrofibrosis patients
This study aimed to define knee arthrofibrosis-specific gene expression signatures by establishing which genes are selectively up-regulated in knee arthrofibrosis patients compared to two groups of surgically-appropriate control patients. Ideally, longitudinal sampling of posterior capsular tissues from the same cohort of patients undergoing knee arthroplasty and developing arthrofibrosis represents an optimal method for defining the specific temporal changes that occur during disease progression. However, this sampling method is clinically unrealistic since it would require repeat procedures at multiple temporal intervals that would be unethical. In addition, because only a subset of patients develops arthrofibrosis, the theoretically ideal specimen collection strategy would require removal of healthy capsular tissue from unaffected patients. Therefore, for pragmatic reasons our study relied on two different comparisons that accounted for two distinct types of biological variation after TKA. The first comparison examined patients with primary TKAs with those who undergo revision TKA due to arthrofibrosis (i.e., PTKA and RTKA-A). This comparison is a proxy for the ideal longitudinal analysis, but in essence compares osteoarthritic patients without an implant with arthrofibrosis patients many months to years after receiving a TKA. The second analysis compared patients undergoing revision TKA due to arthrofibrosis with others undergoing revision TKA for aseptic, non-fibrotic causes (i.e., RTKA-A and RTKA-NA, respectively). The latter analysis examined a similar temporal relationship to the index procedure in that each group received an implant distant from their revision. Considering differences in the average time from PTKA to RTKA-A (5 years, range: 1–10 years) versus PTKA to RTKA-NA (7.5 years, range: 5–11 years), it appears that gene expression could be affected by the large range of the time points used for tissue collection. Taken together, the transcriptomes of differentially expressed genes defined in this study reflect the cellular phenotype of capsular joint tissues in clinically distinct patient populations undergoing surgery for three distinct indications and provides objective data that the biologic milieu of each of these patient groups is distinct even when the initial operative intervention is distant from the development of the disorder. Hierarchical clustering. principal component and correlation analyses of expressed genes in arthrofibrosis patients compared to two control groups revealed that expression patterns of all samples within each patient group are consistent within, but distinct between groups. Thus, transcriptomes of cells within capsular tissues isolated during primary or revision arthroplasty appear to reflect clinical differences in the specimens at the time of isolation during surgery.
4.2. Inflammatory gene expression signatures are prevalent in patients with primary total knee arthroplasty and have subsided in patients with arthrofibrosis
Tissue damage induces inflammation and activates different cell types of the innate and adaptive immune system depending on the type of injury [33]. Therefore, genes that modulate the immune system have important roles in the development of fibrosis. Remarkably, analysis of the 20 highest expressed genes in the three treatment groups revealed that the innate immune response gene C1QA, which belongs to the C1Q family (i.e., C1QA, C1QB and C1QC), is characteristic of PTKA and RTKA-NA patients but not RTKA-A patients. The C1QA gene plays a critical role in the initiation of the innate immune response pathways, and is actively expressed by macrophages, dendritic cells and mast cells [34]. The elevated presence of C1QA in the joints of PTKA or RTKA-NA patients is consistent with infiltrating macrophages during active inflammation while this inflammatory response has already subsided in RTKA-A patients. This result is consistent with the clinical observation that PTKA patients with osteoarthritis have inflamed and painful knees that require surgery.
4.3. Extracellular matrix organization genes are actively expressed in arthrofibrosis patients
Beyond our unbiased RNA-seq analysis of genes for characterization of the biological state of joint capsular tissue, pathway analysis revealed extracellular matrix organization genes in arthrofibrosis patients (RTKA-A) compared to non-arthrofibrotic patients (PTKA and RTKA-NA).
Collagen family members were the most remarkable among common extracellular matrix organization genes. COL1A1, COL3A1and COL6A1 are already known as characteristic extracellular markers of fibrosis, which were also shown in our study [35–38]. However with our results it is clear that other collagen types are also involved in arthrofibrosis development. Several previous studies have shown that other collagen types may also be involved in fibrosis development. For example, COL2A1 and COL5A3 have been observed as pathological components in the ECM in liver fibrosis, [39]. In a mice study, lack of COL8A1 has also been shown to reduce fibrosis [40]. Additionally, COL7A1 supports dermal fibroblast migration and is a critical player in physiological wound healing in mouse models [41]. Previous papers provided ideas about other collagen types in fibrosis development. However our RNA-seq data provide new evidence showing that multiple collagens may be involved in fibrosis, specifically in human knee tissues. Identifying all the genetic markers which contribute to arthrofibrosis will be important when designing antifibrotic therapies.
Integrins, which are a family of heterodimeric cell surface receptors, were the second remarkable family among the extracellular matrix organization genes. The role of integrins in fibrosis has been well established and are still recognized as viable therapeutic targets [42]. Integrins assist communication between the ECM, fibroblasts, and parenchymal cells, and as such are directly involved in the initiation and progression of fibrosis [43]. A group of five integrins, ITGA1, ITGA2, ITGA3, ITGA10 and ITGA11 have been described as binding to collagens, with some members also binding to other ECM molecules like laminin or fibronectin [44,45]. The pathological role of intergrins in arthrofibrisis is also reflected by results from our studies.
Another noticeable gene involved in our data is LOX, which is an extracellular amine oxidase that post-translationally modifies collagens and non-collagenous proteins (e.g., elastin) in the ECM, thereby catalyzing the covalent crosslinking of fibers [46]. It has also been shown as a promoter of epithelial to mesenchymal transition during pulmonary fibrosis [47]. Its potential role in arthrofibrosis development is suggested in our study, but remains to be further investigated.
SERPINE1 also has an important role during wound healing, higher levels of SERPINE1 inhibit uPA/tPA/plasmin and plasmin-dependent MMP activities, and, therefore, help accelerate wound healing. However, under pathologic conditions, higher SERPINE1 levels contribute to extra accumulation of collagen and other ECM proteins in the wound area, and thus conserve scarring [48]. Our data demonstrate higher levels of this gene in the RTKA-A group compared to the non-arthrofibrotic groups (PTKA and RTKA-NA).
The enhanced expression of classical fibrosis related genes affecting ECM formation, cell signaling and transcriptional control in RTKA-A patients is entirely consistent with the clinical diagnosis of these patients and the recommended surgery to relieve joint stiffness. Our data provides a unique overview of the multiplicity fibrotic genes involved in arthrofibrosis.
4.4. Caveats of RNA-seq analysis for phenotypic characterization of arthrofibrosis patients
Beyond our clear demonstration that three different patient groups exhibited distinct gene expression profiles consistent with their distinct clinical diagnoses, there are a number of limitations to our study. First, RNA-seq analysis is a very effective tool for establishing how tissues respond to different clinical conditions by elevating protein coding mRNAs. However, whether mRNAs produce the encoded proteins depends on translational mechanisms that are controlled in part by small non-coding RNAs (e.g., microRNAs) that are beyond the scope of this study. Additionally, we did not measure the specific stability or localization of proteins in posterior capsule cells; proteins transported to the site of action (e.g., secretion as ECM protein) would result in a mismatch between RNA-seq data and protein levels. Future studies should validate differentially expressed genes by immunohistochemistry or immunofluorescence microscopy.
Second, the tissues we isolated are not purely fibrotic, but heterogeneous surgical capsule specimens with blood vessels, adipose components and infiltrating immune cell types. Hence, RNA sequencing results provide combined information on both the expression of specific genes within a capsular fibroblastic cell type and the representation of this primary cell type relative to other non-fibroblastic cell types. Such non-fibroblastic cell types are either intrinsically associated with capsular tissue (e.g., adipocytes and endothelial cells), or represent extraneous cells (e.g., monocytes and macrophages) that infiltrated the tissue during repair or remodeling of the capsular tissue.
Third, sampling variation among surgeons may also have contributed to heterogeneity. Although orthopedic surgeons were given specific instructions prior to collection to optimize uniform sampling, subtle differences in anatomical location and harvesting procedures could affect the tissue distribution and quality of the specimens. To reduce harvesting and analysis complexities, we only focused on posterior capsule tissue RNA-seq analysis. It remains uncertain whether other joint tissues (e.g., suprapatellar pouch and quadriceps tendon) would exhibit molecular changes.
Fourth, there are clear limitations in sample selection, because tissue specimens from arthrofibrosis patients are rare and it is difficult to find matching samples for gender, age and co-morbidities. Therefore, it is not realistic to perform a longitudinal analysis of how human capsular tissues and corresponding gene expression signatures change following primary arthroplasty in the same individuals.
Regardless of the above limitations, our study on the transcriptomes of multiple arthrofibrosis patients compared to non-arthrofibrosis patients provided key insights into molecular phenotypes of joint capsular tissue at the highest level of RNA sequencing resolution currently available. We conclude that our current study increased our mechanistic understanding of arthrofibrosis and allowed for molecular phenotyping of arthrofibrosis. It is becoming increasingly apparent that arthrofibrosis may represent a polygenic disease and our datasets have identified novel targets for diagnosis and pharmacological treatment for arthrofibrosis patients that deserve further exploration.
Supplementary Material
Supplemental Table 1. Medical History of RNA-seq samples.
Supplemental Table 2. List of samples and contamination markers.
Supplemental Table 3. List of primers used for expression of selected up-regulated DEGs by quantitative PCR (qPCR) in another patient subset set.
Supplemental Table 4. Average RPKMs of top 20 highest expressed genes and fold change and p-values of unique highest expressed genes for each study group
Supplemental Table 5. List of DEGs identified for RTKA-A versus PTKA and RTKA-A versus RTKA-NA.
Supplemental Table 6. Pathway analysis list of up-regulated DEGs for RTKA-A versus PTKA and RTKA-A versus RTKA-NA and common GO term extracellular matrix organization genes identified for RTKA-A versus PTKA and RTKA-A versus RTKA-NA.
Supplemental Table 7. List of down-regulated DEGs determined by pathway analysis for RTKA-A versus PTKA and RTKA-A versus RTKA-NA and common GO term SRP-dependent co-translational protein targeting to membrane for RTKA-A versus PTKA and RTKA-A versus RTKA-NA.
Highlights.
Identify molecular phenotypes of joint capsular tissue.
Unique overview of the multiplicity fibrotic genes involved in arthrofibrosis.
Identify novel targets for diagnosis and pharmacological treatment for arthrofibrosis patients.
Acknowledgments
We thank all members of our laboratories, including Amel Dudakovic, Ph.D, Viktor Janz, M.D., Aaron R. Owen, M.D., Juan S. Vargas-Hernandez, M.D., and Travis W. Turner, B.S., for their enthusiastic support, stimulating discussions, and/or generous sharing of reagents, data, ideas and protocols. We also appreciate the administrative assistance of Marina S. Ganshina, B.S., and Sandra M. Passe. This study was pursued with the generous philanthropic support of Anna-Maria and Stephen Kellen Foundation (to M.P.A). This work was also supported in part by the National Institute of Arthritis and Musculoskeletal and Skin Diseases of the National Institutes of Health under award number R01 AR072597 (to M.P.A). Auxiliary support was provided by R01 AR049069 (to A.J.v.W) and the William H. and Karen J. Eby Foundation (to A.J.v.W). The content is solely the responsibility of the authors and does not necessarily represent the official views of the National Institutes of Health.
Footnotes
Publisher's Disclaimer: This is a PDF file of an unedited manuscript that has been accepted for publication. As a service to our customers we are providing this early version of the manuscript. The manuscript will undergo copyediting, typesetting, and review of the resulting proof before it is published in its final form. Please note that during the production process errors may be discovered which could affect the content, and all legal disclaimers that apply to the journal pertain.
Availability of data and materials
RNA-seq data were deposited in the Gene Expression Omnibus of the National Institute for Biotechnology Information (GSE135854).
Competing interests
Mark E. Morrey’s disclosures include Tenex. Joaquin Sanchez-Sotelo’s disclosures include Acumed LLC, AAOS, ASES, Elsevier, Exactech Inc, JOOT, JOSEA, JOSES, Oxford University Press, Stryker, Wright Medical Technology. Daniel J. Berry’s disclosures include Bodycad, DePuy, Elsevier, IHS, Hip and Knee Society, JBJS, Mayo Clinic Board of Governors, Wolters Kluwer Health - Lippincott Williams & Wilkins. Matthew P. Abdel’s disclosures include AAHKS, ICJR, BJJ, MOS, Springer, and Stryker. No other authors have conflicts of interest to disclosure.
References
- 1.Cheuy VA, Foran JRH, Paxton RJ, Bade MJ1, Zeni JA, Stevens-Lapsley JE, Arthrofibrosis Associated With Total Knee Arthroplasty, J Arthroplasty 32 (2017) 2604–2611 [DOI] [PubMed] [Google Scholar]
- 2.Sanders T, Kremers H, Bryan A, Kremers W, Stuart M, Krych A, Procedural intervention for arthrofibrosis after ACL reconstruction: trends over two decades, Knee Surg Sports Traumatol Arthrosc 25 (2017) 532–537 [DOI] [PMC free article] [PubMed] [Google Scholar]
- 3.Black DW, Treatment of Knee Arthrofibrosis and Quadriceps Insufficiency after Patellar Tendon Repair: A Case Report Including Use of the Graston Technique ,Int J Ther Massage Bodywork 3 (2010) 14–21 [PMC free article] [PubMed] [Google Scholar]
- 4.Magit D, Wolff A, Sutton K, Medvecky MJ, Arthrofibrosis of the knee, J Am Acad Orthop Surg 15 (2007) 682–694 [DOI] [PubMed] [Google Scholar]
- 5.Campbell TM, Trudel G, Wong KK, Laneuville O, Genome wide gene expression analysis of the posterior capsule in patients with osteoarthritis and knee flexion contracture, J Rheumatol 41 (2014) 2232–2239 [DOI] [PubMed] [Google Scholar]
- 6.Faust I, Traut P, Nolting F, Petschallies J, Neumann E, Kunisch E, Kuhn J, Knabbe C, Hendig D, Human xylosyltransferases–mediators of arthrofibrosis? New pathomechanistic insights into arthrofibrotic remodeling after knee replacement therapy, Sci Rep 5 (2015) 12537. [DOI] [PMC free article] [PubMed] [Google Scholar]
- 7.Rutherford RW, Jennings JM, Levy DL, Parisi TJ, Martin JR, Dennis DA, Revision Total Knee Arthroplasty for AF , J Arthroplasty 33(2018) S177–S181 [DOI] [PubMed] [Google Scholar]
- 8.Tibbo ME, , Limberg AK, Salib CG,MD, Ahmed AT, van Wijnen AJ, Berry DJ, Abdel MP, Acquired Idiopathic Stiffness After Total Knee Arthroplasty A Systematic Review and Meta-Analysis, J Bone Joint Surg Am 101 (2019) 1320–1330 [DOI] [PMC free article] [PubMed] [Google Scholar]
- 9.Gillespie J, Friedland J, Dehaven K, Arthrofibrosis: Etiology, classification, histopathology, and treatment, Oper Tech Sports Med 6 (1998) 102–110 [Google Scholar]
- 10.Sharkey PF, Lichstein PM, Shen C, Tokarski AT, Parvizi J, Why are total knee arthroplasties failing today-has anything changed after 10 years?, J Arthroplasty 29 (2014) 1774–1778 [DOI] [PubMed] [Google Scholar]
- 11.Hasan S, Saleem A, Bach B, Bush-Joseph C, Bojchuk J, Results of arthroscopic treatment of symptomatic loss of extension following anterior cruciate ligament reconstruction, Am J Knee Surg 13 (2000) 201–209 [PubMed] [Google Scholar]
- 12.Abdel MP, von Roth P, Cross WW, Berry DJ, Trousdale RT, Lewallen DG, Total Knee Arthroplasty in Patients With a Prior Tibial Plateau Fracture: A Long-Term Report at 15 Years, J Arthroplasty 12 (2015) 2170–2172 [DOI] [PubMed] [Google Scholar]
- 13.Gandhi R, de Beer J, Leone J, Petruccelli D, Winemaker M, Adili A, Predictive risk factors for stiff knees in total knee arthroplasty, J Arthroplasty 1 (2006) 46–52 [DOI] [PubMed] [Google Scholar]
- 14.Thompson R, Novikov D, Cizmic Z, Feng JE, Fideler K, Sayeed Z, Meftah M, Anoushiravani AA, Schwarzkopf R, Arthrofibrosis After Total Knee Arthroplasty: Pathophysiology, Diagnosis, and Management, Orthop Clin North Am 3 (2019) 269–279 [DOI] [PubMed] [Google Scholar]
- 15.Newman ET, Herschmiller TA, Attarian DE, Vail TP, Bolognesi MP, Wellman SS, Risk Factors, Outcomes, and Timing of Manipulation Under Anesthesia After Total Knee Arthroplasty, J Arthroplasty 1 (2018) 245–249 [DOI] [PubMed] [Google Scholar]
- 16.Werner BC, Carr JB, Wiggins JC, Gwathmey FW, Browne JA, Manipulation Under Anesthesia After Total Knee Arthroplasty is Associated with An Increased Incidence of Subsequent Revision Surgery, J Arthroplasty 9 (2015) 72–75 [DOI] [PubMed] [Google Scholar]
- 17.Schiavone Panni A, Cerciello S, Vasso M, Tartarone M, Stiffness in total knee arthroplasty, J Orthop Traumatol 3 (2009) 111–118 [DOI] [PMC free article] [PubMed] [Google Scholar]
- 18.Scranton PE, Management of knee pain and stiffness after total knee arthroplasty, J Arthroplasty 16 (2001) 428–435 [DOI] [PubMed] [Google Scholar]
- 19.Morrey ME, Abdel MP, Riester SM, Dudakovic A, van Wijnen AJ, Morrey BF, Sanchez-Sotelo J, Molecular landscape of arthrofibrosis: Microarray and bioinformatic analysis of the temporal expression of 380 genes during contracture genesis, Gene 610 (2017) 15–23 [DOI] [PubMed] [Google Scholar]
- 20.Freeman TA, Parvizi J, Della Valle CJ, Steinbeck MJ, Reactive oxygen and nitrogen species induce protein and DNA modifications driving arthrofibrosis following total knee arthroplasty, Fibrogenesis Tissue Repair 13 (2009) 5. [DOI] [PMC free article] [PubMed] [Google Scholar]
- 21.Abdel MP, Morrey ME, Barlow JD, Kreofsky JR, An KN, Steinmann SP, Morrey BF, Sanchez-Sotelo J, Myofibroblast Cells are Preferentially Expressed Early in a Rabbit Model of Joint Contracture, J Orthop Res 5 (2012) 713–719 [DOI] [PubMed] [Google Scholar]
- 22.Haller JM, Holt DC, Mcfadden ML, Higgins TF, Kubiak EN, Mcfadden ML, Arthrofibrosis of the knee following a fracture of the tibial plateau, Bone Joint J 9797 (2015) 109–114 [DOI] [PubMed] [Google Scholar]
- 23.Su EP, Su SL, The stiff total knee replacement: evaluation and treatment Semin Arthroplasty, 24 (2013) 142–148 [Google Scholar]
- 24.Watson RS, Gouze E, Levings PP, Bush ML, Kay JD, Jorgensen MS, Dacanay EA, Reith JW, Wright TW, Ghivizzani SC, Gene delivery of TGF-beta1 induces arthrofibrosis and chondrometaplasia of synovium in vivo, Lab Invest 90 (2010) 1615–1627 [DOI] [PMC free article] [PubMed] [Google Scholar]
- 25.Lewallen EA, Salib CG, Trousdale WH, Berry CE, Hanssen GM, Robin JX, Tibbo ME, Viste A, Reina N, Morrey ME, Sanchez-Sotelo J, Hanssen AD, Berry DJ, van Wijnen AJ, Abdel MP, Molecular pathology of total knee arthroplasty instability defined by RNA-seq, Genomics 110 (2017) 247–256 [DOI] [PMC free article] [PubMed] [Google Scholar]
- 26.Paradise CR, Galeano-Garces C, Galeano-Garces D, Dudakovic A, Milbrandt TA, Saris DBF, Krych AJ, Karperien M, Ferguson GB, Evseenko D, Riester SM, van Wijnen AJ, Larson AN, Molecular characterization of physis tissue by RNA sequencing, Gene 668 (2018) 87–96 [DOI] [PMC free article] [PubMed] [Google Scholar]
- 27.Vukmirovic M, Herazo-Maya JD, Blackmon J, Skodric-Trifunovic V, Jovanovic D, Pavlovic S, Stojsic J, Zeljkovic V, Yan X, Homer R, Stefanovic B, Kaminski N, Identification and validation of differentially expressed transcripts by RNA-sequencing of formalin-fixed, paraffin-embedded (FFPE) lung tissue from patients with Idiopathic Pulmonary Fibrosis, BMC Pulmonary Medicine 17 (2017) 15. [DOI] [PMC free article] [PubMed] [Google Scholar]
- 28.Kalari KR, Nair AA, Bhavsar JD, O’Brien DR, Davila JI, Bockol MA, Nie J, Tang X, Baheti S, Doughty JB, Middha S, Sicotte H, Thompson AE, Asmann YW, Kocher JP, MAP-RSeq: Mayo Analysis Pipeline for RNA sequencing, BMC Bioinformatics 15 (2014) 224. [DOI] [PMC free article] [PubMed] [Google Scholar]
- 29.Metsalu T, Vilo J, ClustVis: a web tool for visualizing clustering of multivariate data using principal Component Analysis and heatmap, Nucleic Acids Research, 43 (2015) W566–W570 [DOI] [PMC free article] [PubMed] [Google Scholar]
- 30.McCarthy DJ, Chen Y, Smyth GK, Differential expression analysis of multifactor RNA-Seq experiments with respect to biological variation, Nucleic Acids Research 40 (2012) 4288–4297 [DOI] [PMC free article] [PubMed] [Google Scholar]
- 31.Kuleshov MV, Jones MR, Rouillard AD, Fernandez NF, Duan Q, Wang Z, Koplev S, Jenkins SL, Jagodnik KM, Lachmann A, McDermott MG, Monteiro CD, Gundersen GW, Ma’ayan A, Enrichr: a comprehensive gene set enrichment analysis web server 2016 update, Nucleic Acids Research 44 (2016) W90–W97 [DOI] [PMC free article] [PubMed] [Google Scholar]
- 32.Szklarczyk D, Morris JH, Cook H, Kuhn M, Wyder S, Simonovic M, Santos A, Doncheva NT, Roth A, Bork P, Jensen LJ, von Mering C, The STRING database in 2017: quality-controlled protein-protein association networks, made broadly accessible, Nucleic Acids Research 45 (2017) D362–D368 [DOI] [PMC free article] [PubMed] [Google Scholar]
- 33.Matthias M, Inflammation and fibrosis, Matrix Biology 68–69 (2018) 106–121 [DOI] [PubMed] [Google Scholar]
- 34.Botto M, Walport MJ, C1q, Autoimmunity and Apoptosis, Immunobiol 205 (2002) 395–406 [DOI] [PubMed] [Google Scholar]
- 35.Theocharidis G, Drymoussi Z, Kao AP, Barber AH, Lee DA, Braun KM, Connelly JT, Type VI Collagen Regulates Dermal Matrix Assembly and Fibroblast Motility, J Invest Dermatol 136 (2016) 74–83 [DOI] [PubMed] [Google Scholar]
- 36.Tao R, Fan XX, Yu HJ, Ai G, Zhang HY, Kong HY, Song QQ, Huang Y, Huang JQ, Ning Q, MicroRNA-29b-3p prevents Schistosoma japonicum-induced liver fibrosis by targeting COL1A1 and COL3A1, J Cell Biochem 119 (2018) [DOI] [PubMed] [Google Scholar]
- 37.Samokhin AO, Stephens T, Wertheim BM, Wang RS, Vargas SO, Yung LM, Cao M, Brown M, Arons E, Dieffenbach PB, Fewell JG, Matar M, Bowman FP, Haley KJ, Alba GA, Marino SM, Kumar R, Rosas IO, Waxman AB, Oldham WM, Khanna D, Graham BB, Seo S, Gladyshev VN, Yu PB, Fredenburgh LE, Loscalzo J, Leopold JA, Maron BA, NEDD9 targets COL3A1 to promote endothelial fibrosis and pulmonary arterial hypertension, Sci Transl Med 10 (2018) [DOI] [PMC free article] [PubMed] [Google Scholar]
- 38.Kuivaniemi H, Tromp G, Type III collagen (COL3A1): Gene and protein structure, tissue distribution, and associated diseases, Gene 707 (2019) 151–171 [DOI] [PMC free article] [PubMed] [Google Scholar]
- 39.Baiocchini A, Montaldo C, Conigliaro A, Grimaldi A, Correani V, Mura F, Ciccosanti F, Rotiroti N, Brenna A, Montalbano M, D’Offizi G, Capobianchi MR, Alessandro R, Piacentini M, Schininà ME, Maras B, Del Nonno F, Tripodi M, Mancone C, Extracellular Matrix Molecular Remodeling in Human Liver Fibrosis Evolution, PLoS One 11(3) (2016) e0151736. [DOI] [PMC free article] [PubMed] [Google Scholar]
- 40.Skrbic B, Engebretsen KVT, Strand ME, Lunde IG, Herum KM, Marstein HS, Sjaastad I, Lunde PK, Carlson CR, Christensen G, Bjørnstad JL, Tønnessen T, Lack of collagen VIII reduces fibrosis and promotes early mortality and cardiac dilatation in pressure overload in mice Cardiovascular Research 106 (2015) 32–42 [DOI] [PubMed] [Google Scholar]
- 41.Nyström A, Velati D, Mittapalli VR, Fritsch A, Kern JS, Bruckner-Tuderman L, Collagen VII plays a dual role in wound healing, J Clin Invest 123(8) (2013) 3498–3509 [DOI] [PMC free article] [PubMed] [Google Scholar]
- 42.Schnittert J, Bansal R, Storm G, Prakash J, Integrins in wound healing, fibrosis and tumor stroma: High potential targets for therapeutics and drug delivery, Advanced Drug Delivery Reviews 129 (2018) 7–53 [DOI] [PubMed] [Google Scholar]
- 43.Conroy EKP, Kitto LJ, Henderson NC, αv integrins: key regulators of tissue fibrosis, Cell Tissue Research, 365 (2016) 511–519 [DOI] [PMC free article] [PubMed] [Google Scholar]
- 44.Huan Bian,1,2,5 Xiaowei Nie,3,5 Xin Bu,2,5 Feng Tian,4 Libo Yao,2 Jingyu Chen,3 and Jin Sucorresponding author1,2 The pronounced high expression of discoidin domain receptor 2 in human interstitial lung diseases ERJ Open Res. 2018. January; 4(1): 00138–2016 [DOI] [PMC free article] [PubMed] [Google Scholar]
- 45.Eckes B, Zigrino P, Kessler D, Holtkötter O, Shephard P, Mauch C, Krieg T, Fibroblast-matrix interactions in wound healing and fibrosis, Matrix Biology 19 (4) (2000) 325–332 [DOI] [PubMed] [Google Scholar]
- 46.Cox Thomas R., Bird Demelza, Baker Ann-Marie, Barker Holly E., Ho Melisa W-Y., Lang Georgina, and Erler Janine T., LOX-Mediated Collagen Crosslinking Is Responsible for Fibrosis-Enhanced Metastasis, Cancer Research 73 (6) (2013) 1721–1732 [DOI] [PMC free article] [PubMed] [Google Scholar]
- 47.Jinfeng Wang J, Zhu Ya Tan J,a Meng X,,a Xiea H, Wang R, Lysyl oxidase promotes epithelial-to-mesenchymal transition during paraquat-induced pulmonary fibrosis Mol. BioSyst 12, (2016)12499–507 [DOI] [PubMed] [Google Scholar]
- 48.Ghosh AK1, Vaughan DE. PAI-1 in tissue fibrosis. J Cell Physiol. 2012. February;227(2):493–507 [DOI] [PMC free article] [PubMed] [Google Scholar]
Associated Data
This section collects any data citations, data availability statements, or supplementary materials included in this article.
Supplementary Materials
Supplemental Table 1. Medical History of RNA-seq samples.
Supplemental Table 2. List of samples and contamination markers.
Supplemental Table 3. List of primers used for expression of selected up-regulated DEGs by quantitative PCR (qPCR) in another patient subset set.
Supplemental Table 4. Average RPKMs of top 20 highest expressed genes and fold change and p-values of unique highest expressed genes for each study group
Supplemental Table 5. List of DEGs identified for RTKA-A versus PTKA and RTKA-A versus RTKA-NA.
Supplemental Table 6. Pathway analysis list of up-regulated DEGs for RTKA-A versus PTKA and RTKA-A versus RTKA-NA and common GO term extracellular matrix organization genes identified for RTKA-A versus PTKA and RTKA-A versus RTKA-NA.
Supplemental Table 7. List of down-regulated DEGs determined by pathway analysis for RTKA-A versus PTKA and RTKA-A versus RTKA-NA and common GO term SRP-dependent co-translational protein targeting to membrane for RTKA-A versus PTKA and RTKA-A versus RTKA-NA.


