

Abstract
Background:
Hyperuricemia is common in patients with type 2 diabetes mellitus and is known to cause gout. Sodium–glucose cotransporter-2 (SGLT2) inhibitors prevent glucose reabsorption and lower serum uric acid levels.
Objective:
To compare the rate of gout between adults prescribed an SGLT2 inhibitor and those prescribed a glucagon-like peptide-1 (GLP1) receptor agonist.
Design:
Population-based new-user cohort study.
Setting:
A U.S. nationwide commercial insurance database from March 2013 to December 2017.
Patients:
Persons with type 2 diabetes newly prescribed an SGLT2 inhibitor were 1:1 propensity score matched to patients newly prescribed a GLP1 agonist. Persons were excluded if they had a history of gout or had received gout-specific treatment previously.
Measurements:
The primary outcome was a new diagnosis of gout. Cox proportional hazards regression was used to estimate hazard ratios (HRs) of the primary outcome and 95% CIs.
Results:
The study identified 295 907 adults with type 2 diabetes mellitus who were newly prescribed an SGLT2 inhibitor or a GLP1 agonist. The gout incidence rate was lower among patients prescribed an SGLT2 inhibitor (4.9 events per 1000 person-years) than those prescribed a GLP1 agonist (7.8 events per 1000 person-years), with an HR of 0.64 (95% CI, 0.57 to 0.72) and a rate difference of −2.9 (95% CI, −3.6 to −2.1) per 1000 person-years.
Limitation:
Unmeasured confounding, missing data (namely incomplete laboratory data), and low baseline risk for gout.
Conclusion:
Adults with type 2 diabetes prescribed an SGLT2 inhibitor had a lower rate of gout than those prescribed a GLP1 agonist. Sodium–glucose cotransporter-2 inhibitors may reduce the risk for gout among adults with type 2 diabetes mellitus, although future studies are necessary to confirm this observation.
ToC Summary
Sodium–glucose cotransporter-2 (SGLT2) inhibitors block the reabsorption of glucose in the kidneys, resulting in glucosuria and increased excretion of uric acid. The association between SGLT2 inhibitor use and risk for gout is unclear. This analysis of health insurance claims data compares the risk for gout with use of SGLT2 inhibitors versus another second-line medication for type 2 diabetes mellitus.
Gout, the most common form of inflammatory arthritis, affects nearly 10 million adults across North America (1, 2). It is associated with considerable disability, morbidity, and mortality. For example, adults with gout have an appoximately 30% higher rate of cardiovascular disease and all-cause mortality compared with adults who do not have gout (3, 4). Gout may be prevented through diet and lifestyle modification, although many patients who have gout require long-term pharmacologic therapy (2, 5). Allopurinol and febuxostat may effectively reduce the risk for subsequent gouty attacks; however, a recent randomized trial demonstrated an association between febuxostat and a higher risk for cardiovascular death and all-cause mortality compared with allopurinol (6). This finding places added importance on identifying other medications that help reduce the risk for gout. Such medications are particularly relevant for adults with diabetes mellitus, who are at increased risk not only for gout but also for cardiovascular disease (7, 8).
Sodium–glucose cotransporter-2 (SGLT2) inhibitors block the reabsorption of glucose at the proximal convoluted tubule and are one of the most effective classes of medications for adults with type 2 diabetes mellitus (9, 10). The glycosuria that results from SGLT inhibition causes uric acid to be secreted into the urine. In the cardiovascular outcome trial for the SGLT2 inhibitor empagliflozin, patients randomly assigned to receive empagliflozin had a serum uric acid level approximately 30 μmol/L lower than those assigned to the placebo group by the end of the study (8). A recent meta-analysis of more than 60 000 patients demonstrated that adults randomly assigned to receive an SGLT2 inhibitor had a 37-μmol/L lower serum uric acid level than those assigned to receive a placebo or comparator medication (11). By comparison, another study demonstrated that glucagon-like peptide-1 (GLP1) agonists do not reduce uric acid levels compared with placebo or comparator medication (12).
Although SGLT2 inhibitors lower serum uric acid levels, their effect on reducing gout risk is unknown. The meta-analysis of SGLT2 inhibitor trials primarily included adults with normal uric acid levels at baseline, so whether the observed reduction in serum uric acid with SGLT2 inhibitors is clinically meaningful is unclear (11). If SGLT2 inhibitors are found to lower the risk for gout, they may be the ideal treatment for patients with diabetes who are at high risk for gout, because SGLT2 inhibitors also reduce the risk for cardiovascular mortality and, potentially, all-cause mortality. The objective of this study was to compare the gout rate between adults with type 2 diabetes prescribed an SGLT2 inhibitor and those prescribed a GLP1 agonist.
Methods
Study Population
We conducted a population-based new-user cohort study using the health care claims database IBM MarketScan (13). The database contains longitudinal, individual-level data on health care use, inpatient and outpatient diagnoses, diagnostic tests and procedures, outpatient laboratory results (for a subset of patients), and pharmacy dispensing of medications. Most adults within MarketScan receive their health coverage through an employer-based health plan.
We compared adults with type 2 diabetes mellitus newly prescribed an SGLT2 inhibitor or a GLP1 agonist between 29 March 2013 (date the first SGLT2 inhibitor was approved) and 31 December 2017 (last available data). Patients with type 2 diabetes mellitus were identified by using codes from the International Classification of Diseases, Ninth Revision (ICD-9) and 10th Revision (ICD-10). Patients required at least 1 diagnosis code for type 2 diabetes mellitus (Supplement Table 1, available at Annals.org). A systematic review of validation studies determined that the positive predictive value of using ICD-9 and ICD-10 codes to identify adults with type 2 diabetes mellitus ranges from 71% to 96% (14). Because our study required not only a diagnosis of type 2 diabetes mellitus but also a prescription for a diabetes medication on the index date, we anticipate that the positive predictive value is likely to be improved. Cohort entry date was the date of the first prescription for an SGLT2 inhibitor or a GLP1 agonist. New users were defined as those without a prescription for either drug class in the preceding 180 days. Glucagon-like peptide-1 agonists were chosen as the comparator because they are also a second-line treatment for diabetes and have cardiovascular benefits similar to those of SGLT2 inhibitors, but do not reduce serum uric acid levels (12, 15).
Patients prescribed both an SGLT2 inhibitor and a GLP1 agonist on the cohort entry date were excluded. Patients required at least 180 days of continuous health plan enrollment before the index date; this period is referred to as the baseline. Patients were excluded if they had any of the following characteristics during the 180-day baseline: HIV, end-stage renal disease requiring dialysis, cancer, type 1 diabetes, lack of drug coverage, a diagnosis of gout, or a prescription fill for a gout-specific medication (such as colchicine, allopurinol, febuxostat, probenecid, or pegloticase). Patients with a history of gout were excluded to reduce the risk for potential confounding by indication. In a sensitivity analysis, we assessed the risk for gout by using a different comparator medication (dipeptidyl peptidase-4 [DPP4] inhibitors). These drugs were selected because they are one of the most commonly prescribed second-line medications for adults with diabetes, and they do not lower serum uric acid levels (16).
The Brigham and Women’s Hospital Institutional Review Board provided ethics approval, and valid data use agreements were in place.
Cohort Follow-up
Follow-up began the day after cohort entry (date of first prescription) and continued until the end of the study period, end of continuous health plan enrollment, occurrence of a study outcome, discontinuation of the initial medication (or switching to or addition of the comparator medication), or death. A medication was considered discontinued if 60 days elapsed after the expiration date of the last prescription’s supply without the prescription being refilled.
Study Outcome
The primary outcome was incident gout on the basis of an inpatient diagnosis of gout or an outpatient diagnosis of gout in addition to a prescription claim for a medication used to treat gout up to 14 days after its diagnosis (Supplement, available at Annals.org). The diagnostic codes for gout are commonly used in observational studies, and prior validation studies demonstrated that these codes accurately identify patients with gout (positive predictive value, 60% to 99%) (17, 18).
Baseline Covariates
All covariates were assessed during the baseline. Data were collected for each patient on the basis of diagnoses and procedures recorded during health encounters, including chronic medical conditions (such as hypertension and cardiovascular disease), diabetes severity and control (including hemoglobin A1c levels and end-organ damage), risk factors for gout (such as chronic kidney disease and diuretic use), health care use (such as a recent hospitalization or an emergency room visit), antidiabetic medications (such as insulin and metformin), and non–diabetes-related medications. These covariates were selected a priori on the basis of previous literature, clinical experience, and expert opinion (19, 20).
Statistical Analysis
Propensity score matching was used to adjust for measured confounding. The probability of receiving an SGLT2 inhibitor versus a GLP1 agonist was calculated by using a multivariable logistic regression model that contained all baseline variables except hemoglobin A1c and creatinine levels, because neither was available for all patients. No other data were missing in our study. A caliper of 0.05 on the propensity scale was used for nearest-neighbor matching with a 1:1 ratio without replacement. Covariate balance between the matched cohorts was assessed by using standardized differences, with a value below 0.1 indicating negligible differences between groups (21).
After propensity score matching, proportional hazards models were used to estimate the hazard ratios (HRs) and 95% CIs of the primary outcome without further adjustments. A Kaplan–Meier plot was used to visualize the time to gout diagnosis separately, by group. An E-value was calculated to estimate the robustness of the HR of our primary outcome to unmeasured confounders (22). CIs for rate differences were computed by using the method of Rothman and colleagues (23).
Additional predefined sensitivity analyses included an analysis in which the censoring criteria of drug discontinuation or switching were removed and patients were followed for up to 365 days unless they reached the end of the study period, disenrolled, or died (“up to 1-year index medication exposure”); an assessment of the gout rate among patients with at least 365 days of available baseline data; an evaluation of the gout rate that used DPP4 inhibitors as the comparator; and an analysis of the rate of heart failure hospitalization as a positive control, because previous studies demonstrated a reduction in heart failure with SGLT2 inhibitors but not GLP1 agonists (8, 24–26). In a post hoc analysis, we also assessed the rate of the primary outcome across the following 6 subgroups: men, women, patients aged 60 years and younger, those older than 60 years, those with baseline diuretic use, and those with no baseline diuretic use. All analyses were conducted by using the validated Aetion platform V3.12 (27) and R, version 3.1.2 (The R Foundation).
Role of the Funding Source
This study was funded by internal resources in the Division of Pharmacoepidemiology and Pharmacoeconomics at Brigham and Women’s Hospital. The authors had complete control over the design, conduct, and analysis of the study and the decision to submit the manuscript for publication.
Results
We identified 295 907 patients who satisfied study inclusion and exclusion criteria (Figure 1). Before propensity score matching, 151 949 patients were newly prescribed an SGLT2 inhibitor and 143 958 were newly prescribed a GLP1 agonist. Nearly all the baseline characteristics were well balanced even before propensity score matching, with a few exceptions. Adults prescribed a GLP1 agonist were more likely to be women, to be prescribed insulin, and to have a diagnosis related to chronic kidney disease or obesity (Table 1 and Supplement Table 2, available at Annals.org). Adults prescribed an SGLT2 inhibitor were more likely to have received a DPP4 inhibitor previously and slightly less likely to have received a diuretic or to have seen an endocrinologist previously.
Figure 1.
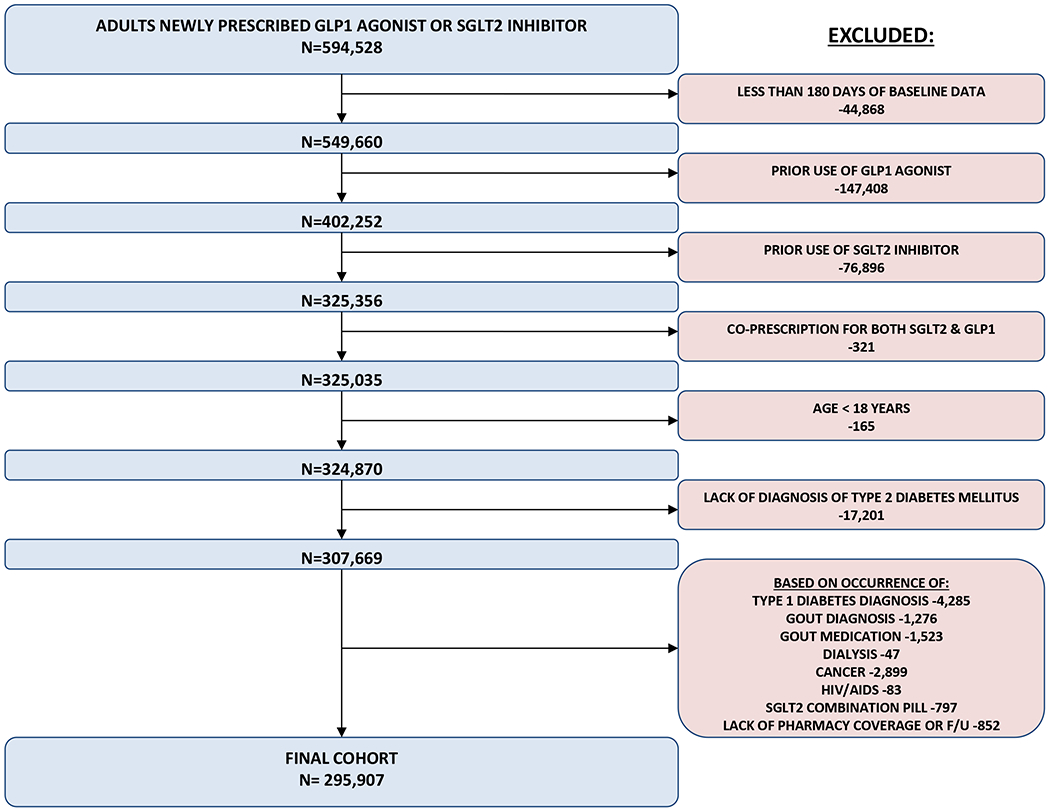
Cohort entry.
GLP1 = glucagon-like peptide 1, SGLT2 = sodium-glucose cotransporter 2 HIV = human immunodeficiency virus, AIDS = acquired immune deficiency syndrome. Gout medications included: allopurinol, febuxostat, pegloticase, probenecid, colchicine
Table 1.
Baseline Characteristics Before and After 1:1 Propensity Score Matching
| Characteristic | Before Matching | After Matching | ||||
|---|---|---|---|---|---|---|
| GLP1 Agonist | SGLT2 Inhibitor | Standardized Difference* | GLP1 Agonist | SGLT2 Inhibitor | Standardized Difference* | |
| Patients, n | 143 958 | 151 949 | – | 119 530 | 119 530 | – |
| Female, n (%) | 79 738 (55.4) | 68 331 (45.0) | 0.21 | 57 580 (51.7) | 57 953 (52.0) | 0.01 |
| Mean age (SD), y | 54.04 (10.29) | 54.62 (9.73) | 0.058 | 54.23 (10.08) | 54.22 (9.85) | 0.002 |
| Mean hemoglobin A1c level (SD), %† | 8.6 (1.9) | 8.6 (1.8) | 0.038 | 8.6 (1.92) | 8.7 (1.84) | 0.048 |
| Mean creatinine level (SD), mg/dL†‡ | 0.91 (0.29) | 0.89 (0.22) | 0.063 | 0.90 (0.26) | 0.88 (0.23) | 0.088 |
| Comorbid conditions, n (%) | ||||||
| Diabetic retinopathy | 6917 (4.8) | 6667 (4.4) | 0.02 | 5437 (4.5) | 5309 (4.4) | 0.005 |
| Diabetic neuropathy | 17 937 (12.5) | 16 060 (10.6) | 0.059 | 13 674 (11.4) | 13 602 (11.4) | 0.002 |
| Diabetic nephropathy | 9501 (6.6) | 6751 (4.4) | 0.095 | 6190 (5.2) | 6024 (5.0) | 0.006 |
| Cerebral vascular disease | 1885 (1.3) | 1763 (1.2) | 0.014 | 1473 (1.2) | 1440 (1.2) | 0.003 |
| Coronary artery disease | 13 886 (9.6) | 14 234 (9.4) | 0.009 | 11 092 (9.3) | 11 077 (9.3) | 0 |
| Hypertension | 96 972 (67.4) | 104 368 (68.7) | 0.028 | 80 946 (67.7) | 80 862 (67.6) | 0.002 |
| Dyslipidemia | 94 285 (65.5) | 104 955 (69.1) | 0.076 | 80 005 (66.9) | 79 826 (66.8) | 0.003 |
| Smoking | 6837 (4.7) | 7164 (4.7) | 0.002 | 5603 (4.7) | 5604 (4.7) | 0 |
| Heart failure | 3672 (2.6) | 2903 (1.9) | 0.043 | 2578 (2.2) | 2502 (2.1) | 0.004 |
| Obstructive sleep apnea | 19 989 (13.9) | 15 324 (10.1) | 0.117 | 14 194 (11.9) | 13 979 (11.7) | 0.006 |
| Obesity or overweight | 43 366 (30.1) | 35 052 (23.1) | 0.16 | 31 609 (26.4) | 31 579 (26.4) | 0.001 |
| Chronic kidney disease | 4483 (3.1) | 1743 (1.1) | 0.137 | 1961 (1.6) | 1732 (1.4) | 0.016 |
| Diabetes medications, n (%) | ||||||
| Metformin | 92 918 (64.5) | 91 741 (60.4) | 0.086 | 75 495 (63.2) | 75 900 (63.5) | 0.007 |
| Sulfonylurea | 43 982 (30.6) | 50 862 (33.5) | 0.063 | 37 926 (31.7) | 38 062 (31.8) | 0.002 |
| DPP4 inhibitor | 21 916 (15.2) | 31 776 (20.9) | 0.148 | 20 281 (17.0) | 20 180 (16.9) | 0.002 |
| Insulin | 43 510 (30.2) | 31 980 (21.0) | 0.211 | 30 193 (25.3) | 30 053 (25.1) | 0.003 |
| Other medications, n (%) | ||||||
| Statin | 84 283 (58.5) | 91 302 (60.1) | 0.031 | 70 436 (58.9) | 70 350 (58.9) | 0.001 |
| Diuretic | 28 170 (19.6) | 23 017 (15.1) | 0.117 | 20 509 (17.2) | 20 455 (17.1) | 0.001 |
| Oral steroid | 15 453 (10.7) | 14 283 (9.4) | 0.044 | 12 012 (10.0) | 12 053 (10.1) | 0.001 |
| Anti-inflammatory medication§ | 28 291 (19.7) | 28 078 (18.5) | 0.03 | 22 967 (19.2) | 22 988 (19.2) | 0 |
| Health care use, n (%) | ||||||
| Endocrinologist visit | 32 205 (22.4) | 25 036 (16.5) | 0.149 | 22 690 (19.0) | 22 636 (18.9) | 0.001 |
| General practitioner visit | 119 821 (83.2) | 128 278 (84.4) | 0.032 | 100 022 (83.7) | 99 961 (83.6) | 0.001 |
| Emergency department visit | 20 127 (14.0) | 17 900 (11.8) | 0.066 | 15 382 (12.9) | 15 388 (12.9) | 0 |
| Colonoscopy | 6195 (4.3) | 6576 (4.3) | 0.001 | 5158 (4.3) | 5176 (4.3) | 0.001 |
| Pneumococcal vaccination | 4746 (3.3) | 4511 (3.0) | 0.019 | 3749 (3.1) | 3730 (3.1) | 0.001 |
DPP4 = dipeptidyl peptidase-4; GLP1 = glucagon-like peptide-1; SGLT2 = sodium–glucose cotransporter-2.
Values <0.1 indicate adequate balance.
Available for about 6% of patients.
To convert to SI units (micromoles per liter), multiply by 88.4.
Nonsteroidal anti-inflammatory drugs, including coxibs.
After 1:1 propensity score matching, we were able to match approximately 80% of all patients: 119 530 (78.7%) had a new SGLT2 inhibitor prescription, and 119 530 (83.0%) had a new GLP1 agonist prescription. All baseline characteristics were well balanced; the average age was 54 years, 52% of the patients were women, two thirds had hypertension, and about one quarter had filled a prescription for insulin. The baseline hemoglobin A1c level was 8.6%, and baseline creatinine level was 78.7 µmol/L (0.89 mg/dL), although these values were available for only 5% of patients. Mean follow-up was 302 days (SD, 290) for adults prescribed an SGLT2 inhibitor versus 261 days (SD, 262) for those prescribed a GLP1 agonist. The most common reason for lack of further follow-up was treatment discontinuation, with 49% of patients discontinuing their GLP1 agonist and 45% discontinuing their SGLT2 inhibitor treatment. Furthermore, approximately 9% of patients who started GLP1 agonist treatment subsequently filled a prescription for an SGLT2 inhibitor, and 8% of patients who started treatment with an SGLT2 inhibitor subsequently filled a prescription for a GLP1 agonist (Supplement Table 4, available at Annals.org).
Rate of Gout
Among 151 949 unmatched adults newly prescribed an SGLT2 inhibitor, 636 were subsequently diagnosed with gout (4.9 events per 1000 person-years), compared with 836 among the 143 958 adults newly prescribed a GLP1 agonist (8.2 events per 1000 person-years). This outcome corresponded to an unadjusted HR of 0.61 (95% CI, 0.55 to 0.67) for incident gout associated with an SGLT2 inhibitor versus a GLP1 agonist. Among 119 530 propensity score–matched adults with a new SGLT2 inhibitor prescription, 486 were subsequently diagnosed with gout (4.9 events per 1000 person-years), compared with 665 who were newly prescribed a GLP1 agonist (7.8 events per 1000 person-years) (Figure 2). This outcome corresponded to an adjusted HR of 0.64 (CI, 0.57 to 0.72). In absolute terms, the rate difference between the propensity score–matched SGLT2 inhibitor and GLP1 agonist groups was −2.85 (95% CI, −3.59 to −2.12) per 1000 person-years (Table 2). Similar results were observed in the cohort of patients with at least 365 days of baseline data (Table 2) and were consistent regardless of sex, age, or baseline diuretic use (Table 3).
Figure 2.
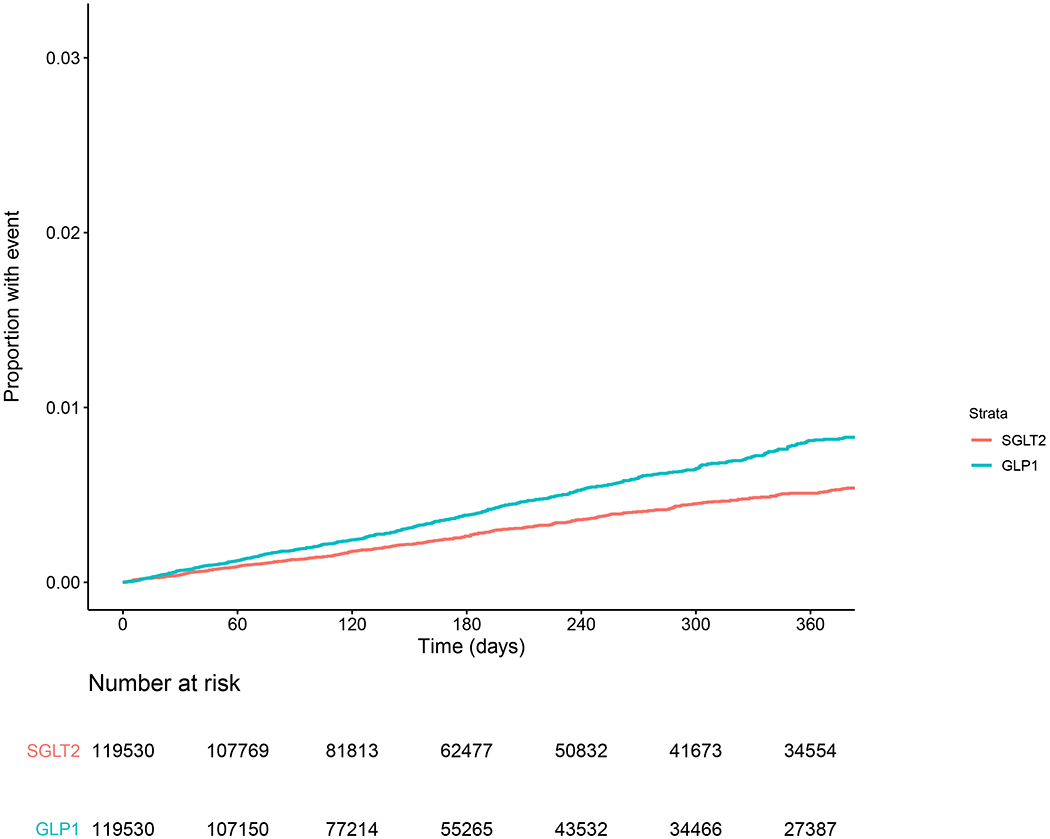
Kaplan–Meier curve for propensity score–matched rate of gout. GLP1 = glucagon-like peptide-1 agonist, SGLT2 = sodium–glucose cotransporter-2 inhibitor.
Table 2.
Gout Rates Before and After 1:1 Propensity Score Matching
| Value | Before Matching | After Matching | ||
|---|---|---|---|---|
| GLP1 Agonist | SGLT2 Inhibitor | GLP1 Agonist | SGLT2 Inhibitor | |
| Patients, n | 143 958 | 151 949 | 119 530 | 119 530 |
| Person-years, n | 102 142 | 128 818 | 85 646 | 98 924 |
| Events, n | 836 | 636 | 665 | 486 |
| Rate per 1000 person-years | 8.18 | 4.94 | 7.76 | 4.91 |
| Rate difference per 1000 person-years (95% CI) | Reference | −3.25 (−3.92 to −2.57) | Reference | −2.85 (−3.59 to −2.12) |
| HR (95% CI) | Reference | 0.61 (0.55 to 0.67) | Reference | 0.64 (0.57 to 0.72) |
| Sensitivity analysis of up to 1 y of index medication exposure | ||||
| GLP1 Agonist | SGLT2 Inhibitor | GLP1 Agonist | SGLT2 Inhibitor | |
| Patients, n | 144 207 | 152 250 | 119 813 | 119 813 |
| Person-years, n | 111 341 | 118 056 | 92 651 | 92 883 |
| Events, n | 897 | 648 | 712 | 524 |
| Rate per 1000 person-years | 8.06 | 5.49 | 7.68 | 5.64 |
| Rate difference per 1000 person-years (95% CI) | Reference | −2.57 (−3.24 to −1.89) | Reference | −2.04 (−2.79 to −1.30) |
| HR (95% CI) | Reference | 0.68 (0.62 to 0.75) | Reference | 0.73 (0.66 to 0.82) |
| Sensitivity analysis among patients with ≥1 y of baseline data | ||||
| GLP1 Agonist | SGLT2 Inhibitor | GLP1 Agonist | SGLT2 Inhibitor | |
| Patients, n | 110 077 | 128 325 | 95 490 | 95 490 |
| Person-years, n | 81 654 | 114 024 | 71 511 | 82 799 |
| Events, n | 669 | 566 | 576 | 398 |
| Rate per 1000 patient-years | 8.19 | 4.96 | 8.05 | 4.81 |
| Rate difference per 1000 patient-years (95% CI) | Reference | −3.23 (−3.97 to −2.49) | Reference | −3.25 (−4.06 to −2.44) |
| HR (95% CI) | Reference | 0.61 (0.55 to 0.68) | Reference | 0.60 (0.53 to 0.68) |
| Sensitivity analysis using a DPP4 inhibitor as the comparator | ||||
| DPP4 Inhibitor | SGLT2 Inhibitor | DPP4 Inhibitor | SGLT2 Inhibitor | |
| Patients, n | 175 823 | 128 242 | 97 442 | 97 442 |
| Person-years, n | 142 676 | 109 269 | 75 264 | 80 901 |
| Events, n | 1413 | 557 | 608 | 433 |
| Rate per 1000 person-years | 9.90 | 5.10 | 8.08 | 5.35 |
| Rate difference per 1000 person-years (95% CI) | Reference | −4.81 (−5.47 to −4.14) | Reference | −2.73 (−3.54 to −1.91) |
| HR (95% CI) | Reference | 0.52 (0.47 to 0.57) | Reference | 0.66 (0.58 to 0.75) |
DPP4 = dipeptidyl peptidase-4; GLP1 = glucagon-like peptide-1; HR = hazard ratio; SGLT2 = sodium–glucose cotransporter-2.
Table 3.
Gout Rate Within Various Subgroups After Propensity Score Matching
| Subgroup | GLP1 Agonist | SGLT2 Inhibitor |
|---|---|---|
| Men | ||
| Patients, n | 57 807 | 57 807 |
| Person-years, n | 42 336 | 51 024 |
| Events, n | 397 | 325 |
| Rate per 1000 person-years | 9.38 | 6.37 |
| HR (95% CI) | Reference | 0.69 (0.60–0.80) |
| Women | ||
| Patients, n | 61 294 | 61 294 |
| Person-years, n | 42 986 | 47 972 |
| Events, n | 262 | 167 |
| Rate per 1000 person-years | 6.10 | 3.48 |
| HR (95% CI) | Reference | 0.57 (0.47–0.69) |
| Age ≤60 y | ||
| Patients, n | 90 733 | 90 733 |
| Person-years, n | 63 850 | 75 702 |
| Events, n | 450 | 342 |
| Rate per 1000 person-years | 7.05 | 4.52 |
| HR (95% CI) | Reference | 0.64 (0.56–0.74) |
| Age >60 y | ||
| Patients, n | 31 248 | 31 248 |
| Person-years, n | 23 491 | 25 151 |
| Events, n | 238 | 170 |
| Rate per 1000 person-years | 10.13 | 6.76 |
| HR (95% CI) | Reference | 0.67 (0.55–0.82) |
| Baseline diuretic use | ||
| Patients, n | 21 522 | 21 522 |
| Person-years, n | 15 543 | 17 851 |
| Events, n | 229 | 118 |
| Rate per 1000 person-years | 14.73 | 6.61 |
| HR (95% CI) | Reference | 0.45 (0.36–0.56) |
| No baseline diuretic use | ||
| Patients, n | 97 936 | 97 936 |
| Person-years, n | 70 227 | 81 070 |
| Events, n | 427 | 363 |
| Rate per 1000 person-years | 6.08 | 4.48 |
| HR (95% CI) | Reference | 0.74 (0.64–0.85) |
GLP1 = glucagon-like peptide-1; HR = hazard ratio; SGLT2 = sodium–glucose cotransporter-2.
In the sensitivity analysis with up to 1 year of index medication exposure, among 119 813 propensity score–matched adults newly prescribed an SGLT2 inhibitor, 524 were diagnosed with gout (5.6 events per 1000 person-years), compared with 712 who were newly prescribed a GLP1 agonist (7.7 events per 1000 person-years). This outcome corresponded to an adjusted HR of 0.73 (CI, 0.66 to 0.82).
In the sensitivity analysis in which new SGLT2 inhibitor users (n = 97 442) were compared with propensity score–matched new DPP4 inhibitor users (n = 97 442) (Supplement Table 3, available at Annals.org), the HR for gout associated with an SGLT2 inhibitor was 0.66 (CI, 0.58 to 0.75) (Table 2).
Assessing for the Impact of Unmeasured Confounding
The E-value for our primary outcome comparing gout rates between adults newly prescribed an SGLT2 inhibitor and those newly prescribed a GLP1 agonist was 2.50 (risk ratio, 2.50 [CI, 2.12 to 2.90]). This finding indicates that our observed HR for the primary outcome might be explained away by a strongly related unmeasured confounder that was associated with both SGLT2 inhibitor use and gout by a risk ratio of 2.5-fold each, above and beyond the measured confounders we included in our study.
Positive Control Outcome
Among 119 530 propensity score–matched adults newly prescribed an SGLT2 inhibitor, 169 were hospitalized for heart failure (1.7 events per 1000 person-years) compared with 231 who were newly prescribed a GLP1 agonist (2.7 events per 1000 person-years). This outcome corresponded to an adjusted HR of 0.63 (CI, 0.51 to 0.77) with use of SGLT2 inhibitors versus GLP1 agonists.
Discussion
In this longitudinal study of nearly 300 000 adults with type 2 diabetes mellitus, we observed a lower rate of incident gout among those newly prescribed an SGLT2 inhibitor compared with those newly prescribed a GLP1 agonist. Similar findings were observed in sensitivity analyses, as well as in the cohort in which adults prescribed a DPP4 inhibitor were the comparator group. We observed a relative risk reduction in gout of nearly 40% and an absolute risk reduction of about 3 fewer adults with gout per 1000 person-years. Because our study was predominantly composed of middle-aged adults, we anticipate that the effect sizes may be different in older patients at higher baseline risk for gout.
Although SGTL2 inhibitors are thought to reduce uric acid levels by causing glycosuria, the exact mechanism is not well understood (11, 28). In one study of healthy volunteers, a reduction in serum uric acid levels was observed within 24 hours of SGLT2 inhibitor administration (28). At least 62 previous randomized clinical trials evaluated uric acid levels before and after use of an SGLT2 inhibitor (11). Nearly all these studies included adults who did not have hyperuricemia at baseline and observed a reduction in uric acid levels among adults randomly assigned to receive an SGLT2 inhibitor compared with those who received a placebo or comparator medication (11). In contrast, uric acid levels are not decreased by GLP1 agonists (12). Thus, GLP1 agonists are an ideal comparator to determine whether the observed uric acid reduction seen with SGLT2 inhibitors corresponds to a clinically meaningful reduction in the risk for gout. The results of our study provide empirical evidence that the reduction in uric acid levels may indeed be clinically meaningful. However, earlier studies assessing the risk for gout with SGLT2 inhibitors are lacking; thus, our findings require replication.
Because we excluded patients with a history of gout, subsequent observational studies in patients with prevalent gout and in those with a higher baseline risk for gout (such as those older than 65 years and those with established cardiovascular disease) will be particularly important to determine whether the magnitude of potential benefit we identified represents an underestimate. Logically, patients with hyperuricemia and higher serum uric acid levels at baseline have a greater potential for reducing uric acid levels. If proven, this will be relevant for adults with diabetes who also have hyperuricemia, and one day may also be relevant for adults with hyperuricemia who do not have diabetes.
Several clinical trials of SGLT2 inhibitors in adults without diabetes are currently under way (including a recently completed study of heart failure risk in patients without diabetes) (29). According to ClinicalTrials.gov, no clinical trials are currently evaluating SGLT2 inhibitors for the treatment or prevention of gout. Identifying effective gout treatments has taken on new importance since the recent randomized CARES (Cardiovascular Safety of Febuxostat and Allopurinol in Participants With Gout and Cardiovascular Comorbidities) trial demonstrated that febuxostat was associated with a higher risk for cardiovascular death and all-cause mortality compared with allopurinol (6).
In 2016, the 21st Century Cures Act directed the U.S. Food and Drug Administration (FDA) to evaluate the potential use of real-world data to help support the approval of new indications for approved drugs (30). The subsequent Framework for FDA’s Real-World Evidence Program, released in 2018, indicates that the FDA is now using real-world data to evaluate supplemental indications for already approved medications (31). Previous studies identified some of the key components for real-world data to be used in assessing medication effectiveness, including the new-user active comparator design, the presence of a valid outcome measure, and the identification and adjustment of relevant confounders (30, 32). Although our study applied all 3 components, replication of our results will be necessary to confirm whether the observed reduction in the rate of gout is a true effect of SGLT2 inhibitors or the result of unmeasured confounding or a chance finding.
Unmeasured confounding is an important limitation of all observational studies. In our study, we did not have access to important risk factors for gout, such as alcohol use, a purine-rich diet (such as red meat and seafood), or body mass index (BMI) (1). However, we do not anticipate these risk factors to be imbalanced across the 2 propensity score–matched groups. Furthermore, the E-value we calculated has determined that the unmeasured variable would require a risk ratio of 2.5 with both gout and use of an SGLT2 inhibitor to negate our findings. Previous meta-analyses identified the following association with some unmeasured variables and gout: high versus no alcohol consumption (relative risk, 1.98 [CI, 1.52 to 2.58]) (33), high versus low red meat consumption (odds ratio, 1.29 [CI, 1.16 to 1.44]) (34), and a BMI of 30 kg/m2 versus 20 kg/m2 (relative risk, 2.67 [CI, 2.16 to 3.30]) (35). This finding suggests that BMI might affect the validity of our findings; however, before propensity score matching, the prevalence of obesity was higher among adults who received a GLP1 agonist than those who received an SGLT2 inhibitor, and this was balanced after propensity score matching. For this reason, we do not think that differences in BMI alone negate our study’s findings.
An important limitation of 1:1 propensity score matching is that some patients will necessarily be excluded to ensure study validity. Although excluding these patients may affect the generalizability of our results, we are reassured that our unadjusted results including all patients were nearly identical to our adjusted results after propensity score matching. Other limitations of our study were incomplete baseline laboratory data (namely creatinine and hemoglobin A1c levels) and a relatively short mean follow-up (about 280 days). Follow-up was longer for adults prescribed SGLT2 inhibitors than those prescribed GLP1 agonists, which is in line with previous studies and may be related to nausea and vomiting, the most common reason for GLP1 withdrawal. Future studies will be necessary to understand whether the benefits we observed attenuate over time.
Although SGLT2 inhibitors may reduce a person’s risk for gout, several adverse events are associated with these agents. The most common adverse event is genital infection, which affects approximately 7% of patients who receive an SGLT2 inhibitor (36, 37). Important rare adverse events also exist, including diabetic ketoacidosis and, potentially, lower-limb amputation (24, 38). The former affects fewer than 1% of patients, and the latter seems mainly to affect older adults with preexisting cardiovascular disease who are receiving canagliflozin (39). Another important consideration before SGLT2 inhibitors are prescribed is their cost. The cash price for a 1-month supply of SGLT2 inhibitors for U.S. adults without insurance is approximately $500, whereas the cost for a 1-month supply of DPP4 inhibitors and GLP1 agonists is about $500 and $900, respectively.
In this study of nearly 300 000 adults with type 2 diabetes, we observed a lower rate of gout among those who filled a prescription for an SGLT2 inhibitor than those prescribed a GLP1 agonist or DPP4 inhibitor. These findings were robust across sensitivity analyses and are unlikely to be explained by unmeasured confounding. Future studies are necessary to confirm our findings, and if replicated, SGLT2 inhibitors might be an effective class of medication for the prevention of gout for patients with diabetes or metabolic disorders.
Supplementary Material
Acknowledgments
Primary Funding Source: Brigham and Women’s Hospital.
Financial Support: By the Division of Pharmacoepidemiology and Pharmacoeconomics, Department of Medicine, Brigham and Women’s Hospital, Harvard Medical School. Dr. Fralick received funding from the Eliot Phillipson Clinician-Scientist Training Program at the University of Toronto and the Canadian Institutes of Health Research through the Banting and Best PhD Award. Dr. Patorno is supported by a career development grant (K08AG055670) from the National Institute on Aging.
Disclosures: Dr. Patorno reports grants from the National Institute on Aging and Boehringer Ingelheim outside the submitted work. Dr. Kim reports grants from Pfizer, AbbVie, Roche, and Bristol-Myers Squibb outside the submitted work. Authors not named here have disclosed no conflicts of interest. Disclosures can also be viewed at www.acponline.org/authors/icmje/ConflictOfInterestForms.do?msNum=M19-2610.
Contributor Information
Michael Fralick, Brigham and Women’s Hospital and Harvard Medical School, Boston, Massachusetts, and University of Toronto, Toronto, Ontario, Canada.
Sarah K. Chen, Brigham and Women’s Hospital and Harvard Medical School, Boston, Massachusetts.
Elisabetta Patorno, Brigham and Women’s Hospital and Harvard Medical School, Boston, Massachusetts.
Seoyoung C. Kim, Brigham and Women’s Hospital and Harvard Medical School, Boston, Massachusetts.
References
- 1.Saag KG, Choi H. Epidemiology, risk factors, and lifestyle modifications for gout. Arthritis Res Ther. 2006;8 Suppl 1:S2. [DOI] [PMC free article] [PubMed] [Google Scholar]
- 2.Khanna D, Fitzgerald JD, Khanna PP, et al. ; American College of Rheumatology. 2012 American College of Rheumatology guidelines for management of gout. Part 1: systematic nonpharmacologic and pharmacologic therapeutic approaches to hyperuricemia. Arthritis Care Res (Hoboken). 2012;64:1431–46. doi: 10.1002/acr.21772 [DOI] [PMC free article] [PubMed] [Google Scholar]
- 3.Choi HK, Curhan G. Independent impact of gout on mortality and risk for coronary heart disease. Circulation. 2007;116:894–900. [DOI] [PubMed] [Google Scholar]
- 4.Krishnan E, Svendsen K, Neaton JD, et al. ; MRFIT Research Group. Long-term cardiovascular mortality among middle-aged men with gout. Arch Intern Med. 2008;168:1104–10. doi: 10.1001/archinte.168.10.1104 [DOI] [PubMed] [Google Scholar]
- 5.Becker MA, Schumacher HR Jr, Wortmann RL, et al. Febuxostat compared with allopurinol in patients with hyperuricemia and gout. N Engl J Med. 2005;353:2450–61. [DOI] [PubMed] [Google Scholar]
- 6.White WB, Saag KG, Becker MA, et al. ; CARES Investigators. Cardiovascular safety of febuxostat or allopurinol in patients with gout. N Engl J Med. 2018;378:1200–1210. doi: 10.1056/NEJMoa1710895 [DOI] [PubMed] [Google Scholar]
- 7.Whitehouse FW, Cleary WJ Jr. Diabetes mellitus in patients with gout. JAMA. 1966;197:73–6. [PubMed] [Google Scholar]
- 8.Zinman B, Wanner C, Lachin JM, et al. ; EMPA-REG OUTCOME Investigators. Empagliflozin, cardiovascular outcomes, and mortality in type 2 diabetes. N Engl J Med. 2015;373:2117–28. doi: 10.1056/NEJMoa1504720 [DOI] [PubMed] [Google Scholar]
- 9.Lytvyn Y, Bjornstad P, Udell JA, et al. Sodium glucose cotransporter-2 inhibition in heart failure: potential mechanisms, clinical applications, and summary of clinical trials. Circulation. 2017;136:1643–1658. doi: 10.1161/CIRCULATIONAHA.117.030012 [DOI] [PMC free article] [PubMed] [Google Scholar]
- 10.Wu JHY, Foote C, Blomster J, et al. Effects of sodium-glucose cotransporter-2 inhibitors on cardiovascular events, death, and major safety outcomes in adults with type 2 diabetes: a systematic review and meta-analysis. Lancet Diabetes Endocrinol. 2016;4:411–9. doi: 10.1016/S2213-8587(16)00052-8 [DOI] [PubMed] [Google Scholar]
- 11.Zhao Y, Xu L, Tian D, et al. Effects of sodium-glucose co-transporter 2 (SGLT2) inhibitors on serum uric acid level: a meta-analysis of randomized controlled trials. Diabetes Obes Metab. 2018;20:458–462. doi: 10.1111/dom.13101 [DOI] [PubMed] [Google Scholar]
- 12.Tonneijck L, Muskiet MHA, Smits MM, et al. Effect of immediate and prolonged GLP-1 receptor agonist administration on uric acid and kidney clearance: post-hoc analyses of four clinical trials. Diabetes Obes Metab. 2018;20:1235–1245. doi: 10.1111/dom.13223 [DOI] [PMC free article] [PubMed] [Google Scholar]
- 13.Fralick M, Kim SC, Schneeweiss S, et al. Fracture risk after initiation of use of canagliflozin: a cohort study. Ann Intern Med. 2019;170:155–163. doi: 10.7326/M18-0567 [DOI] [PMC free article] [PubMed] [Google Scholar]
- 14.Khokhar B, Jette N, Metcalfe A, et al. Systematic review of validated case definitions for diabetes in ICD-9-coded and ICD-10-coded data in adult populations. BMJ Open. 2016;6:e009952. doi: 10.1136/bmjopen-2015-009952 [DOI] [PMC free article] [PubMed] [Google Scholar]
- 15.Bethel MA, Patel RA, Merrill P, et al. ; EXSCEL Study Group. Cardiovascular outcomes with glucagon-like peptide-1 receptor agonists in patients with type 2 diabetes: a meta-analysis. Lancet Diabetes Endocrinol. 2018;6:105–113. doi: 10.1016/S2213-8587(17)30412-6 [DOI] [PubMed] [Google Scholar]
- 16.Tojikubo M, Tajiri Y. Different effects of linagliptin and sitagliptin on blood pressure and renal function in Japanese patients with type 2 diabetes mellitus. Diabetol Int. 2017;8:397–401. doi: 10.1007/s13340-017-0320-4 [DOI] [PMC free article] [PubMed] [Google Scholar]
- 17.MacFarlane LA, Liu CC, Solomon DH, et al. Validation of claims-based algorithms for gout flares. Pharmacoepidemiol Drug Saf. 2016;25:820–6. doi: 10.1002/pds.4044 [DOI] [PMC free article] [PubMed] [Google Scholar]
- 18.Dehlin M, Stasinopoulou K, Jacobsson L. Validity of gout diagnosis in Swedish primary and secondary care - a validation study. BMC Musculoskelet Disord. 2015;16:149. doi: 10.1186/s12891-015-0614-2 [DOI] [PMC free article] [PubMed] [Google Scholar]
- 19.Fralick M, Sacks CA, Kesselheim AS. Assessment of use of combined dextromethorphan and quinidine in patients with dementia or parkinson disease after US food and drug administration approval for pseudobulbar affect. JAMA Intern Med. 2019;179:224–230. doi: 10.1001/jamainternmed.2018.6112 [DOI] [PMC free article] [PubMed] [Google Scholar]
- 20.Fralick M, Avorn J, Franklin JM, et al. Application and impact of run-in studies. J Gen Intern Med. 2018;33:759–763. doi: 10.1007/s11606-018-4344-7 [DOI] [PMC free article] [PubMed] [Google Scholar]
- 21.Austin PC. Balance diagnostics for comparing the distribution of baseline covariates between treatment groups in propensity-score matched samples. Stat Med. 2009;28:3083–107. doi: 10.1002/sim.3697 [DOI] [PMC free article] [PubMed] [Google Scholar]
- 22.VanderWeele TJ, Ding P. Sensitivity analysis in observational research: introducing the E-value. Ann Intern Med. 2017;167:268–274. doi: 10.7326/M16-2607 [DOI] [PubMed] [Google Scholar]
- 23.Rothman K, Greenland S, Lash T. Modern Epidemiology. 3rd ed. Philadelphia: Lippincott Williams & Wilkins; 2008. [Google Scholar]
- 24.Neal B, Perkovic V, Mahaffey KW, et al. ; CANVAS Program Collaborative Group. Canagliflozin and cardiovascular and renal events in type 2 diabetes. N Engl J Med. 2017;377:644–657. doi: 10.1056/NEJMoa1611925 [DOI] [PubMed] [Google Scholar]
- 25.Patorno E, Goldfine AB, Schneeweiss S, et al. Cardiovascular outcomes associated with canagliflozin versus other non-gliflozin antidiabetic drugs: population based cohort study. BMJ. 2018;360:k119. doi: 10.1136/bmj.k119 [DOI] [PMC free article] [PubMed] [Google Scholar]
- 26.Udell JA, Yuan Z, Rush T, et al. Cardiovascular outcomes and risks after initiation of a sodium glucose cotransporter 2 inhibitor: results from the EASEL population-based cohort study (Evidence for cardiovascular outcomes with sodium glucose cotransporter 2 inhibitors in the real world). Circulation. 2018;137:1450–1459. doi: 10.1161/CIRCULATIONAHA.117.031227 [DOI] [PMC free article] [PubMed] [Google Scholar]
- 27.Wang SV, Verpillat P, Rassen JA, et al. Transparency and reproducibility of observational cohort studies using large healthcare databases. Clin Pharmacol Ther. 2016;99:325–32. doi: 10.1002/cpt.329 [DOI] [PMC free article] [PubMed] [Google Scholar]
- 28.Chino Y, Samukawa Y, Sakai S, et al. SGLT2 inhibitor lowers serum uric acid through alteration of uric acid transport activity in renal tubule by increased glycosuria. Biopharm Drug Dispos. 2014;35:391–404. doi: 10.1002/bdd.1909 [DOI] [PMC free article] [PubMed] [Google Scholar]
- 29.Zelniker TA, Braunwald E. Cardiac and renal effects of sodium-glucose co-transporter 2 inhibitors in diabetes: JACC state-of-the-art review. J Am Coll Cardiol. 2018;72:1845–1855. doi: 10.1016/j.jacc.2018.06.040 [DOI] [PubMed] [Google Scholar]
- 30.Fralick M, Kesselheim AS, Avorn J, et al. Use of health care databases to support supplemental indications of approved medications. JAMA Intern Med. 2018;178:55–63. doi: 10.1001/jamainternmed.2017.3919 [DOI] [PMC free article] [PubMed] [Google Scholar]
- 31.U.S. Food and Drug Administration. Framework for FDA’s Real-World Evidence Program. Accessed at www.fda.gov/media/120060/download on 15 November 2019. [Google Scholar]
- 32.Franklin JM, Schneeweiss S. When and how can real world data analyses substitute for randomized controlled trials? Clin Pharmacol Ther. 2017;102:924–933. doi: 10.1002/cpt.857 [DOI] [PubMed] [Google Scholar]
- 33.Wang M, Jiang X, Wu W, et al. A meta-analysis of alcohol consumption and the risk of gout. Clin Rheumatol. 2013;32:1641–8. doi: 10.1007/s10067-013-2319-y [DOI] [PubMed] [Google Scholar]
- 34.Li R, Yu K, Li C. Dietary factors and risk of gout and hyperuricemia: a meta-analysis and systematic review. Asia Pac J Clin Nutr. 2018;27:1344–1356. doi: 10.6133/apjcn.20181127(6).0022 [DOI] [PubMed] [Google Scholar]
- 35.Aune D, Norat T, Vatten LJ. Body mass index and the risk of gout: a systematic review and dose-response meta-analysis of prospective studies. Eur J Nutr. 2014;53:1591–601. doi: 10.1007/s00394-014-0766-0 [DOI] [PubMed] [Google Scholar]
- 36.Liu J, Li L, Li S, et al. Effects of SGLT2 inhibitors on UTIs and genital infections in type 2 diabetes mellitus: a systematic review and meta-analysis. Sci Rep. 2017;7:2824. doi: 10.1038/s41598-017-02733-w [DOI] [PMC free article] [PubMed] [Google Scholar]
- 37.Dave CV, Schneeweiss S, Patorno E. Comparative risk of genital infections associated with sodium-glucose co-transporter-2 inhibitors. Diabetes Obes Metab. 2019;21:434–438. doi: 10.1111/dom.13531 [DOI] [PMC free article] [PubMed] [Google Scholar]
- 38.Fralick M, Schneeweiss S, Patorno E. Risk of diabetic ketoacidosis after initiation of an SGLT2 inhibitor [Letter]. N Engl J Med. 2017;376:2300–2302. doi: 10.1056/NEJMc1701990 [DOI] [PubMed] [Google Scholar]
- 39.Fralick M, Kim S, Schneeweiss S, et al. The risk of amputation with canagliflozin across categories of age and cardiovascular risk: a cohort study of three nationwide healthcare databases in the United States. American Diabetes Association; San Francisco, California: June 9 2019. [date of presentation] [Google Scholar]
Associated Data
This section collects any data citations, data availability statements, or supplementary materials included in this article.