Correction to: British Journal of Cancer (2018) 118, 750–759; 10.1038/bjc.2017.463, published online 30 January 2018.
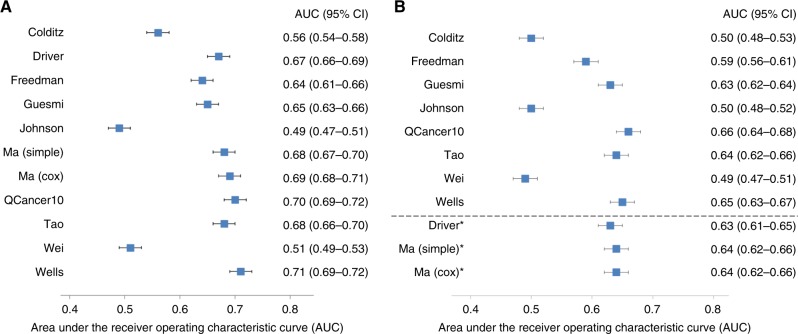
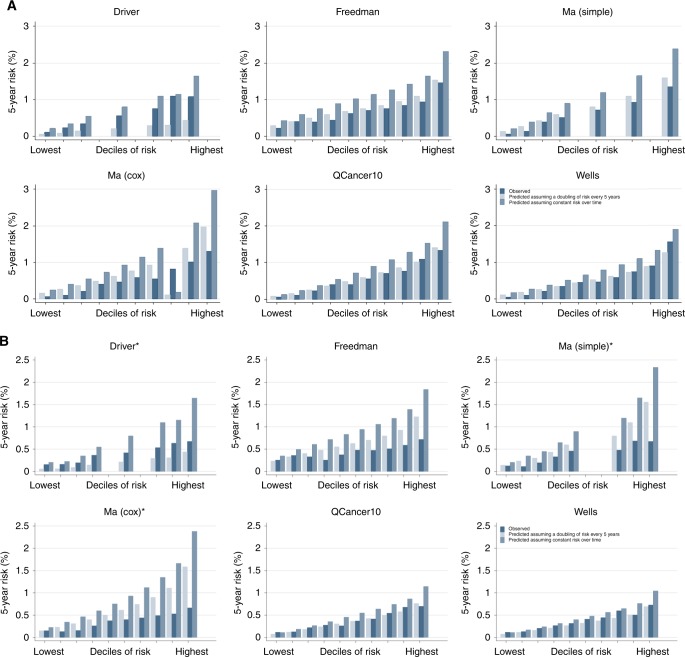
Since the publication of this paper, the authors have identified an error in the code they used in Stata to compute the Wells risk score for men. With the correct code, the performance of the Wells risk score is improved. The correct values are included in the updated versions of Table 3, Fig. 1 (Fig. 1A), Fig. 2 (Fig. 2A) and Supplementary Table 3 provided here. The Wells risk score is now one of the best performing models in men as well as in women. This does not change the overall conclusions of the analysis but in all places in the paper where reference is made to the best performing models in men, the correct list is Tao, Drive, Ma and Wells.
Table 3.
Discriminatory performance measures for each of the risk models for 5 year risk of developing colorectal cancer in men.
| Colditz | Driver | Freedman | Guesmi | Johnson | Ma (simple) | Ma (Cox) | QCancer10 | Tao | Wei Y-S | Wells | |
|---|---|---|---|---|---|---|---|---|---|---|---|
| Total n | n=139,257 | n=167,762 | n=101,530 | n=168,825 | n=169,722 | n=150,386 | n=150,386 | n=158,024 | n=149,693 | n=160,256 | n=140,917 |
| Incident CRC | n =761 | n = 946 | n = 685 | n = 961 | n = 965 | n = 830 | n = 830 | n = 884 | n = 825 | n = 898 | n = 764 |
| Top 10% | |||||||||||
| Sensitivity | 13.8 | 20.2 | 21.5 | 11.1 | 12.2 | 22.5 | 24.7 | 24.9 | 26.4 | 14.5 | 28.7 |
| Specificity | 90.0 | 90.1 | 90.1 | 90.0 | 90.0 | 90.1 | 90.1 | 90.1 | 90.1 | 90.0 | 90.1 |
| LR+ | 1.38 | 2.03 | 2.16 | 1.11 | 1.22 | 2.27 | 2.49 | 2.51 | 2.67 | 1.45 | 2.90 |
| LR- | 0.96 | 0.89 | 0.87 | 0.99 | 0.98 | 0.86 | 0.84 | 0.83 | 0.82 | 0.95 | 0.79 |
| PPV (%) | 0.8 | 1.1 | 1.4 | 0.6 | 0.7 | 1.2 | 1.4 | 1.4 | 1.5 | 0.8 | 1.6 |
| NPV (%) | 99.5 | 99.5 | 99.4 | 99.4 | 99.4 | 99.5 | 99.5 | 99.5 | 99.5 | 99.5 | 99.6 |
| Top 20% | |||||||||||
| Sensitivity | 25.8 | 38.5 | 35.3 | 29.9 | 23.2 | 40.0 | 42.8 | 42.8 | 41.3 | 23.3 | 45.3 |
| Specificity | 80.0 | 80.1 | 80.1 | 80.1 | 80.0 | 80.1 | 80.1 | 80.1 | 80.1 | 80.0 | 80.1 |
| LR+ | 1.29 | 1.93 | 1.78 | 1.50 | 1.16 | 2.01 | 2.15 | 2.15 | 2.08 | 1.16 | 2.28 |
| LR- | 0.93 | 0.77 | 0.81 | 0.88 | 0.96 | 0.75 | 0.71 | 0.71 | 0.73 | 0.96 | 0.68 |
| PPV (%) | 0.7 | 1.1 | 1.2 | 0.8 | 0.7 | 1.1 | 1.2 | 1.2 | 1.1 | 0.7 | 1.2 |
| NPV (%) | 99.5 | 99.6 | 99.5 | 99.5 | 99.5 | 99.6 | 99.6 | 99.6 | 99.6 | 99.5 | 99.6 |
| Top 80% | |||||||||||
| Sensitivity | 86.2 | 95.2 | 90.7 | 96.1 | 71.4 | 97.0 | 96.7 | 97.1 | 95.6 | 84.2 | 97.1 |
| Specificity | 20.0 | 20.1 | 20.1 | 20.1 | 20.0 | 20.1 | 20.1 | 20.1 | 20.1 | 20.0 | 20.1 |
| LR+ | 1.08 | 1.19 | 1.13 | 1.20 | 0.89 | 1.21 | 1.21 | 1.21 | 1.20 | 1.05 | 1.22 |
| LR- | 0.69 | 0.24 | 0.47 | 0.19 | 1.43 | 0.16 | 0.16 | 0.15 | 0.22 | 0.79 | 0.14 |
| PPV (%) | 0.6 | 0.7 | 0.8 | 0.7 | 0.5 | 0.7 | 0.7 | 0.7 | 0.7 | 0.6 | 0.7 |
| NPV (%) | 99.6 | 99.9 | 99.7 | 99.9 | 99.2 | 99.9 | 99.9 | 99.9 | 99.9 | 99.6 | 99.9 |
| Top 90% | |||||||||||
| Sensitivity | 94.3 | 98.0 | 96.6 | 99.1 | 82.7 | 98.8 | 99.0 | 99.1 | 97.5 | 91.4 | 99.1 |
| Specificity | 10.0 | 10.0 | 10.0 | 10.1 | 10.0 | 10.0 | 10.1 | 10.1 | 10.0 | 10.0 | 10.0 |
| LR+ | 1.05 | 1.09 | 1.07 | 1.10 | 0.92 | 1.10 | 1.10 | 1.10 | 1.08 | 1.02 | 1.10 |
| LR- | 0.56 | 0.20 | 0.33 | 0.09 | 1.74 | 0.12 | 0.10 | 0.09 | 0.25 | 0.86 | 0.09 |
| PPV (%) | 0.6 | 0.6 | 0.7 | 0.6 | 0.5 | 0.6 | 0.6 | 0.6 | 0.6 | 0.6 | 0.6 |
| NPV (%) | 99.7 | 99.9 | 99.8 | 99.9 | 99.0 | 99.9 | 99.9 | 99.9 | 99.8 | 99.5 | 100 |
LR+ positive likelihood ratio; LR− negative likelihood ratio; PPV positive predictive value; NPV negative predictive value.
Fig. 1. Model discrimination.
Area under the receiver operating characteristic curve for the risk models in (A) men and (B) women. *Models originally only developed in men.
Fig. 2. Model calibration.
Plots of observed and predicted 5-year risk of colorectal cancer for (A) men and (B) women. *Models originally only developed in men.
Supplementary information
Supplementary information
Supplementary information is available for this paper at 10.1038/s41416-020-0767-0.
Associated Data
This section collects any data citations, data availability statements, or supplementary materials included in this article.


