

Abstract
Phage display is a powerful technique to select high-affinity antibodies for different purposes, including biopharmaceuticals. Next-generation sequencing (NGS) presented itself as a robust solution, making it possible to assess billions of sequences of the variable domains from selected sublibraries. Handling this process, a central difficulty is to find the selected clones. Here, we present the AutomaTed Tool For Immunoglobulin Analysis (ATTILA), a new tool to analyze and find the enriched variable domains throughout a biopanning experiment. The ATTILA is a workflow that combines publicly available tools and in-house programs and scripts to find the fold-change frequency of deeply sequenced amplicons generated from selected VH and VL domains. We analyzed the same human Fab library NGS data using ATTILA in 5 different experiments, as well as on 2 biopanning experiments regarding performance, accuracy, and output. These analyses proved to be suitable to assess library variability and to list the more enriched variable domains, as ATTILA provides a report with the amino acid sequence of each identified domain, along with its complementarity-determining regions (CDRs), germline classification, and fold change. Finally, the methods employed here demonstrated a suitable manner to combine amplicon generation and NGS data analysis to discover new monoclonal antibodies (mAbs).
Keywords: Phage display, biopanning, combinatorial library, next-generation sequencing, antibody variable domains
Introduction
The use of phage-display antibody combinatorial libraries has impulsed the isolation of innovative antibodies. Approximately 30% of the approved antibodies for clinical treatments in the last 5 years were isolated from phage-displayed libraries using different selection strategies.1 Originally, the validation of selected clones was based on either the enrichment of specific clones throughout the selection rounds2 or biological activities of some (few) randomly selected clones.3 However, the low throughput of Sanger sequencing limited these strategies, as enriched clones were assessed from few sequences, or activity-screened clones (antigen binding, for example). Thirty years after the pioneering work describing the phase-display technique,4 new methodologies such as next-generation sequencing (NGS) have pushed the technology toward modern standards for selecting biologically active selected clones.
The development of NGS increased in several orders of magnitude the quantity of individual clone sequences obtained, allowing the determination of complete variable domain repertoires. As a consequence, NGS sequencing became the preferred strategy to determine antibody phage clones that were successfully selected in phage-display experiments.5 Most of these approaches rely on repertoire studies and clonal skewing to find selected antibody winner sequences.6-8 Some methods focus on the VH complementarity-determining region-3 (CDR3) to address the diversity of phage libraries.9,10 The role of CDR3 in antigen (Ag) recognition and binding is noteworthy, but other regions (CDR1 or 2, and even some framework residues) have also been described as crucial in some antibody-antigen interactions. Thus, novel approaches addressing the whole sequence may be more indicated to find reliable high-affinity antibody domains.
In this work, we describe a new workflow—AutomaTed Tool For Immunoglobulin Analysis (ATTILA)—that makes it possible to identify variable domains enriched after selection. The methodology combines the generation of VH and VL amplicons from antibody-displaying phages, before and after selection, and the use of NGS to acquire their coding sequences. After a filtering process, ATTILA can establish the frequency of each variable domain sequence in a given selection round. It generates a report with the fold change of each enriched sequence, giving the amino acid sequence, complementarity-determining region (CDR) identification, and germline classification of the variable domains. We also report a human Fab VH-VL combinatorial library displayed on phage,11 which was examined to validate the ATTILA workflow. We present ATTILA analyses based on heavy variable domain (VH) sequences, submitted to NGS sequencing in either Illumina or 454 sequencers. The ATTILA workflow also assesses the variability of the library and the error rate of the whole process and analyzes the changes in selected VHs throughout the selection cycles from 5 different biopanning experiments. Finally, we show that ATTILA is a powerful tool to point out specifically selected variable domains using the combination of polymerase chain reaction (PCR) and NGS to identify antibodies from phage-display libraries enriched by panning. Based on the ATTILA results, antibodies harboring the most enriched VH and VL can be produced and further characterized.
Methods
Describing ATTILA
AutomaTed Tool for Immunoglobulin Analysis (ATTILA) is a workflow that combines both third-party and in-house programs for analyzing phage-display selection of antibodies by NGS sequencing data derived from Illumina or 454 sequencers. It compares the content of VH and VL clones in both unselected library and antigen-selected sublibraries driven by 2 criteria. First, a candidate sequence must present typical regions of the antibody variable domain in a frame that typify a valid VDJ rearrangement. A candidate sequence must display known conserved Cysteine residues flanking both CDR1 and 3 and the conserved β-bulge residues at the end of CDR3.12 Second, a candidate sequence must be enriched in the last cycle of selection compared with the original library . As enrichment is assessed comparing the relative frequency of clone sequences, to meet the second criterion, sequences must have an increased relative frequency in . Then, based on CDR definition13 and on observations from the germline sequence profile, ATTILA establishes the minimum and maximum distances between the first C residue before CDR1 and the conserved C residue before CDR3, and between residue C and conserved WGXG (heavy chain) or FGXG (light chain) motifs flanking CDR3. Consequently, the translation step implicitly uses the first selection criterion.
The ATTILA workflow takes, as input, each sequencing set of 4 libraries, 2 from the heavy chain (VH) and 2 from the light chain (VL). Both contain a sample of the original phage-display library , as well as a sublibrary derived from a panning experiment . As Illumina libraries allow paired-end reads, ATTILA included a joining step before filtering using the fastq-join utility from ea-utils package.14 The sequence quality control is then performed by filtering both quality and length with FASTQC15 and PRINSEQ.16
Next, a program translates antibody variable domain sequences, using a singular approach to choose the most probable open reading frame (ORF). The chosen ORF does not have stop codons, except TAG, that codes for glutamine (SupE44+ Escherichia coli strains) and presents conserved framework residues flanking CDR1 and CDR3. A Perl script calculates the relative frequency of each unique translated subsequence delimited by the first Cysteine (C) residue before CDR1 and W/FGXG, after CDR3. Another Perl script compares the relative frequencies of each sequence in and , calculates the frequency fold change, and generates a sorted list of sequences with increased relative frequencies. For those found only in the post-selection sublibrary, a single sequence appearance is considered for the initial library. A summary of the ATTILA workflow is shown in Figure 1.
Figure 1.
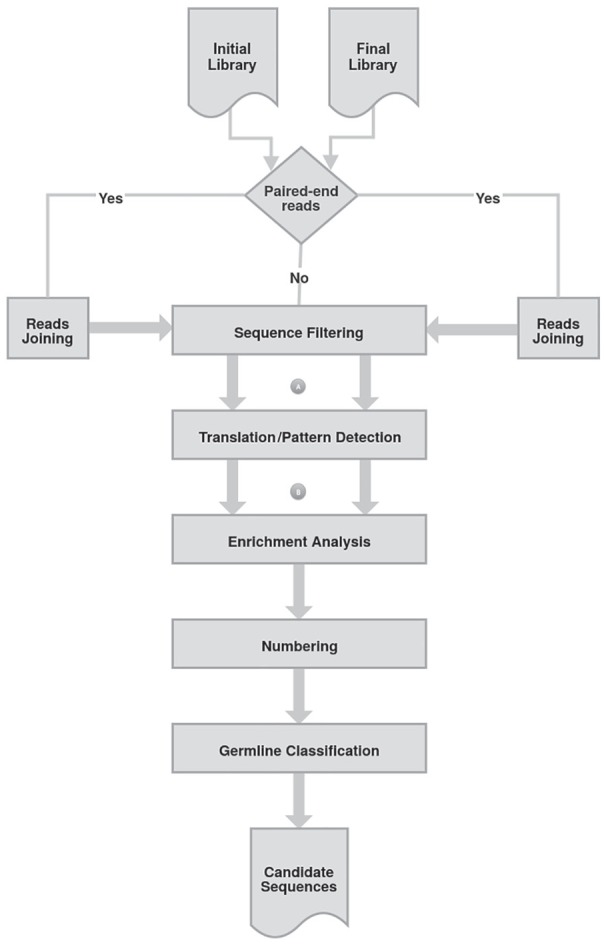
The ATTILA workflow. It retrieves selected VH and VL domain sequences from phage-display experiments. The ATTILA workflow reads antibody phage-display NGS sequencing, either single-end or paired-end sequence data in FASTQ format, and delivers a report of the most enriched VH and VL sequences after panning. Those marked A and B represent workflow steps focused on the following figures. ATTILA indicates AutomaTed Tool For Immunoglobulin Analysis; NGS, next-generation sequencing.
Data checking and enrichment analysis
For checking the ATTILA results, we examined 2 output files. The first was a nucleotide FASTA file obtained after NGS quality check and filtering. The second was a list of VH clones predicted after translation and pattern detection, named the VDJ data set. A VDJ file can be in the nucleotide or amino acid format. The VDJ sequence files were compared using bash commands and Blast17 to retrieve ATTILA data. The VH gene usage was computed using Blastn17 against a Kabat germline database (obtained from GenBank, National Center for Biotechnology Information [NCBI]), filtering the best hits at e value ⩽ 1010 for family assignment. The UpSet plot (Figure 3) was generated with the VDJ amino acid dataset.
Figure 3.
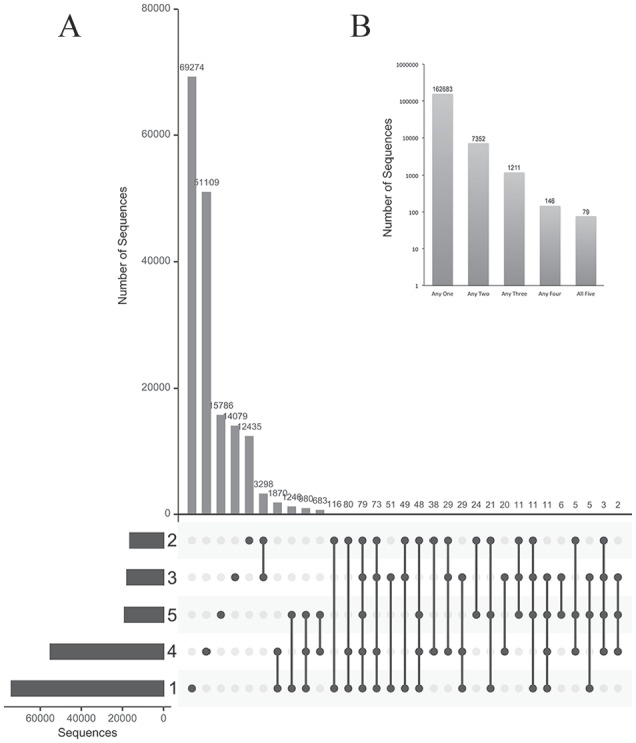
Accessing the diversity of the antibody phage library. The antibody phage-display library was independently sampled 5 times. (A) The UpSet plot of intersection between sequence sets. The horizontal bar chart indicates the total number of sequences in each . The upper bar chart indicates the intersection size between sets of sequences in one or more . Dots represent which contribute to each intersection. (B) Bar chart resuming groups of intersections. Each bar indicates the sum of similar intersections’ size, as captioned in the UpSet plot.
VH and VL amplicons for NGS sequencing
The VH and VL coding genes from each round of a given experiment were amplified from pooled phagemid preparations. For PCR, the following primers with Illumina adapters were used: 5′leadVH—TCGTCGGCAGCGTCAGATGTGTATAAGAGACAGGCTGCCCAACCAGCCATGGCC; 3′VH_rev—GTCTCGTGGGCTCGGAGATGTGTATAAGAGACAGCGATGGGCCCTTGGTGGAGGC; 5′Vkappa—TCGTCGGCAGCGTCAGATGTGTATAAGAGACAGGGGCCCAGGCGGCCGAGCTC; and 3′Vkappa_rev—GTCTCGTGGGCTCGGAGATGTGTATAAGAGACAGAAGACAGATGGTGCAGCCACAGT.
The reactions were performed using Platinum Taq DNA Polymerase (Invitrogen) according to the manufacturer’s instructions and the cycling was as follows: 95°C for 2 minutes; 30 cycles of 95°C for 1 minute, 65°C for 1 minute, and 72°C for 1 minute, followed by an extra 5-minute incubation at 72°C. The amplicons were analyzed in 0.8% agarose gel from where it was extracted and purified using UltrafreeDA columns (Millipore), according to the manufacturer’s instructions prior to NGS sequencing.
Immunoglobulin Fab library and NGS sequencing
All experiments were performed with a previously described Fab phage-display library11 based on the pComb3X vector.3 The library was deeply sequenced 5 times, in the Illumina MiSeq platform, and in a single experiment with 454 pyrosequencing (Roche). For each sequencing experiment, VH and VL amplicons were obtained as described above. The NGS raw data are shown in Supplementary Table S1.
Selection procedure
Two phage-display panning experiments were also assessed here. The first experiment was performed selecting Fabs against a synthetic glycopeptide. The selection procedure was performed, increasing the number of washes throughout the experiments. Typically, 5, 10, 15, and 15 washes in rounds 1 to 4, respectively. The elution was performed using an acid solution. The PCR amplicons for VH and VL were obtained as above, from the original library, as well as for the second, third, and fourth selection rounds. In the second experiment, the library was panned against a biotin-labeled peptide, and 2 different protocols performed the elution: either by disfavoring binding using traditional acid elution or by competition with an unlabeled peptide. Four rounds of selection were performed, increasing the number of washes as described above, and PCR also obtained the sets of VH and VL amplicons from the original library and round 4.
Results
Developing ATTILA workflow
The ATTILA workflow (Figure 1) can be used to analyze NGS sequences from PCR amplicons obtained from phage-displayed libraries. It compares the content of VH and VL clones in both the unselected library and antigen-selected sublibraries. The ATTILA VH and VL domain retrieval complies with 2 significant criteria. For the first one, a sequence must be typified as a valid immunoglobulin VDJ rearrangement. For the second criterion, a candidate sequence must be enriched in the last cycle of selection compared with the original library .
The ATTILA workflow finds candidate sequences displaying known conserved Cysteine residues flanking both CDR1 and 3 and the conserved β-bulge residues GXG at the end of CDR3.12 Based on the CDR’s definition13 and on observations of the germline sequence profile, ATTILA establishes a valid rearranged domain (VDJ) of heavy or (VJ) light chains by computing the minimum and maximum distances between the first C residue before CDR1 and the conserved C residue just before CDR3, and between residue C and conserved (heavy chain) or (for light chain) motifs flanking CDR3 (Supplementary Figure S1 and Table S2). The ATTILA assesses the enrichment by comparing the relative frequency of clone sequences and determining those that have increased their relative frequency in the sample, to meet the second criterion.
The subset reflects the variability of the Fab library
The original library clone content was independently assessed in 5 distinct experiments performed over a 4-year time interval. The NGS data were processed, filtered, and used for VDJ pattern identification. In Figure 2, the input files and their respective subsets were classified in families of germline VH gene usage. A similar family distribution profile was observed in all experiments, suggesting a homogeneous distribution among families despite the large variation in the input size. Experiment number 5, the single 454 sequenced subset, displayed sequence diversity consistent with the larger Illumina sequence data sets.
Figure 2.

The VH gene usage of raw input sequences and rearranged VDJ after translation and pattern detection. Raw VH domain sequences were analyzed after the sequence filtering step (marked as A in Figure 1) and labeled as Input, and after rearranged VDJ pattern detection (marked as B in Figure 1). The VH gene usage was assigned by Blast against a Kabat VH germline database and is shown in proportional stacked bars for 5 independent libraries’ sequencing events. Number on the right represents the total number of sequences from A and B workflow steps in Figure 1.
The subset was generated with in-frame VDJ coding sequences based on pattern recognition. The VH domain coding sequences contained both conserved Cysteine, one located at FW1 and the other at the verge of CDR3, and ending with a conserved WGXG motif at the beginning of FR4. Imposing this criterion, a significant loss in sequence number was observed comparing the input sequences, and the VDJ parsed (Figure 2). The VDJ subsets showed a reduction ranging from 25 to more than 50% of the total input sequences in the same experiments. Despite this, germline gene usage did not change significantly. The subset represented the universe of clones in the original library comprising bone fide VDJ rearranged gene fragments.
The original phage libraries were sampled 5 times and the size of the intersection among these subsets reflects the real size of the library. The intersections were explored using the UpSet plot showing that most sequences appear exclusively in specific subsets (Figure 3A). The topmost exclusive subsets accounted for up to 69 274 sequences in a single experimental , adding to a total of 162 638 exclusive sequences that are found in single samples (Figure 3B). Sequences appearing in 2, 3, 4, or in all samples represented smaller subsets with no more than 3298 sequences, in a subset restricted to experiments 2 and 3. Interestingly, only 79 sequences were found in all 5 subsets. Nevertheless, among the 171 471 distinct sequences observed in all 5 experiments, 162 683 (95%) appear in any single , and less than 0.05% of them was found in all . These data show that library sampling always revealed a large fraction of novel sequences. This number is compatible with the previously predicted library size of 1.45 × 10⁸ of different and functional Fabs.11
Error rate
Sequencing error may yield artifactual sequences not previously found in the phage-display library. Due to the difficulty of estimating the experimental error rate in hitherto very variable immunoglobulin sets, we estimated the artifactual appearance of extra Cysteine residues in the V gene coding sequence. As observed in Table 1, as many as 3% of sequences of correct in-frame VDJ subsets contained at least an additional Cysteine residue, a potential error due to PCR or sequencing procedures. Despite the elevated error rate, there was no clear deviation of the subsets’ germline identity profile, as observed for experimental sequence identity to the closest human germline compared with a GenBank human VH sequence subset (Supplementary Figure S2).
Table 1.
Cysteine error rate.
| 1 | 2 | 3 | 4 | 5 | |
|---|---|---|---|---|---|
| Total VDJ | 85 107 | 82 459 | 41 054 | 61 837 | 24 893 |
| 1C | 3.630 | 1.569 | 3.006 | 3.574 | 3.113 |
| >1C | 0.322 | 0.345 | 1.230 | 0.290 | 0.291 |
Total VDJ indicates the total number of valid rearranged sequences; 1C, 1 additional non-conventional Cysteine; >1C, more than 1 additional non-conventional Cysteine.
Evolution of the selected library subsets
The changes in VH family content and the emergence of selected phage clones were observed in 2 independent panning experiments. In the first, 4 rounds of phage selection were sequenced: unselected library and rounds 2 through 4 (, , and ). These selection rounds were accomplished increasing stringency (augmenting the number of washes). Thus, although the output/input ratios increase, markedly in rounds 3 and 4, the rise is usually smaller than the fold change observed for the most enriched individual clones. Figure 4A reveals the changes in the frequency of the most frequent clones along the selection process. The emergence of enriched clones is clear after the third round of selection and remains evident notable in the fourth round. The most enriched VH clones appear with frequencies above 10% of the total clone count in round 4.
Figure 4.

The VH sequences are selected during panning experiments. The evolution of representative sequence contents is shown during selection steps (, , , and ) for panning experiment number 1 (A, C), and along and steps for 2 independent elution protocols for panning experiment 2 (B, D). In (A), the fractions of the most frequent sequences found in (red) and R4 (black) are tracked along the selection process. The quantity of each sequence is plotted as the percentage of total sequences in the VDJ subset. In (B), the quantity of the most representative sequences in experiment 2 is shown for (central slot), of acid-eluted phages (left slot), and for peptide-eluted phages (right slot). overrepresented sequences are shown in red, and enriched sequences found in both elution protocols are labeled in colors. (C, D) The VH gene usage of the corresponding VDJ subsets, suggesting that the selection leads to VH gene usage bias.
Phage clones that did not interact with the selection target were diluted along with the panning procedure, and the selection round sequence data sets accompany this. The 4 most frequent clones, depicted in red in Figure 4A, were counter-selected and showed a sharp decline in the initial cycles of selection. Thus, spurious clones were removed throughout the panning process.
In the second panning experiment, phages were selected for binding to a biotinylated peptide and eluted either with an acid elution or with a competing peptide. Only and of each selection are shown (Figure 4B and D). The observed profile showed that various leading clones were found after either elution procedure, except for a single clone enriched after acid elution but barely enriched after specific peptide elution protocols (green line). The most selected clone in both elutions comprises 13% to 17% of total VDJ sequences (blue line). Similar to the former experiment, highly represented sequences were counter-selected along with the selection procedure (red lines). The enrichment of clones throughout the selection procedure biases the V gene usage. The VH family usage was accompanied in both experiments and revealed a sharp change, as observed in Figure 4C and D. The increase in some VH gene family usage reflects clonal enrichment depicted in Figure 4A and B, respectively. The VH families 1-46, 4-34, and 3-53 were more abundantly found in the experiment shown in Figure 4C, whereas VH families 1-2, 3-74, 3-7, 3-21, and 3-35 were more prevalent in Figure 4D.
Enrichment analysis reveals the winning clones
The enrichment analysis performed by ATTILA compares the frequency of rearranged sequences in the last selected round and the initial library , and display them as a list of clones based on their fold change. Figure 5 presents the fold-change enrichment of VH clones in the experiments depicted in Figure 4. The most enriched clones are those with the highest fold change and vary among experiments. Although the experiment with glycopeptide results in clones with a fold change close to , the experiments with peptide selection results in fold changes ranging from to .
Figure 5.
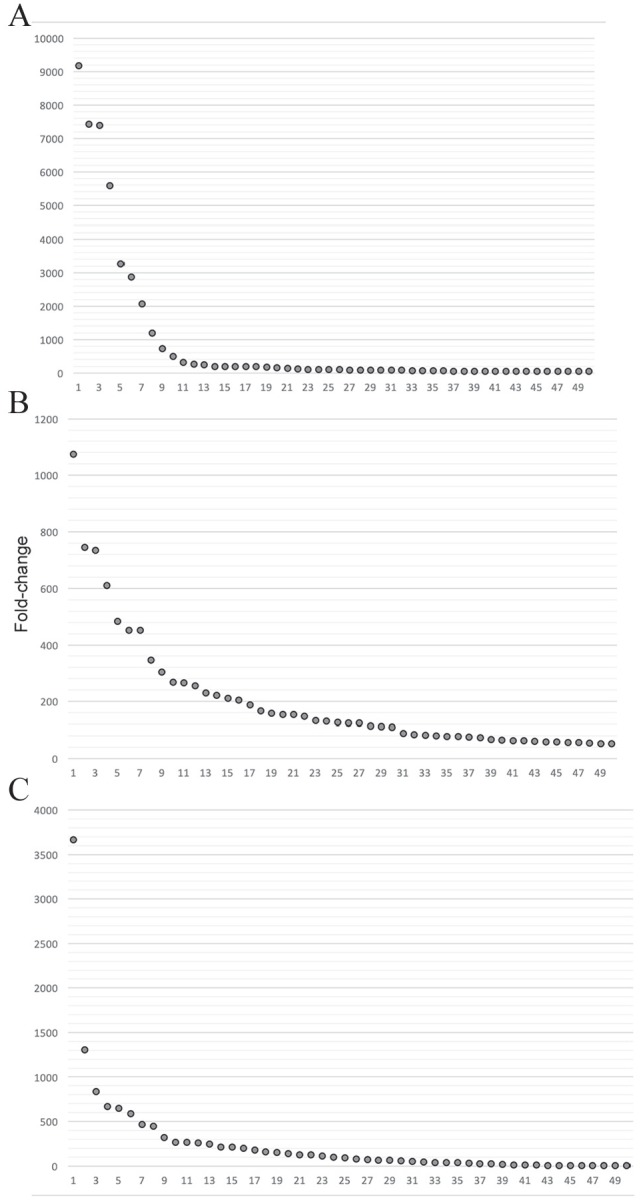
Enrichment of VH domain sequences observed in the panning experiments. The fold change of the 50 most enriched clones as predicted with ATTILA are plotted in descending order: (A) panning experiment 1; (B) panning experiment 2 with peptide elution; and (C) panning experiment number 2 with acid elution.
The enrichment of VL clones was also calculated and reported by ATTILA using rules similar to those for VH. Supplementary Figure S3 shows the enrichment of VL for the experiments reported above. Enrichment is less pronounced than observed for VH, and the most selected VL varied from 700 to 1400 times. In 2 of these experiments, the presence of Fabs bearing high selected VH and VL domains was also confirmed by PCR, using CDR3 (H and L) targeting primers (data not shown). In a biopanning experiment where only VLs were selected from a human VL library, the 2 most enriched VLs reported by ATTILA were tested for their ability to bind to the same antigen used in the selection procedure. Both new selected VL harboring clones showed a better antigen binding when compared with the original clone (Supplementary Figure S4).
Discussion
The use of high-throughput sequencing technology to analyze phage-display results had been proposed as an alternative to Sanger sequencing or biological activity selection protocols.10 The prevalence of clones is inferred from sequence abundance changes along the selection process. Here we propose a workflow for sequence enrichment analysis after phage-display library panning, based on simple frequency changes. The ATTILA workflow is freely available at GitHub.
The use of NGS for the identification of selected phage clones led to the proposal of some, but few automatic workflows. REceptor LIgand Contacts (RELIC)18 was one of the first software for phage-display analysis, and it enables users to align sequences and find motifs from phage-display experimental results. At present, it is limited by biases associated with the original phage-display technique. MIMOP19 integrates 2-dimensional and 3-dimensional analyses to predict potential epitopic regions, respectively, performed by MimAlign and MimCons programs. SLiMFinder20 is a probabilistic method to identify short linear motifs (SLiMs) with a very high level of specificity and a low false discovery rate. It can be applied to solve many problems in this domain, including phage-display library peptides.
VDJFasta6 uses Hide Markov Models to analyze antibody variable domain repertoires. N2GSAb21 is a tool focused on HCDR3 to find entire clones using a smarty PCR strategy that uses an elegant approach to derive phage clones. However, high-affinity antibodies contain uniquely mutated variable domains that account not only for affinity but also for selectivity and bona fide structural features, both equally important if the aim is to obtain clinical Abs. These subtle amino acid residues’ substitution may be lost as a consequence of clonal skewing or CDR3 centered analysis. ImmuneDB8 both stores and analyzes NGS immune receptor sequencing data by aggregating tools to process raw reads for gene usage, infer clones, aggregate data, and run downstream analyses. DEAL (Diversity Estimator of Antibody Library)7 is an algorithm to estimate the library complexity.
Finally, PHASTpep22 makes it possible to discover peptides from phage display and NGS that target a selected cell type, which enhances clinical translatability by circumventing complications with systemic use.
PHASTpep is the software that is most similar to ATTILA, presenting several standard features such as translation of sequences, translation validation, enrichment frequency calculation, and normalization.
On the other hand, ATTILA program translateab9 is able to detect the entire VH and VL domain sequences, using an elegant and efficient translation method, where the choice of the ORF is based not only on the absence of stop codons, but also on the presence of canonical immunoglobulin motifs. Also, ATTILA identifies the antibody germline genes that gave rise to these domains. The ATTILA workflow already proved to be suitable to discovery antibodies to a given target: using a combination of the most enriched VH and VL sequences, a single-chain fragment variable (scFv) anti-α-dystroglycan mucin glycopeptide was constructed and showed selectively binding to the tumor cell surface.23 It can also be used to select individual domains with improved ability to bind to its antigen (Supplementary Figure S4).
The successful acquisition of a high-affinity antibody phage clone depends on the size and diversity of the phage-display library. Hence, we estimate the size of the library comparing 5 different sequencing experiments on a unique library. As observed in Figure 3, every library sampling revealed a large number of unique sequences, mostly specific to a given experiment. Sequences appearing in all library samplings were scarce, suggesting that the sequenced library was large enough to maintain novelty findings along with multiple sequencing events. This library was derived from human peripheral blood mononuclear cells (PBMCs), and its estimated size was .11 Considering that the sequence retrieval in each experiment varies from to unique sequences, it is expected that each single sequence should appear in 2 library sample ranges from 1 to 104 to 1 to 103 individual clones, an estimate that is supported by the intersection analysis shown in Figure 3.
The diversity of individual VDJ reflects the actual size of the library rearranged immunoglobulin gene fragment, but the size estimated by sequencing is distorted by experimental error. Experimental sequence error arises from either PCR steps or the sequencing procedure, artifactually enlarging the library sequence universe.24 Experimental sequence error overestimates the actual variability of the VDJ gene fragment set. Here, the experimental error rate was measured indirectly, at the protein level, assuming that no Cysteine residues were naturally found in between the conserved Cysteine residues in both FW1 and FW3. However, any additional Cysteine residue must reflect artifacts introduced during either PCR or sequencing. We observed a significant number of sequences containing additional Cysteines, suggesting that, at the protein level, at least 1% to 3% of observed sequences are artifactual.
Sequence abundance along selection cycles revealed the increase in selected phage clones. Counting VDJ sequence data sets prior and after selection revealed the extinction of fortuitous library sequences and the increase in selection dependent sequences. The variation of sequence frequency reflected a bona fide selection process, where unique sequences raised in abundance along with selection cycles, reaching up to one-tenth of the total VDJ data set. Moreover, selected sequences were also sensitive to the elution procedure, as expected for different panning protocols. Therefore, despite sequencing error and limited data set, the ATTILA method seems efficient in the identification of individual phage clone variation during the selection procedure.
Conclusions
A workflow for deriving a rearranged antibody variable domain sequence was created and incorporated into a software package named ATTILA. The ATTILA workflow can retrieve VH and VL sequences by comparing a phage-display library, , and a selected sublibrary, . The calculated enriched sequences reflect the phage-display panning selection, and the front-runner selected variable domain sequences can be combined for producing novel antigen-specific recombinant antibody molecules. The simplicity and effectiveness of the ATTILA method allow for its general use assisting phage-display experimental analyses in NGS sequencing.
Acknowledgments
The authors are thankful to Prof Concepta McManus for English language revision of the manuscript.
Footnotes
Funding:The author(s) disclosed receipt of the following financial support for the research, authorship, and/or publication of this article: This work was financially supported by FAP-DF (Grant Number 0193.001784/2017) and Capes and CNPq support scholarships.
Declaration of Conflicting Interests:The author(s) declared no potential conflicts of interest with respect to the research, authorship, and/or publication of this article.
Author Contributions: A. Q. Maranhão, M. M. Brigido, and H. M. Silva: concept and design of the workflow. R. K. A. França, T. C. De-Leo, and R. T. Burtet performed the wet bench experiments. H. M. Silva and W. M. C. Silva: programming. A. Q. Maranhão, M. Dias-Baruffi, and M. M. Brigido directed all experiments. All authors contributed to writing and reviewing the manuscript.
Availability of Data and Materials: The workflow is freely available as a package named ATTILA at https://github.com/waldeyr/attila.
ORCID iD: Waldeyr Mendes Cordeiro da Silva  https://orcid.org/0000-0002-8660-6331
References
- 1. Grilo AL, Mantalaris A. The increasingly human and profitable monoclonal antibody market. Trend Biotechnol. 2019;37:9-16. [DOI] [PubMed] [Google Scholar]
- 2. Griffiths AD, Williams SC, Hartley O, et al. Isolation of high affinity human antibodies directly from large synthetic repertoires. EMBO J. 1994;13:3245-3260. [DOI] [PMC free article] [PubMed] [Google Scholar]
- 3. Steinberg P, Rader CBI. Analysis of selected antibodies. In: Barbas CF, III, Burton DR, Scott JK, Silverman GJ, eds. Phage Display: A Laboratory Manual. New York: NY: Cold Spring Harbor Laboratory Press; 2004:736. [Google Scholar]
- 4. Smith GP. Filamentous fusion phage: novel expression vectors that display cloned antigens on the virion surface. Science. 1985;228:1315-1317. [DOI] [PubMed] [Google Scholar]
- 5. Rouet R, Jackson KJ, Langley DB, Christ D. Next-generation sequencing of antibody display repertoires. Front Immunol. 2018;9:118. [DOI] [PMC free article] [PubMed] [Google Scholar]
- 6. Glanville J, Zhai W, Berka J, et al. Precise determination of the diversity of a combinatorial antibody library gives insight into the human immunoglobulin repertoire. Proc Natl Acad Sci U S A. 2009;106:20216-20221. [DOI] [PMC free article] [PubMed] [Google Scholar]
- 7. Fantini M, Pandolfini L, Lisi S, et al. Assessment of antibody library diversity through next generation sequencing and technical error compensation. PLoS ONE. 2017;12:e0177574. [DOI] [PMC free article] [PubMed] [Google Scholar]
- 8. Rosenfeld AM, Meng W, Luning Prak ET, Hershberg U. ImmuneDB, a novel tool for the analysis, storage, and dissemination of immune repertoire sequencing data. Front Immunol. 2018;9:2107. [DOI] [PMC free article] [PubMed] [Google Scholar]
- 9. Maranhão AQ, Costa MBW, Guedes L, Moraes-Vieira PM, Raiol T, Brigido MM. A mouse variable gene fragment binds to DNA independently of the BCR context: a possible role for immature B-cell repertoire establishment. PLoS ONE. 2013;8:e72625. [DOI] [PMC free article] [PubMed] [Google Scholar]
- 10. Ravn U, Gueneau F, Baerlocher L, et al. By-passing in vitro screening—next generation sequencing technologies applied to antibody display and in silico candidate selection. Nuc Acid Res. 2010;38:e193. [DOI] [PMC free article] [PubMed] [Google Scholar]
- 11. Dantas-Barbosa C, Brígido MM, Maranhão AQ. Construction of a human Fab phage display library from antibody repertoires of osteosarcoma patients. Genet Mol Res. 2005;4:126-140. [PubMed] [Google Scholar]
- 12. Chothia C, Novotn ỳ J, Bruccoleri R, Karplus M. Domain association in immunoglobulin molecules: the packing of variable domains. J Mol Biol. 1985;186:651-663. [DOI] [PubMed] [Google Scholar]
- 13. Kabat EA, Te Wu T, Perry HM, Foeller C, Gottesman KS. Sequences of Proteins of Immunological Interest. Darby, PA: DIANE Publishing; 1992. [Google Scholar]
- 14. Aronesty E. Comparison of sequencing utility programs. Open Bioinform J. 2013;7:1-8. [Google Scholar]
- 15. Andrews S. FastQC Project. http://www.bioinformatics.babraham.ac.uk/projects/fastqc. Updated 2012. Accessed January 2019.
- 16. Aronesty E. ea-utils: command-line tools for processing biological sequencing data. https://expressionanalysis.github.io/ea-utils. Updated 2011. Accessed January 2019.
- 17. Altschul SF, Gish W, Miller W, Myers EW, Lipman DJ. Basic local alignment search tool. J Mol Biol. 1990;215:403-410. [DOI] [PubMed] [Google Scholar]
- 18. Mandava S, Makowski L, Devarapalli S, Uzubell J, Rodi DJ. Relic—a bioinformatics server for combinatorial peptide analysis and identification of protein-ligand interaction sites. Proteomics. 2004;4:1439-1460. [DOI] [PubMed] [Google Scholar]
- 19. Moreau V, Granier C, Villard S, Laune D, Molina F. Discontinuous epitope prediction based on mimotope analysis. Bioinformatics. 2006;22:1088-1095. [DOI] [PubMed] [Google Scholar]
- 20. Edwards RJ, Davey NE, Shields DC. SLiMFinder: a probabilistic method for identifying over-represented, convergently evolved, short linear motifs in proteins. PLoS ONE. 2007;2:e967. [DOI] [PMC free article] [PubMed] [Google Scholar]
- 21. Ravn U, Didelot G, Venet S, et al. Deep sequencing of phage display libraries to support antibody discovery. Methods. 2013;60:99-110. [DOI] [PubMed] [Google Scholar]
- 22. Brinton LT, Bauknight DK, Dasa SSK, Kelly KA. PHASTpep: analysis software for discovery of cell-selective peptides via phage display and next-generation sequencing. PLoS ONE. 2016;11:e0155244. [DOI] [PMC free article] [PubMed] [Google Scholar]
- 23. Canassa-DeLeo T, Campo VL, Rodrigues LC, et al. Multifaceted antibodies development against synthetic α-dystroglycan mucin glycopeptide as promising tools for dystroglycanopathies diagnostic. Glycoconj J. 2020;37:77-93. [DOI] [PubMed] [Google Scholar]
- 24. Bashford-Rogers RJ, Palser AL, Idris SF, et al. Capturing needles in haystacks: a comparison of B-cell receptor sequencing methods. BMC Immunol. 2014;15:29. [DOI] [PMC free article] [PubMed] [Google Scholar]