Abstract
Purpose:
To describe the defining features of “incomplete retinal pigment epithelial (RPE) and outer retinal atrophy” (iRORA), a consensus term referring to the optical coherence tomography (OCT) based anatomical changes often identified prior to the development of “complete RPE and outer retinal atrophy (cRORA)” in age-related macular degeneration (AMD). We provide descriptive OCT and histological examples of disease progression.
Design:
Consensus meeting
Participants:
Panel of retina specialists, including retinal imaging experts, reading center leaders and retinal histologists.
Methods:
As part of the Classification of Atrophy Meeting (CAM) program, an international group of experts analysed and discussed longitudinal multimodal imaging of eyes with AMD. Consensus was reached on a classification system for OCT-based structural alterations that occurred prior to the development of atrophy secondary to AMD. New terms of complete and incomplete RPE and outer retinal atrophy (iRORA and cRORA) were defined. This report describes in detail the CAM consensus on iRORA.
Main Outcome Measures:
Defining the term iRORA through OCT imaging and longitudinal cases showing progression of atrophy, with histologic correlates.
Results:
OCT was used in cases of early and intermediate AMD as the base imaging modality to identify cases of iRORA. In the context of drusen, iRORA is defined on OCT as (1) a region of signal hypertransmission into the choroid and (2) a corresponding zone of attenuation or disruption of the RPE, and (3) evidence of overlying photoreceptor degeneration. The term iRORA should not be used when there is an RPE tear. Longitudinal studies confirmed the concept of progression from iRORA to cRORA.
Conclusions:
An international consensus classification for OCT-defined anatomical features of iRORA, are described and examples of longitudinal progression to cRORA are provided. The ability to identify these OCT changes reproducibly, is essential to better understand the natural history of disease, to identify high risk signs of progression and to study early interventions. Longitudinal data are required to quantify the implied risk of vision loss associated with these terms. The CAM classification provides initial definitions to enable these future endeavours, acknowledging that the classification will be refined as new data are generated.
Keywords: Atrophy, Age-related macular degeneration, Optical coherence tomography, Multimodal imaging
Precis
We describe the features of “incomplete retinal pigment epithelial and outer retinal atrophy” (iRORA), a consensus term referring to the optical coherence tomography based anatomical changes identified prior to the development of atrophy in age-related macular degeneration.
Introduction
Geographic atrophy (GA) is a late-stage disease manifestation in non-neovascular age-related macular degeneration (AMD) that progresses to severe central vision loss. GA has traditionally been defined on color fundus photographs (CFP) as a sharply delineated circular or oval area of hypopigmentation or depigmentation in which choroidal vessels are visible. The size requirement for GA varies with the different studies, ranging from 1/8 to 1/4 of a disc area (corresponding roughly to 175 μm and 430 μm in diameter, respectively) on CFPs. (1,2) GA was retained as a term for a late stage of AMD in the 2013 Beckman CFP classification of AMD. (3)
As a clinical trial endpoint, the ability to slow GA expansion using a novel therapy has been approved by regulatory authorities, where atrophy can be defined and quantified by fundus autofluorescence (FAF). (4–6) Recent trials aiming to slow progression of atrophy were required to enroll eyes with established regions of GA that could be reliably measured by a reading center, usually measuring at least 0.5–1.0 disc areas (1.25–2.5 mm2) in size. (7–9) It is preferable to initiate treatment earlier in the disease process, before GA was detectable. However, this strategy requires a clinical trial endpoint focused on the prevention of GA onset rather than the progression of pre-existing GA lesions. (10)
Previous studies have identified characteristic fundus features that are associated with a high risk for progression to GA. The Age-Related Eye Disease Study (AREDS) determined that large drusen within the central macula and pigmentary changes identified on CFP confer risk. (11) More recently, multimodal imaging (MMI), including OCT, has identified other macular features that increase the risk of vision loss, including increased drusen volume, decreased internal reflectivity of drusen (identified as calcified drusen), intra-retinal hyperreflective foci and subretinal drusenoid deposits (SDD) (also known as reticular pseudodrusen). (12–22) In addition, as drusen regress, the overlying retinal layers undergo characteristic changes in progressing to atrophy that can be captured on OCT imaging. These changes, referred to as nascent GA (nGA) in previous reports, include subsidence of the inner nuclear layer (INL) and outer plexiform layer (OPL), a hyporeflective wedge-shaped band within the Henle fiber layer, often accompanied by RPE disturbance and increased signal hypertransmission into the choroid. (23–26) With the recent advances in OCT angiography, more is being learnt about other potential biomarkers of progression risk. (27–28) Therefore when clinical trials are being designed for agents that aim to prevent atrophy development, it will be important to take these clinial variables into account. Using these variables will make it possible to enroll eyes at high-risk and thus likely to progress to atrophy within a clinically relevant timeframe.
To characterize further the anatomical biomarkers that predict GA development, experts of the Classification of Atrophy Meeting (CAM) group addressed this topic. This group was convened to explore the use of MMI and devise a new consensus nomenclature for the different stages of AMD, as well as explore new strategies to identify and determine our ability to reproducibly capture early stages using OCT. To determine stages of disease progression, case examples with longitudinal follow-up were provided and studied by the group.
In the first two CAM reports, the definition of the term GA in the ophthalmological literature was reviewed, and guidelines for the application of various imaging modalities for clinical research in AMD were generated. (29,30) In the third CAM report, OCT was recommended as the base or reference modality to identify early atrophic changes, with other modalities used for confirmation. The CAM group also recommended that the atrophic stages of AMD should be named according to the affected anatomical layers on OCT. (31) In that report, the term, complete retinal pigment epithelial and outer retinal atrophy (cRORA) was proposed as an endpoint for atrophy that occurred in the presence of drusen and was defined by the following criteria: (1) a region of hypertransmission of at least 250 μm in diameter, and (2) a zone of attenuation or disruption of the RPE of at least 250 μm in diameter, and (3) evidence of overlying photoreceptor degeneration, all occurring in the absence of signs of an RPE tear. (31) The term incomplete RORA (iRORA) was introduced to describe a stage of AMD where these OCT signs were present but did not fulfil all the criteria for cRORA.
In this report, we describe in detail the necessary OCT features that define iRORA and demonstrate longitudinal progression from this earlier stage to cRORA with illustrated case examples and histological correlates. We also provide corresponding images from other modalities as they play a role in validating that the atrophic process has commenced. These case examples are intended to allow the AMD clinical and research community, as well as industry and regulatory bodies, to become familiar with the advances made in understanding the progression from drusen to GA in AMD and the proposed OCT nomenclature that is crtitical for ensuring harmonization when describing these changes. Progression sequences to atrophy from precursor signs other than drusen (e.g., subretinal drusenoid deposits) do occur and these will be addressed in a separate report.
Methods
Classification of Atrophy Meeting (CAM) Group
An international team of experts in AMD, retinal imaging, and histopathology was assembled to develop multimodal definitions of atrophy in the setting of AMD. The selection of members has been described elsewhere but included clinician-scientists, experts in retinal imaging, image reading center leaders, clinical trialists and histologists (31) (the full list of participants is provided in Appendix 1). Representatives from pharmaceutical and imaging device companies attended the meetings as observers.
CAM Meetings and Overview of Consensus Methodology
The CAM Group met on five occasions: June 2015, September 2015, June 2016, February 2018, and January 2019. CAM participants contributed longitudinal case studies that displayed the various OCT features of atrophy to stimulate open discussion and analysis at each meeting. The pathway to consensus has been outlined elsewhere (31). In brief, participants were asked to review image sets and identify anatomical features in atrophic areas and in the junctional zone between normal retina at the margins of atrophy. In longitudinal cases, CAM participants were asked to determine the time point at which atrophy was first noted, using each of several imaging modalities independently, including CFP, near infrared reflectance (NIR), FAF, and OCT (crosssectional and en face). The definitions described in the CAM report 3 and this report are intended to be applied in the setting of AMD, a disease currently defined by the presence of drusen with or without SDDs.
For this report, MMI of cases that best demonstrated signs of iRORA and progression to cRORA are highlighted. In addition, cases without the full complement of iRORA signs are shown to depict variation in presentation, prior to the development of cRORA.
Results
iRORA
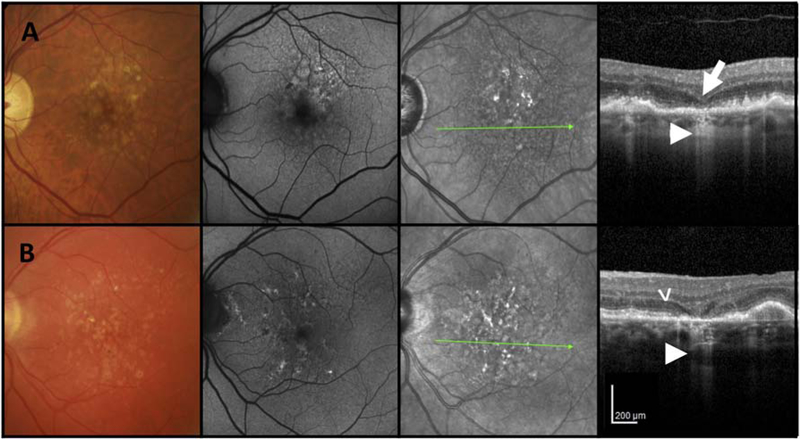
The CAM 3 meeting established that nomenclature for the pathological process that could be observed as the disease progressed towards GA would be based upon the specific retinal layers affected (Fig 1). In the context of AMD with conventional drusen, iRORA is defined on OCT by the following criteria: (1) a region of signal hypertransmission into the choroid and (2) a corresponding zone of attenuation or disruption of the RPE, with or without persistence of basal laminar deposits (BLamD), and (3) evidence of overlying photoreceptor degeneration, i.e., subsidence of the inner nuclear layer (INL) and outer plexiform (OPL), presence of a hyporeflective wedge in the Henle fiber layer (HFL), thinning of the outer nuclear layer (ONL), disruption of the external limiting membrane (ELM), or disintegrity of the ellipsoid zone (EZ), and when these criteria do not meet the definition of cRORA. The term iRORA should not be used in the presence of an RPE tear. Corroborating signs on CFP, FAF, and NIR are not required as they are not always evident (Fig 1).
Figure 1. Examples of multimodal imaging features of incomplete retinal pigment epithelium and outer retinal atrophy (iRORA).
First column = color fundus photograph (CFP), second column = fundus autofluorescence (FAF), third column = near infrared reflectance (NIR), fourth column = optical coherence tomography (OCT) B-scan. A and B) CFP of the left maculae of two individual cases with large drusen. First column: CFP shows drusen and pigmentary changes without evidence of GA. Second column: FAF shows only small areas of hypo autofluorescence. Third column: NIR image illustrates no evidence of atrophy. Fourth column: OCT B-scan shows subsidence of the inner nuclear layer (INL) (large arrow) and outer plexiform layer (OPL). Note the hyporeflective wedge-shaped band within the limits of the Henle fibre layer (B) (arrow head). Note loss of photoreceptors as evidenced by outer nuclear layer (ONL) thinning and loss of external limiting membrane (ELM), ellipsoid zone (EZ) and interdigitation zone (IZ). Subjacent to the area of photoreceptor loss is a zone of attenuation and disruption of the RPE (<250 μm). A region of signal hypertransmission into the choroid is < 250 μm in continuity (small arrow). This fulfils the criteria for iRORA.
Progression of iRORA
Review of longitudinal follow-up of many cases (50 longitudinal cases were formally reviewed and assessed by all CAM members, then collected and analysed prior to CAM meetings, with these results presented and discussed as well as many other cases presented during the meetings) with iRORA confirms that these areas progress and develop into cRORA over a variable period of time ranging from months to years.
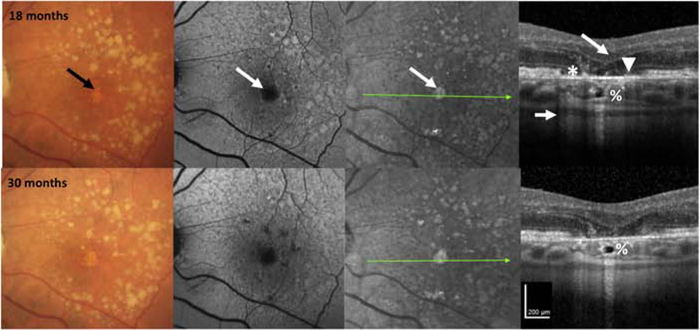
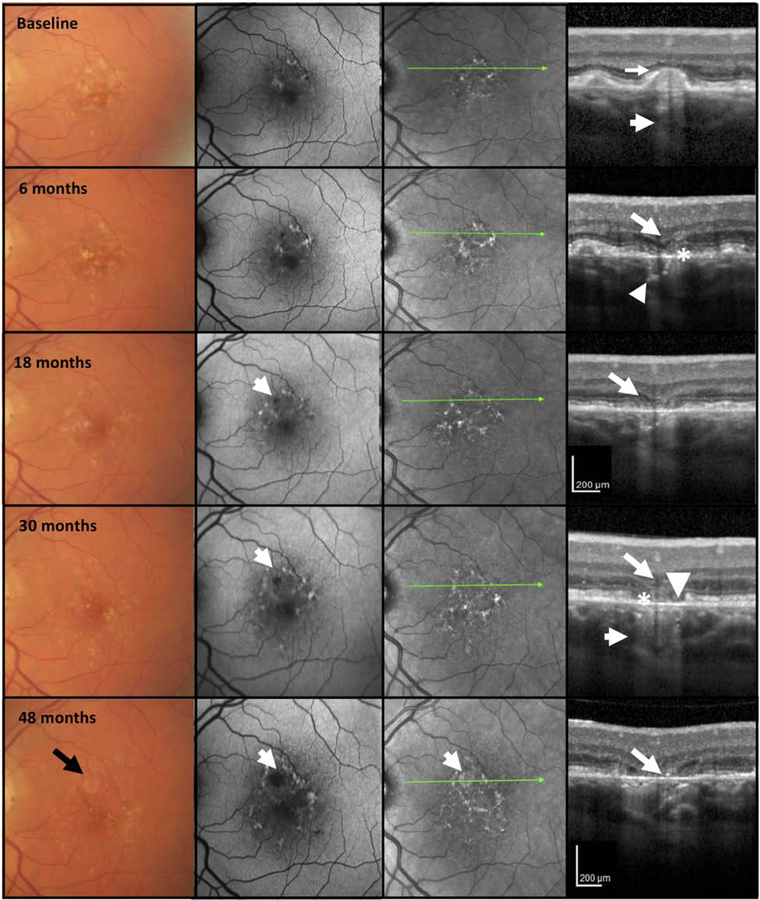
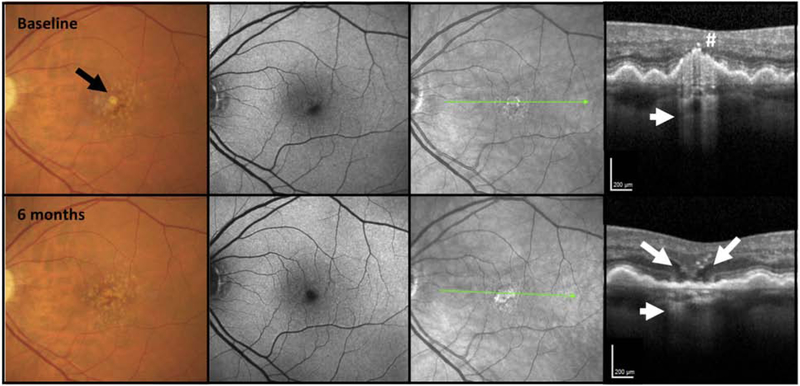
Examples of progression in two cases, imaged every six months, are illustrated in Figures 2 and 3. In both cases, baseline B-scans reveal eyes with large drusen, in which the ELM appears disrupted over the apex of a druse. The druse in Figure 2 is associated with hyperreflective foci at its apex, with increasing hypertransmission before the development of iRORA at 6 and 12 months with subsequent progression to cRORA at 18 months. In Figure 3, the druse at baseline is already associated with hypertransmission of the signal into the choroid, and progresses to iRORA at 6 months, with an obvious hyporeflective wedge within the HFL. At 30 months of follow-up, cRORA is established.
Figure 2. Multimodal imaging of an AMD case illustrating progression from incomplete to complete retinal pigment epithelium and outer retinal atrophy (iRORA and cRORA) over 30 months.
First column = color fundus photograph (CFP), second column = fundus autofluorescence (FAF), third column = near infrared reflectance (NIR), fourth column = optical coherence tomography (OCT) B-scan.
CFP of the left macula in a case with large drusen and hyperpigmentation, reticular pseudodrusen on FAF, and hyperreflective foci (#) on OCT at baseline. There is disruption of some outer retinal bands and the RPE, but no definite hypertransmission is present, so the criteria for iRORA are not met. At 6 months, there is hypertransmission into the choroid that is seen on OCT (small arrow), so iRORA criteria are now met. At 12 months, iRORA is more definitely seen on the OCT with RPE disruption < 250 μm wide (*), with remaining RPE cells difficult to distinguish from persistent basal laminar deposits (BLamD). There is subsidence of the inner nuclear layer (INL), outer plexiform (OPL), an external limiting membrane (ELM) descent on either side of the atrophy (large arrow), with corresponding hypertransmission (small arrow). There is no definite evidence of GA on CFP or atrophy on either FAF or NIR. At 18 months, the eye progresses to cRORA or GA on CFP (black arrow), and atrophy on FAF and NIR (white arrow). The OCT illustrates evidence of photoreceptor loss (subsidence of the INL and OPL, thinning of the ONL, discontinuous ELM descending on the sides of the atrophy, discontinuity of the ellipsoid zone (EZ) and interdigitation zone (IZ) (large arrow), an area of complete RPE disruption (without residual BLamD), > 250 μm (*) showing a bare Bruch’s membrane (BrM) (arrowhead) and increased hypertransmission > 250 μm (small arrow). At 30 months, the initial atrophic area has changed little compared to 18 months, but additional areas of atrophy are becoming apparent on FAF and NIR. The hyporeflective space in the choroid at 18 and 30 months has been described as a choroidal cavern (%).
Figure 3. Multimodal imaging of an AMD case illustrating progression from incomplete to complete retinal pigment epithelium and outer retinal atrophy (iRORA and cRORA) over 48 months.
First column = color fundus photograph (CFP), second column = fundus autofluorescence (FAF), third column = near infrared reflectance (NIR), fourth column = optical coherence tomography (OCT) B-scan.
CFP of the left macula in a case illustrating large drusen and hyperpigmentation at baseline. FAF shows areas of hypo and hyper autofluorescence on FAF. The OCT at baseline shows a large druse, demonstrating hypertransmission into the choroid (small arrow). The external limiting membrane (ELM) is not clearly seen on top of this druse (large arrow) and the RPE appears intact. As such, the criteria for iRORA are not present. At 6 months, there is little change in CFP, FAF, and NIR, but on OCT, iRORA has developed, with subsidence of the inner nuclear (INL) and outer plexiform (OPL) layers (large arrow), thinning of the outer nuclear layer (ONL) and subsidence of the ELM which is still continuous. The ellipsoid zone (EZ) and RPE are discontinuous (*) and there is increased hypertransmission into the choroid (small arrow). At 18 months, whilst there is little change on the CFP, there is now a hypoautofluorescent area apparent on the FAF (small arrow). On OCT, there is a definite descent and disruption of the ELM on either side of the atrophic area, and in the midst of the atrophic area, OPL and INL subsidence (large arrow), further disruption of RPE, and possible BLamD remaining on Bruch’s membrane (BrM). At 30 months cRORA and atrophy on the FAF are evident, whilst the CFP does not demonstrate GA. The OCT has evidence of photoreceptor loss (subsidence of the INL and OPL, thinning of the ONL, discontinuous ELM descending on both sides of the atrophic area, discontinuity of the EZ and interdigitation zone (IZ) (large arrow), an area of complete RPE disruption (*) without residual BLamD > 250 μm in width and showing a bare BrM (arrowhead) and hypertransmission > 250 μm (small arrow). At 48 months, GA is identified on CFP (black arrow), enlarged area of atrophy on FAF is apparent, and atrophy is noted on the NIR image (white arrow). On OCT, the subsiding OPL within the atrophic area approaches BrM (large arrow).
Histological correlate of iRORA
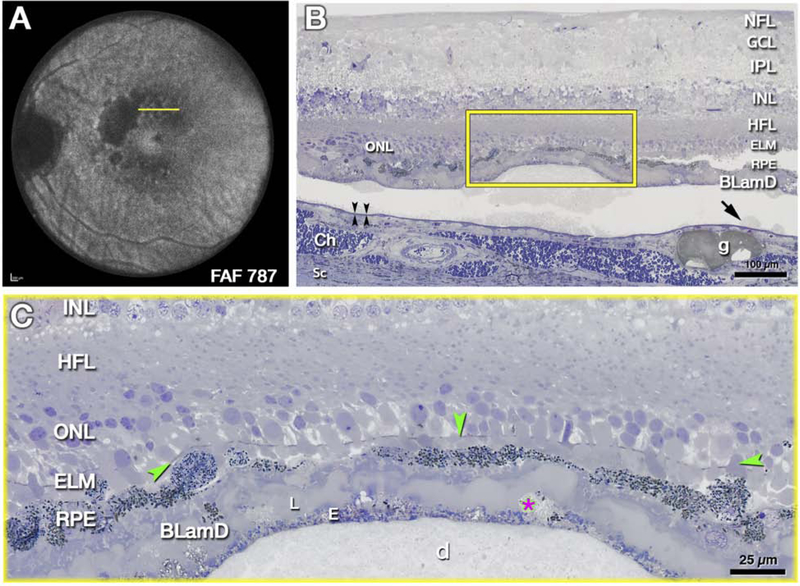
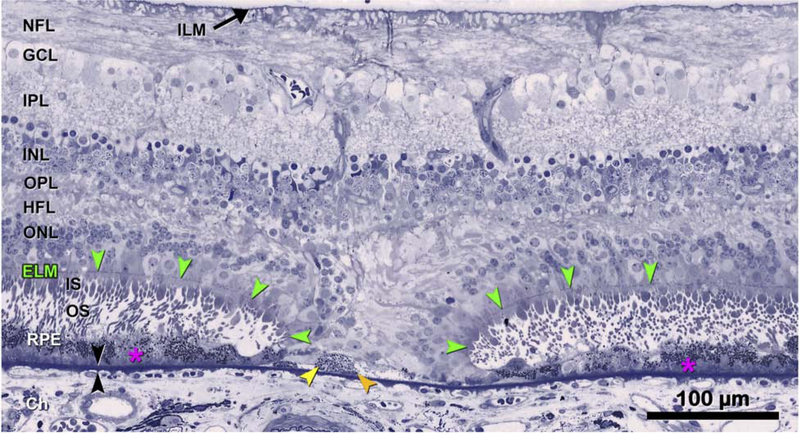
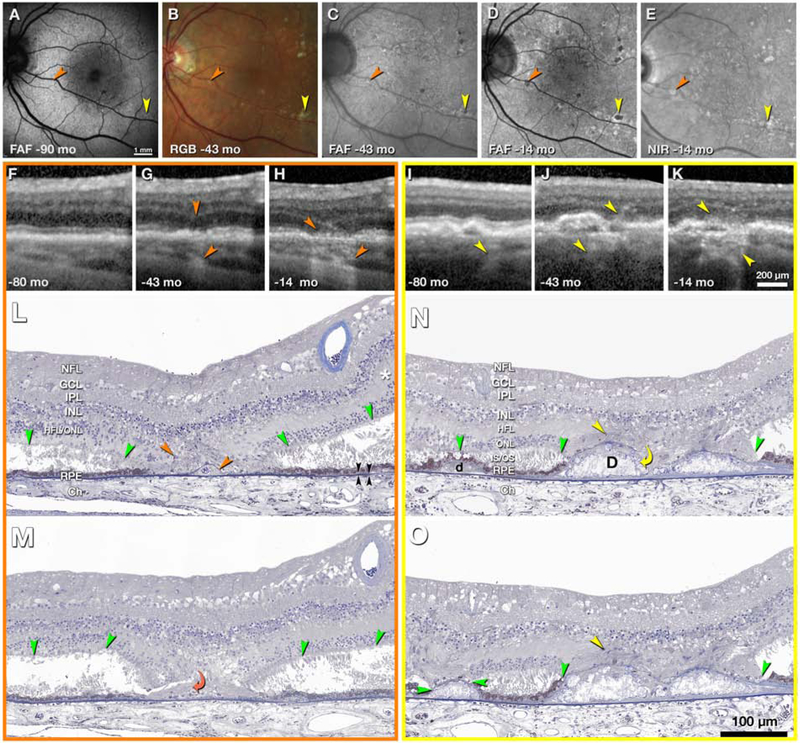
Figures 4–6 present histology that supports the clinical imaging in Fig. 1–3. Fig. 4 illustrates a large druse in a donor eye with GA, where photoreceptor outer segments are absent and inner segments are markedly shortened, and thus the ELM approaches the druse apex. At the druse apex, RPE is dysmorphic or absent. These histological findings correlate with the clincal appearance of photoreceptor loss, seen as degradation and thinning of photoreceptor-attributable bands (HFL-ONL, ELM, EZ, IZ) in Figures 1–3. Fig. 5 shows histology of drusen-associated atrophy (Fig. 5 L–M, N–O) and clinical imaging documenting the development of atrophy over almost 7 years (Fig. 5F–H, I–K). The appearance of hypertransmission on OCT preceded (Fig. 5G) or accompanied (Fig. 5J) atrophy on FAF imaging (Fig. 5A,C,D). By histology (Fig. 5L–M), the ONL and RPE are absent in an area that is delimited on both sides by two ELM descents. Within the area of atrophy, tombstone markers of a prior druse are persistent basal laminar deposits (BLamD) overlying calcific nodules. In Fig. 5N–O, an atrophic spot on each druse apex includes photoreceptor degeneration (i.e., absent inner and outer segments). A profound finding on histology is significant gliosis associated with each atrophic area (Fig. 5M,N,O). This may be recognizable on OCT by increased reflectivity of the normally hyporeflective HFL. Fig. 6 provides a high magnification view of the ELM descending towards Bruch’s membrane (BrM) in two curved lines bounding a narrow isthmus of atrophy. The HFL, OPL, and INL subside between the two ELM descents, creating a funnel. Hyporeflective wedges in the HFL have been correlated histologically to parallel Henle fibers without cellular infiltration that are permissive to transmitted light on the same axis (32) The ONL descends in parallel with the ELM and is absent in the atrophic area. Along the ELM descents, the remaining cone photoreceptors are horizontally oriented, lack outer segments, and have short inner segments.
Figure 4: External limiting membrane (ELM) approaches druse apex due to photoreceptor shortening.
The histology in Fig 4 supports clinical imaging in Fig 2, 3 and illustrates changes in photoreceptor layers above a large druse as the atrophic process begins. A. Ex vivo imaging of the left eye of 85-year-old white female donor with geographic atrophy. Areas of absent autofluorescence signal (λ=787 nm) indicate complete retinal pigment epithelium (RPE) and outer retinal atrophy (cRORA). Yellow line crosses an area of mottled autofluorescence shown by histology. B, C. Submicrometer epoxy sections of osmium tannic acid paraphenylenediamine post-fixed tissue, stained with toluidine blue, at the plane indicated in A. B. Retina, RPE, and basal laminar deposit (BLamD) are artifactually detached from Bruch’s membrane (black arrowheads) at a soft druse and surrounding basal linear deposit (arrow). Framed area is magnified in C. NFL, nerve fiber layer; GCL, ganglion cell layer; IPL, inner plexiform layer; HFL, Henle fiber layer; ONL, outer nuclear layer; ELM, external limiting membrane; Ch, choroid; Sc, Sclera. g, Friedman lipid globule. C. An intact ELM (green arrowheads) skims close to the druse (d) apex, because photoreceptor outer segments are absent and inner segments are markedly shortened. RPE atop the druse is dysmorphic or absent. BLamD is thick with sublayers (L, late, E, early), including basal mounds (asterisk). Histology and figure prepared by J.D. Messinger DC from the Project MACULA resource http://projectmacula.cis.uab.edu/
Figure 6: Descent of the external limiting membrane (ELM) towards Bruch’s membrane.
The histology supports the clinical imaging in Figure 2,3, bottom row. The ELM descends in two curved lines on either side of a narrow isthmus of atrophy typically seen in iRORA. The ONL, HFL, OPL, and INL subside in parallel to the ELM, creating a funnel. The ONL is discontinuous, and the HFL is disordered. Where these ELM descents curve, surviving cone photoreceptors lack outer segments and have short inner segments. Layers: ELM, external limiting membrane (green arrowheads); ILM, inner limiting membrane; NFL, nerve fiber layer; GCL, ganglion cell layer; IPL, inner plexiform layer; INL, inner nuclear layer; OPL, outer plexiform layer; HFL, Henle fiber layer; ONL, outer nuclear layer; ChC, choriocapillaris; black arrowheads, Bruch’s Membrane. 87-year-old white male donor. Prepared by M. Li MD PhD and J.D. Messinger DC from the Project MACULA AMD histopathology resource: http://projectmacula.cis.uab.edu/
Figure 5. Evolution and clinicopathologic correlation of druse-associated atrophy.
Time points of clinical images are shown as months before death of this 90-year-old white woman. A-E, en face imaging shows developing atrophic spots (orange and yellow arrowheads). FAF, fundus autofluorescence (excitation wavelengths 488, 535–585, 532 nm in A,C,D respectively); RGB, color photograph; NIR, near-infrared reflectance. F-H, I-K, optical coherence tomography (OCT) B-scans through the orange and yellow atrophic spots, respectively. Upper and lower arrowheads in G-H and I-J indicate hyperreflectivity corresponding to gliosis and hypertransmission into the choroid, respectively; L-N, histologic sections through yellow and orange atrophic spots. In atrophic areas retina is attached to posterior tissues. Outside atrophic areas there is artifactual bacillary layer detachment. The HFL, in areas of minimal photoreceptor degeneration (asterisk in L), is pale-stained and ordered. In areas of photoreceptor loss, the HFL is stained medium-gray, with disordered fibers and evidence of Müller cell bodies (orange and yellow arrowheads), signifying gliosis. Green arrowheads, external limiting membrane (ELM). Black arrowheads, Bruch’s membrane. L, M, histologic sections 60 μm apart through the orange atrophic spot. In L is a base-down triangle of gliosis (upper arrowhead) and an area of absent ONL bounded by two ELM descents. The prior presence of a druse is indicated by calcific nodules under a blue-stained line of persistent BLamD (lower arrowhead in L). In M, the curved arrowhead indicates where processes from the HFL enter under the BLamD. N, O, two histologic sections 30 μm apart through the yellow atrophic spot. In the center are two drusen (D) with absent RPE and containing large calcific nodules. Through an interruption in the BLamD, gliotic processes enter from the HFL (yellow curved arrow, N). In the HFL are presumed Müller cell bodies (yellow arrowheads, N, O). On the left side of N is a small druse (d) with continuous RPE and ELM. In O, the ELM has descended onto the druse apex, which is covered with persistent BLamD. The RPE is absent. BLamD, basal laminar deposit. NFL, nerve fiber layer; GCL, Ganglion cell layer; IPL, inner plexiform layer; INL, inner nuclear layer; OPL, outer plexiform layer; HFL, Henle fiber layer; ONL, outer nuclear layer; IS/OS, inner and outer segments; RPE, retinal pigment epithelium; Ch, choroid. Prepared by J.D. Messinger DC and L. Chen MD PhD.
Variability in the sequence of anatomical changes seen in early atrophy
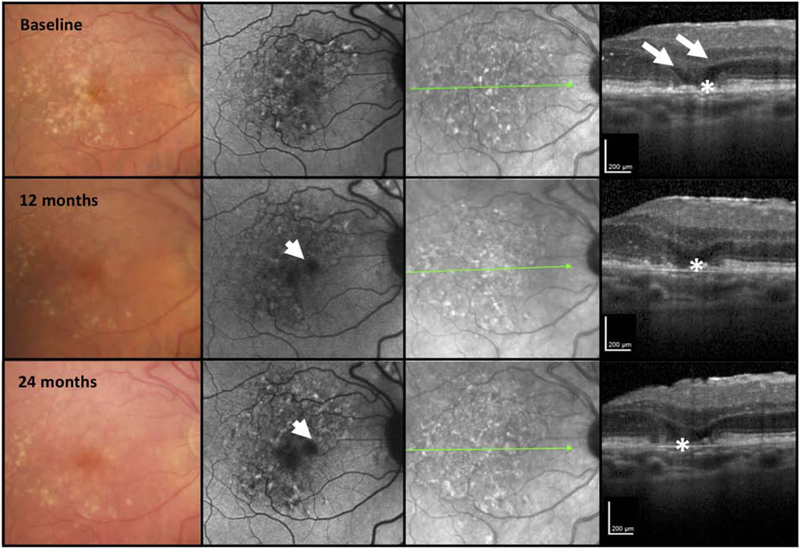
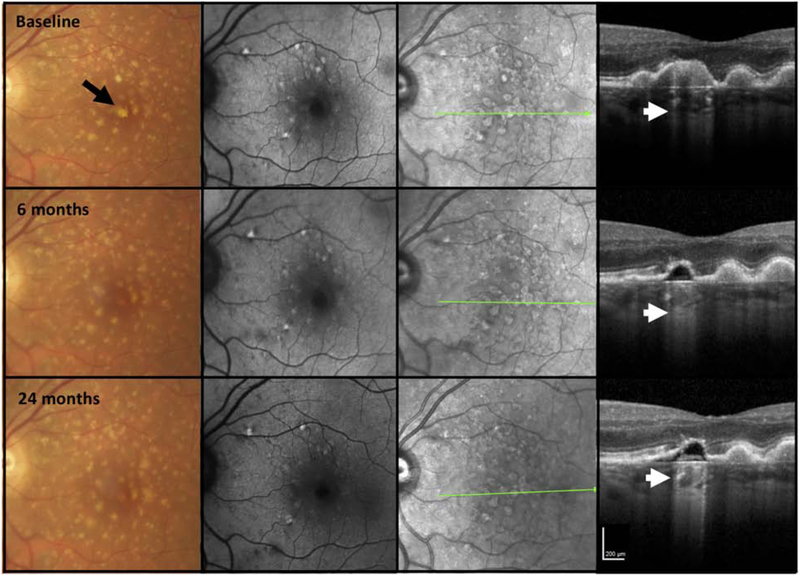
With OCT imaging, cases of early atrophy may be identified where some iRORA signs are absent, and cases in which the NIR, FAF and CFP images do not always corroborate these signs of atrophy. This variability may be important in representing different phenotypes with different natural histories and disease severity (Fig 7–9). In Fig. 7, OCT imaging illustrates loss of the outer retina and increasing disruption of the RPE layer, followed by loss of the RPE layer and increasing hypoautofluorescence on FAF imaging. However, the extent of hypertransmission into the choroid, which should depend on the disruption of the RPE layer, does not appear commensurate to the baring of BrM. As such, at no time point in this example would the definition of iRORA be met. Fig. 8 at baseline demonstrates a collapsing druse with outer retinal loss, attenuation of the RPE and hypertansmission, and would therefore meet the definion of iRORA. However, at 6 months, the RPE appears intact in the same area as the collapsed druse, appearing similar to adjacent RPE. Significant hypertransmission into the choroid can be appreciated, despite the apparent relatively intact RPE layer. Given the intact RPE, at this later time point, iRORA criteria are not met.
Figure 7. Multimodal imaging of an AMD case illustrating retinal pigment epithelium loss without choroidal hypertransmission over 24 months.
First column = color fundus photograph (CFP), second column = fundus autofluorescence (FAF), third column = near infrared reflectance (NIR), fourth column = optical coherence tomography (OCT) B-scan.
The right macula of a case demonstrating large drusen and pigmentary abnormalities on the CFP. At baseline the FAF demonstrates a mottled hypo- and hyperautofluorescent signal. The NIR also presents a mottled reflectance. The OCT demonstrates minimal subsidence of the inner nuclear layer (INL), outer plexiform layer; (OPL) but obvious hyporeflective wedges in Henle’s fiber layer (HFL) (large arrows). There is RPE attenuation (*) without obvious hypertransmission into the choroid. At 12 and 24 months, whilst there is increasing hypoautofluorescence on FAF imaging and progressive loss of the RPE (*) and a bare Bruch’s membreane (BrM). There is minimal hypertransmission into the choroid on the OCT, where greater hypertransmission would be expected to accompany the RPE loss. At no time point in this illustration were all the criteria met for iRORA.
Figure 9. Multimodal imaging of an AMD case illustrating marked choroidal hypertransmission despite relatively intact retinal pigment epithelium and persistence of the druse contour.
First column = color fundus photograph (CFP), second column = fundus autofluorescence (FAF), third column = near infrared reflectance (NIR), fourth column = optical coherence tomography (OCT) B-scan
The left macula of a case illustrating large drusen on CFP with some hypopigmentation at baseline (black arrow). FAF and NIR do not demonstrate areas of hypoautofluorscence on FAF or reduced NIR, respectively. On OCT at baseline a druse displays hypertransmission into the choroid (bar code appearance, white arrow). There is no subsidence of the the inner nuclear layer (INL), outer plexiform layer; (OPL), and the RPE is preserved, thus not fulfilling all criteria for iRORA. At 6 months, the druse has reduced in size and appears hyporeflective but the overlying RPE remains intact above it, yet there is hypertransmission of the signal into the choroid (small arrow). All the criteria for iRORA are still not met. Over time the druse contour and marked hypertransmission persist (small arrow), and internal reflectivity partially fills the druse, the RPE is now becoming attenuated, although still with potentially residual basal laminar deposit (BLamD). At 24 months, all the criteria for iRORA have been met. Despite the hypertransmission there is no obvious hypoautofluorescence on FAF, although this area is masked by luteal pigment. No hyporeflective areas are seen on NIR, nor is there any corresponding GA on CFP.
Figure 8. Multimodal imaging of an AMD case illustrating choroidal hypertransmission despite apparent presence of the retinal pigment epithelium.
First column = color fundus photograph (CFP), second column = fundus autofluorescence (FAF), third column = near infrared reflectance (NIR), fourth column = optical coherence tomography (OCT) B-scan.
The left macula of a case of intermediate AMD illustrating large drusen and pigment disturbance, including one area of hypopigmentation (black arrow), not obvious on FAF but seen as a circumscribed area on NIR. At baseline, the OCT demonstrates a large druse with hyperreflective foci (#) at the druse apex and hypertransmission into the choroid (small arrow) in a “bar code” appearance. The RPE is attenuated. There is no subsidence of the inner nuclear layer (INL), outer plexiform layer; (OPL), although the ONL is thinned, and the external limiting membrane (ELM) and ellipsoid zone (EZ) are discontinuous. At baseline all criteria for iRORA have been met. At 6 months, the druse has regressed, and there are two hyporeflective wedges in HFL, subsidence of the OPL and ONL, and a descent of the ELM bounding both sides of the atrophy (large arrows). However, the RPE now appears to remain intact, although there is hypertransmission clearly present (small arrow). As such, at this time point, all the criteria for iRORA are not met. As the CFP image has a corresponding area of hypopigmentation, one explanation for this RPE appearance is preferential loss of melanosomes from the RPE that reduces (but does not eliminate) backscatter.
In Fig. 9, a case of iAMD is presented with a druse displaying hypertransmission at baseline. There is loss of some outer retinal layers, but the RPE is preserved, thus not fulfilling all criteria for iRORA. At 6 months, the druse appears non-reflective, but the overlying RPE remains intact (with BLamD), yet there is hypertransmission of the signal into the choroid. All criteria for iRORA are still not met. Over time, the druse contour persists, and there is internal reflectivity within the druse, with persistent and striking hypertransmission (24 months). At 24 months, the RPE is attenuated, and as such, iRORA is now present. Despite the hypertransmission, there is no obvious hypofluorescence on the FAF image (2nd column), although the luteal pigment could hinder recognition of this change. CFP-defined GA is also not identified.
iRORA screening.
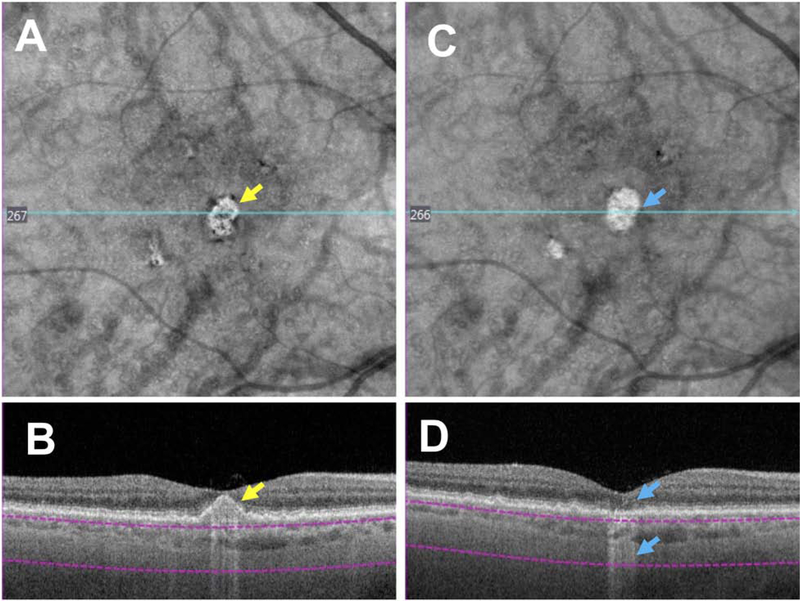
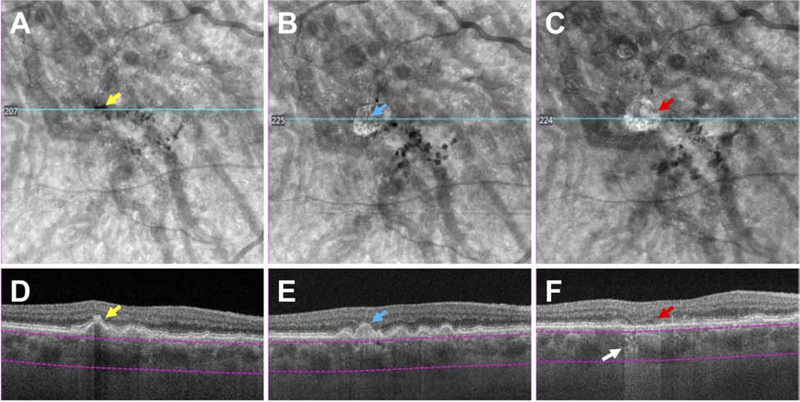
Whilst the CAM group focused primarily on the analysis of single individual OCT B-scans to define characteristic features of iRORA, en face sub-RPE OCT slabs may be used as a screening tool to detect choroidal hypertransmission associated with iRORA, which could then be confirmed with the corresponding B-scans. The specificity and sensitivity of en face imaging as a screening tool remains to be determined (Fig. 10,11) (26,33). In Figure 10, a case with large drusen is shown in A and B, in which a custom slab en face structural swept source (SS) OCT image illustrates bright areas corresponding to the hypertransmission signal. These areas are associated with loss of photoreceptor attributable bands (although difficult to appreciate directly beneath the fovea). As there is no clear RPE attenuation or disruption, the criteria for iRORA have not been meet. Six months later in Figure 10D a small disruption in the RPE is seen and iRORA criteria are meet. In Figure 11, the case illustrates drusen with baseline en face structural images that initially display a dark area that corresponds to anterior pigment migration over a druse (Fig. 11D). With time, the follow up en face structural image shows a bright area (B) that corresponds to the druse associated with a subtle hypertransmission signal into the choroid, subsidence of the INL and OPL and attenuation of the RPE, fulfilling all the criteria for iRORA in Fig. 11 E and F. (11F)
Figure 10. Screening for iRORA using an en face slab with boundaries beneath the retinal pigment epithelium (RPE) to detect hypertransmission into the choroid using swept source (SS) OCT imaging.
6×6 mm SS OCTA images of a right eye with large drusen. Panels A and B depict the eye at baseline and panels C and D show progression after 6 months. A: En face structure image using custom sub-RPE slab depicted by the purple boundary lines in B, and the bright area (yellow arrow) corresponds to the area of hypertransmission shown in B. B: SS-OCT B-scan showing a large druse with hypertransmission (yellow arrow). The boundary lines for the sub-RPE slab are shown beneath the RPE. There is loss of the photoreceptor-attributable bands, but the RPE remains intact, and as such, criteria for iRORA have not been met. C: Six months later, an en face structure image using the same custom sub-RPE slab depicted in panel A, but with a brighter area (blue arrow) corresponding to the area of hypertransmission shown in panel D. D: SS-OCT B-scan showing the collapse of the large druse with hypertransmission (lower blue arrow), disruption of the outer retinal layers (upper blue arrow) and a small disruption in the RPE can be seen. All criteria for iRORA have been reached.
Figure 11: Screening for iRORA using an en face slab with boundaries beneath the retinal pigment epithelium to detect both hypo- and hypertransmission into the choroid using swept source (SS) OCT imaging.
6×6 mm SS OCTA images in an eye with large drusen. Figures A and D represent the baseline visit, B and E at the 12 months’ follow-up visit, and C and F at the 20 months’ follow-up visit, where iRORA is evident (red arrow). A: En face structural image using a custom slab (purple lines) showing a hyporeflective area (yellow arrow) corresponding to pigment migration (hyperreflective foci) over the druse in D (yellow arrow). B-F: En face structure images using a custom slab showing a hyperreflective area (blue arrow in B and red arrow in C), which respectively corresponds to drusen (E, blue arrow) with hypertransmission (white arrow) (F), subsidence of the INL and OPL, and a faint wedge-shaped band in the HFL (red arrow). In E, there is subtle hypertransmission into the choroid, subsidence of the INL and OPL and attenuation of the RPE, fulfilling all the criteria for iRORA, and again in F, iRORA is present, and the druse has regressed completely.
Discussion
A consensus nomenclature and definition for atrophy, based upon OCT imaging, was proposed by the CAM group. The terms iRORA and cRORA are defined, both in this and our prior report (31), to describe the evolution of atrophy in AMD. For iRORA to be present, three OCT features are required to be present and vertically aligned: signs of photoreceptor degeneration, RPE attenuation or disruption, and increased signal transmission into the choroid. If the areas of RPE change and hypertransmission each have a diameter of at least 250 μm on the OCT B-scan, in addition to evidence of photoreceptor loss, then they would qualify for cRORA. A minimum size limit for iRORA was not proposed, and the ability of reading centers to reproducibly identify the constellation of iRORA signs is not yet known. The aim of this paper is to provide criteria and nomenclature for cell loss as seen on OCT. As discussed below, it is now imperative to determine how reliably specific features of iRORA can be graded and their usefulness in predicting progression.
Using case examples with longitudinal follow-up in eyes with drusen (Figures 2,3) we provide evidence that the features of iRORA predict development of cRORA. These case studies demonstrate the spectrum of OCT signs that indicate photoreceptor degeneration, RPE disruption or attenuation, and hypertransmission of the signal into the choroid.
Reproducibility for identifying iRORA is crucial and will undoubtedly improve as clinicans and reading centers become more familiar with the OCT findings as well as with advances in OCT technology and adoption of artificial intelligence algorithms as they become available. The CAM group felt that the term geographic atrophy (GA), well entrenched in the AMD nomenclature, but with several current CFP definitions, should remain and continue to be used as a term applied to the subset of cRORA occurring in the absence of current or past macular neovascularization (MNV). Similarly, the term nascent (nGA) should be used more broadly when iRORA is present in the absence of current or prior MNV, signifying that progression toward GA has begun (23,24). This is a slight modification from its original OCT description, which required subsidence of the INL and OPL or a hyporeflective wedge-shaped band within the Henle fiber layer as evidence of photoreceptor loss, and whilst usual to see RPE change and hypertransmision they were not mandatory (23,24).
It is recognized that even before all three criteria of iRORA are present (photoreceptor and RPE degradation with hypertransmission), there will be OCT scans where some, but not all signs, are present. These eyes should be considered as having risk factors for the progression to iRORA, but to have not yet reached iRORA. They are added to a constellation of other OCT signs such as intraretinal hyperreflective foci, heterogeneous internal reflectivity of drusen, and subretinal drusenoid deposits (SDD), which may be considered as high-risk OCT biomarkers for progression (12–22). These risk factors for progression to iRORA will be explored in planned future publications by the CAM group. The importance attributed to the degradation of each layer or band will become more evident as longitudinal studies accrue detailed grading on each of these changes. As such, the relative weight placed upon each individual layer or zone’s degradation as a predictor of progression to vision loss will become more apparent. Currently detection of these signs involves the inspection of single OCT B-scans, but can be facilitated by screening with en face OCT imaging to detect the choroidal hypertransmission signal (26,33) (Figures 10–11). It is the hope of the CAM group that researchers will apply these definitions and determine the progression rates from iRORA to cRORA, the robustness of en face screening and assess the relative contribution of iRORA components as predictive biomarkers of progression.
With greater knowledge of individual signs and their association with disease progression, it will be possible to inform artificial intelligence algorithms to develop robust models to predict progression. Determining the rate of progression from iRORA to cRORA will be important information when considering the design of new interventional studies to prevent the development of atrophy. Thereafter, a possible way to show efficacy of a therapeutic intervention to slow or halt progression from iRORA to cRORA in clinical trials is to demonstrate alteration of this progression trajectory. The FDA has suggested that the onset of atrophy, if able to be precisely and reproducibility measured, could be acceptable as a trial endpoint (4). In a recent intervention trial of subthreshold laser in participants with bilateral large drusen, progression to nGA was used as an outcome measure, providing initial support for nGA as a surrogate endpoint for GA (34).
Photoreceptor cells contribute to multiple bands of alternating reflectivity in OCT images: OPL (synaptic terminals), HFL (axonal fibres), ONL (cell bodies), ELM (junctions with Müller glia), EZ (outer part of photoreceptor inner segments), outer segments, and IZ (interface of outer segments with RPE apical processes). Müller glia also participate in the first four of these bands. Clinically, we infer photoreceptor health based upon the integrity of these bands. An important question is whether changes or disruption in any of these bands indicate an irreversible commitment to photoreceptor cell degeneration or whether therapies can still rescue them. In surgically repaired macular holes, it is possible to see reversal of some pre-operative interruption in the ELM and EZ. The reestablishment of a continuous EZ and ELM band in the post-surgical phase correlates with visual acuity improvement (35, 36) where the extent of pre-operative EZ and ELM interruption may be a determining factor in the gain of visual acuity. (37) Whether this amelioration in the morphological changes in the ELM and EZ anatomy could occur in the context of evolving atrophic AMD is not known.
Another important consideration in the study of atrophy, is the intense gliosis of Müller cells that accompanies photoreceptor degeneration and loss. Recent histologic studies of GA have highlighted the role of Müller cells in dyslamination of the combined HFL and ONL (i.e., loss of clear laminar boundaries), formation of the ELM descent and glial scars, and Müller cell persistence after photoreceptor depletion, all of which complicate the task of quantifying photoreceptor abundance and health (38–40) The ELM descent occurs in advance of degeneration in the RPE-BrM complex, a process that is hypothesized as Müller cells barricading the surviving photoreceptors from factors present in the damaged atrophic zone (41). Here we show that the ELM descends on top of individual druse along with RPE loss (Fig. 5). Due to the precise arrangement of cells that comprise the normally hyporeflective HFL and ONL, it may be possible to recognize reflectivity changes accompanying gliosis in this layer on OCT (Fig. 5). Exploring HFL and ONL intensity as a predictor of atrophy expansion may thus have merit (42).
Limitations of our study include the case-based nature of our analysis which may have biased our conclusions. The overall rate of transition from iRORA to cRORA and the proportion of eyes in which this transition occurs is not yet known and requires large prospective studies. However, the purpose of this report, which builds upon the CAM 3 report (31), is to establish a framework around which researchers can move forward to fill in these critical knowledge gaps. We also recognize that the constellation of anatomical signs that we describe are not an absolute, all-or-none phenomena; cases of atrophy can occur through other pathways (43). In many cases of drusen-associated atrophy, we believe the anatomical changes follow the described pathway. Our strength is that a group of experts came to a consensus for signs that we hypothesize are indicating that the path to atrophy has begun, with an increased risk of vision loss from late AMD. The FDA has indicated that it looks to the scientific community for consensus as to when a significant biomarker of disease progression has been reached (4). Creating a path forward to allow further definition of this risk through well designed clinical studies is essential to satify the regualtory authorities and to keep industry collaborators engaged in AMD research, ultimately leading to the development of new AMD therapeutics.
In conclusion, an international consensus classification system and criteria for OCT-defined anatomical changes that occur prior to GA has been advanced, with iRORA described both clinically and pathologically and case examples of longitudinal progression to cRORA provided. Future studies are needed to determine our ability to reproducibly identify these signs, and provide the progression rates from iRORA to cRORA, facilitating their use as robust outcome measures applicable in the design of clinical trials. While there is still much to learn about the longitudinal history of AMD based on natural history studies and histopathology, the proposed consensus nomenclature will find application in studies such as the large European MACUSTAR program. (44) Consideration of these features will be essential for designing interventional trials for treatments that aim to slow progression, as they are potential confounders.
Financial Support:
Acquisition of human donor eyes and the Project MACULA web site were supported by the National Institutes of Health, Bethesda, Maryland (grant nos.: R01EY06019 and P30 EY003039 [C.A.C.]); EyeSight Foundation of Alabama (C.A.C.); International Retinal Research Foundation (C.A.C.); the Edward N. and Della L. Thome Foundation (C.A.C.); the Arnold and Mabel Beckman Initiative for Macular Research (C.A.C.); and Research to Prevent Blindness, Inc, New York, New York (C.A.C.). Clinicopathologic correlation supported by the Macula Foundation (NY; CAC). Supported by the Lowy Research Medical Institute (travel grant, A.C.B.). National Health & Medical Research Council of Australia fellowship GNT1103013 (RHG).
Abbreviations and Acronyms:
- AMD
age-related macular degeneration
- BLamD
basal laminar deposit
- BrM
Bruch’s membrane
- CAM
Classification of Atrophy Meeting
- CFP
color fundus photography
- Ch
choroid
- cRORA
complete retinal pigment epithelium and outer retinal atrophy
- ELM
external limiting membrane
- EZ
ellipsoid zone
- FAF
fundus autofluorescence
- GCL
ganglion cell layer
- GA
geographic atrophy
- HFL
Henle fiber layer
- INL
inner nuclear layer
- IZ
interdigitation zone
- IPL
inner plexiform layer
- iRORA
incomplete retinal pigment epithelium and outer retinal atrophy
- NFL
nerve fiber layer
- NIR
near infrared reflectance
- OCT
optical coherence tomography
- ONL
outer nuclear layer
- OPL
outer plexiform
- RPE
retinal pigment epithelium
- RPD
reticular pseudodrusen
- Sc
Sclera
- SS
Swept Source
- SDD
Subretinal drusenoid deposits
Appendix 1.
List of CAM meeting participants (at least one meeting attended and consensus exercises completed):
Giovanni Staurenghi, Frank Holz, Daniel Pauleikhoff, Srinivas Sadda, Rick Spaide, Rick Ferris, Ferdinando Bottoni, Usha Chakravarthy, Emily Chew, Victor Chong, Karl Csaky, Christine Curcio, Ronald Danis, Francois Delori, Scott Fraser, K. Bailey Freund, Juan Grunwald, Robyn Guymer, Tock Han Lim, Jerry Lutty, Glenn Jaffe, Ivana Kim, Jordi Mones, Richard Rosen, Philip Rosenfeld, David Sarraf, Steffen Schmitz-Valckenberg, Sandra Liakopoulos, Janet Sparrow, Ramin Tadayoni, Francesco Viola, Akio Oishi, Sergio Pagliarini, Alan Bird, Barbara Blodi, Dean Bok, Petrus Chang, Gemmy Cheung, Stephano De Angelis, Andrew Dick, Deborah Ferrington, Jeff Fingler, Monika Fleckenstein, Andrea Giani, Carel Hoyng, Imre Lengyel, Andrew Lotery, Robert F. Mullins, Sobha Sivaprasad, Sebastian Wolf, and Ruikang Wang.
Footnotes
Publisher's Disclaimer: This is a PDF file of an unedited manuscript that has been accepted for publication. As a service to our customers we are providing this early version of the manuscript. The manuscript will undergo copyediting, typesetting, and review of the resulting proof before it is published in its final form. Please note that during the production process errors may be discovered which could affect the content, and all legal disclaimers that apply to the journal pertain.
Conflict of interest:
Dr. Guymer reports grants and personal fees from Novartis, personal fees from Bayer, Apellis, personal fees from Roche/Genentech, outside the submitted work.
Dr. Rosenfeld reports grants and personal fees from Carl Zeiss Meditec during the conduct of the study. He also received additional grant support from Genentech, and Tyrogenex. He has also received personal fees from Achillion Pharmaceuticals, Boehringer-Ingelheim, Carl Zeiss Meditec, Chengdu Kanghong Biotech, Healios K.K, Hemera Biosciences, F. Hoffmann-La Roche Ltd., Isarna Pharmaceuticals, Lin Bioscience, NGM Biopharmaceuticals, Ocunexus Therapeutics, Ocudyne, and Unity Biotechnology. Dr. Rosenfeld has equity interest in Apellis, Verana Health, and Ocudyne., outside the submitted work.
Dr. Curcio reports grants from Hoffman-LaRoche and Heidelberg Engineering.
Dr. Holz reports grants and personal fees from Heidelberg Engineering, grants and personal fees from Optos, grants from Zeiss, during the conduct of the study; grants and personal fees from Novartis, grants and personal fees from Bayer Healthcare, grants and personal fees from Genentech, grants and personal fees from Acucela, personal fees from Boehringer Ingelheim, grants and personal fees from Alcon, grants and personal fees from Allergan, outside the submitted work
Dr. Staurenghi reports personal fees and other from Heidelberg Engineering, grants, personal fees and other from Zeiss Meditec, grants from Optovue, grants and other from Optos, grants, personal fees and other from Centervue, grants from Nidek, grants, personal fees and other from Novartis, personal fees and other from Bayer, other from Boeheringer, other from Allergan, other from Alcon, outside the submitted work
Dr. Freund reports grants and personal fees from Genentech/Roche, personal fees from Heidelberg Engineering, personal fees from Optovue, personal fees from Allergan, personal fees from Novartis, personal fees from Carl Zeiss Meditec, during the conduct of the study.
Dr. Schmitz-Valckenberg reports grants from Acucela, grants and personal fees from Alcon/Novartis, grants and personal fees from Allergan, grants and personal fees from Bayer, grants and personal fees from Bioeq/Formycon, grants, personal fees and non-financial support from Carl Zeiss MediTec AG, grants and non-financial support from Centervue, personal fees from Galimedix, grants and non-financial support from Heidelberg Engineering, grants from Katairo, non-financial support from Optos, outside the submitted work.
Dr Sparrow reports grants from National Eye Institute (RO1EY024091, RO1EY12951. R24 EY027285, P30EY019007) Foundation Fighting Blindness, Research to Prevent Blindness, Heidelberg Engineering, Edward N and Della L. Thome Foundation; the Arnold and Mabel Beckman Initiative for Macular Research; Alcon, Alimera, Janssen Research and Development LLC, Baxter Healthcare Corporation, Othera Pharmaceuticals, Inc; personal fees from Bayer Healthcare, Pfizer; Astellas; outside the submitted work,
Dr. Spaide reports consulting fees and royalties from Topcon Medical Systems, consulting fees from Heidelberg Engineering, and royalties from DORC, outside the submitted work.
Dr. Tufail reports grants and personal fees from Novartis, personal fees from Roche, grants and personal fees from Bayer Healthcare, , personal fees from Allergan, grants and personal fees from Alcon, and personal fees from Heidelberg Engineering, personal feed from Kanghong, outside the submitted work. Supported in part from the National Institute for Health Research Biomedical Research Centre Moorfields Eye Hospital,.
Dr. Chakravarthy reports personal fees from Novartis, Bayer, Allergan and Heidelberg Engineeering.
Dr. Jaffe reports personal fees from Heidelberg Engineering, outside the submitted work.
Dr. Csaky reports personal fees from Genentech, Regeneron, Heidelberg Engineering, Gyroscope, Roche, Allergan, personal fees and grants from Ophthotech, Acucela, and equity interest in Apellis outside the submitted work..
Dr. Sarraf reports grants and other from Genentech, grants from Heidelberg, grants from Regeneron, grants and other from Optovue, and grants from Topcon, personal fees from Bayer and Novartis and Optovue, outside the submitted work.
Dr. Monés reports grants from Eyerisk Consortium 2020, Novartis, Bayer, Alcon, Roche, Ophthotech, personal consultation fees from Novartis, Bayer, Alcon, Roche, Genentech, Cellcure, Reneuron and stock shareholder from ophthotech and Notalvision
Dr. Tadayoni reports grants and personal fees from Novartis, grants and personal fees from Bayer, grants and personal fees from Allergan, personal fees from Roche-Genetech, personal fees from Thea, personal fees from Alcon, grants from Zeiss, personal fees from Oculis, outside the submitted work;.
Dr. Grunwald has nothing to disclose.
Dr. Bottoni reports personal fees from Novartis, personal fees from Bayer, non-financial support from Allergan, non-financial support from Heidelberg Engineering, outside the submitted work
Dr. Liakopoulos reports personal fees and non-financial support from Heidelberg Engineering and Carl Zeiss Meditec, personal fees from Novartis, personal fees from Allergan, personal fees from Bayer, outside the submitted work.
Dr. Pauleikhoff discloses participation in clinical studies financed by Roche, Novartis and Bayer and consultation fees of Novartis and Bayer.
Dr Pagliarini reports personal fees and non-financial support from Novartis, Bayer, Allergan, Alcon, Heidelberg Engineering and Zeiss, outside of the submitted work.
Dr. Chew has nothing to disclose
Dr. Viola, has nothing to disclose
Dr. Fleckenstein reports grants, personal fees and non-financial support from Heidelberg Engineering, non-financial support from Zeiss Meditech, grants and non-financial support from Optos, personal fees from Novartis, personal fees from Bayer, grants and personal fees from Genentech, from Roche, outside the submitted work; In addition, Dr. Fleckenstein has a patent US20140303013 A1 pending
Dr. Blodi has nothing to disclose
Dr Lim reports non-financial support from Novartis and Heidelberg Engineering.
Dr Chong is an Boehringer Ingelheim International GmBH.
Dr Lutty has nothing to disclose
Dr. Bird has nothing to disclose.
Dr. Sadda reports grants and other from Optos, grants and other from Carl Zeiss Meditec, during the conduct of the study; grants and other from Allergan, grants and other from Carl Zeiss Meditec, other from Alcon, other from Allergan, other from Genentech, other from Regeneron, other from Novartis, outside the submitted work.
References
- 1.Bird AC, Bressler NM, Bressler SB, et al. An international classification and grading system for age-related maculopathy and age-related macular degeneration. The International ARM Epidemiological Study Group. Surv Ophthalmol. 1995;39:367–74 [DOI] [PubMed] [Google Scholar]
- 2.Schmitz-Valckenberg S The Journey of “Geographic Atrophy” through Past, Present, and Future. Ophthalmologica. 2017;237:11–20 [DOI] [PubMed] [Google Scholar]
- 3.Ferris FL 3rd, Wilkinson CP, Bird A, et al. Clinical classification of age-related macular degeneration. Ophthalmology. 2013;120:844–51 [DOI] [PMC free article] [PubMed] [Google Scholar]
- 4.Csaky K, Ferris F III, Chew EY, Nair P, Cheetham JK, Duncan JL. Report from the NEI/FDA Endpoints Workshop on age-related macular degeneration and inherited retinal diseases. Invest Ophthalmol Vis Sci. 2017;58:3456–3463 [DOI] [PMC free article] [PubMed] [Google Scholar]
- 5.Holz FG, Strauss EC, Schmitz-Valckenberg S, et al. Geographic Atrophy: Clinical Features and Potential Therapeutic Approaches. Ophthalmology. 2014;121:1079–91 [DOI] [PubMed] [Google Scholar]
- 6.Schmitz-Valckenberg S, Sahel JA, Danis R, et al. Natural History of Geographic Atrophy Progression Secondary to Age-Related Macular Degeneration (Geographic Atrophy Progression study). Ophthalmology. 2016;123:361–8 [DOI] [PubMed] [Google Scholar]
- 7.Cheng QE, Gao J, Kim BJ, Gui-shuang Ying G. Design Characteristics of Geographic Atrophy Treatment Trials: Systematic Review of Registered Trials in ClinicalTrials.gov. Ophthalmology Retina. 2018;2:518–525 [DOI] [PubMed] [Google Scholar]
- 8.Holz FG, Sadda SR, Busbee B. et al. Efficacy and Safety of Lampalizumab for Geographic Atrophy Due to Age-Related Macular Degeneration Chroma and Spectri Phase 3 Randomized Clinical Trials JAMA Ophthalmol. 2018;136(6):666–677 [DOI] [PMC free article] [PubMed] [Google Scholar]
- 9.Rosenfeld PJ, Dugel PU, Holz FG Emixustat Hydrochloride for Geographic Atrophy Secondary to Age-Related Macular Degeneration A Randomized Clinical Trial. Ophthalmology. 2018;125:1556–1567 [DOI] [PubMed] [Google Scholar]
- 10.Guymer RH. Geographic Atrophy Trials Turning the Ship around May Not Be That Easy. Ophthlamology. 2018;2: 515–517 [DOI] [PubMed] [Google Scholar]
- 11.AREDS. The Age-Related Eye Disease Study system for classifying age-related macular degeneration from stereoscopic color fundus photographs: the Age-Related Eye Disease Study Report Number 6. Am J Ophthalmol. 2001;132:668–81 [DOI] [PubMed] [Google Scholar]
- 12.Abdelfattah NS. Zhang H, Boyer DS et al. Drusen Volume as a Predictor of Disease Progression in Patients With Late Age-Related Macular Degeneration in the Fellow Eye Investigative Ophthalmology & Visual Science. 2016;57:1839–1846 [DOI] [PubMed] [Google Scholar]
- 13.Veerappan M, El-Hage-Sleiman AM, Tai V., et al. Optical Coherence Tomography Reflective Drusen Substructures Predict Progression to Geographic Atrophy in Age-related Macular Degeneration. Ophthalmology. 2016; 123:2554–2570 [DOI] [PMC free article] [PubMed] [Google Scholar]
- 14.Tan AC, Pilgrim M, Fearn S, et al. Calcified nodules in retinal drusen are associated with disease progression with age-related macular degeneration. Sci Transl Med. 2018; 7:10 (466) pg:eaat4544 [DOI] [PMC free article] [PubMed] [Google Scholar]
- 15.Christenbury JG, Folgar FA, O’Connell et al. Progression of Intermediate Age-related Macular Degeneration with Proliferation and Inner Retinal Migration of Hyperreflective Foci. Ophthalmology. 2013; 120:1038–1045 [DOI] [PMC free article] [PubMed] [Google Scholar]
- 16.Ouyang Y, Heussen FM, Hariri AH, et al. Optical Coherence Tomography–Based Observation of the Natural History of Drusenoid Lesion in Eyes with Dry Age-related Macular Degeneration. Ophthalmology. 2013; 120: 2656–2665 [DOI] [PMC free article] [PubMed] [Google Scholar]
- 17.Ferrara D, Silver RE, Louzada RN, et al. Optical Coherence Tomography features preceeding the onset of advanced age related macular degeneration. Invest Ophthalmol Vis Sci. 2017;58:3519–3529 [DOI] [PMC free article] [PubMed] [Google Scholar]
- 18.Curcio CA, Zanzottera EC, Ach T, Balaratnasingam C, Freund KB, 2017 Activated retinal pigment epithelium, an optical coherence tomography biomarker for progression in age-related macular degeneration. Invest Ophthalmol Vis Sci. 2017;58: BIO211–BIO226 [DOI] [PMC free article] [PubMed] [Google Scholar]
- 19.Zweifel SA, Spaide RF, Curcio CA et al. Reticular pseudodrusen are subretinal drusenoid deposits. Ophthalmology. 2010;117: 303–312 [DOI] [PubMed] [Google Scholar]
- 20.Finger RP. Wu Z, Luu CD, et al. Reticular Pseudodrusen. A Risk Factor for Geographic Atrophy in Fellow Eyes of Individuals with Unilateral Choroidal Neovascularization. Ophthalmology. 2014;121:1252–1256 [DOI] [PMC free article] [PubMed] [Google Scholar]
- 21.Zweifel SA, Imamura Y, Spaide TC, et al. Prevalence and significance of subretinal drusenoid deposits (reticular pseudodrusen) in age-related macular degeneration. Ophthalmology. 2010;117: 1775–1781 [DOI] [PubMed] [Google Scholar]
- 22.Schmitz-Valckenberg S, Alten F, Steinberg JS et al. Reticular drusen associated with geographic atrophy in age-related macular degeneration. Invest Ophthalmol Vis Sci. 2011;52: 5009–5015 [DOI] [PubMed] [Google Scholar]
- 23.Wu Z, Luu CD, Ayton LN, et al. Optical Coherence Tomography-Defined Changes Preceding the Development of Drusen-Associated Atrophy in Age-Related Macular Degeneration. Ophthalmology. 2014;121:2415–22 [DOI] [PubMed] [Google Scholar]
- 24.Wu Z, Luu CD, Ayton LN, et al. Fundus autofluorescence characteristics of nascent geographic atrophy in age-related macular degeneration. Invest Ophthalmol Vis Sci. 2015;56:1546–1552 [DOI] [PMC free article] [PubMed] [Google Scholar]
- 25.Monés J, Biarnés M, Trindade F. Hyporeflective wedgeshaped band in geographic atrophy secondary to age-related macular degeneration: an underreported finding. Ophthalmology 2012;119:1412–9 [DOI] [PubMed] [Google Scholar]
- 26.Schaal KB, Gregori G, Rosenfeld PJ. En Face Optical Coherence TomographyImaging for the Detection of NascentGeographic Atrophy. Am J Ophthalmol 2017;174:145–154 [DOI] [PubMed] [Google Scholar]
- 27.Choi W, Moult EM, Waheed NK, et al. Ultrahigh-Speed, Swept-Source Optical Coherence Tomography Angiography in Nonexudative Age-Related Macular Degeneration with Geographic Atrophy. Ophthalmology 2015;122(12):2532–44 [DOI] [PMC free article] [PubMed] [Google Scholar]
- 28.Nassisi M, Shi Y,W Fan W, et al. , Choriocapillaris impairment around the atrophic lesions in patients with geographic atrophy: a swept-source optical coherence tomography angiography study. Br J Ophthalmol. August 21 2018. doi: 10.1136/bjophthalmol-2018-312643. [Epub ahead of print] [DOI] [PubMed] [Google Scholar]
- 29.Schmitz-Valckenberg S, Sadda S, Staurenghi G, et al. Semantic considerations and literature review. Retina. 2016;36(12):2250–2264 [DOI] [PMC free article] [PubMed] [Google Scholar]
- 30.Holz FG, Sadda SR, Staurenghi G, et al. Imaging Protocols in Clinical Studies in Advanced Age-Related Macular Degeneration: Recommendations from Classification of Atrophy Consensus Meetings. Ophthalmology. 2017;124:464–78 [DOI] [PubMed] [Google Scholar]
- 31.Sadda SR, Guymer R, Holz FG, et al. Consensus definition for atrophy associated with age-related macular degeneration onOCT: Classification of Atrophy report 3. Ophthalmology. 2017;125(4):537–548 [DOI] [PMC free article] [PubMed] [Google Scholar]
- 32.Li M, Dolz-Marco R, Huisingh C, Messinger JD, Feist RM, Ferrara D, Freund KB, Curcio CA, 2019. Clinicopathologic correlation of geographic atrophy secondary to age-related macular degeneration. Retina;3/3/19 online. [DOI] [PMC free article] [PubMed] [Google Scholar]
- 33.Nunes RP, Gregori G, Yehoshua Z, et al. Predicting the progression of geographic atrophy in AMD with SD-OCT en face imaging of the outer retina. Ophthalmic Surg Lasers Imaging Retina. 2013;44:344–359 [DOI] [PubMed] [Google Scholar]
- 34.Guymer RH., Wu Z, Hodgson LAB, et al. Subthreshold Nanosecond Laser Intervention in Age-Related Macular Degeneration. The LEAD Randomized Controlled Clinical Trial. Ophthalmology. doi: 10.1016/j.ophtha.2018.09.015 [Epub ahead of print] [DOI] [PubMed] [Google Scholar]
- 35.Bottoni F, De Angelis S, Luccarelli S, et al. The dynamic healing process of idiopathic macular holes after surgical repair: a spectral-domain optical coherence tomography study. Invest Ophthalmol Vis Sci. 2011; 52: 4439–4446 [DOI] [PubMed] [Google Scholar]
- 36.Landa G, Gentile RC, Garcia PM, et al. External limiting membrane and visual outcome in macular hole repair: spectral domain OCT analysis. Eye. 2012; 26: 61–69 [DOI] [PMC free article] [PubMed] [Google Scholar]
- 37.Guo J, Tang W, Ye X, et al. Predictive multi-imaging biomarkers relevant for visual acuity in idiopathic macular telangiectasis type 1. BMC Ophthalmol. 2018;18:69. [DOI] [PMC free article] [PubMed] [Google Scholar]
- 38.Dolz-Marco R, Balaratnasingam C Messinger JD et al. The border of macular atrophy in age-related macular degeneration: a clinicopathologic correlation. Am J Ophthalmol. 2018;193:166–177 [DOI] [PubMed] [Google Scholar]
- 39.Li M, Huisingh C, Messinger JD et al. Histology of geographic atrophy secondary to age-related macular degeneration: a multilayer approach. Retina. 2018; 38:1937–1953 [DOI] [PMC free article] [PubMed] [Google Scholar]
- 40.Edwards MM, McLeod DS, Bhutto, et al. Subretinal glial membranes in eyes with geographic atrophy. Invest Ophthalmol Vis Sci. 2017; 58:1352–1367 [DOI] [PMC free article] [PubMed] [Google Scholar]
- 41.Dolz-Marco R, Litts KM, Tan ACS et al. , The evolution of outer retinal tubulation, a neurodegeneration and gliosis prominent in macular diseases. Ophthalmology 2017;124,:1353–1367 [DOI] [PubMed] [Google Scholar]
- 42.Stetson PF, Yehoshua Z, Garcia Filho, et al. OCT minimum intensity as a predictor of geographic atrophy enlargement. Invest Ophthalmol Vis Sci 2014. 55, 792–800 [DOI] [PMC free article] [PubMed] [Google Scholar]
- 43.Spaide RF. Outer retinal atrophy after regression of subretinal drusenoid deposits as a newly recognized form of late age-related macular degeneration. Retina. 2013;33:1800–8 [DOI] [PubMed] [Google Scholar]
- 44.Finger RP, Schmitz-Valckenberg S, Schmid M, et al. MACUSTAR: Development and Clinical Validation of Functional, Structural, and Patient-Reported Endpoints in Intermediate Age-Related Macular Degeneration. Ophthalmologica. 2018. August 28:1–12. doi: 10.1159/000491402. [Epub ahead of print] [DOI] [PMC free article] [PubMed] [Google Scholar]


