

Abstract
The Middle East Respiratory Syndrome (MERS) is an emerging disease caused by a recently identified human coronavirus (CoV). Over 2494 laboratory-confirmed cases and 858 MERS-related deaths have been reported from 27 countries. MERS-CoV has been associated with a high case fatality rate, especially in patients with pre-existing conditions. Despite the fatal nature of MERS-CoV infection, a comprehensive study to explore its evolution and adaptation in different hosts is lacking. We performed codon usage analyses on 4751 MERS-CoV genes and determined underlying forces that affect the codon usage bias in the MERS-CoV genome. The current analyses revealed a low but highly conserved, gene-specific codon usage bias in the MERS-CoV genome. The codon usage bias is mainly shaped by natural selection, while mutational pressure emerged as a minor factor affecting codon usage in some genes. Other contributory factors included CpG dinucleotide bias, physical and chemical properties of encoded proteins and gene length. Results reported in this study provide considerable insights into the molecular evaluation of MERS-CoV and could serve as a theoretical basis for optimizing MERS-CoV gene expression to study the functional relevance of various MERS-CoV proteins. Alternatively, an attenuated vaccine strain containing hundreds of silent mutations could be engineered. Codon de-optimization will not affect the amino acid sequence or antigenicity of a vaccine strain, but the sheer number of mutations would make viral reversion to a virulent phenotype extremely unlikely.
Keywords: Middle East respiratory syndrome coronavirus, virus evolution, codon usage bias, natural selection, mutational bias
Background
Emerging viral diseases are a major threat to public health systems across the globe.1 The recent outbreaks of Novel Coronavirus and Severe Acute Respiratory Syndrome Coronavirus (SARS-CoV) in China,2 Middle East Respiratory Syndrome Coronavirus (MERS-CoV) outbreak in Arabian peninsula,3 and Zika virus outbreak in South America have caused significant financial and human losses. These outbreaks were caused either by novel viruses or by genetically distinct strains of existing species.4-6 Interestingly, all listed outbreaks were of zoonotic origin, caused by animal viruses that jumped species barriers and caused fatal outbreaks in human populations.6 Zoonosis poses additional challenges because the natural reservoirs are often domestic or wild animals;5 therefore, control measures such as quarantine, vaccination, and social distancing are not practical.
The Middle East Respiratory Syndrome (MERS) is a newly described disease caused by a recently identified human coronavirus.7 The MERS-CoV was first isolated from the sputum of a Saudi Arabian patient who died from a severe respiratory illness.3 Since then, at least 2494 laboratory-confirmed human cases of MERS-CoV infection and 858 deaths in 27 countries have been reported.8 The primary source of the MERS-CoV remains unclear, but the pattern of transmission and epidemiological studies point toward dromedary camels as a direct source. The virus is believed to be introduced into the human population through multiple independent, zoonotic transmission events with limited human-to-human transmission.9,10
The MERS-CoV belongs to the subgenus Merbecovirus of the Beta-coronaviruses.11 Other members of this subgenus are Tylonycteris bat coronavirus HKU4, Pipistrelles bat coronavirus HKU5, and Hedgehog coronavirus 1.12 The MERS-CoV is an enveloped virus containing a large ~30 kb, plus sense RNA genome.3 The 5′ two-third of the genome comprises two overlapping open reading frames (ORFs), ORF1a and ORF1ab, which are translated to yield two large polyproteins, polyprotein 1a (pp1a) and polyprotein 1ab (pp1ab). Polyprotein 1a is translated from ORF1a, while production of pp1ab (encoded by both ORF1a and ORF1b) requires a −1 ribosomal frameshift before the translation stop codon on ORF1a is reached. This frameshift has been shown to occur in the overlap region between ORFs 1a and ORF1b. Both polyproteins are post-translationally processed by two viral proteases to yield 16 mature proteins necessary for viral RNA replication. The remaining one-third of the genome encodes four structural proteins (Spike(S), Envelope (E), Matrix(M), and Nucleocapsid(N) and an unknown number of accessory proteins.11 Contrary to the replicase proteins, which are directly translated from genomic RNA, the structural and accessory proteins are expressed from a nested set of sub-genomic RNAs. In addition to coding sequences, the coronavirus genome also contains highly structured, non-coding regions at the 5′ and 3′ end of the genome, which are believed to play a regulatory role in viral genome replication and protein expression.13,14
The genetic code is essentially redundant. Eighteen of the 20 amino acids in prokaryotes are encoded by more than one synonymous codon. The use of a synonymous codon is not random. During an organism’s evolutionary history, a bias for a particular synonymous codon will be formed within a species or gene, which ensures that the most frequently used codons can pair with the anticodons of the most abundant tRNA genes.15,16 Since viruses do not encode translational functions and depend exclusively on the host cell machinery to synthesize viral proteins, the expression of viral genes is temporally regulated by adjusting the codons usage to match or contrast the host tRNA resources. The expression levels of papillomaviruses capsid proteins L1 and L2 depend on the match between the codon usage and tRNA availability in the host cells.17,18 The presence of low prevalence codons in hepatitis A virus genes facilitates the correct folding of HAV proteins.19 Herpesviruses and human immunodeficiency virus maintain low prevalence codons in their genes.20,21 Considering such intimate dependence, codon usage bias analyses can provide useful insights into the adaptation of virus, the effect of the host on its codon usage, the factors driving the codon usage bias, and the regulation of viral gene expression.
Most of the coronavirus genomes have an atypical nucleotide bias, which is believed to be the direct cause of the characteristic codon usage in these viruses. Cytosine deamination and selection of CpG suppressed clones by the immune system are major selective forces that shape codon usage bias in coronavirus genomes.22 The nucleotide biases are more pronounced in the unpaired regions of the structured RNA genome, creating a virus-specific signature that may suggest a certain biological function for these distinctive sequence signatures.23,24 The codon usage bias analyses of MERS-CoV PLpro and 3CLpro proteases indicate a disproportional effect of compositional constraints and directed mutation pressure on codon usage in each protein.25 The comparative analysis of human and animal MERS-CoV isolates suggests that mutational bias is a major determinant of codon usage bias in human/camel isolates, whereas natural selection pressure appeared to be the key determinant of codon usage in bat/hedgehog isolates.26 Although the MERS-CoV genome is a mono-partite RNA, as many as 10 different proteins are expressed from a series of subgenomic mRNAs produced during virus infection. Non-structural proteins are required for early stages of the viral life cycle and the presence of optimal codons may be desired for the rapid accumulation of these proteins in infected cells. On the other hand, structural proteins are potentially immunogenic and often required for late stages of the virus life cycle; therefore, the gradual accumulation of these proteins may be beneficial for virus replication without mounting a host immune response.
The main objective of this study was to determine (1) the nucleotide composition of the genome and its effect on codon usage preferences, (2) the intra- and inter-genomic variations in the codon usage among human and camel strains, and (3) the forces that influence the evolution of codon usage bias. We analyzed 4751 MERS-CoV genes from 664 complete or partial genomic sequences to determine the extent of codon usage bias and the relative contribution of various evolutionary forces in shaping codon usage. The effective number of codons (ENC) value showed a moderate, gene-specific codon usage bias in MERS-CoV genome. Codon usage bias is mainly shaped by translational selection, while mutational pressure emerged as a minor factor in some genes. CpG suppression and cytosine deamination along with the physical and chemical properties of encoded proteins are other factors that affect MERS-CoV codon usage preferences.
Materials and Methods
Sequence data
A total of 453 complete genomes and 211 partial sequences of human and camel MERS-CoV isolates were retrieved from the National Center for Biotechnology GenBank database (http://www.ncbi.nlm.nih.gov) Table S1. All the sequences were aligned and curated using MEGA 7.0 and ORFs with authentic initiation and termination were extracted. The final sequence collection of 4751 ORFs was used for further analyses.
Nucleotide composition
General nucleotide composition (%A, %C, %T, and %G), nucleotide composition at third synonymous codon position (%A3s, %C3s, %T3s, and %G3s), and mean frequencies of G + C nucleotide at the first, second, and third codon position(GC1s, GC2s, GC3s) were calculated using default parameter in SSE software package.27 The observed (O) and expected(E) frequencies of 16 dinucleotides (GpA, GpC, GpG, GpT, CpA, CpC, CpG, CpT, TpA, TpC, TpG, TpT, ApA, ApC, ApG, and ApT) were also calculated using SSE software package and the ratio of O/E frequencies was used for designation of over- or under-represented dinucleotides.28,29
Indices of Codon Usage
ENC
The ENC is a simple and absolute measure of codon usage bias.30,31 ENC values range from 20 to 60, with lower ENC values (<40) indicating strong codon usage bias.32,33 The ENC values for MERS-CoV genes were calculated using the default parameter in SSE software package.27
Relative synonymous codon usage (RSCU)
The RSCU values for each codon were calculated to determine the patterns of synonymous codon usage.34 The RSCU value for a particular codon is a ratio of observed frequency divided by the expected frequency. The codons with RSCU values > 1.0 indicate a positive codon usage bias, while codons with RSCU values < 1.0 indicates a negative codon usage bias. The RSCU values of 1.0 indicate that codons are chosen randomly. The RSCU values of all MERS-CoV sequences were calculated using MEGA7.0 software package.35 The amino acids encoded by single codon AUG (Met) and TGG (Trp), and the termination codons TAA, TAG, and TGA were excluded from the analyses.
Indices Related to Mutation Bias
GC3s
It represents the frequency of use of G + C in the synonymously variable third positions of the sense codon (ie, excluding Met, Trp, and termination codons).
Indices Related to Natural Selection
Codon Adaptation Index (CAI)
The CAI is a measure of the relative adaptiveness of a gene toward its host codon usage.36 CAI values range from 0 to 1; high CAI value indicates a higher proportion of the most abundant codons. The CAI values for all MERS-CoV genes were calculated using human and dromedary camel codon usage as reference sets in CAI calculator.37
Relative Codon Deoptimization Index (RCDI)
The RCDI is a complementary approach to measure codon de-optimization, by comparing the similarity in codon usage of a given gene against a reference genome.38 The RCDI values for all MERS-COV genes were computed for both hosts using a web-based RCDI/eRCDI server (available at http://ppuigbo.me/programs/CAIcal/). The RCDI value is inversely related to the degree of adaptation to the host. An RCDI value of 1 would indicate that the virus follows the codon usage of the host, while progressively higher RCDI values indicate an increasing deviation from the host codon usage.
General average hydropathicity (GRAVY), aromacity (Aromo), and CDS Length (L_aa)
Physical and chemical properties of encoded proteins play an important role in shaping the codon usage of some species.39,40 Hydropathicity values represent the sum of the hydropathy values of all amino acids in the gene product divided by the number of residues in the sequence.41 Hydropathicity values range from −2 to 2, where positive and negative values are indicative of hydrophobic and hydrophilic proteins, respectively. Aromaticity values represent the frequency of aromatic amino acids (Trp, Tyr, and Phe) in the protein.42 The CDS Length represents the number of translatable codons in a gene.43
ENC-plot mapping analysis
The ENC-Plot (ENC vs G3s) is commonly used to determine whether the codon usage of a gene is affected by mutation or selection.30 The ENC-plot is the comparison of the observed and expected distribution of genes based on GC3s on a single plot. Expected ENC values for all GC3s compositions (0-1.0) were calculated using the equation ENCexp = 2 + S + (29/(S2 + (1 – S2)))30 and used to plot standard curve. Data points located on or just below the standard curve (ENCExp) indicate mutational pressure determines the codon usage bias, while data points located far away from the standard curve indicate that factors other than mutational pressure are affecting the codon usage bias.
Neutrality plot mapping analysis
Mutation at the first and second codon positions cause a change in amino acid, while mutation at the third codon position often does not alter amino acids. Theoretically, mutations should occur randomly at any of the three codon positions if there is no external pressure. The neutrality plot is an analytical method used to investigate the mutation-selection equilibrium in shaping the codon usage bias.44 In a neutrality plot, average GC contents at the first and second synonymous codon positions (GC12) are plotted against GC content at the third synonymous codon (GC3s) position. The regression coefficient against GC3s is regarded as the mutation-selection equilibrium coefficient and the evolutionary speed of the mutation pressure and natural selection pressure is expressed as the slope of a regression line. A regression plot with a slope of zero indicates no effect of directional mutation pressure, while a slope of 1 is suggestive of complete neutrality.
Correspondence analysis of RSCU
Correspondence analysis (CoA) is widely used to study the correlation between codon usage and other factors. The CoA was performed with CodonW (http://sourceforge.net/projects/codonw), utilizing the RSCU values to compare the inter-genic variation of 59 synonymous codons. Major trends within this dataset can be determined using measures of relative inertia and genes were ordered according to their positions along the axis of major inertia. Pearson rank correlation analysis was performed using Microsoft Excel and XLSTAT version 2014.5.03 to deduce the relationships between the two axes of CoA and different variables like CAI, ENC, GRAVY, AROMO, and GC3s with a statistical significance at P-values ⩽ .05.
Results
Composition analysis of MERS-CoV genome
The nucleotide compositions of MERS-CoV coding sequences were analyzed to explore the potential influence of compositional constraints on codon usage. The A (26.2%) and U (32.6%) nucleotide occurred more frequently than C (20.3%) and G (21%) nucleotide in MERS-CoV genome. As shown in Figure 1A, the mean GC and AU compositions of MERS-CoV genome were 42.68 ± 3.14% and 57.31 ± 3.14%, respectively. The individual MERS-CoV genes exhibit similar strong compositional bias, except N and ORF8b genes with 47.309 ± 0.20 and 49.283 ± 0.19% G + C contents, respectively. The G + C content in the MERS-CoV coding sequence is not uniformly distributed. The G + C at first codon position is highest in all genes; however, the G + C at second and third codon positions are variable. In ORF4a, E, M, and ORF8b, the G + C at second codon position are lowest, while in ORF1ab, S, ORF3, ORF4b, ORF5, and N gene, the G + C at third codon position are lowest (Figure 1B). Further analyses of third-position wobble nucleotides revealed a significant abundance of A3s (0.309 ± 0.053) and U3s (0.462 ± 0.105), as compared to C3s (0.239 ± 0.033) and G3s (0.195 ± 0.06) (Figure S1). Highly significant nucleotide compositional bias (P > .0001) is likely to affect the choice of codon and A/U is expected to occur most frequently at the third codon position in the MERS-CoV genes.
Figure 1.
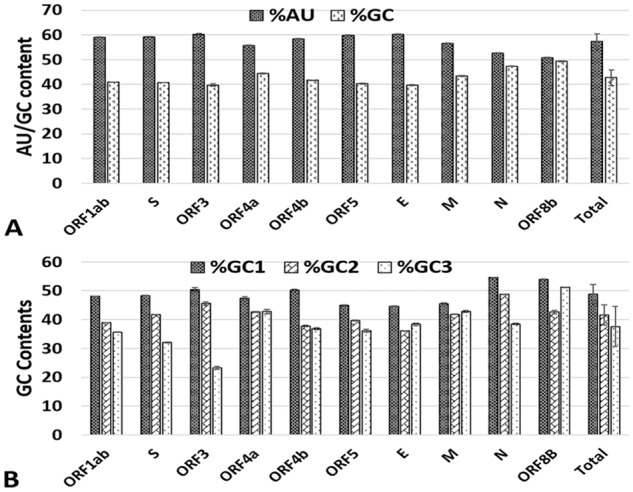
Compositional analysis of MERS-CoV genes. (A) The G+C and A+T contents (mean ± SD) in 10 MERS-CoV genes (B) percent GC at first, second and third codon position. MERS-CoV indicates Middle East Respiratory Syndrome Coronavirus; ORF, open reading frames.
Relative synonymous codon usage (RSCU) in MERS-CoV genome
To investigate the extent of codon bias in MERS-CoV genome, the RSCU values were computed for every codon in the MERS-CoV genes (Table 1). Among 59 synonymous codons, 27 were defined as preferred codons (RSCU > 1.0), and 24 of them are A/U-ending. Among preferred codon, nine codon UCU(S), GCU(A), ACU(T), CCU(P), GGU(G), CUU(L), GUU(V), CGU(R), and AUU(I) with RSCU value of > 1.6 were considered over-represented. Similarly, 11 codons AUC(I), CUG(L), CUA(L), CGG(R), AGC(S), CGA(R), GGG(G), GCG(A), UCG(S), ACG(T), and CCG(P) with RSCU value of <0.6 were regarded as under-represented and 9 out of 11 under-represented codons are GC ending. Among 18 preferred codons of each amino acid, all 18 in ORF3, 17 in ORF1ab and spike, 16 in E and N genes, 15 in ORF4b and ORF 5, 10 to 12 in M, ORF4a and ORF8b are A/U ending. Further analysis of amino acids encoded by four or more synonym codons revealed that approximately 2/3 of all amino acids in MERS-CoV proteins are encoded by A/U-ending codons. For example, 79.83% of proline, 78.78% of threonine, 76.6% of arginine, 75.60% of serine, 66.5% of glycine, 63.89 of valine, 60.86% of arginine, and 57% of leucine are encoded by A/U ending codons.
Table 1.
The Relative Synonymous Codon Usage (RSCU) patterns of MERS-CoV and their host species, human and camel.
| Codon (AA)a | 1ab | S | ORF3 | ORF4a | ORF4b | orf5 | E | M | N | ORF8b | MERS-CoV (Average) |
Human (Homo sapiens) |
Camel (Camelus dromedarius) |
|---|---|---|---|---|---|---|---|---|---|---|---|---|---|
| UUU(F) | 1.283 | 1.423 | 1.402 | 0.675 | 1.816 | 1.057 | 0.752 | 1.607 | 1.017 | 0.999 | 1.29 | 0.93 | 0.70 |
| UUC(F) | 0.717 | 0.577 | 0.598 | 1.325 | 0.184 | 0.943 | 1.248 | 0.393 | 0.983 | 1.001 | 0.71 | 1.07 | 1.30 |
| UUA(L) | 1.283 | 0.956 | 0.624 | 0.860 | 0.829 | 1.957 | 2.180 | 0.859 | 0.013 | 1.009 | 1.13 | 0.46 | 0.30 |
| UUG(L) | 1.530 | 1.146 | 1.191 | 1.712 | 1.035 | 0.215 | 1.635 | 0.571 | 0.461 | 0.762 | 1.28 | 0.77 | 0.54 |
| CUU(L) | 1.669 | 2.183 | 2.382 | 0.857 | 1.445 | 0.961 | 0.548 | 1.151 | 3.696 | 0.758 | 1.83 | 0.79 | 0.66 |
| CUC(L) | 0.701 | 0.613 | 1.790 | 0.857 | 0.829 | 0.854 | 0.545 | 1.423 | 0.693 | 0.508 | 0.73 | 1.17 | 1.33 |
| CUA(L) | 0.375 | 0.647 | 0.000 | 0.857 | 0.828 | 1.043 | 0.545 | 1.141 | 0.459 | 1.271 | 0.51 | 0.43 | 0.55 |
| CUG(L) | 0.437 | 0.456 | 0.013 | 0.857 | 1.033 | 0.968 | 0.545 | 0.855 | 0.679 | 1.693 | 0.53 | 2.37 | 2.61 |
| AUU(I) | 1.708 | 1.743 | 2.987 | 0.912 | 1.615 | 1.630 | 0.811 | 2.060 | 1.855 | 1.800 | 1.72 | 1.08 | 0.84 |
| AUC(I) | 0.587 | 0.312 | 0.004 | 2.087 | 0.923 | 0.548 | 0.000 | 0.626 | 0.913 | 0.000 | 0.57 | 1.41 | 1.83 |
| AUA(I) | 0.704 | 0.945 | 0.009 | 0.001 | 0.462 | 0.821 | 2.189 | 0.315 | 0.232 | 1.200 | 0.71 | 0.51 | 0.33 |
| GUU(V) | 1.713 | 2.597 | 1.831 | 1.995 | 2.797 | 1.930 | 0.799 | 1.089 | 1.421 | 0.000 | 1.81 | 0.72 | 0.57 |
| GUC(V) | 0.769 | 0.439 | 1.072 | 0.002 | 0.799 | 0.941 | 0.800 | 0.832 | 0.709 | 1.993 | 0.73 | 0.95 | 1.16 |
| GUA(V) | 0.761 | 0.418 | 0.366 | 0.000 | 0.204 | 0.806 | 1.601 | 1.247 | 1.160 | 2.004 | 0.74 | 0.47 | 0.35 |
| GUG(V) | 0.757 | 0.547 | 0.731 | 2.003 | 0.200 | 0.323 | 0.800 | 0.831 | 0.709 | 0.003 | 0.71 | 1.85 | 1.93 |
| UCU(S) | 2.081 | 2.388 | 2.214 | 1.559 | 1.910 | 2.356 | 0.004 | 1.202 | 1.909 | 0.663 | 2.10 | 1.13 | 1.02 |
| UCC(S) | 0.582 | 1.099 | 0.006 | 1.531 | 1.364 | 0.873 | 0.004 | 1.794 | 0.816 | 2.672 | 0.80 | 1.31 | 1.84 |
| UCA(S) | 1.230 | 0.946 | 3.282 | 1.885 | 1.374 | 0.235 | 2.996 | 1.209 | 1.373 | 0.000 | 1.20 | 0.92 | 0.66 |
| UCG(S) | 0.184 | 0.136 | 0.000 | 0.003 | 0.537 | 0.461 | 0.000 | 0.000 | 0.344 | 1.336 | 0.20 | 0.33 | 0.32 |
| AGU(S) | 1.482 | 0.980 | 0.498 | 0.512 | 0.747 | 0.691 | 2.996 | 1.196 | 1.039 | 0.001 | 1.23 | 0.90 | 0.66 |
| AGC(S) | 0.438 | 0.451 | 0.000 | 0.511 | 0.068 | 1.384 | 0.000 | 0.598 | 0.518 | 1.328 | 0.47 | 1.44 | 1.51 |
| CCU(P) | 1.995 | 2.398 | 1.781 | 2.572 | 1.997 | 1.686 | 1.330 | 1.194 | 1.668 | 0.438 | 1.94 | 1.14 | 1.06 |
| CCC(P) | 0.629 | 0.506 | 0.772 | 0.657 | 1.005 | 0.686 | 2.002 | 0.402 | 0.588 | 0.438 | 0.61 | 1.29 | 1.45 |
| CCA(P) | 1.208 | 0.903 | 1.447 | 0.145 | 0.993 | 1.298 | 0.667 | 2.004 | 1.743 | 1.728 | 1.28 | 1.10 | 0.98 |
| CCG(P) | 0.168 | 0.194 | 0.000 | 0.627 | 0.006 | 0.330 | 0.000 | 0.401 | 0.001 | 1.396 | 0.16 | 0.45 | 0.51 |
| ACU(T) | 1.931 | 2.122 | 2.899 | 2.286 | 2.503 | 2.657 | 1.143 | 2.284 | 1.981 | 1.497 | 2.00 | 0.98 | 0.93 |
| ACC(T) | 0.667 | 0.620 | 0.362 | 0.000 | 0.278 | 0.336 | 1.143 | 0.861 | 1.218 | 0.500 | 0.71 | 1.42 | 1.79 |
| ACA(T) | 1.205 | 1.214 | 0.739 | 1.714 | 0.836 | 0.673 | 1.143 | 0.286 | 0.670 | 2.000 | 1.11 | 1.14 | 0.94 |
| ACG(T) | 0.196 | 0.043 | 0.000 | 0.000 | 0.382 | 0.334 | 0.571 | 0.569 | 0.131 | 0.003 | 0.18 | 0.46 | 0.34 |
| GCU(A) | 2.087 | 2.277 | 2.003 | 2.667 | 1.202 | 1.801 | 3.000 | 1.690 | 1.920 | 0.004 | 2.07 | 1.06 | 1.07 |
| GCC(A) | 0.610 | 0.725 | 0.661 | 0.444 | 0.851 | 1.126 | 0.000 | 0.842 | 0.990 | 0.000 | 0.68 | 1.60 | 1.84 |
| GCA(A) | 1.009 | 0.815 | 1.335 | 0.454 | 1.205 | 0.712 | 1.000 | 0.834 | 0.852 | 2.001 | 0.96 | 0.91 | 0.66 |
| GCG(A) | 0.295 | 0.184 | 0.000 | 0.434 | 0.741 | 0.361 | 0.000 | 0.634 | 0.238 | 1.994 | 0.29 | 0.43 | 0.40 |
| UAU(Y) | 1.300 | 1.236 | 1.501 | 1.153 | 1.004 | 1.567 | 1.333 | 0.805 | 0.230 | 0.000 | 1.21 | 0.89 | 0.72 |
| UAC(Y) | 0.700 | 0.764 | 0.499 | 0.847 | 0.996 | 0.433 | 0.667 | 1.195 | 1.770 | 0.004 | 0.79 | 1.11 | 1.28 |
| CAU(H) | 1.349 | 1.100 | 2.000 | 0.668 | 1.587 | 0.870 | 0.000 | 1.333 | 1.009 | 0.997 | 1.29 | 0.84 | 0.64 |
| CAC(H) | 0.651 | 0.900 | 0.000 | 1.332 | 0.413 | 1.130 | 0.009 | 0.667 | 0.991 | 1.003 | 0.71 | 1.16 | 1.36 |
| CAA(Q) | 1.134 | 1.015 | 1.500 | 0.652 | 1.500 | 0.683 | 1.001 | 0.668 | 1.333 | 0.992 | 1.13 | 0.53 | 0.55 |
| CAG(Q) | 0.866 | 0.985 | 0.500 | 1.348 | 0.500 | 1.317 | 0.999 | 1.332 | 0.667 | 1.008 | 0.87 | 1.47 | 1.45 |
| AAU(N) | 1.420 | 1.430 | 1.992 | 1.199 | 1.400 | 1.143 | 1.334 | 1.614 | 1.063 | 1.313 | 1.37 | 0.94 | 0.68 |
| AAC(N) | 0.580 | 0.570 | 0.008 | 0.801 | 0.600 | 0.857 | 0.666 | 0.386 | 0.937 | 0.687 | 0.63 | 1.06 | 1.32 |
| AAA(K) | 0.987 | 1.213 | 2.000 | 1.001 | 1.093 | 1.333 | 2.000 | 1.429 | 1.038 | 1.219 | 1.02 | 0.87 | 0.84 |
| AAG(K) | 1.013 | 0.787 | 0.000 | 0.999 | 0.907 | 0.667 | 0.000 | 0.571 | 0.962 | 0.781 | 0.98 | 1.13 | 1.16 |
| GAU(D) | 1.270 | 1.482 | 1.221 | 1.316 | 1.602 | 1.142 | 1.004 | 0.667 | 1.497 | 0.000 | 1.32 | 0.93 | 0.74 |
| GAC(D) | 0.732 | 0.518 | 0.779 | 0.684 | 0.398 | 0.858 | 0.996 | 1.333 | 0.503 | 2.000 | 0.68 | 1.07 | 1.26 |
| GAA(E) | 1.053 | 0.958 | 1.000 | 0.832 | 0.752 | 0.000 | 1.000 | 0.800 | 0.926 | 1.200 | 1.03 | 0.85 | 0.84 |
| GAG(E) | 0.947 | 1.042 | 1.000 | 1.168 | 1.248 | 2.000 | 1.000 | 1.200 | 1.074 | 0.800 | 0.97 | 1.15 | 1.16 |
| UGU(C) | 1.175 | 1.328 | 1.359 | 2.000 | 0.997 | 1.249 | 2.000 | 1.000 | 0.000 | 0.000 | 1.24 | 0.91 | 0.76 |
| UGC(C) | 0.825 | 0.672 | 0.641 | 0.000 | 1.003 | 0.751 | 0.000 | 1.000 | 0.000 | 0.000 | 0.76 | 1.09 | 1.24 |
| CGU(R) | 1.848 | 2.669 | 1.197 | 0.000 | 0.672 | 3.431 | 2.000 | 1.333 | 1.158 | 0.000 | 1.800 | 0.48 | 0.40 |
| CGC(R) | 1.032 | 1.200 | 0.000 | 0.000 | 1.981 | 1.283 | 0.000 | 0.000 | 1.380 | 2.978 | 1.140 | 1.10 | 0.99 |
| CGA(R) | 0.468 | 0.531 | 1.204 | 2.998 | 0.009 | 0.001 | 2.000 | 0.667 | 0.465 | 0.000 | 0.45 | 0.66 | 0.87 |
| CGG(R) | 0.379 | 0.400 | 0.000 | 3.002 | 0.335 | 0.000 | 0.000 | 1.333 | 0.919 | 0.000 | 0.48 | 1.21 | 1.10 |
| AGA(R) | 1.321 | 0.667 | 2.395 | 0.000 | 2.004 | 1.286 | 2.000 | 2.000 | 1.848 | 0.000 | 1.38 | 1.29 | 1.31 |
| AGG(R) | 0.958 | 0.533 | 1.204 | 0.000 | 0.998 | 0.000 | 0.000 | 0.668 | 0.232 | 3.022 | 0.75 | 1.27 | 1.33 |
| GGU(G) | 2.243 | 1.810 | 4.000 | 0.800 | 1.003 | 1.600 | 0.012 | 1.620 | 1.160 | 1.091 | 1.90 | 0.65 | 0.58 |
| GGC(G) | 0.906 | 1.493 | 0.000 | 0.800 | 2.004 | 1.600 | 1.321 | 1.290 | 0.740 | 0.364 | 1.02 | 1.35 | 1.64 |
| GGA(G) | 0.558 | 0.522 | 0.000 | 2.400 | 0.992 | 0.799 | 1.333 | 1.089 | 1.369 | 1.818 | 0.75 | 1.00 | 0.85 |
| GGG(G) | 0.295 | 0.175 | 0.000 | 0.000 | 0.000 | 0.000 | 1.333 | 0.001 | 0.731 | 0.727 | 0.33 | 1.00 | 0.93 |
Abbreviations: MERS-CoV, Middle East Respiratory Syndrome Coronavirus; ORF, open reading frames.
Optimal codon for each amino acid is marked in bold.
The codon usage pattern of MERS-CoV is antagonistic to its hosts
Given the dependence of viruses on host translational machinery, the codon usage pattern of viruses is likely to be affected by the codon usage pattern of its host.45 Studies have shown a wide range of variations among different viruses, ranging from complete coincidence to complete antagonism and in between.45-51 Comparative analysis of the RSCU values indicate that the codon usage pattern of MERS-CoV is mostly antagonistic to its hosts, with less than five preferred codons ([ORF1ab and S = 0), [ORF3 = 1), [N = 3], 4[E, ORF4b and ORF5 = 4] and [ORF4a and M = 5]) coinciding with the host in different MERS-CoV genes (Table 1). A similar mix of codon usage has been reported for several other viruses49,52 and may serve best by balancing the translation efficiency and proper folding of viral proteins in infected cells.
CoA
To investigate synonymous codon usage variation among MERS-CoV genes, COA was implemented for all 4751 genes. The first principle axis explained 32.37% of total variability, while the other three principle axes account for 19.41%, 17.80%, and 10.51% of all the variation, respectively (Figure 2A). This indicates that the first four axes account for ~80% of total variation and are major explanatory axes for interpreting the codon usage variation. The COA generated on the RSCU of MERS-CoV coding sequences formed 10 distinct clusters, each representing one MERS-CoV gene (Figure 2B). The data points representing M, N, ORF1ab, S, ORF4b, and ORF5 were clustered around the axes center, whereas the data points representing ORF4a, E, ORF 3, and ORF8b were located away from axes. Because the closeness of any two genes on this plot reflects the similarities of their codon usages, synonymous codon usage bias appears to be conservative between viruses, but significant differences exist in codon usage among various genes.
Figure 2.
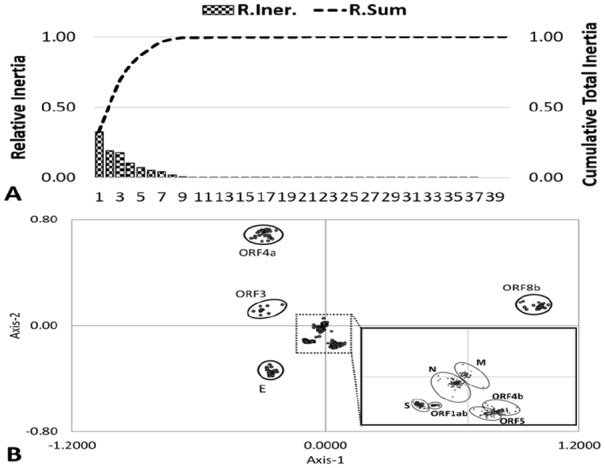
Correspondence analysis of synonymous codon usage in MERS-CoV genes. (A) The relative and cumulative inertia of the first 40 factors from a COA of the relative synonymous codon usage values. (R. Iner.—Relative Inertia, R.Sum—Relative sum or cumulative relative inertia). (B) The positions of each MERS-CoV gene in the first two-main-dimensional coordinates. COA indicates Correspondence analysis; MERS-CoV, Middle East Respiratory Syndrome Coronavirus; ORF, open reading frames.
Several factors such as translational selection, mutation pressure and gene function affect the codon usage bias. A multivariate correlation analysis was performed to assess the relationship between relative codon bias and various codon usage indices. The ENC showed a significant positive correlation with the first and the second principle axes, indicating the first and second principle axes are the major contributor to codon bias (Table S2). Axis 1 showed a distinct negative correlation with T, AT, and T3s (r = -0.565, -0.695, and -0.688, respectively; P < .0001) and positive correlation with A, G, C, GC, A3s, G3s, C3s, and GC3s (r = 0.257, 0.558, 0.497, 0.695, 0.218, 0.577, 0.154, and 0.648, respectively; P < .0001). Axis 2 also showed similar distinct correlations with these nucleotide compositions Table S2. Moreover, when correlation analysis was performed between two principle axes and indices related to natural selection (CAI, L_aa, Gravy and Aromo), a highly significant negative correlation was found between the axis1 and CAI, L_aa and Aromo (r = -0.512, r = -0.085, and r = -0.783, respectively; P < .0001). The axis 2 positively correlated with CAI and Aromo (= 0.503 and r = 0.089, respectively; P < .0001); while it negatively correlated with Gravy and Laa (r = -0.088, and r =- 0.192 respectively; P < .0001) (P < .0001). These data suggest that the codon usage bias in MERS-CoV genes is affected by both, mutational pressure and natural selection.
The analysis of codon usage bias in MERS-CoV genes
Although the genomic composition was found to be relatively stable and conserved among different isolates, substantial differences in the codon usage among different MERS-CoV genes were observed. The ENC values of different MERS-CoV genes ranged from 38.89 to 60.48 (Table 2). The ORF3 of MERS-CoV has a relatively strong codon usage bias (41.02 ± 0.539), while codon usage in ORF4a (57.061 ± 1.175), M (59.874 ± 0.332), and E protein (56.007 ± 0.323) is least biased. High ENC values (>40) and little variation in ENC among genes from different isolates suggest a moderate but highly conserved, gene-specific codon usage bias in the MERS-CoV genome.
Table 2.
The effective number of codons (ENC), Codon Adaptation Index (CAI) and Relative Codon Deoptimization Index (RCDI) of MERS-CoV genes.
| ORF1ab | S | ORF3 | ORF4a | ORF4b | ORF5 | E | M | N | ORF8b | All genes | |
|---|---|---|---|---|---|---|---|---|---|---|---|
| ENC | 49.259 ± 0.05 | 46.075 ± 0.163 | 41.02 ± 0.53 | 57.061 ± 1.175 | 51.099 ± 0.306 | 51.328 ± 0.325 | 56.007 ± 0.323 | 59.874 ± 0.332 | 49.63 ± 0.291 | 52.483 ± 0.49 | 51.203 ± 5.21 |
| CAI-Hum | 0.718 ± 0 | 0.718 ± 0.001 | 0.693 ± 0.003 | 0.766 ± 0.002 | 0.715 ± 0.003 | 0.68 ± 0.003 | 0.688 ± 0.001 | 0.7 ± 0.002 | 0.737 ± 0.001 | 0.667 ± 0.003 | 0.708 ± 0.027 |
| CAI-Cam | 0.579 ± 0 | 0.571 ± 0.001 | 0.537 ± 0.003 | 0.643 ± 0.003 | 0.578 ± 0.003 | 0.548 ± 0.004 | 0.567 ± 0.001 | 0.568 ± 0.002 | 0.609 ± 0.001 | 0.571 ± 0.003 | 0.577 ± 0.028 |
| RCDI-Hum | 1.399 ± 0.002 | 1.523 ± 0.006 | 2.071 ± 0.019 | 1.465 ± 0.015 | 1.489 ± 0.01 | 1.655 ± 0.013 | 1.759 ± 0.01 | 1.332 ± 0.011 | 1.386 ± 0.006 | 1.621 ± 0.02 | 1.568 ± 0.206 |
| RCDI-Cam | 1.639 ± 0.002 | 1.776 ± 0.007 | 2.421 ± 0.027 | 1.608 ± 0.018 | 1.723 ± 0.015 | 1.961 ± 0.019 | 2.161 ± 0.014 | 1.497 ± 0.014 | 1.531 ± 0.008 | 1.743 ± 0.019 | 1.805 ± 0.275 |
Abbreviation: MERS-CoV, Middle East Respiratory Syndrome Coronavirus; ORF, open reading frames.
Gene expression level and synonymous codon usage bias
To estimate the level of expression of MERS-CoV proteins in human and animal hosts, CAI values were calculated for all genes using human and camel (dromedary) codon usage as references (Table 2). The mean CAI for MERS-CoV genes ranged from 0.667 to 0.766 against human codon usage reference and 0.537 to 0.643 against camel codon usage reference. The CAI values resulting from the analyses of the 10 coding regions of the MERS-CoV virus, shared by 450+ fully sequenced viral genomes showed that genes encoding structural (N, S, and M) and replicase polyprotein have highest CAI values, while most of the accessory proteins have low CAI values. The envelope, ORF4a, and ORF4b were exceptions in both cases. To assess the effect of gene expression on codon usage bias, we calculated the correlation coefficient between the ENC and CAI values for each host. The CAI values for both hosts showed a distinct positive correlation with axis 2(r = 0.503 and 0.805, respectively; P < .0001) and ENC (r = 0.096 and 0.426, respectively; P < .0001) but negative correlation with axis1 (r = -0.512 and -0.117, respectively; P < .0001). These data indicate that codon usage in MERS-CoV genome is affected by the gene expression level of its host.
Relative codon de-optimization
The RCDI provides an insight into the possible co-evolution of virus and host genomes. The average RCDI value of 1.568 ± 0.206 (range: 1.31-2.15) in human and 1.805 ± 0.275 (1.466-2.452) in camel indicated that MERS-CoV was more adapted to human host as compared to its animal host (Table 2). In relation to both hosts, strong codon deoptimization was observed in the accessory genes ORF3 (2.071 ± 0.019 and 2.421 ± 0.027), E (1.759 ± 0.01 and 2.161 ± 0.014), ORF5 (1.655 ± 0.013 and 1.961 ± 0.019), and ORF8b (1.621 ± 0.02 and 1.743 ± 0.019). The structural genes S, M, N, Replicase gene (ORF1ab), and accessory gene ORF4 were comparatively more adapted to both host and showed low RCDI values.
Relationship between codon bias and hydropathicity, aromaticity, and CDS length
To investigate the potential effect of physical and chemical properties of encoded proteins on MERS-CoV codon usage, correlation coefficients between Gravy, Aromo, L_aa, ENC, and nucleotide composition were determined. As shown in (Table S2) GRAVY value of MERS-CoV proteins showed significant positive correlation with ENC and T and AT (r = 0.634, 0.490, and 0.338, respectively; P < .0001) but negative correlation with principle axis 2, A, C, and G nucleotides (r =-0.088,-0.731, -0.311,-0.439, and-0.490, respectively; P < .0001). Similarly, Aromo values also exhibit significant positive correlation with ENC, T, AT, and axis 2 (r = 0.300, 0.723, and 0.089, respectively; P < .0001) but negative correlation with A, G, C, GC, and axis1 (r =-0.530, -0.525, -0.631, -0.757, and -0.783, respectively; P < .0001). In addition, protein length positively correlated with A, T, G, and AT (0.093, 0.102, 0.240, and 0.216, respectively; P < .0001) but negatively correlated with ENC, C, GC, axis 1, and axis 2 (-0.197,-0.600,-0.068, -0.085, and -0.192, respectively; P < .0001). This result indicates that codon usage variations were associated with the protein length, hydropathicity, and aromaticity of the encoded proteins.
The differential effect of mutational biases and natural selection on synonymous codon usage in MERS-CoV genes
Comparative analysis of GC content at third wobble position (GC3s) confirmed the homogeneity of codon usage among the isolates but marked variation among individual genes was observed. The mean GC3s value of different MERS-CoV genes ranged from 0.22 to 0.45. Similarly, despite remarkable inter-genomic homogeneity in codon usage, analyses of individual genes revealed significant differences in ENC values.
To elucidate the relationship between nucleotide composition and codon bias in MERS-CoV genes, the ENC values of all MERS-CoV genes were plotted against the corresponding GC3s. The solid line in Figure 3A represents the expected positions of genes when the codon usage was only determined by the GC3s compositions. In Figure 3A, data points representing MERS-CoV ORF1ab, S, ORF3, ORF4b, N, and ORF8b formed distinct clusters below the expected curve with variable proximities, suggesting a dominant effect of forces other than mutation pressure on codon usage bias. Data points corresponding to ORF4a, E, and M genes were aggregated closer to the expected curve, with few data point overlapping the curve, indicating a stronger influence of mutational pressure in these genes as compared to other genes.
Figure 3.
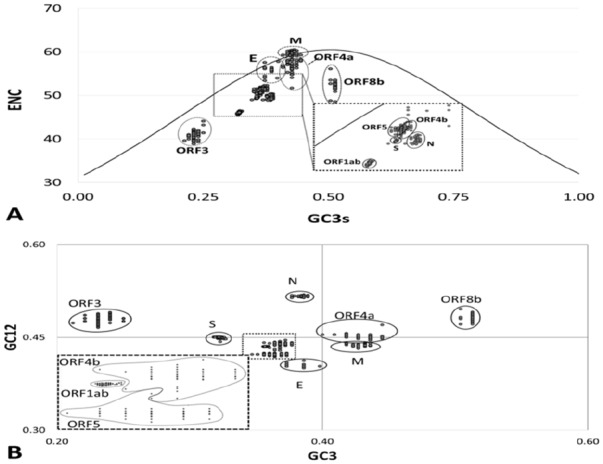
The effect of mutational biases and natural selection on synonymous codon usage on MERS-CoV genes. (A) Relationship between GC3 and the effective number of codons (ENC). The ENC values of all genes were plotted against the corresponding GC3s. The standard curve indicates the expected codon usage if GC compositional constraints alone account for codon usage bias. (B). The neutrality plot (GC12 vs GC3). Neutrality plot analysis of the average GC content in the first and second positions of the codons (GC12) and the GC content in the third position (GC3). For ORF1ab; the regression line is y = 0.114x + 0.3945; R² = 0.0621. Spike; the regression line is y = -0.1403x + 0.4954; R² = 0.1369. ORF3; the regression line is y = 0.3652x + 0.3951; R² = 0.1549. ORF4a; the regression line is y = -0.1602x + 0.5196; R² = 0.2798. ORF4b; the regression line is y = 0.0247x + 0.4309; R² = 0.0015. ORF5; the regression line is y = 0.0185x + 0.4161; R² = 0.0105. Envelope; the regression line is y = -0.016x + 0.4097; R² = 0.0101. Matrix; the regression line is y = 0.0545x + 0.4135; R² = 0.0214. Nucleocapsid; the regression line is y = 0.1358x + 0.4646; R² = 0.1387. ORF8b; the regression line is y = 0.0502x + 0.4572; R² = 0.0005. MERS-CoV indicates Middle East Respiratory Syndrome Coronavirus; ORF, open reading frames.
Although the ENC–GC3 plot reflected the main factors that influenced codon usage bias, it did not estimate precisely which one of mutation pressure or natural selection was more important. To determine the relative contribution of mutation pressure or natural selection on codon usage, the correlation among three codon positions (GC12vs GC3s) was determined. When GC3 was plotted against GC12 for all genes, no significant correlation was found (r = -.0.026, P = .074), suggesting that codon usage is not influenced by the mutational pressure. However, when GC3 of individual genes were plotted against the corresponding GC12, a significant correlation between GC3 and GC12 was observed for all genes, except ORF 4b (r = 0.028, P < .54). The slope of the individual neutrality plots indicates relative neutralities ranging from 1.6% to 35.52% (Figure 3B). The ORF3 had the highest relative neutrality values of 35.52% indicating a significant impact of neutral evolution (mutational pressure) on codon preference in this gene. Although highly significant correlations between GC3 and GC12 was observed in remaining genes, the slopes of regression lines indicate that less than 16% of codon usage bias in these genes is explained by mutational pressure. These data suggest that different evolutionary pressures are acting disproportionally on MERS-CoV genes. Mutational pressure appeared as a minor factor, affecting the codon usage preferences in some MERS-CoV genes, while natural selection emerged as the dominant factor influencing the codon usage in all MERS-CoV genes.
Dinucleotide frequency
Significant biases of dinucleotide composition in many RNA viruses have been reported, which may be a consequence of intrinsic characteristics of the virus or mutational pressure from the host. To determine if the dinucleotide composition of MERS-CoV genome is biased, ratios of observed to expected frequencies of 16 dinucleotides were computed for all MERS-CoV sequences. The mean ± standard deviation of dinucleotide O/E ratios for MERS-CoV genome is 1.0 ± 0.144 and the dinucleotides located outside the confidence interval (mean ± 1SD, 0.86-1.14) were classified as low or high relative abundance, respectively. The dinucleotide bias in MERS-CoV genome is not acute and only two dinucleotides, the CpG and UpA were markedly under- and over-represented, respectively (Figure 4A, solid line), while two other dinucleotides, CpA and CpU were marginally over-represented. Similar dinucleotide biases were observed in individual MERS-CoV genes (Figure S2A-L). The CpG dinucleotide was under-represented in all MERS-CoV genes except orf5, while CpA/UpG were over-represented in most of MERS-CoV genes. In non-coding sequence, mild suppression of CpG and GpA (O/E 0.752 and 0.762, respectively) and slight over-representation of ApA, CpA, GpC, and UpG (O/E 1.182, 1.183, 1.266, and 1.256, respectively) was observed.
Figure 4.

Relative dinucleotide abundance in MERS-CoV genome. (A) Line graph represents the mean observed/expected (O/E) frequency ratio of 16 dinucleotides. The mean ± standard deviation of dinucleotide O/E ratios for MERS-CoV coding sequence is 1.0 ± 0.144. The dotted box represents the confidence interval of 0.856-1.144. Dinucleotides outside the dotted box are under- or over–represented in the MERS-CoV genome. (B) Odds ratio of CpG and GpC dinucleotide in MERS-CoV genes. (C) The loss of CpG dinucleotides and the average gain in TpG and CpA dinucleotides in MERS-CoV genes. MERS-CoV indicates Middle East Respiratory Syndrome Coronavirus.
Among the differentially used dinucleotides, only CpG depletion was common across 9/10 MERS-CoV genes. To determine if CpG depletion is due to evolutionary pressures specifically acting on CpG dinucleotide and not due to composition constraint or pressures acting upon constituent nucleotides, CpG/GpC odds ratio were calculated (Figure 4B). High odds ratio would indicate that depletion was due to pressure acting upon constituent nucleotides, while low odds ratio would suggest implication of evolutionary pressures specifically acting upon CpG dinucleotide. With exception of ORF 3, ORF5A, and Envelope genes (CpG/GpC O/E 0.66, 0.70, and 0.859, respectively), the CpG/GpC odds ratio for all other MERS-CoV genes were less than 0.60, indicating that CpG depletion is not mere consequence of compositional constraints, rather it is due to evolutionary pressures specifically acting on CpG dinucleotides. To further understand the mechanism of CpG depletion, the loss of CpG dinucleotides, 1 − (O/E)CpG, and average gain in UpG and CpA dinucleotides, ([TpG – 1] + (O/E)CpA – 1)/2) were calculated (Figure 4 C). The average loss of CpG in the MERS-CoV coding region was 0.391 ± 0.004, and the average gain in UpG and CpA dinucleotides was 0.201 ± 0.003. A strong negative correlation between the depletion of CpG dinucleotide and the gain in TpG/CpA dinucleotides (r = 0.483; P ⩽ .0001) and a weak but significant correlation between the GC% and the extent of CpG depletion (r = -0.084; P ⩽ .0001) suggested that the observed under-representation of CpG in the MERS-CoV genome is the combined effect of the nucleotide composition of the genome and the methylation of the cytosine in CpG dinucleotides followed by deamination.
To investigate the possible effects of CpG depletion on codon usage bias, the RSCU value of the 8 CpG containing codons (CGT, CGG, CGC, CGA, TCG, GCG, CCG, and ACG) were analyzed. Among these 8 CpG containing codons, six codon (CCG [0.16], ACG [0.18], TCG [0.20], GCG [0.290], CGA [0.450], and CGG [0.48] were markedly suppressed, while two codons (CGC[1.14] and CGU [1.80]) were over-represented in the MERS-CoV genome. Analysis of individual genes also revealed marked suppression of CpG-containing codons in all genes except ORF 8b, in which four codons (ACG [0.03], CGG [0.00], GCG [0.290], CGA [0.00], and CGU [0.00]) were markedly suppressed, while four CpG-containing codons CCG (1.396), UCG (1.336), GCG (1.994), and CGC (20978) were over-represented. Taken together, these data suggest that depletion of CpG dinucleotides significantly affected the usage of CpG-containing codons in the MERS-CoV genome.
Discussion
The current analyses revealed that the MERS-COV genome lacked strong codon usage bias, which is consistent with previously reported data on other coronaviruses.26,53,54 Weak codon bias has been reported in many RNA and DNA virus genomes and may serve best by enabling these viruses to maintain efficient replication without competing for limited tRNA resources.55 The MERS-CoV genome is GC poor with almost 2/3 of amino acids encoded by A/U ending codon. Since the human genome is also AT-rich (58%),56 the biochemical machinery is appropriately enriched for the replication of AT-rich extrachromosomal genetic elements.57 A viral genome with matching nucleotide composition will be less of a burden and will be more efficient in replication.
Although the coronavirus genome is a monopartite single-stranded RNA, coronavirus structural, and accessory genes are expressed from independent transcription units with different translation efficiencies.13 Marked differences in codon usage bias among different genes indicate that different MERS-CoV genes have taken different codon evolution pathways depending on the function of these genes. Non-structural proteins are required for early stages of the viral life cycle and less restricted codon usage will ensure an abundant supply of these proteins for transcription and replication. Similarly, less restricted codon usage in proteins with potential interferon antagonizing properties58 and anti-apoptotic activity59 and more restricted codon usage in proteins with potential immunogenic60 or translation attenuation properties61,62 would likely benefit viral growth and spread.
Natural selection and mutation pressure are two main factors that account for codon usage variation in different organisms.34,63 The ENC plot suggested that codon usage bias in MERS-CoV was not the sole result of the random accumulation of mutations. Despite the significant correlation between GC12 and GC3 for most of the genes, the slope of the neutrality plot suggests that only a fraction (< 16%) of codon usage bias in these genes is due to mutational pressure. Translational selection appears to be the major determinant of codon usage in MERS-CoV. Like many mammalian RNA viruses and retroviruses,64,65 the CpG dinucleotide is markedly under-represented in the MERS-CoV coding sequence. The precise mechanism that contributes to CpG under-representation in RNA viruses is still largely unknown; the selection of CpG suppressed clones by host immune system and methylation-deamination are the most likely mechanisms responsible for CpG suppression in RNA viruses.22 Studies of influenza and picornaviruses indicate that the innate immune response might recognize RNA-specific CpG motifs, such that the suppression of CpG in viruses could assist immune evasion.66,67 In contrast, other studies have suggested that dinucleotide bias in viruses simply reflects background mutation pressure.55,68 Comparative analysis of CpG suppression in coding and non-coding regions of the MERS-CoV genome indicates significantly lower CpG content in the MERS-CoV coding region than the non-coding region. The loss of CpG dinucleotides by deamination of methylated cytosines within CpG dinucleotides results in a gain of TpG and CpA dinucleotides.64 However, the increase in UpG and CpA dinucleotides in the coding region was not much different than that in the non-coding region. This suggests that CpG suppression was not simply a consequence of host methylation capabilities; rather, it was a combined effect of multiple biochemical and evolutionary pressures specifically acting on CpG dinucleotide.22
Viruses acquire replicative fitness by controlling the expression of viral proteins. Some viruses achieve high replicative rates by codon usage optimized genomes, while others evade host immune system and attain latency by codon usage de-optimized genomes.19,65 The mean CAI values in 0.708 ± 0.027 in humans and 0.577 ± 0.028 in dromedary camels indicate that MERS-CoV genes are significantly less expressive in dromedary camels as compared to humans. Similarly, the RCDI value of > 1.568 ± 0.206 in humans and 1.805 ± 0.275 indicate that MERS proteins are expressed in latency phases or even that the virus might present a low replication rate in dromedary camels. These subtle differences in protein expression among two hosts may explain the clinical manifestation of MERS-CoV infection. The MERS-CoV infection in humans is often acute with a high mortality rate, while clinical symptoms in camels infected with MERS-CoV are rare and generally mild.
In summary, the current study revealed a highly conserved gene-specific codon usage bias in the MERS-CoV genome. The formation of codon usage bias in the MERS-CoV genome is affected mainly by natural selection. Mutational pressure emerged as a minor factor affecting codon usage in some MERS-CoV genes. Dinucleotide bias, specifically the CpG suppression has significantly limited the use of CG containing codon. The depletion of CpG was a combined effect of evolutionary pressures specifically acting on CpG dinucleotide and compositional constraints imposed by the nucleotide composition of the genome. Other factors that influenced codon usage included the gene length and protein properties. The subtle differences in the levels of MERS-CoV gene expression in humans and dromedary camel and the sharp contrast in the severity of diseases between two hosts warrant further studies to determine the relationship between viral gene expression and severity of the disease. Several coronavirus proteins have been identified as interferon antagonist69 and, by inference, optimal expression of these genes is essential for viral pathogenesis. Taken together, these results provided considerable insight into the genome composition and evolution of MERS-CoV and may provide a theoretical basis for optimizing MERS-CoV gene expression to study the functional relevance of various MERS-CoV proteins. Alternatively, with affordable and readily available gene manipulation tools, attenuated vaccine strains containing hundreds of silent mutations can be engineered to mitigate the chances of reversal to pathogenic wild type.70
Supplemental Material
Supplemental material, Figure_S1_xyz352879a2e7e37 for Analysis of Codon Usage and Nucleotide Bias in Middle East Respiratory Syndrome Coronavirus Genes by Snawar Hussain, Pottathil Shinu, Mohammed Monirul Islam, Muhammad Shahzad Chohan and Sahibzada Tasleem Rasool in Evolutionary Bioinformatics
Supplemental material, Figure_S2_xyz35287fc9154dd for Analysis of Codon Usage and Nucleotide Bias in Middle East Respiratory Syndrome Coronavirus Genes by Snawar Hussain, Pottathil Shinu, Mohammed Monirul Islam, Muhammad Shahzad Chohan and Sahibzada Tasleem Rasool in Evolutionary Bioinformatics
Supplemental material, Supplimentary_Data_xyz3528713f406c7 for Analysis of Codon Usage and Nucleotide Bias in Middle East Respiratory Syndrome Coronavirus Genes by Snawar Hussain, Pottathil Shinu, Mohammed Monirul Islam, Muhammad Shahzad Chohan and Sahibzada Tasleem Rasool in Evolutionary Bioinformatics
Acknowledgments
We thank the College of Clinical Pharmacy for providing necessary support to conduct this research.
Footnotes
Funding:The author(s) disclosed receipt of the following financial support for the research, authorship, and/or publication of this article: The authors acknowledge the Deanship of Scientific Research at King Faisal University for the financial support under Nasher track (grant number 186245).
Declaration of conflicting interests:The author(s) declared no potential conflicts of interest with respect to the research, authorship, and/or publication of this article.
Author Contributions: S.H., S.T.R. identified the research topic and designed the study. P.S., M.M.I. and M.S.C. retrieved and analyzed the data, S.H., S.T.R. and P.S. prepared the manuscript.
ORCID iDs: Snawar Hussain  https://orcid.org/0000-0002-9765-0565
Supplemental material: Supplemental material for this article is available online
References
- 1. Berry M, Gamieldien J, Fielding BC. Identification of new respiratory viruses in the new millennium. Viruses. 2015;7:996-1019. [DOI] [PMC free article] [PubMed] [Google Scholar]
- 2. Rota PA, Oberste MS, Monroe SS, et al. Characterization of a novel coronavirus associated with severe acute respiratory syndrome. Science. 2003;300:1394-1399. [DOI] [PubMed] [Google Scholar]
- 3. Zaki AM, van Boheemen S, Bestebroer TM, Osterhaus AD, Fouchier RA. Isolation of a novel coronavirus from a man with pneumonia in Saudi Arabia. N Engl J Med. 2012;367:1814-1820. [DOI] [PubMed] [Google Scholar]
- 4. Li W, Shi Z, Yu M, et al. Bats are natural reservoirs of SARS-like coronaviruses. Science. 2005;310:676-679. [DOI] [PubMed] [Google Scholar]
- 5. Alagaili AN, Briese T, Mishra N, et al. Middle East respiratory syndrome coronavirus infection in dromedary camels in Saudi Arabia. mBio. 2014;5:e00884-14. [DOI] [PMC free article] [PubMed] [Google Scholar]
- 6. Memish ZA, Mishra N, Olival KJ, et al. Middle East respiratory syndrome coronavirus in bats, Saudi Arabia. Emerg Infect Dis. 2013;19:1819-1823. [DOI] [PMC free article] [PubMed] [Google Scholar]
- 7. Chafekar A, Fielding BC. MERS-CoV: understanding the latest human coronavirus threat. Viruses. 2018;10:E93. [DOI] [PMC free article] [PubMed] [Google Scholar]
- 8. World Health Organization (WHO). MERS situation update, April 2019. http://www.emro.who.int/pandemic-epidemic-diseases/mers-cov/mers-situation-update-april-2019.html. Published 2019.
- 9. Breban R, Riou J, Fontanet A. Interhuman transmissibility of Middle East respiratory syndrome coronavirus: estimation of pandemic risk. Lancet. 2013;382:694-699. [DOI] [PMC free article] [PubMed] [Google Scholar]
- 10. Haagmans BL, Al Dhahiry SH, Reusken CB, et al. Middle East respiratory syndrome coronavirus in dromedary camels: an outbreak investigation. Lancet Infect Dis. 2014;14:140-145. [DOI] [PMC free article] [PubMed] [Google Scholar]
- 11. van Boheemen S, de Graaf M, Lauber C, et al. Genomic characterization of a newly discovered coronavirus associated with acute respiratory distress syndrome in humans. mBio. 2012;3:e00473-12. [DOI] [PMC free article] [PubMed] [Google Scholar]
- 12. Wong ACP, Li X, Lau SKP, Woo PCY. Global epidemiology of bat coronaviruses. Viruses. 2019;11:E174. [DOI] [PMC free article] [PubMed] [Google Scholar]
- 13. Yang Y, Hussain S, Wang H, Ke M, Guo D. Translational control of the subgenomic RNAs of severe acute respiratory syndrome coronavirus. Virus Genes. 2009;39:10-18. [DOI] [PMC free article] [PubMed] [Google Scholar]
- 14. Li L, Kang H, Liu P, et al. Structural lability in stem-loop 1 drives a 5’ UTR-3’ UTR interaction in coronavirus replication. J Mol Biol. 2008;377:790-803. [DOI] [PMC free article] [PubMed] [Google Scholar]
- 15. Smith DW. Problems of translating heterologous genes in expression systems: the role of tRNA. Biotechnol Prog. 1996;12:417-422. [DOI] [PubMed] [Google Scholar]
- 16. Dittmar KA, Goodenbour JM, Pan T. Tissue-specific differences in human transfer RNA expression. PLoS Genet. 2006;2:e221. [DOI] [PMC free article] [PubMed] [Google Scholar]
- 17. Zhou J, Liu WJ, Peng SW, Sun XY, Frazer I. Papillomavirus capsid protein expression level depends on the match between codon usage and tRNA availability. J Virol. 1999;73:4972-4982. [DOI] [PMC free article] [PubMed] [Google Scholar]
- 18. Zhao KN, Gu W, Fang NX, Saunders NA, Frazer IH. Gene codon composition determines differentiation-dependent expression of a viral capsid gene in keratinocytes in vitro and in vivo. Mol Cell Biol. 2005;25:8643-8655. [DOI] [PMC free article] [PubMed] [Google Scholar]
- 19. Costafreda MI, Perez-Rodriguez FJ, D’Andrea L, et al. Hepatitis A virus adaptation to cellular shutoff is driven by dynamic adjustments of codon usage and results in the selection of populations with altered capsids. J Virol. 2014;88: 5029-5041. [DOI] [PMC free article] [PubMed] [Google Scholar]
- 20. Bradel-Tretheway BG, Zhen Z, Dewhurst S. Effects of codon-optimization on protein expression by the human herpesvirus 6 and 7 U51 open reading frame. J Virol Methods. 2003;111:145-156. [DOI] [PubMed] [Google Scholar]
- 21. Ngumbela KC, Ryan KP, Sivamurthy R, et al. Quantitative effect of suboptimal codon usage on translational efficiency of mRNA encoding HIV-1 gag in intact T cells. PLoS ONE. 2008;3:e2356. [DOI] [PMC free article] [PubMed] [Google Scholar]
- 22. Woo PC, Wong BH, Huang Y, Lau SK, Yuen KY. Cytosine deamination and selection of CpG suppressed clones are the two major independent biological forces that shape codon usage bias in coronaviruses. Virology. 2007;369:431-442. [DOI] [PMC free article] [PubMed] [Google Scholar]
- 23. van Hemert F, van der Kuyl AC, Berkhout B. Impact of the biased nucleotide composition of viral RNA genomes on RNA structure and codon usage. J Gen Virol. 2016;97:2608-2619. [DOI] [PubMed] [Google Scholar]
- 24. Berkhout B, van Hemert F. On the biased nucleotide composition of the human coronavirus RNA genome. Virus Res. 2015;202:41-47. [DOI] [PMC free article] [PubMed] [Google Scholar]
- 25. Kandeel M, Altaher A. Synonymous and biased codon usage by MERS CoV papain-like and 3CL-proteases. Biol Pharm Bull. 2017;40:1086-1091. [DOI] [PubMed] [Google Scholar]
- 26. Chen Y, Xu Q, Yuan X, et al. Analysis of the codon usage pattern in Middle East respiratory syndrome coronavirus. Oncotarget. 2017;8:110337-110349. [DOI] [PMC free article] [PubMed] [Google Scholar]
- 27. Simmonds P. SSE: a nucleotide and amino acid sequence analysis platform. BMC Res Notes. 2012;5:50. [DOI] [PMC free article] [PubMed] [Google Scholar]
- 28. Wang M, Liu YS, Zhou JH, et al. Analysis of codon usage in Newcastle disease virus. Virus Genes. 2011;42:245-253. [DOI] [PMC free article] [PubMed] [Google Scholar]
- 29. Kunec D, Osterrieder N. Codon pair bias is a direct consequence of dinucleotide bias. Cell Rep. 2016;14:55-67. [DOI] [PubMed] [Google Scholar]
- 30. Wright F. The “effective number of codons” used in a gene. Gene. 1990;87:23-29. [DOI] [PubMed] [Google Scholar]
- 31. Novembre JA. Accounting for background nucleotide composition when measuring codon usage bias. Mol Biol Evol. 2002;19:1390-1394. [DOI] [PubMed] [Google Scholar]
- 32. Fuglsang A. The “effective number of codons” revisited. Biochem Biophys Res Commun. 2004;317:957-964. [DOI] [PubMed] [Google Scholar]
- 33. Belalov IS, Lukashev AN. Causes and implications of codon usage bias in RNA viruses. PLoS ONE. 2013;8:e56642. [DOI] [PMC free article] [PubMed] [Google Scholar]
- 34. Sharp PM, Li WH. An evolutionary perspective on synonymous codon usage in unicellular organisms. J Mol Evol. 1986;24:28-38. [DOI] [PubMed] [Google Scholar]
- 35. Kumar S, Stecher G, Tamura K. MEGA7: molecular evolutionary genetics analysis version 7.0 for bigger datasets. Mol Biol Evol. 2016;33:1870-1874. [DOI] [PMC free article] [PubMed] [Google Scholar]
- 36. Sharp PM, Li WH. The Codon Adaptation Index—a measure of directional synonymous codon usage bias, and its potential applications. Nucleic Acids Res. 1987;15:1281-1295. [DOI] [PMC free article] [PubMed] [Google Scholar]
- 37. Puigbo P, Bravo IG, Garcia-Vallve S. CAIcal: a combined set of tools to assess codon usage adaptation. Biol Direct. 2008;3:38. [DOI] [PMC free article] [PubMed] [Google Scholar]
- 38. Puigbo P, Aragones L, Garcia-Vallve S. RCDI/eRCDI: a web-server to estimate codon usage deoptimization. BMC Res Notes. 2010;3:87. [DOI] [PMC free article] [PubMed] [Google Scholar]
- 39. Moriyama EN, Powell JR. Gene length and codon usage bias in Drosophila melanogaster, Saccharomyces cerevisiae and Escherichia coli. Nucleic Acids Res. 1998;26:3188-3193. [DOI] [PMC free article] [PubMed] [Google Scholar]
- 40. Romero H, Zavala A, Musto H. Codon usage in Chlamydia trachomatis is the result of strand-specific mutational biases and a complex pattern of selective forces. Nucleic Acids Res. 2000;28:2084-2090. [DOI] [PMC free article] [PubMed] [Google Scholar]
- 41. Kyte J, Doolittle RF. A simple method for displaying the hydropathic character of a protein. J Mol Biol. 1982;157:105-132. [DOI] [PubMed] [Google Scholar]
- 42. Brocchieri L, Karlin S. Geometry of interplanar residue contacts in protein structures. Proc Natl Acad Sci U S A. 1994;91:9297-9301. [DOI] [PMC free article] [PubMed] [Google Scholar]
- 43. Duret L, Mouchiroud D. Expression pattern and, surprisingly, gene length shape codon usage in Caenorhabditis, Drosophila, and Arabidopsis. Proc Natl Acad Sci U S A. 1999;96:4482-4487. [DOI] [PMC free article] [PubMed] [Google Scholar]
- 44. Sueoka N. Directional mutation pressure and neutral molecular evolution. Proc Natl Acad Sci U S A. 1988;85:2653-2657. [DOI] [PMC free article] [PubMed] [Google Scholar]
- 45. Zhou H, Wang H, Huang LF, Naylor M, Clifford P. Heterogeneity in codon usages of sobemovirus genes. Arch Virol. 2005;150:1591-1605. [DOI] [PubMed] [Google Scholar]
- 46. Cristina J, Moreno P, Moratorio G, Musto H. Genome-wide analysis of codon usage bias in Ebolavirus. Virus Res. 2015;196:87-93. [DOI] [PubMed] [Google Scholar]
- 47. Butt AM, Nasrullah I, Tong Y. Genome-wide analysis of codon usage and influencing factors in chikungunya viruses. PLoS ONE. 2014;9:e90905. [DOI] [PMC free article] [PubMed] [Google Scholar]
- 48. Wang M, Zhang J, Zhou JH, et al. Analysis of codon usage in bovine viral diarrhea virus. Arch Virol. 2011;156:153-160. [DOI] [PMC free article] [PubMed] [Google Scholar]
- 49. Hu JS, Wang QQ, Zhang J, et al. The characteristic of codon usage pattern and its evolution of hepatitis C virus. Infect Genet Evol. 2011;11:2098-2102. [DOI] [PubMed] [Google Scholar]
- 50. Mueller S, Papamichail D, Coleman JR, Skiena S, Wimmer E. Reduction of the rate of poliovirus protein synthesis through large-scale codon deoptimization causes attenuation of viral virulence by lowering specific infectivity. J Virol. 2006;80:9687-9696. [DOI] [PMC free article] [PubMed] [Google Scholar]
- 51. Sanchez G, Bosch A, Pinto RM. Genome variability and capsid structural constraints of hepatitis a virus. J Virol. 2003;77:452-459. [DOI] [PMC free article] [PubMed] [Google Scholar]
- 52. Liu YS, Zhou JH, Chen HT, et al. The characteristics of the synonymous codon usage in enterovirus 71 virus and the effects of host on the virus in codon usage pattern. Infect Genet Evol. 2011;11:1168-1173. [DOI] [PMC free article] [PubMed] [Google Scholar]
- 53. Castells M, Victoria M, Colina R, Musto H, Cristina J. Genome-wide analysis of codon usage bias in Bovine Coronavirus. Virol J. 2017;14:115. [DOI] [PMC free article] [PubMed] [Google Scholar]
- 54. Gu W, Zhou T, Ma J, Sun X, Lu Z. Analysis of synonymous codon usage in SARS Coronavirus and other viruses in the Nidovirales. Virus Res. 2004;101:155-161. [DOI] [PMC free article] [PubMed] [Google Scholar]
- 55. Jenkins GM, Holmes EC. The extent of codon usage bias in human RNA viruses and its evolutionary origin. Virus Res. 2003;92:1-7. [DOI] [PubMed] [Google Scholar]
- 56. Piovesan A, Pelleri MC, Antonaros F, Strippoli P, Caracausi M, Vitale L. On the length, weight and GC content of the human genome. BMC Res Notes. 2019;12:106. [DOI] [PMC free article] [PubMed] [Google Scholar]
- 57. Dietel AK, Merker H, Kaltenpoth M, Kost C. Selective advantages favour high genomic AT-contents in intracellular elements. PLoS Genet. 2019;15:e1007778. [DOI] [PMC free article] [PubMed] [Google Scholar]
- 58. Lui PY, Wong LY, Fung CL, et al. Middle East respiratory syndrome coronavirus M protein suppresses type I interferon expression through the inhibition of TBK1-dependent phosphorylation of IRF3. Emerg Microbes Infect. 2016;5:e39. [DOI] [PMC free article] [PubMed] [Google Scholar]
- 59. DeDiego ML, Nieto-Torres JL, Jimenez-Guardeno JM, et al. Severe acute respiratory syndrome coronavirus envelope protein regulates cell stress response and apoptosis. PLoS Pathog. 2011;7:e1002315. [DOI] [PMC free article] [PubMed] [Google Scholar]
- 60. He Y, Li J, Heck S, Lustigman S, Jiang S. Antigenic and immunogenic characterization of recombinant baculovirus-expressed severe acute respiratory syndrome coronavirus spike protein: implication for vaccine design. J Virol. 2006;80:5757-5767. [DOI] [PMC free article] [PubMed] [Google Scholar]
- 61. Minakshi R, Padhan K, Rani M, Khan N, Ahmad F, Jameel S. The SARS Coronavirus 3a protein causes endoplasmic reticulum stress and induces ligand-independent downregulation of the type 1 interferon receptor. PLoS ONE. 2009;4:e8342. [DOI] [PMC free article] [PubMed] [Google Scholar]
- 62. Chan CP, Siu KL, Chin KT, Yuen KY, Zheng B, Jin DY. Modulation of the unfolded protein response by the severe acute respiratory syndrome coronavirus spike protein. J Virol. 2006;80:9279-9287. [DOI] [PMC free article] [PubMed] [Google Scholar]
- 63. Karlin S, Mrazek J. What drives codon choices in human genes. J Mol Biol. 1996;262:459-472. [DOI] [PubMed] [Google Scholar]
- 64. Bird AP. DNA methylation and the frequency of CpG in animal DNA. Nucleic Acids Res. 1980;8:1499-1504. [DOI] [PMC free article] [PubMed] [Google Scholar]
- 65. Bellare P, Dufresne A, Ganem D. Inefficient codon usage impairs mRNA accumulation: the case of the v-FLIP Gene of Kaposi’s sarcoma-associated herpesvirus. J Virol. 2015;89:7097-7107. [DOI] [PMC free article] [PubMed] [Google Scholar]
- 66. Atkinson NJ, Witteveldt J, Evans DJ, Simmonds P. The influence of CpG and UpA dinucleotide frequencies on RNA virus replication and characterization of the innate cellular pathways underlying virus attenuation and enhanced replication. Nucleic Acids Res. 2014;42:4527-4545. [DOI] [PMC free article] [PubMed] [Google Scholar]
- 67. Greenbaum BD, Rabadan R, Levine AJ. Patterns of oligonucleotide sequences in viral and host cell RNA identify mediators of the host innate immune system. PLoS ONE. 2009;4:e5969. [DOI] [PMC free article] [PubMed] [Google Scholar]
- 68. Di Giallonardo F, Schlub TE, Shi M, Holmes EC. Dinucleotide composition in animal RNA viruses is shaped more by virus family than by host species. J Virol. 2017;91:e02381-16. [DOI] [PMC free article] [PubMed] [Google Scholar]
- 69. Yang Y, Zhang L, Geng H, et al. The structural and accessory proteins M, ORF 4a, ORF 4b, and ORF 5 of Middle East respiratory syndrome coronavirus (MERS-CoV) are potent interferon antagonists. Protein Cell. 2013;4:951-961. [DOI] [PMC free article] [PubMed] [Google Scholar]
- 70. Haas J, Park EC, Seed B. Codon usage limitation in the expression of HIV-1 envelope glycoprotein. Curr Biol. 1996;6:315-324. [DOI] [PubMed] [Google Scholar]
Associated Data
This section collects any data citations, data availability statements, or supplementary materials included in this article.
Supplementary Materials
Supplemental material, Figure_S1_xyz352879a2e7e37 for Analysis of Codon Usage and Nucleotide Bias in Middle East Respiratory Syndrome Coronavirus Genes by Snawar Hussain, Pottathil Shinu, Mohammed Monirul Islam, Muhammad Shahzad Chohan and Sahibzada Tasleem Rasool in Evolutionary Bioinformatics
Supplemental material, Figure_S2_xyz35287fc9154dd for Analysis of Codon Usage and Nucleotide Bias in Middle East Respiratory Syndrome Coronavirus Genes by Snawar Hussain, Pottathil Shinu, Mohammed Monirul Islam, Muhammad Shahzad Chohan and Sahibzada Tasleem Rasool in Evolutionary Bioinformatics
Supplemental material, Supplimentary_Data_xyz3528713f406c7 for Analysis of Codon Usage and Nucleotide Bias in Middle East Respiratory Syndrome Coronavirus Genes by Snawar Hussain, Pottathil Shinu, Mohammed Monirul Islam, Muhammad Shahzad Chohan and Sahibzada Tasleem Rasool in Evolutionary Bioinformatics