

Abstract
The pharmacodynamic interactions among trifluoperazine (TFP), gemcitabine (GEM), and paclitaxel (PTX) were assessed in pancreatic cancer cells (PANC-1). The phenothiazine TFP was chosen for its potential activity on cancer stem cells, while GEM and PTX cause apoptosis. Effects of each drug alone and in various combinations on cell growth inhibition of PANC-1 cells were studied in vitro to determine the drug-specific parameters and assess the nature of drug interactions. Joint inhibition (JI) and competitive inhibition (CI) equations were applied with a ψ interaction term. TFP fully inhibited growth of cells (Imax = 1) with an IC50 = 9887 nM. Near-maximum inhibition was achieved for GEM (Imax = 0.825) and PTX (Imax = 0.844) with an IC50 = 17.4 nM for GEM and IC50 = 7.08 nM for PTX. Estimates of an interaction term ψ revealed that the combination of TFP-GEM was apparently synergistic; close to additivity, the combination TFP-PTX was antagonistic. The interaction of GEM-PTX was additive, and TFP-GEM-PTX was synergistic but close to additive. The combination of TFP IC60–GEM IC60–PTX IC60 seemed optimal in producing inhibition of PANC-1 cells with an inhibitory effect of 82.1–90.2%. The addition of ψ terms to traditional interaction equations allows assessment of the degree of perturbation of assumed mechanisms.
Keywords: competitive inhibition, drug-drug interaction, joint inhibition, pancreatic cancer, pharmacodynamic interaction
INTRODUCTION
The standard of care of treatment for metastatic pancreatic cancer (gemcitabine and nab-paclitaxel) has been defined by ASCO (American Society of Clinical Oncology) (1). Gemcitabine (GEM) is a pyrimidine antimetabolite and acts in the incorporation of metabolite dFdCTP into DNA during the replication and in blocking the progression of cells at the S phase in the cell cycle leading to apoptosis. The dFdCDP also prevents the synthesis of DNA by ribonucleotide reductase (2). Paclitaxel (PTX) has been bound to albumin to improve its solubility without solvents and to decrease toxicity (3). Also, albumin enhances the transport of PTX across endothelial cells, which increases accumulation of the drug close to the tumor due to the albumin-binding protein secreted protein acidic rich in cysteine (SPARC) (3,4). The binding to albumin appears to affect the pharmacokinetics and not the pharmacodynamics; hence, PTX was chosen for these studies. PTX comes from the taxane family, is an antimicrotubule agent, and inhibits the depolymerization that leads to a stabilization of microtubules (4) causing an arrest in the G2/M phase of the cell cycle and generating apoptosis (5,6).
Trifluoperazine (TFP) was chosen for its potential activity on pancreatic cancer stem cells (CSC). It was suggested that TFP can inhibit DNA repair function and the activity of the DNA-dependent protein kinase (DNA-PK) in vitro (7). The phenothiazines are calmodulin antagonists and the calmodulin pathway is involved in DNA repair (7). Calmodulin is implicated in the regulation of cell proliferation, motility, and differentiation. Consequently, calmodulin antagonists decrease proliferation and also favor apoptosis via the increase of caspase 8 and Bax, reducing Bcl2, and decreasing the activation of AKT. These antagonists also enhance TRA-8-induced apoptosis of resistant pancreatic cells and prevent the recruitment of the survival signal Src (8). These effects on the apoptotic pathway were confirmed in lung cancer cells (9) and some derivatives of TFP have been patented (10).
Our hypothesis is that TFP combined with GEM and PTX can enhance the inhibition of proliferation by targeting cancer stem cells (CSC), one of the causes of chemotherapy resistance and relapse. In order to determine the nature and intensity of interactions (antagonism, additivity, or synergy) among the drugs, both two-drug and three-drug interactions were assessed. In vitro experiments utilized the pancreatic cancer cell line PANC-1. Joint inhibition (JI) and competitive inhibition (CI) equations (11–13) were used to quantify the interactions and were extended to three drugs. An interaction term ψ was used to assess the degree of unexplained interaction, namely the degree of change from normal operation of the semi-mechanistic equations (14). The objective of the study is basically to determine if adding TFP to the standard of care therapeutic drugs for pancreatic cancer offers any promise towards improving efficacy in a classical in vitro screening cell model.
METHODS
Drugs
Trifluoperazine dihydrochloride was obtained from Sigma-Aldrich (St. Louis, MO). The concentration of the trifluoperazine stock solution was 50 mM in sterile Milli-Q water and stored as aliquots at 4°C. Gemcitabine hydrochloride was purchased from Sigma-Aldrich (St. Louis, MO). The concentration of the gemcitabine stock solution was 50 mM in sterile Milli-Q water and stored as aliquots at − 20°C. Paclitaxel was obtained from Sequoia Research Products Ltd. (Pangbourne, UK). The concentration of the paclitaxel stock solution was 1 mM in dimethylsulfoxide (DMSO; Sigma-Aldrich) and stored as aliquots at − 20°C. The highest concentration of paclitaxel led to a final concentration of 0.01% (v/v) DMSO in the culture medium.
Cell Culture
The cell line PANC-1 was obtained from the American Type Culture Collections (Manassas, VA). Dulbecco’s modified Eagle’s medium (DMEM; VWR International LLC, Bridgeport, NJ) containing 10% (v/v) fetal bovine serum (FBS; VWR) was used to culture the cells. Cells were grown in a humidified atmosphere with 5% CO2 at 37°C in culture flasks (Corning, Durham, NC). Each passage was done with 0.05% trypsin with 0.53 mM EDTA (Corning Inc., Corning, NY) when the confluence reached 90% of cells. The DPBS (Corning) was used to wash the cells when necessary.
Inhibition Parameters
The experiments were performed two times for TFP, GEM, and PTX. Cells of the passages P26 and P29 were seeded in six-well plates at densities of 2.25 and 2.53 × 10⁵ cells per well in a volume of 2 mL. A delay of 24 h allowed the cells to adhere before drug exposure. The concentrations used for each drug are listed in Table I. After drug exposure of 72 h, cells were washed with DPBS and harvested with trypsin. A Beckman Coulter Counter Z2 was used to count to cells using the isotonic diluent from Beckman Coulter (Hebron, KY). Each sample was counted in triplicate. The vehicle control was water or DMSO at the highest concentration used for the drug-treated experiments.
Table I.
Parameter Estimates and 95% CI for Each Drug Studied Individually
| Parameters | Trifluoperazine1 | Gemcitabine2 | Paclitaxel3 | ||||||
|---|---|---|---|---|---|---|---|---|---|
| Value | 95% CI | CV% | Value | 95% CI | CV% | Value | 95% CI | CV% | |
| R01 (cells) | 9.40E + 05 | – | Fix | 9.14E + 05 | (8.89–9.39)E + 05 | 1.37 | 8.78E + 05 | (8.52–9.05)E + 05 | 1.52 |
| R02 (cells) | 9.55E + 05 | – | Fix | 9.88E + 05 | (0.961–1.02)E + 06 | 1.37 | 9.71E + 05 | (0.941–1.00)E + 06 | 1.52 |
| Imax | 1 | – | Fix | 0.825 | 0.815–0.835 | 0.607 | 0.844 | 0.838–0.845 | 0.353 |
| γ | 1.84 | 1.71–1.96 | 3.37 | 2.54 | 2.33–2.76 | 4.26 | 4.34 | 4.08–4.60 | 3.02 |
| IC50 (nM) | 9887 | 8477–11,130 | 7.13 | 17.4 | 16.8–18.0 | 1.80 | 7.08 | 6.92–7.25 | 1.17 |
| IC20 (nM) | 4646 | 3791–5502 | 9.21 | 10.1 | 9.37–10.8 | 3.51 | 5.15 | 4.94–5.35 | 1.99 |
| IC30 (nM) | 6232 | 5189–7275 | 8.37 | 12.5 | 11.8–13.1 | 2.74 | 5.83 | 5.64–6.02 | 1.65 |
| IC40 (nM) | 7927 | 6705–9150 | 7.71 | 14.8 | 14.2–15.5 | 2.19 | 6.45 | 6.27–6.63 | 1.39 |
| IC60 (nM) | 12,330 | 10,710–13,950 | 6.58 | 20.4 | 19.7–21.0 | 1.61 | 7.78 | 7.63–7.93 | 0.983 |
| IC70 (nM) | 15,690 | 13,790–17,580 | 6.04 | 24.3 | 23.4–25.1 | 1.72 | 8.61 | 8.47–8.76 | 0.841 |
| Sigma | 0.3805 | 0.296–0.466 | 11.2 | 0.0431 | 0.0343–0.0519 | 10.2 | 0.0403 | 0.0321–0.0486 | 10.2 |
| Intercept | 0.001 | – | Fix | 0.001 | – | Fix | 0.001 | – | Fix |
Concentrations used: 2251, 5437, 9456, 12,320, 16,450, 36,960, and 250,000 nM
Concentrations used: 3, 8.2, 14.8, 18.5, 26.6, 57.21, and 100 nM
Concentrations used: 4.257, 6.078, 7.602, 9.317, 11, 27.951, and 100 nM
The experiments were carried first for two-drug interactions and then for three-drug interactions. Cells of the passage P28 were seeded in six-well plates at a density of 2.53 × 10⁵ cells per well in a volume of 2 mL for the two-drug interactions and at a density of 2.46 × 10⁵ for the three-drug interactions. Cells were exposed to low, medium, and high concentrations of each drug alone or in combinations. These concentrations were near the IC20, IC40, and IC60 for each drug.
Determination of IC50
The IC50 of each drug was assessed as a single agent over a period of 72 h. The inhibitory form of the Hill function was used to fit the concentration-response curves.
| (1) |
with R, the number of per mL cells (2 mL per well); R0cells, the baseline number of cells per mL at zero drug concentration (control); Imax, the maximum inhibition; IC50, the concentration that inhibits 50% of the cell growth, γ, the Hill coefficient, and C, the concentration of the drug. Because of different seeding numbers due to replicate experiments, the baselines were fixed to experimental values for TFP only.
The equation fittings were performed using the software ADAPT 5 (15) with the maximum likelihood method. The variance model used was as follows:
| (2) |
with Y(1) the response, PV(1) the intercept fixed to 0.001, and PV(2) the slope.
The IC20, IC40, and IC60 values were calculated from the following:
| (3) |
with ICX the concentration inhibiting X% of the maximal effect.
Interaction Analysis
For two-drug interactions, the equation for joint inhibition (JI) is as follows (11)
| (4) |
This is equivalent to (13):
| (5) |
This equation assumed dual inhibition of a turnover process by nonspecific non-competitive mechanisms. The traditional equation for competitive inhibition (CI) (11) is as follows:
| (6) |
This equation originated with Ariens et al. (12) where two drugs compete for a common target. For three-drug interactions, the equation for JI expands to the following:
| (7) |
that can also be written:
| (8) |
with
| (9) |
The equation for the three-drug CI was as follows:
| (10) |
with parameters having the same definitions as in Eq. 1.
The ψ is the interaction term that assesses possible changes in IC50 values when data do not fit the basic equations. The interaction is apparently antagonistic if ψ > 1, additive if ψ = 1, and synergistic if ψ < 1.
There are different assumptions for each equation. Two drugs are said to be competitive when they share the same target. The competitive equation assumes the presence of only one target and stipulates that the maximum is equal to the maximum among single effects. Joint inhibition assumes that there are multiple targets and that the maximal effect is equal to the sum of the maximal effects of each drug (see Fig. 3 in Ref. (11)).
Fig. 3.
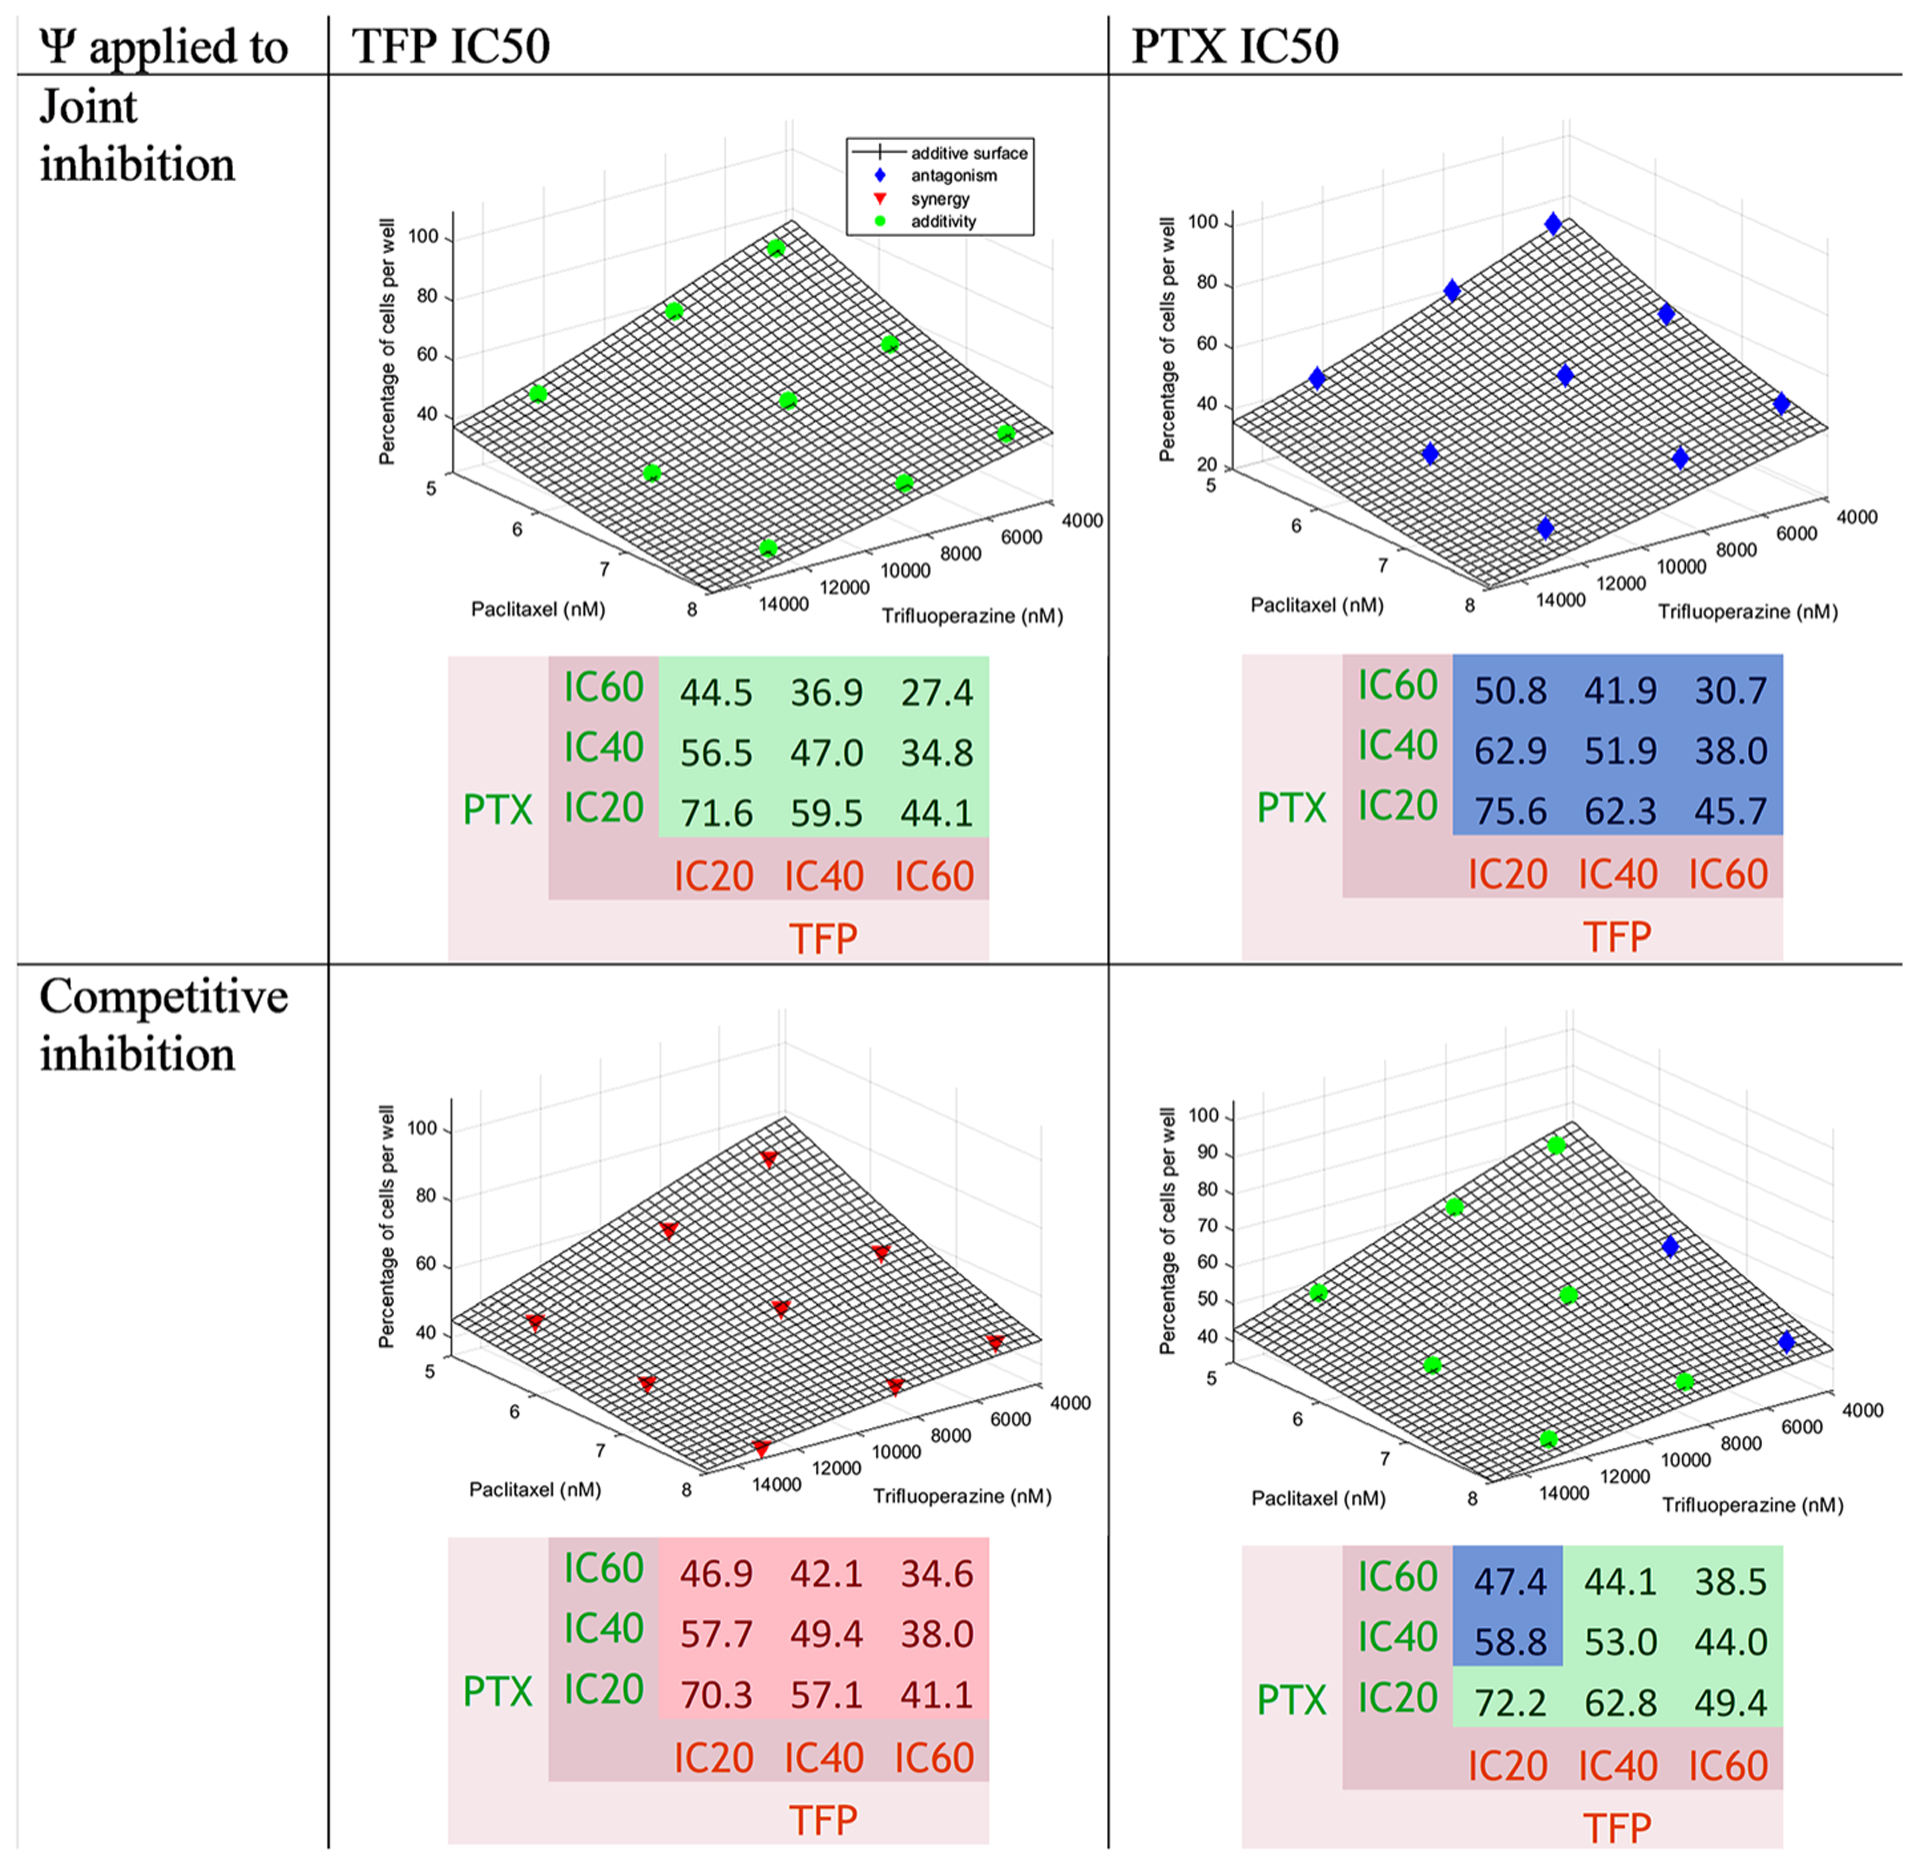
Concentration-effect graph and predicted percentage of cells for the interaction TFP-PTX for joint inhibition and competitive inhibition with ψ applied to TFP and PTX IC50 values. The surface represents the additive interaction. Colors are defined in Fig. 2
All equations were fitted using the software ADAPT 5 (15) with the maximum likelihood method. The variance model used was the same as Eq. 2. An example of ADAPT code and the dataset for the three-drug interactions is provided in the Supplementary Materials.
Methods of Modeling
First, R0 (cells), Imax, and γ of each drug alone were determined specifically for the two-drug or three-drug combination experiments. Then, R0% and ψ for combinations were estimated by fixing IC50, Imax, and γ. This method assured that the intrinsic activity was considered constant to reveal interactions via the JI and CI equation structures and ψ values. The ψ was assigned alternatively to the IC50 of each drug to study the impact of each drug on the other.
Prediction Error
To determine if one of the equations JI or CI functioned better for some interactions, the prediction error was calculated as the ratio between the predicted and true values. In our study, the true values were the data. The bias was defined as the mean of prediction errors. The inaccuracy was defined as the interquartile range of the prediction error. An interval of ± 15% was defined as acceptable. Boxplots were created with the software R.
Theoretical Percentages of Cells
The theoretical percentages of cells were calculated from the data by applying the following equation for drug A by using the estimates of ImaxA and γA from the model when the drug was used as a single agent; CA and IC50A were drug concentrations in nanomolar.
| (11) |
The same equation was applied for the second and third drugs with the new baseline equal to the number of cells found from the previous calculations (Eq. 11).
| (12) |
Three-Dimensional Concentration-Effect Graphs
The interaction term ψ provides a general measure of any disturbances (non-additivity) in functioning of the JI and CI equations for the combinations (16). The three-dimensional concentration-effect graphs were plotted with MATLAB for the two-drug and three-drug interactions from the final estimates of R0 and the previously determined values of IC50, Imax, and γ. The colors indicated the type of interaction. For two-drug interactions, the surface represents the percentage of cells in the case of an additive interaction (ψ = 1). For two-drug interactions, the points provided the percentage of cells for each combination. The distance from the surface allows visualization of non-additivity.
RESULTS
Determination of Inhibition Parameters
The concentration-response curves of each drug alone are shown in Fig. 1. The values of the parameter estimates and their coefficients of variation (CV%) are reported in Table I. The maximum inhibition was 1.0 for TFP, 0.825 for GEM, and 0.844 for PTX. The IC50 was 9887 nM for TFP, 17.4 nM for GEM, and 7.08 nM for PTX. The γ values were 1.84 for TFP, 2.54 for GEM, and 4.34 for PTX. As the Imax of TFP was equal to 1, and about 0.83 for GEM and PTX, TFP was better able to achieve full inhibition.
Fig. 1.
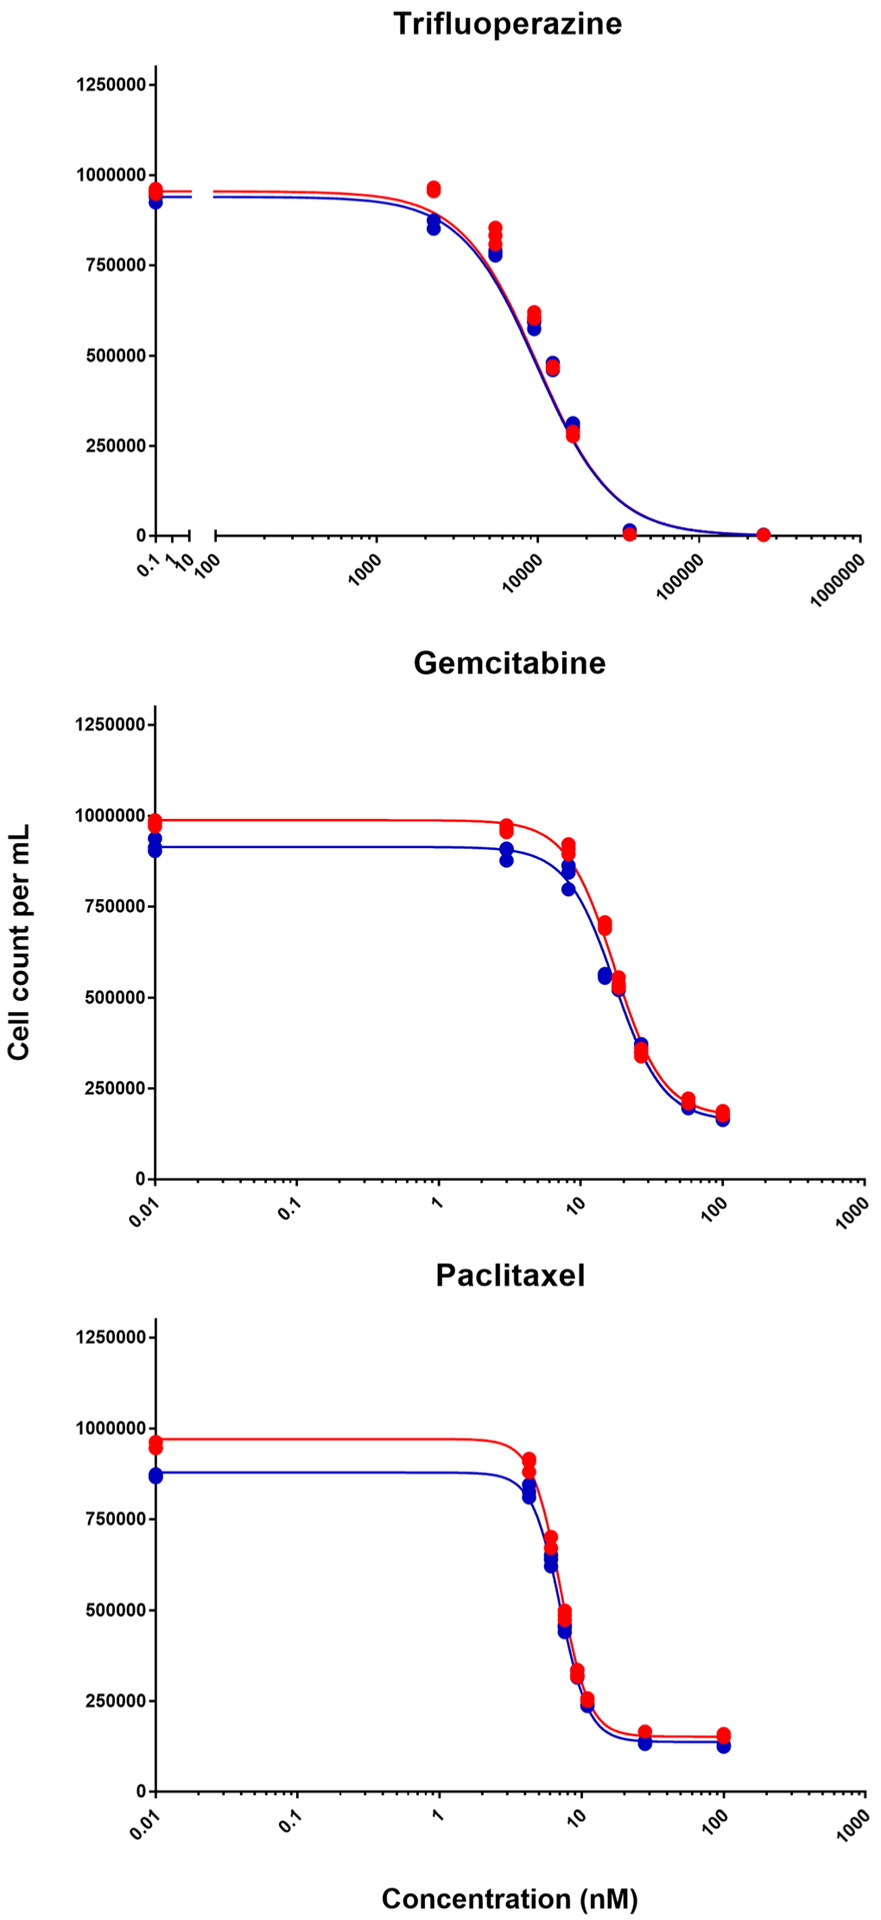
Concentration-response curves of each indicated drug. Symbols depict data from two triplicate experiments and lines show fittings using Eq. (1)
Table II provides parameter estimates for each drug when present in the combinations. These were different experimental runs and thus the individual drug parameters differ slightly from previous values. However, all parameters were similar to those in Table I.
Table II.
Parameter Estimates for Each Drug as Single Agents for Two-Drug Combinations and Three-Drug Combination
| Trifluoperazine | Gemcitabine | Paclitaxel | ||||||||
|---|---|---|---|---|---|---|---|---|---|---|
| Parameters | Value | 95% CI | CV% | Value | 95% CI | CV% | Value | 95% CI | CV% | |
| Two-drug combination | R0 (cells) | 1.02E + 06 | (1.01–1.03)E + 06 | 0.619 | 1.01E + 06 | (1.00–1.02)E + 06 | 0.562 | 1.01E + 06 | (0.991–1.02)E + 06 | 0.668 |
| Imax | 1.00 | – | Fix | 0.733 | 0.617–0.849 | 7.91 | 0.786 | 0.657–0.914 | 8.19 | |
| γ | 1.92 | 1.81–2.03 | 2.82 | 2.57 | 2.15–3.00 | 8.32 | 3.58 | 2.83–4.32 | 10.4 | |
| IC50 (nM) | 1.35E + 04 | (1.33–1.38)E + 04 | 0.953 | 15.8 | 13.7–17.9 | 6.71 | 6.21 | 5.60–6.83 | 4.95 | |
| Sigma | 0.0110 | 0.00653–0.0156 | 20.4 | 0.00974 | 0.00576–0.0137 | 20.4 | 0.0116 | 0.00685–0.0163 | 20.4 | |
| Intercept | 0.001 | – | Fix | 0.001 | – | Fix | 0.001 | – | Fix | |
| Three-drug combination | R0 (cells) | 1.06E + 06 | (1.05–1.07)E + 06 | 0.417 | 1.03E + 06 | (1.02–1.04)E + 06 | 0.438 | 1.01E + 06 | (0.998–1.02)E + 06 | 0.580 |
| Imax | 1.00 | – | fix | 0.842 | 0.765–0.920 | 4.61 | 0.866 | 0.790–0.943 | 4.44 | |
| γ | 1.87 | 1.82–1.92 | 1.35 | 2.64 | 2.37–2.91 | 5.11 | 4.51 | 3.98–5.03 | 5.81 | |
| IC50 (nM) | 1.04E + 04 | (1.03–1.05)E + 04 | 0.580 | 15.6 | 14.4–16.8 | 3.82 | 6.40 | 6.12–6.68 | 2.19 | |
| Sigma | 0.00734 | 0.00421–0.0105 | 21.3 | 0.00758 | 0.00449–0.0107 | 20.4 | 0.0101 | 0.00595–0.0142 | 20.4 | |
| Intercept | 0.001 | – | Fix | 0.001 | - | Fix | 0.001 | - | Fix | |
Prediction Errors
The boxplots with the prediction errors did not indicate better fittings with either of the equations: JI or CI, except for the interaction GEM-PTX that showed less variability with the JI equation and for the three-drug combination that was best fitted by the CI equation. The boxplots are shown in the Supplemental Materials (Figs. S1–S4).
Trifluoperazine-Gemcitabine Interaction
Equations 5 and 6 were used for the fittings of each pair of drugs. Figure 2 shows that as the concentration of drugs increased, the percentage of cells was reduced. The surface representing an additive interaction covered 75.5 to 26.8% cell survival, 75.5% for the combination at low concentrations and 26.8% for the high concentrations. The percentage of cells decreased more strongly with the increase of GEM concentrations than with TFP. Generally, synergy was found with some additivity for JI when the ψ was applied to the GEM IC50 at low and medium concentrations of GEM and when the ψ was applied to the TFP IC50 at low concentrations of TFP and for CI when the ψ was applied to the TFP IC50 at low concentrations of TFP and high concentration of GEM. Antagonism was found for JI when the ψ was applied to the TFP IC50 at medium and high concentrations of TFP.
Fig. 2.
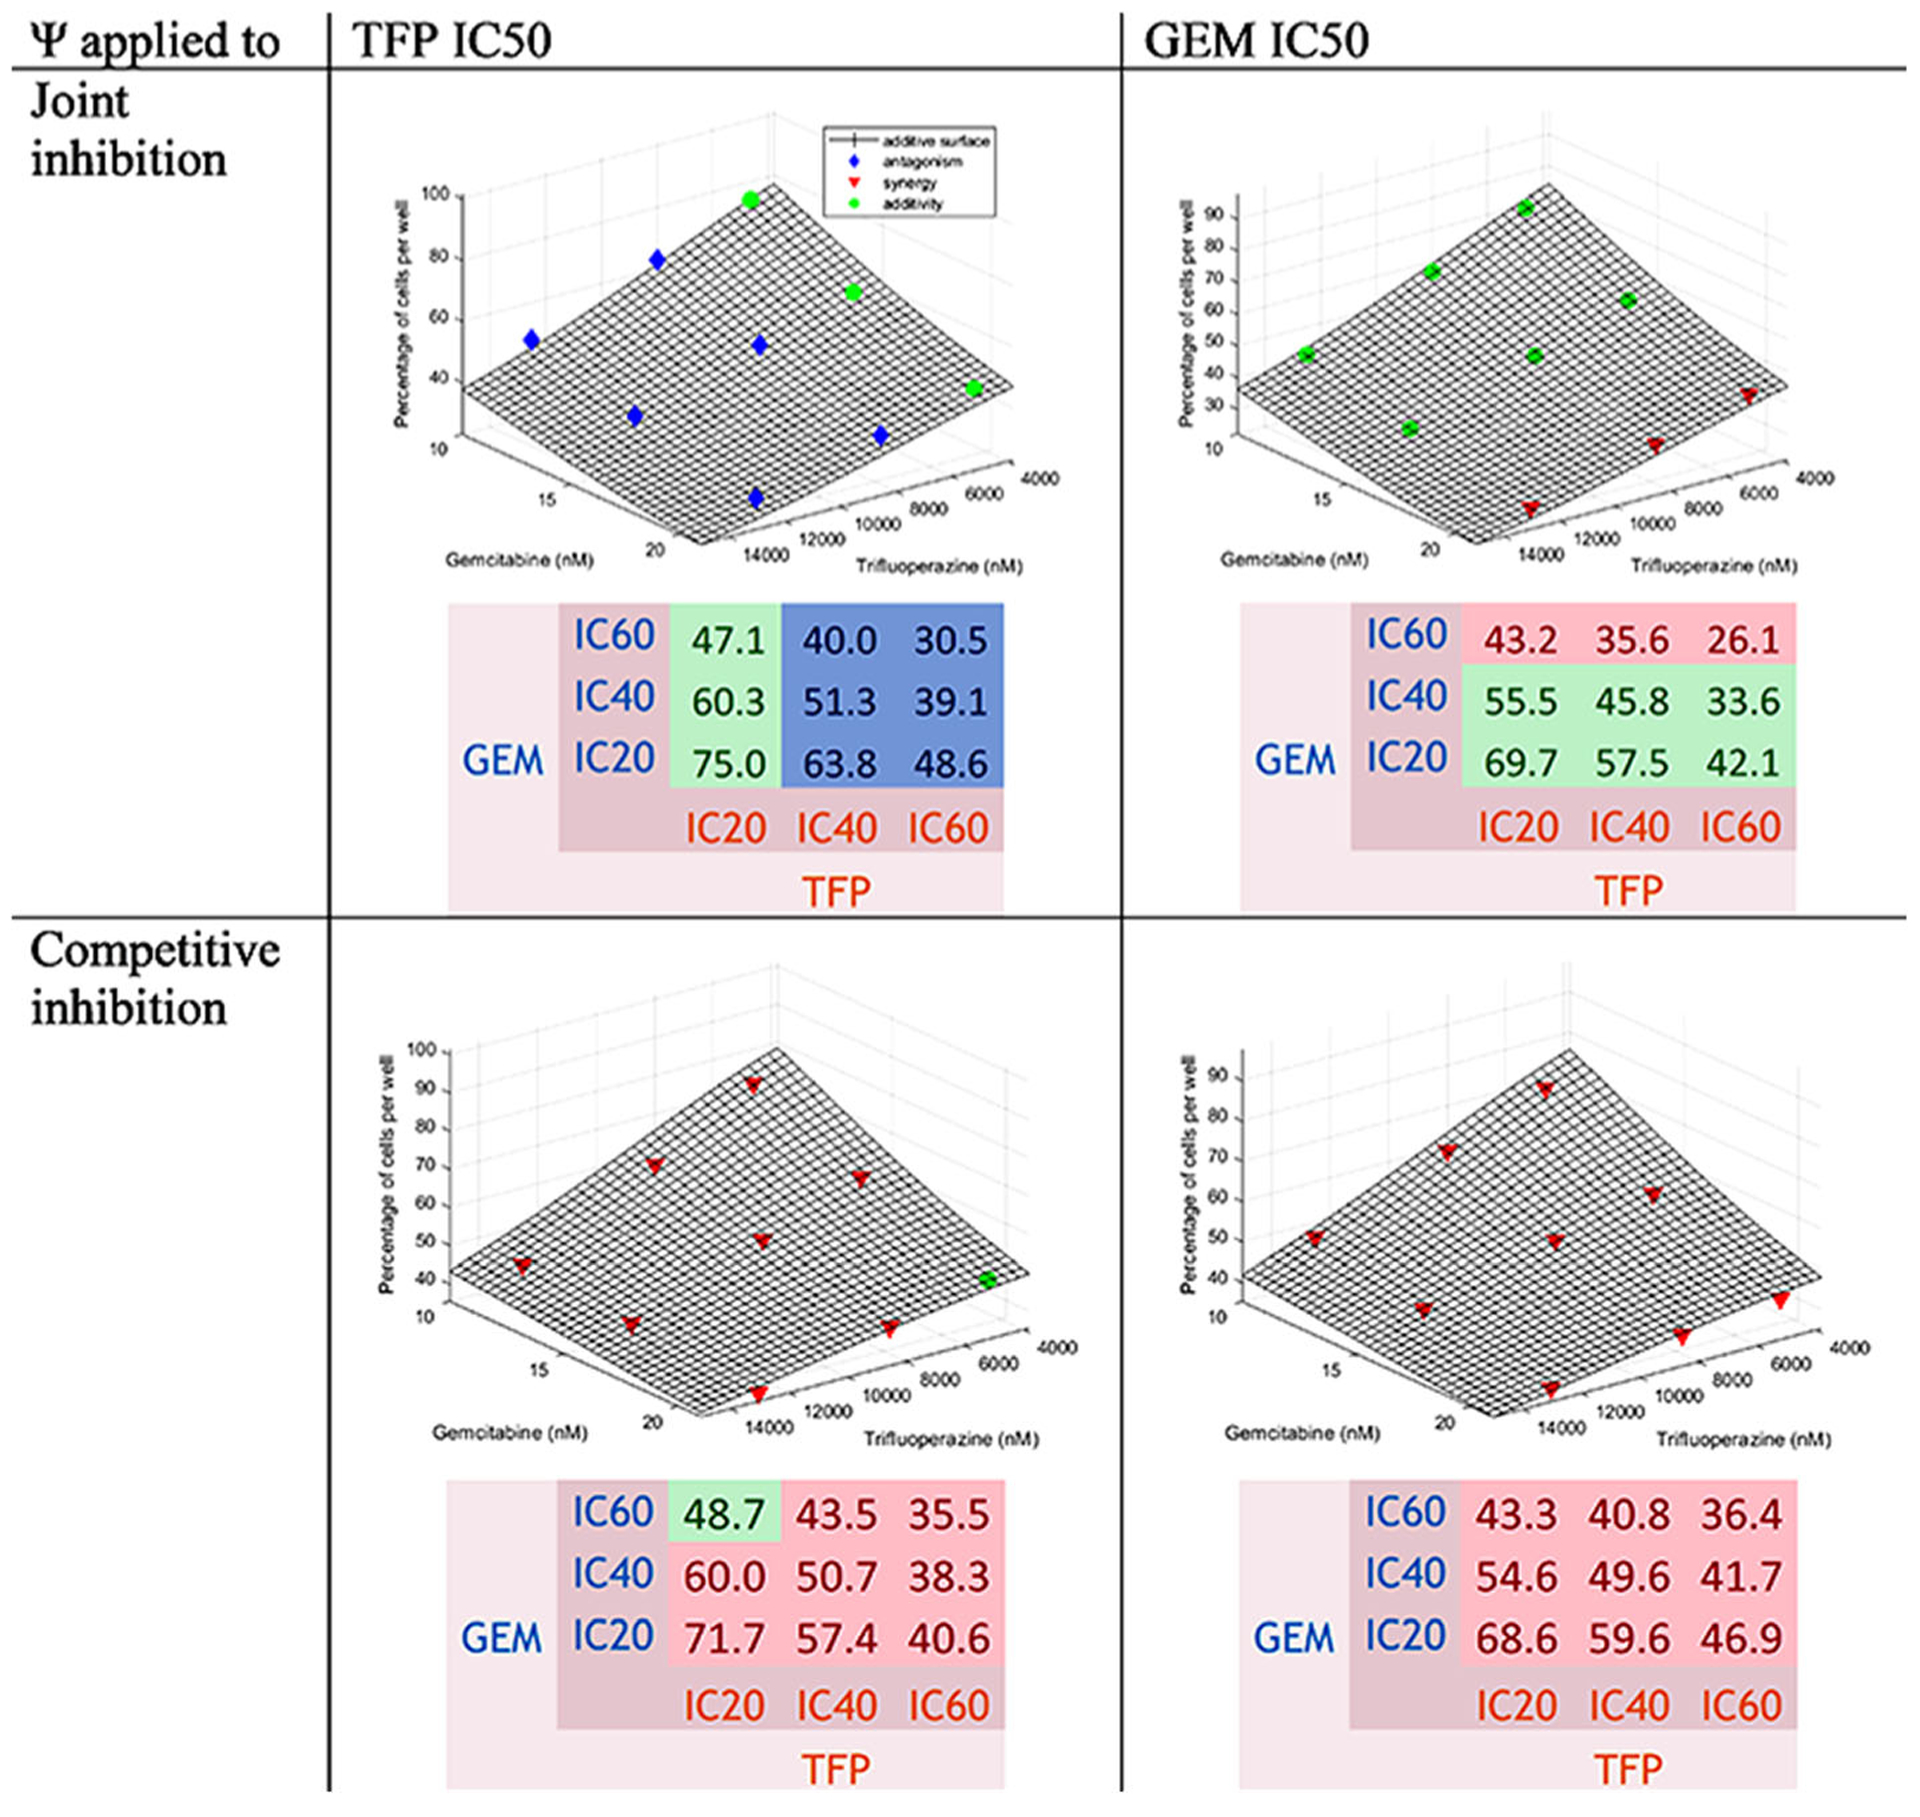
Concentration-effect graph and predicted percentage of cells for the interaction TFP-GEM for joint inhibition and competitive inhibition with ψ applied to TFP and GEM IC50 values. The surface represents the additive interaction. The points in blue are above the surface (antagonism); in green, if within 2.5% of the additive surface; and in red, when below the surface (synergy)
To assess effects of GEM on TFP, the ψ was applied to the TFP IC50. Values of ψ were 1.12 (95% confidence interval [1.10–1.13]) with slight antagonism for JI and 0.787 [0.777–0.797] with modest synergy for CI. The values are listed in Table III.
Table III.
Parameter Estimates for the Two-Drug Combinations
| ψ for TFP | ψ for GEM | |||||||
|---|---|---|---|---|---|---|---|---|
| Estimates | 95% CI | CV (%) | Estimates | 95% CI | CV (%) | |||
| Interaction of trifluoperazine and gemcitabine | R0 (%) | 101 | 101–102 | 0.272 | 97.7 | 96.9–98.5 | 0.394 | |
| Joint inhibition | ψ | 1.12 | 1.10–1.13 | 0.570 | 0.969 | 0.956–0.981 | 0.647 | |
| Sigma | 0.00994 | 0.00737–0.0125 | 12.9 | 0.0115 | 0.00849–0.0144 | 12.9 | ||
| Intercept | 0.001 | – | Fix | 0.001 | – | Fix | ||
| Competitive inhibition | ψ | 0.787 | 0.777–0.797 | 0.647 | 0.866 | 0.851–0.881 | 0.865 | |
| Sigma | 0.0142 | 0.0106–0.0179 | 12.9 | 0.0134 | 0.00989–0.0168 | 12.9 | ||
| Intercept | 0.001 | – | Fix | 0.001 | – | Fix | ||
| ψ for TFP | ψ for PTX | |||||||
| Estimates | 95% CI | CV (%) | Estimates | 95% CI | CV (%) | |||
| Interaction of trifluoperazine and paclitaxel | R0 (%) | 110 | 110–111 | 0.203 | 105 | 105–106 | 0.311 | |
| Joint inhibition | ψ | 1.03 | 1.02–1.04 | 0.390 | 1.15 | 1.14–1.16 | 0.342 | |
| Sigma | 0.00758 | 0.00558–0.00957 | 13.2 | 0.00822 | 0.00605–0.0104 | 13.2 | ||
| Intercept | 0.001 | – | Fix | 0.001 | – | Fix | ||
| Competitive inhibition | ψ | 0.768 | 0.761–0.775 | 0.455 | 1.02 | 1.01–1.03 | 0.412 | |
| Sigma | 0.00863 | 0.00636–0.0109 | 13.2 | 0.00962 | 0.00709–0.01215 | 13.2 | ||
| Intercept | 0.001 | – | Fix | 0.001 | – | Fix | ||
| ψ for GEM | ψ for PTX | |||||||
| Estimates | 95% CI | CV (%) | Estimates | 95% CI | CV (%) | |||
| Interaction of gemcitabine and paclitaxel | R0 (%) | 97.0 | 94.2–99.9 | 1.45 | 98.2 | 94.6–102 | 1.80 | |
| Joint inhibition | ψ | 1.05 | 0.997–1.10 | 2.36 | 1.02 | 0.981–1.05 | 1.69 | |
| Sigma | 0.0337 | 0.0250–0.0424 | 12.9 | 0.0372 | 0.0275–0.0468 | 12.9 | ||
| Intercept | 0.001 | – | Fix | 0.001 | – | Fix | ||
| Competitive inhibition | ψ | 0.640 | 0.559–0.721 | 6.32 | 0.794 | 0.741–0.846 | 3.31 | |
| Sigma | 0.128 | 0.09434–0.161 | 13.1 | 0.125 | 0.0921–0.157 | 13.1 | ||
| Intercept | 0.001 | – | Fix | 0.001 | – | Fix | ||
To assess effects of TFP on GEM, the ψ was applied to GEM IC50. The values were 0.969 [0.956–0.981] with slight synergy for JI and 0.866 [0.851–0.881] with synergy for CI. The values are reported in Table III.
The combination TFP IC60-GEM IC60, TFP IC60-GEM IC40 and TFP IC40-GEM IC60 (TFP IC60-GEM IC20 for ψ applied to the TFP IC50 for CI) produced the lowest number of cells. The observed percentage of cells for TFP IC60-GEM IC60 was around 28.5%; the predictions were 28.3% for JI and 36.0% for CI. It is important to note that the observed percentage of cells for TFP IC40-GEM IC60 was around 26.3%. The predicted values are reported in the heatmap (Fig. 2). This interaction was synergistic, close to additivity, because the differences between the data and the additive surface oscillated between negative and positive values as reported in Table S I. The differences between the data and the theoretical percentages of cells are displayed in the same table. They were positive, showing antagonism, but this is likely due to some variability.
Trifluoperazine-Paclitaxel Interaction
Equations 5 and 6 were used for the fittings of each pair of drugs. Figure 3 shows that as the concentration of drugs increased, the percentage of cells was reduced. The surface representing an additive interaction covered 74.1 to 25.6% cell survival, 74.1% for the combination of both drugs at low concentrations and 25.6% at high concentrations. The percentage of cells seemed to decrease a little more with the increase of TFP concentrations than with PTX. Generally, antagonism with some additivity at TFP IC40 and IC60 for CI when the ψ was applied to the PTX IC50 and also for JI when the ψ was applied to the TFP IC50. Synergism was found for CI when the ψ was applied to the TFP IC50
To assess effects of PTX on TFP, the ψ was applied to the TFP IC50. The values of ψ were 1.03 [1.02–1.04] for JI and 0.768 [0.761–0.775] for CI, revealing slight antagonism in the first case and modest synergy in the second. However, most of the points appeared close the surface in Fig. 3 for JI when the ψ was applied to the TFP IC50.
To assess effects of TFP on PTX, the ψ was applied to the PTX IC50. The values of ψ were 1.15 [1.14–1.16] for JI and 1.02 [1.01–1.03] for CI displaying antagonism. However, most of the data were close the surface in Fig. 3 for CI when the ψ was applied to the PTX IC50. The values are presented in Table III.
The combination TFP IC60-PTX IC60, TFP IC60-PTX heatmap (Fig. 3). This interaction was antagonistic, close to IC40, and TFP IC40-PTX IC60 (or TFP IC60-PTX IC20 for CI additive, because the differences between the data and the when the ψ was applied to the TFP IC50), produced the lowest number of cells. The observed percentage of cells for was applied to the PTX IC50. The values are presented in TFP IC60-PTX IC60 was around 28.4%; the predictions were 29.1% for JI and 36.6% for CI. The values are reported in the additive surface were generally positive, as reported in Table S II. The differences between the data and the theoretical percentages of cells are displayed in the same table. They were positive, showing antagonism.
Gemcitabine-Paclitaxel Interaction Equations
5 and 6 were used for the fittings of each pair of drugs. Figure 4 shows that as the concentration of drugs increased, the percentage of cells was reduced. The surface representing an additive interaction covered 64.0 to 22.8% cell survival, 64.0% for the combination at low concentrations and 22.8% for the high concentrations. The percentage of cells decreased more strongly with PTX than with GEM. Generally, additivity, close to synergism, was found. Additivity was found for JI when the ψ was applied to the PTX IC50 and at low concentration of GEM when the ψ was applied to the GEM IC50. Antagonism with JI when the ψ was applied to the GEM IC50 was found at medium and high concentrations of GEM. Synergy was found with CI.
Fig. 4.
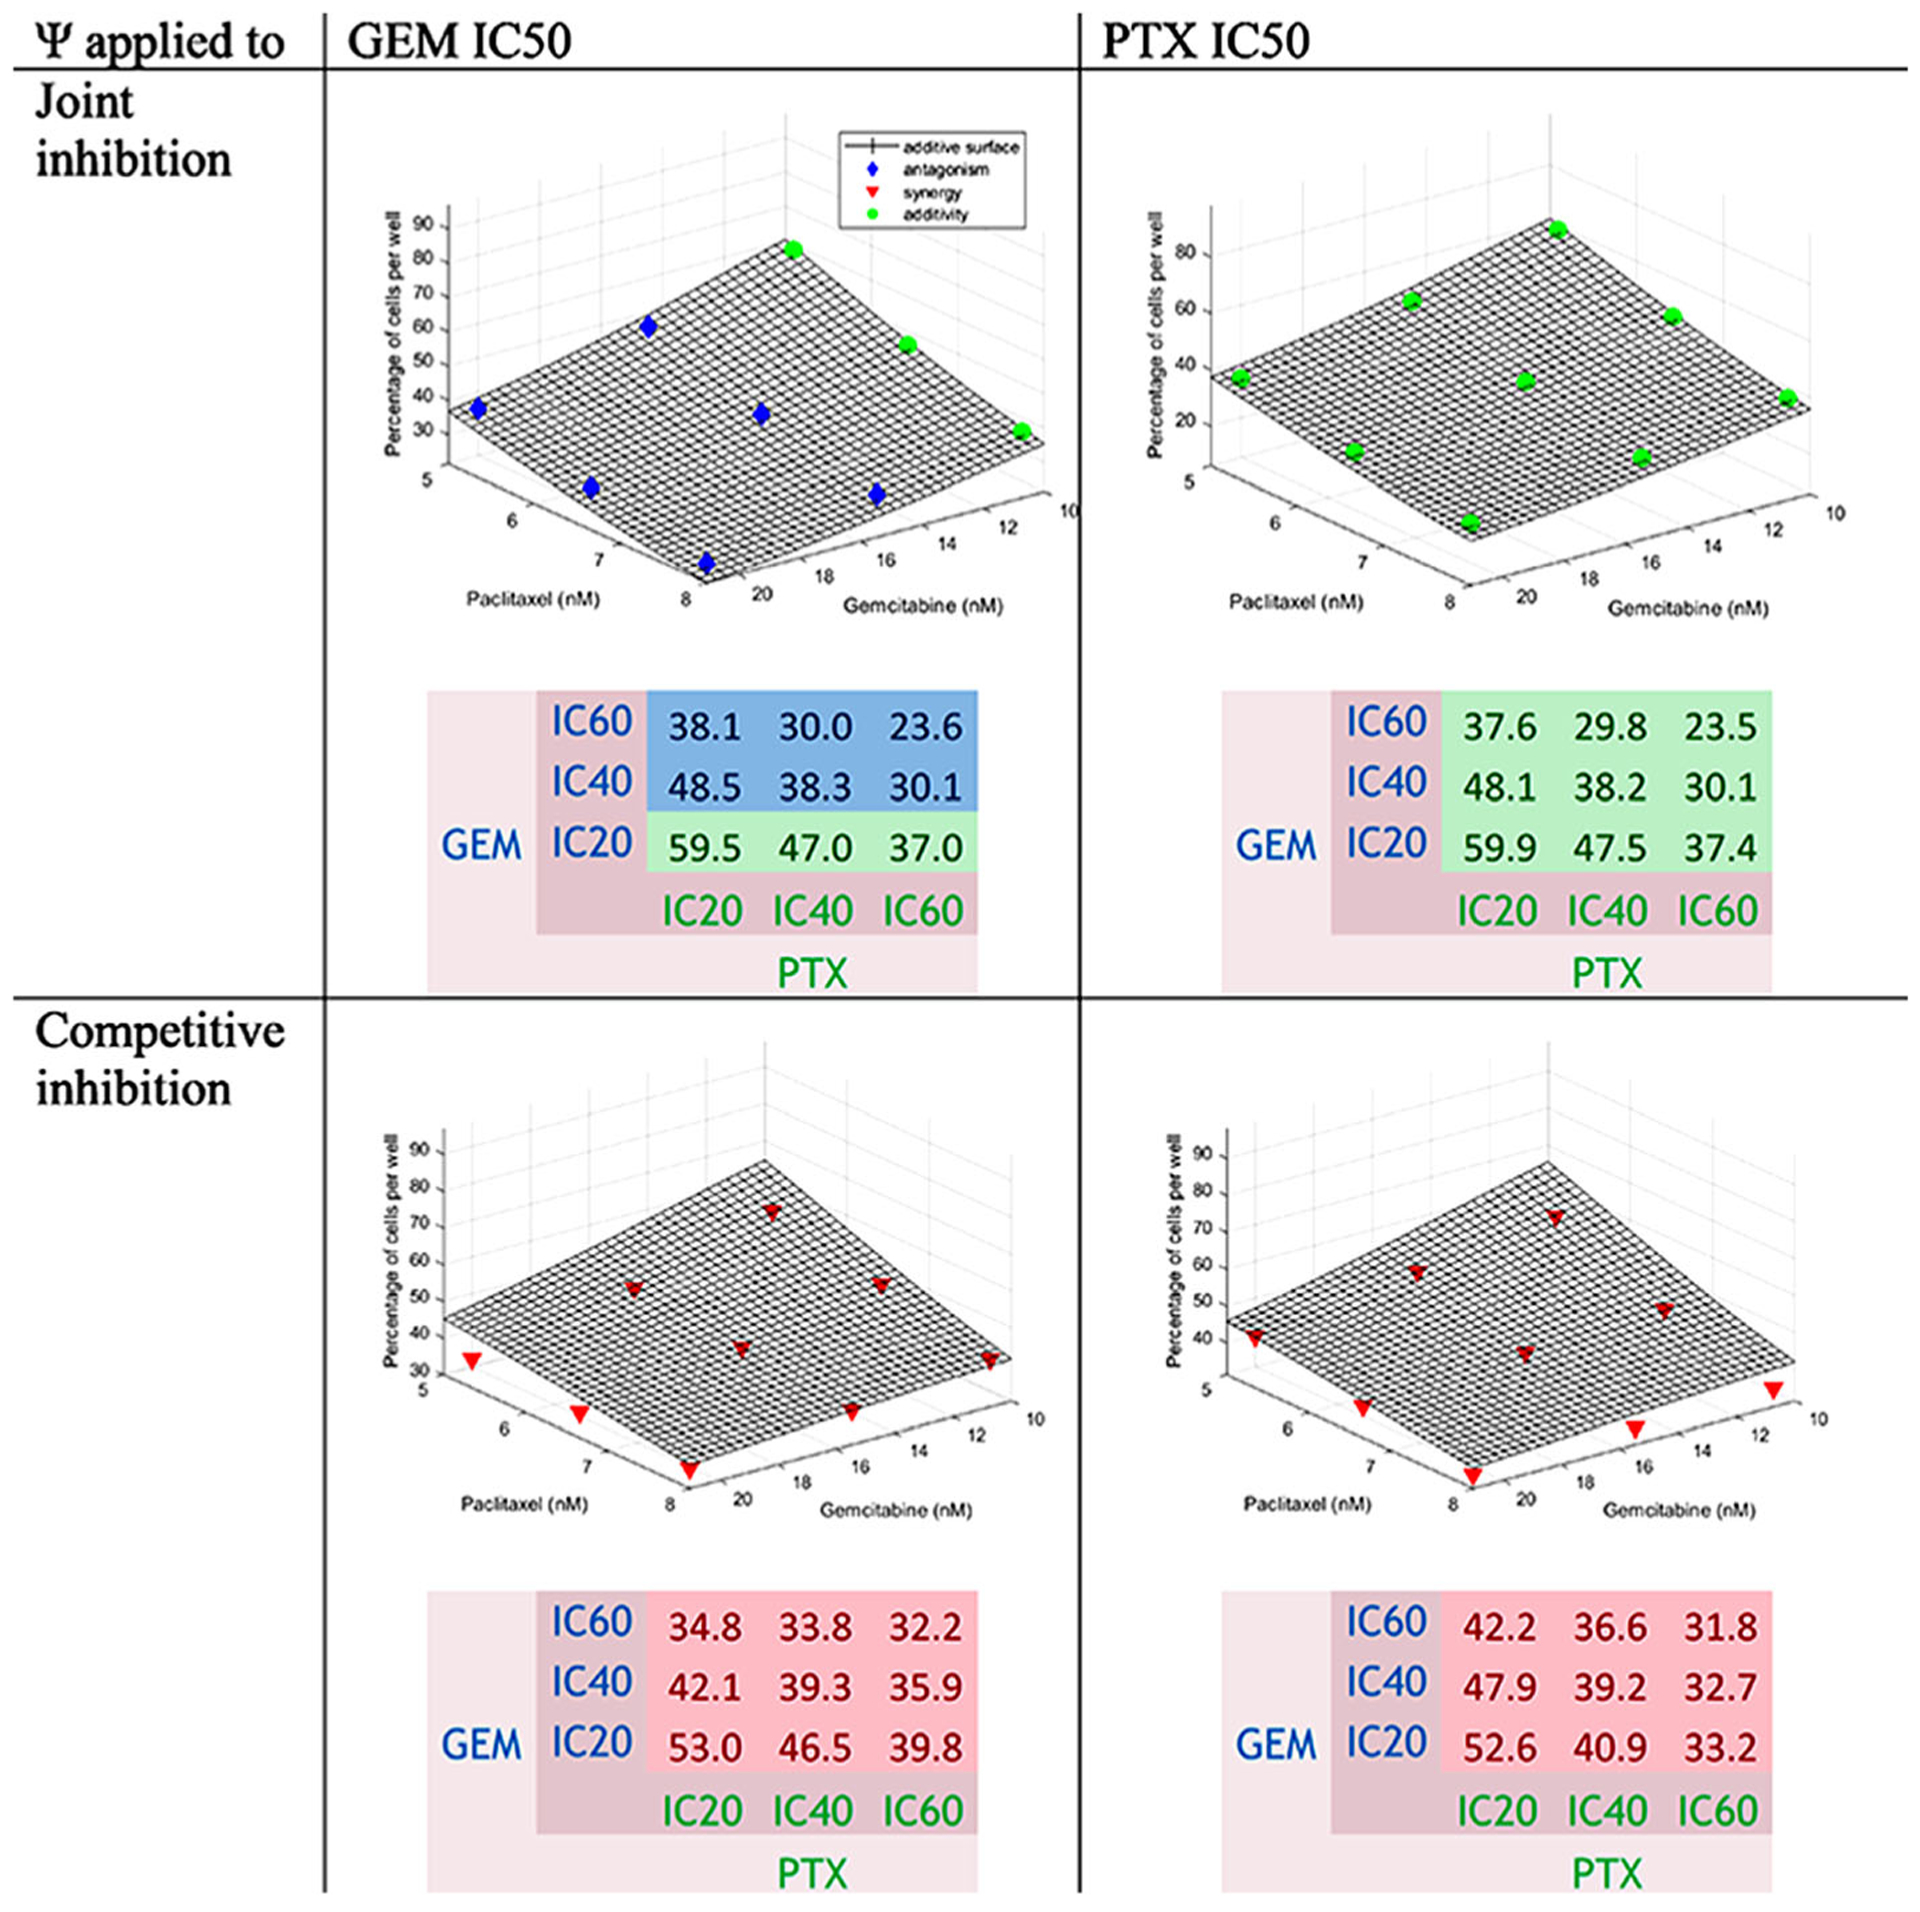
Concentration-effect graph and predicted percentage of cells for the interaction GEM-PTX for joint inhibition and competitive inhibition with ψ applied to GEM and PTX IC50 values. The surface represents the additive interaction. Colors are defined in Fig. 2
To assess the effect of PTX on GEM, the ψ was applied to the GEM IC50. The values of ψ were 1.05 [0.997–1.10] showing additivity for JI and 0.640 [0.559–0.721] with synergism for CI.
To assess the effect of GEM on PTX, the ψ was applied to the PTX IC50. The values of ψ were 1.02 [0.981–1.05] showing additivity for JI and 0.794 [0.741–0.846] with slight synergism for CI. The values are displayed in Table III.
The combinations GEM IC60-PTX IC60, GEM IC60-PTX IC40, and GEM IC40-PTX IC60 were the ones producing the lowest number of cells for JI. The combinations GEM IC60-PTX IC60, GEM IC60-PTX IC40, and GEM IC60-PTX IC20 produced the lowest number of cells for CI when the ψ was applied to the GEM IC50. The combinations GEM IC60-PTX IC60, GEM IC40-PTX IC60, and GEM IC20-PTX IC60 produced the lowest number of cells for CI when the ψ was applied to the PTX IC50.
The observed percentage of cells for GEM IC60-PTX IC60 was 24.0%; the predictions were around 23.6% for JI and 32.0% for CI. The values are reported in the heatmap (Fig. 4). This interaction was additive, because the differences between the data and additive surface were below zero with some positive values as reported in Table S III. The differences between the data and the theoretical percentages of cells are displayed in the same table. They were generally negative; thus, the interaction was probably slightly synergistic, close to additive.
Trifluoperazine-Gemcitabine-Paclitaxel Interaction
Equations 7 and 10 were used for the fittings. Figure 5 shows that for JI, there is antagonism, and for CI, there is synergism.
Fig. 5.
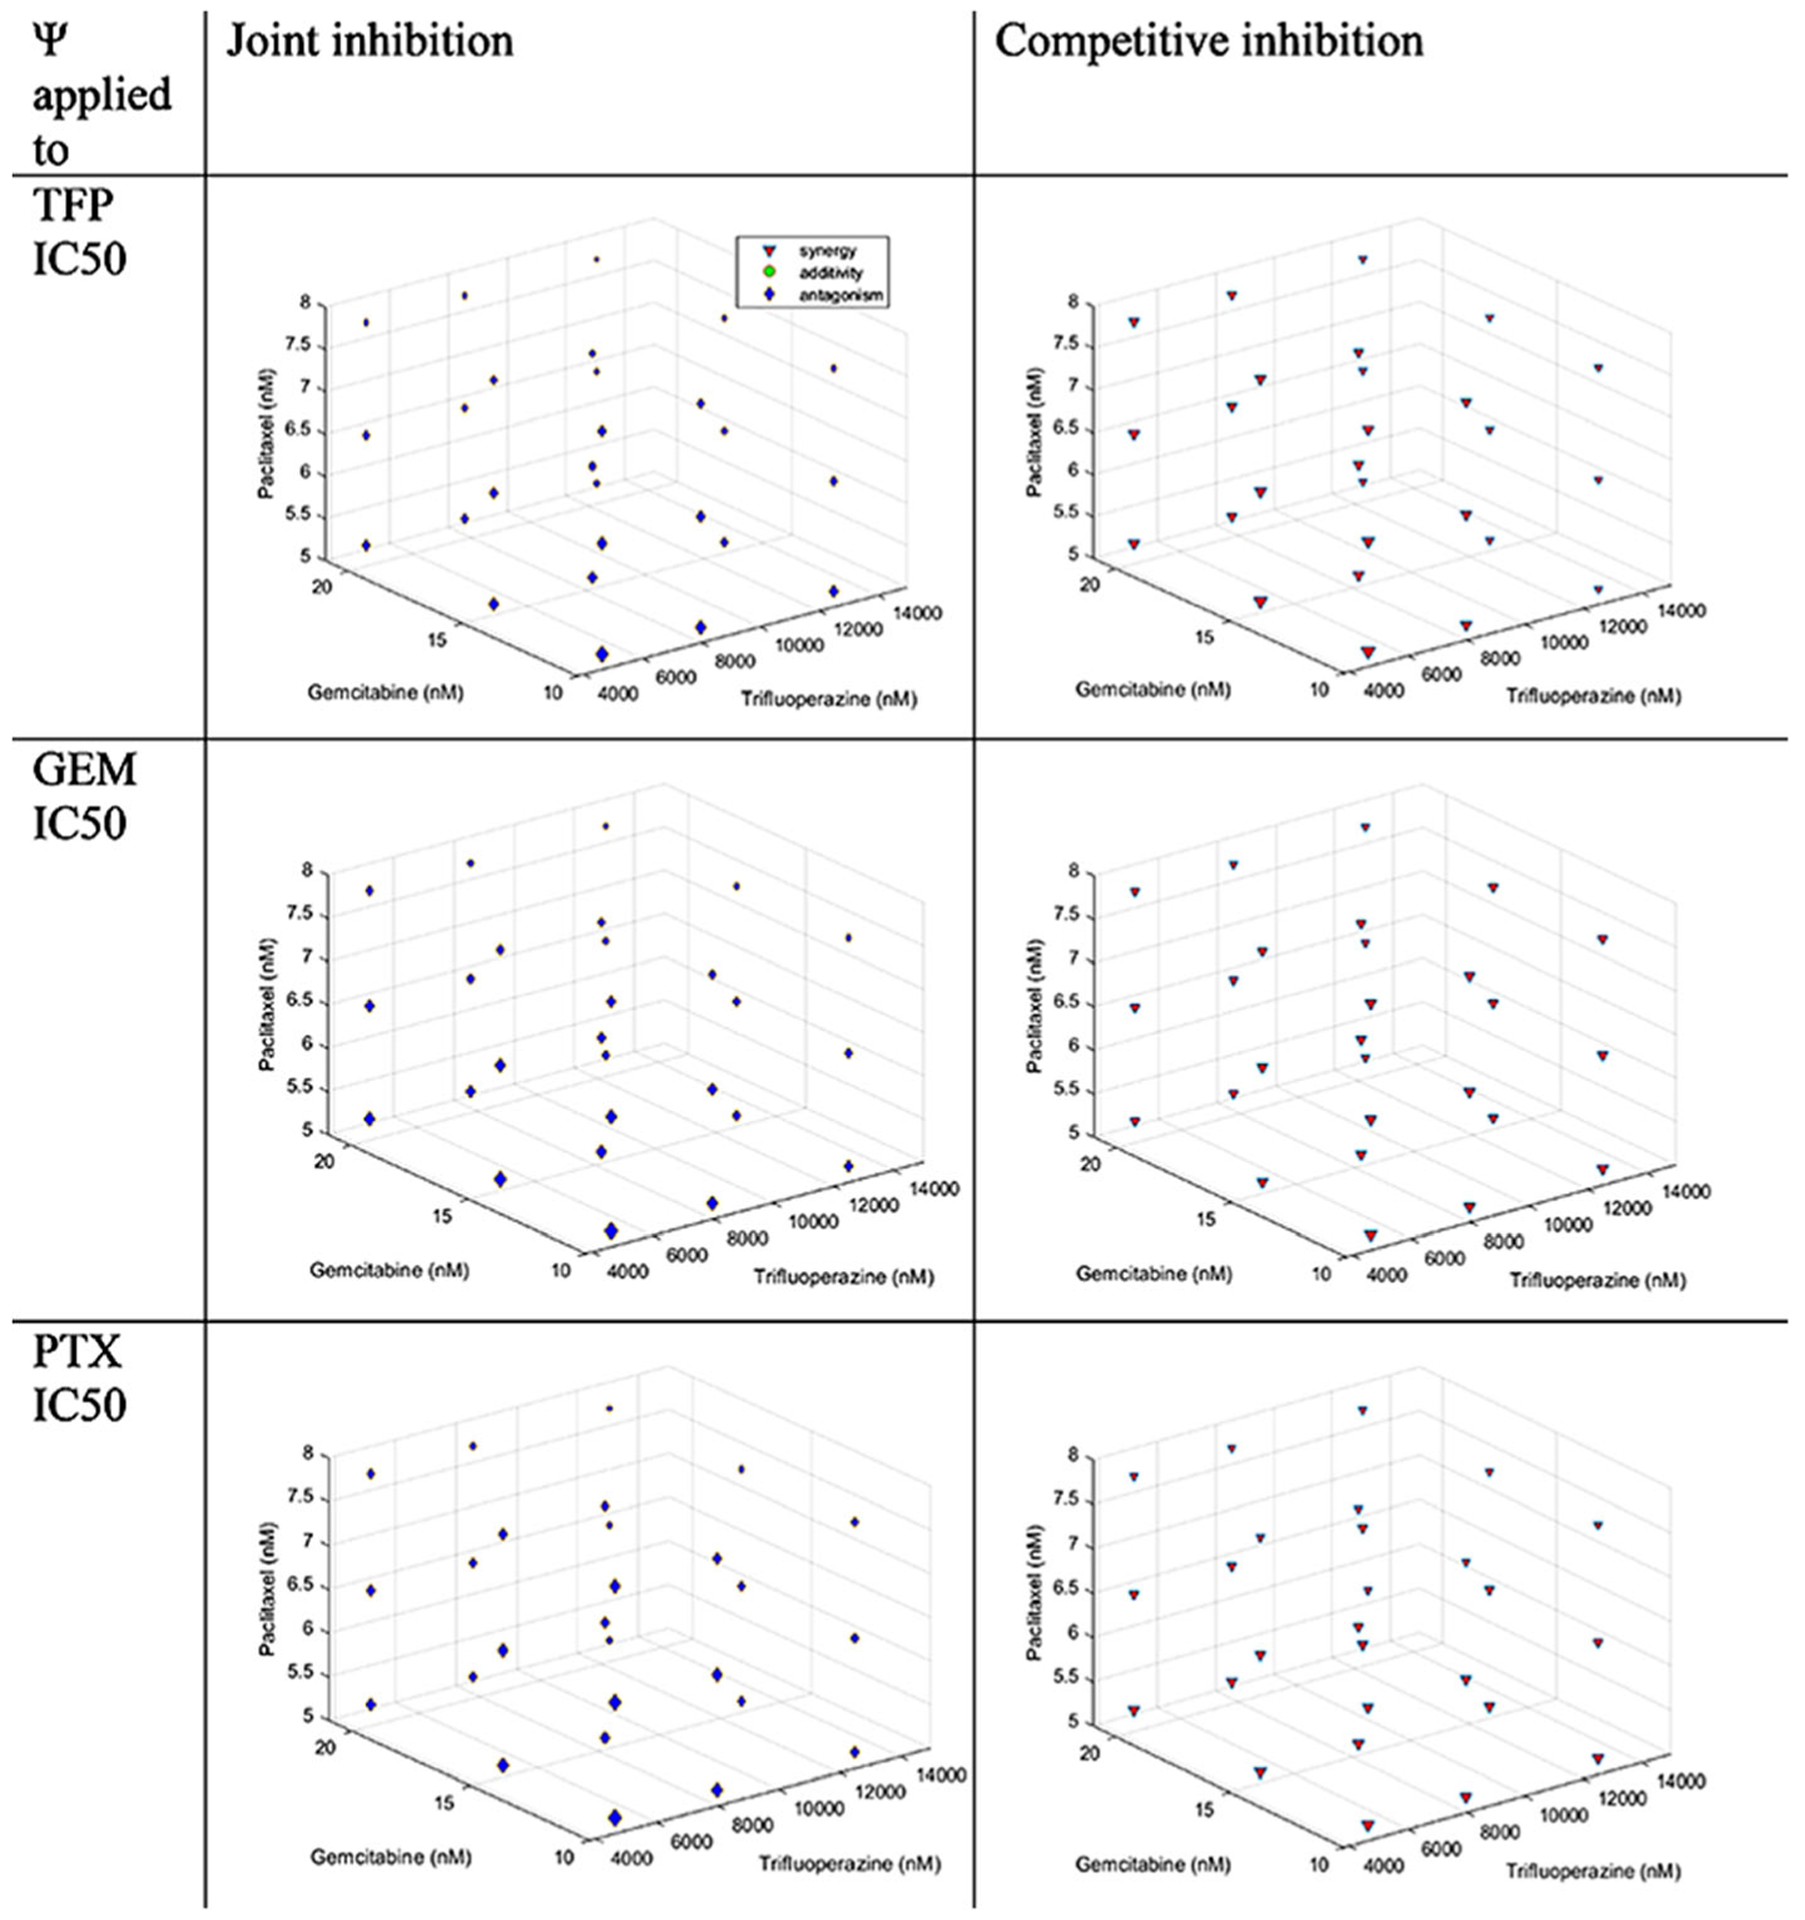
Concentration-effect graph for the interaction TFP-GEM-PTX for joint inhibition and competitive inhibition with ψ applied to TFP, GEM, and PTX IC50 values. Colors are defined in Fig. 2
To assess the effect of GEM and PTX on TFP, the ψ was applied to the TFP IC50. The values of ψ were 1.20 [1.15–1.25] showing antagonism for JI and 0.559 [0.539–0.579] with synergism for CI.
To assess the effect of TFP and PTX on GEM, the ψ was applied to the GEM IC50. The values of ψ were 1.60 [1.57–1.63] revealing antagonism for JI and 0.507 [0.498–0.515] with synergism for CI.
To assess the effect of TFP and GEM on PTX, the ψ was applied to the PTX IC50. The values of ψ were 1.23 [1.20–1.27] demonstrating antagonism for JI and 0.704 [0.686–0.723] with synergy for CI. The values are described in Table IV.
Table IV.
Parameter Estimates for the Interaction of Trifluoperazine and Gemcitabine and Paclitaxel
| ψ for TFP | ψ for GEM | ψ for PTX | ||||||||
|---|---|---|---|---|---|---|---|---|---|---|
| Estimates | 95% CI | CV (%) | Estimates | 95% CI | CV (%) | Estimates | 95% CI | CV (%) | ||
| R0 (%) | 100 | 97.7–102 | 1.13 | 100 | 99.2–101 | 0.388 | 100 | 97.3–103 | 1.35 | |
| Joint inhibition | ψ | 1.20 | 1.15–1.25 | 1.95 | 1.60 | 1.57–1.63 | 0.872 | 1.23 | 1.20–1.27 | 1.32 |
| Sigma | 0.0699 | 0.0594–0.0805 | 7.53 | 0.0257 | 0.0219–0.0296 | 7.51 | 0.0893 | 0.0758–0.103 | 7.55 | |
| Intercept | 0.001 | – | Fix | 0.001 | – | Fix | 0.001 | – | Fix | |
| Competitive inhibition | ψ | 0.559 | 0.539–0.579 | 1.81 | 0.507 | 0.498–0.515 | 0.825 | 0.704 | 0.686–0.723 | 1.34 |
| Sigma | 0.0865 | 0.0735–0.0996 | 7.55 | 0.0231 | 0.0196–0.0266 | 7.51 | 0.0703 | 0.0597–0.0809 | 7.53 | |
| Intercept | 0.001 | – | Fix | 0.001 | – | Fix | 0.001 | – | Fix | |
Not surprisingly, the combination TFP IC60-GEM IC60PTX IC60 produced the lowest number of cells. The observed percentage of cells for TFP IC60-GEM IC60-PTX IC60 was 17.6% and the predictions were 9.83% for JI and 17.9% for CI. The values were reported in the heatmap (Fig. 6).
Fig. 6.
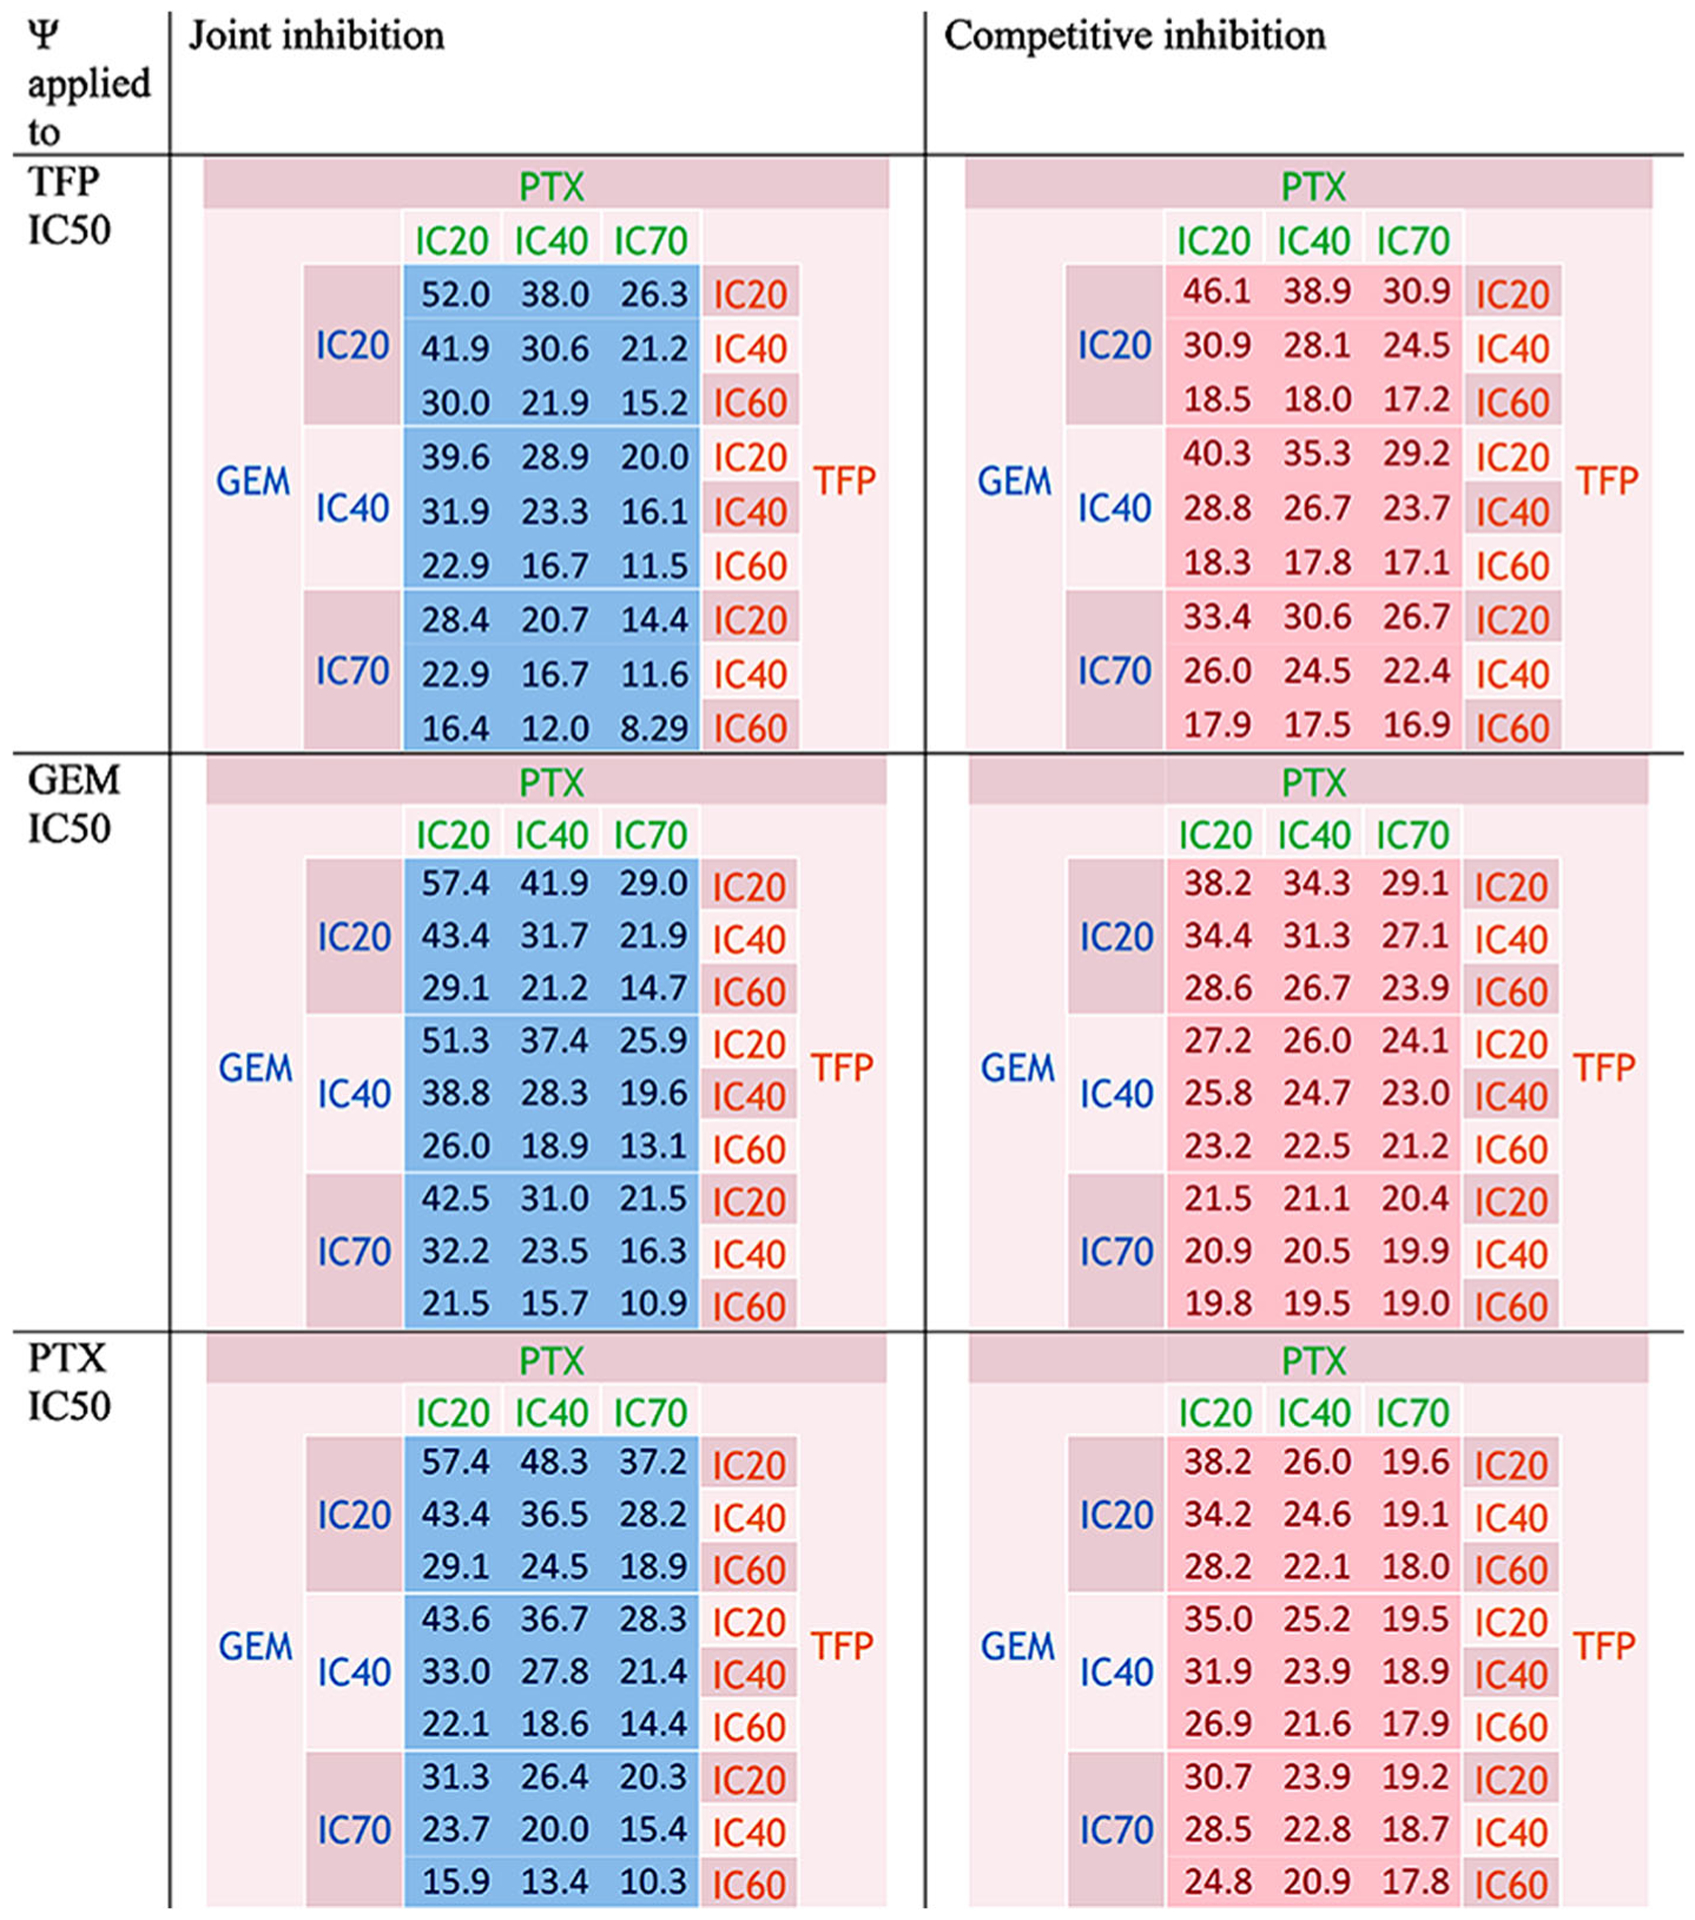
Predicted percentage of cells for the interaction TFP-GEM-PTX for joint inhibition and competitive inhibition with ψ applied to TFP, GEM, and PTX IC50 values. Colors are defined in Fig. 2
This interaction was antagonistic using JI and synergistic with CI because the differences in percentages of cells between the data and the additive surface were usually above 0 with JI and slightly negative for CI, as reported in TableS IV. In the same table, the differences between the data and the theoretical percentages of cells are displayed and oscillated between negative and positive values, generally displaying additivity. At the high concentrations of drugs, the differences were greater displaying more antagonism when high concentrations of one or several drugs were used.
DISCUSSION
Cell Lines and Combination Index Formulas
The cell line PANC-1 was used because this cell line has the highest proportion (7.57%) of side population cells compared to other pancreatic cancer cells: BxPc-3 (0.79%), CFPAC-1 (2.59%), MIA PaCa-2 (0.03%), and SW1990 (4.19%). The side population cells have the same characteristic of CSC (17).
Determination of IC50
The TFP IC50 was 9887 nM, i.e., 9.887 μM. In non-small cell lung cancer cell lines, the TFP IC50 was in the range 7.2 to 15 μM (see Table II in (9)). The IC50 was 6 μM in P388 murine leukemic cells and in their multidrug-resistant clone (18). Our value agrees with these literature results. However, peak plasma concentrations found in humans were about 3 μg/L for a dose of 5 mg of TFP (19). The 9887 nM corresponds to 4750 μg/L, i.e., more than one thousand times higher. Based on the affinity constant between TFP and albumin (KAlb = 3.3 × 10⁴ M−1 (20)) and alpha-1-acid glycoprotein (Kα1gp = 6.0 × 10⁵ M−1 (20)), the calculated fraction unbound is 2.80% in humans, leading to a TFP-free concentration of 0.0866 μg/L. Concentrations of 4.3 g/dL of albumin (MW of 65,000 Da) and 0.9 g/L for alpha-1-acid glycoprotein (MW of 42,000 Da) and one binding site for TFP was assumed for each protein.
In vitro, FBS contains 2.1 g/dL of albumin and 0.10 g/dL of alpha-1-acid glycoprotein. As 50 mL of FBS were added to the DMEM, these protein concentrations in the final DMEM were 1.91 and 0.09 g/L, leading to a calculated fraction unbound of 42.9% for a concentration of free TFP of 2036 μg/L.
While such high TFP concentrations are not feasible for patients, mouse studies with xenografts were conducted at a dose of 5 mg/kg/day equivalent to a human dose of 28 mg/day. The authors observed a smaller tumor size compared to the control and gefitinib, and also a sensitization to gefitinib-resistant lung cancer cells (9). While the comparison of TFP concentrations in vitro and in vivo is complex, these differences in doses offer a pharmacologic feasibility perspective. If TFP acts primarily on CSC with its own renewal and differentiation and must distribute into a tumor, then IC50 cannot be directly scaled.
The GEM IC50 was 17.4 nM. This is consistent with previous values for the same cell line (PANC-1), which was 20 nM for a basic PD model and 6 nM for a mechanism-based model (21). Another study found an IC50 of 17.9 nM for the PANC-1 cells (22). The Cmax of gemcitabine was about 30 μM in lung cancer patients after a dose of 1000 mg/m2 (23) or 24,500 μg/L (24), much higher than our IC50 of 17.4 nM, i.e., 5.21 μg/L. According to the FDA, the plasma protein binding is negligible (25), probably around 10% (26).
The PTX IC50 for eight human cancer cell lines ranged between 2.5 and 7.5 nM (27). This is close to our result of 7.08 nM. The Cmax of paclitaxel was 3.2 μM in lung cancer patients after a dose of 150 mg/m2 (23) or 7916 μg/L after a dose of 125 mg/m2 (28), much higher than our IC50 of 7.08 nM, i.e., 6.05 μg/L. According to the FDA, 89 to 98% of paclitaxel was bound from in vitro studies of binding to human serum proteins (29).
The estimates found for the drugs as single agents for two-drug and three-drug combinations, based on their IC20, IC40, and IC60 values, were similar to what was found with the concentration-response curves. Thus, these values were fixed during the fitting of JI and CI equations to assure that any interaction will be revealed from the model and ψ values.
Theoretical Percentages of Cells
The method using Eqs. (11) and (12) to calculate the theoretical percentages of cells can be used to assess the percentages of cells in the case of additive interactions. This method has the advantage of using only information from the fittings of the single agents.
Two-Drug Interactions
The confidence intervals of ψ were probably narrow due to the fact that the single-drug effects were very well captured with the Hill-type equations and were fixed afterwards; the baseline is close to 100%, leaving the ψ values very well estimated.
Trifluoperazine-Gemcitabine Interaction
In most cases, the combinations of TFP and GEM were synergistic, close to additive, according to the 3-D graphs. The use of JI and CI mechanisms led generally to the same conclusion. Moreover, TFP seemed to make GEM slightly more potent, as the ψ was below 1 (synergy) when it was applied to the GEM IC50. The effect of GEM on TFP seemed more additive. The possible anti-apoptotic activity or the effect of TFP on CSC combined with the effect of GEM can explain the observed additivity.
In a study on lung cancer cells, TFP induced increases in Bax, Bak, cleaved PARP, and caspases 3 and 9 and reductions in Bcl2, XIAP, and Mcl-1. Moreover, an effect on CSC was reported (9). The CSC subpopulation of cells features more infiltration, greater plasticity, high differentiation capacity, and self-renewal potential. This leads to an intratumoral heterogeneity and high tumorigenicity causing resistance to chemotherapy, recurrence, and clinical relapse (30–32). One clinical study evaluated the rate of recurrence during chemotherapy as 37%. The overall survival of patients without recurrence was estimated at 26.3 versus 9.3 months for patients with relapse (P < 0.001) (33). The authors observed a reduction of the number and volume of CSC tumor spheroids, a decline in CSC markers, especially CD44 and CD133, and a decrease in the ALDH+ subpopulation of CSC. Moreover, TFP decreased the targets of the Wnt/β-catenin pathway: cyclin D1, c-Myc, and c-Met (9). The CD133+ cells were involved in chemoresistance (31). According to different studies, ALDHhigh cells were associated with a poor overall survival and are tumorigenic (31,34–36). Moreover, CD44+ c-Methigh were described as highly metastatic (31) and c-Methigh had a capacity of self-renewal and a tumorigenic potential (35). CD44 as well as Epcam are involved in the Notch signaling pathway (35,36). CD44 as well as CD24 and Epcam are part of the sonic Hedghog pathway (31,35,37) and CD133 is part of the PI3K/AKT/mTOR pathway (35,36).
Because JI and CI results appeared similar in the boxplots (Supplemental Fig. S1), it was difficult to assess if the apparent synergy comes from the fact that they act on the same target (CI), i.e., due to the apoptotic effect of TFP or if they act on different targets (JI), in which case it is not possible to determine if the synergy was due to a direct anti-apoptotic effect or via anti-CSC effects of TFP.
Conatumumab and tigatuzumab targeting DR5 and cabozantinib targeting c-Met were or are currently in clinical trials for pancreatic cancer and seem to act on the ALDH+ and CD44+CD24+ cell populations for tigatuzumab and on cMethighCD44+ and CD44+CD24+ESA+ for cabozantinib (38,39). Cabozantinib was approved for renal and thyroid carcinomas. Conatumumab was abandoned but several studies are running for tigatuzumab. Thus, TFP seemed a good candidate to evaluate.
Trifluoperazine-Paclitaxel Interaction
As most of the ψ values were above but close to 1, the interaction TFP-PTX was antagonistic, close to additive. The use of JI and CI mechanisms led roughly to the same conclusion. Moreover, the effect of PTX on TFP seemed additive, and the effect of TFP on PTX appears antagonistic, because ψ was above 1.
Gemcitabine-Paclitaxel Interaction
The interaction GEM-PTX was additive, close to synergy. The equations do not lead to the same conclusions. The interactions were additive for JI. The interactions were synergistic for CI. The boxplots in Fig. S3 seemed less variable with JI; thus, the interaction was probably additive.
The combination GEM-PTX has been well studied. Additivity was found when the drugs were used simultaneously and when GEM was followed by PTX. The same study showed a synergistic effect on the growth inhibition of a breast cancer cell line if PTX was used during the first 24 h and GEM in the following 48 h. The range of concentrations was 0.1–29.3 nM for PTX and 3.34–3337 nM for GEM (5). These were similar to our concentrations. Likewise, in a combination study of GEM-PTX in non-small-cell lung cancer cells, more apoptotic cells were observed when PTX was given prior to GEM. A possible explanation can be the increase of dFdCTP (active form of GEM) and its increased incorporation into RNA. Deoxycytidine kinase levels and incorporation into DNA were not affected by PTX (40). Despite these positive effects, all the interactions were additive or antagonistic, as the range of combination index values was 1–2.6. The range of IC50 values was 5.6–88 nM for PTX and 4.3–25 nM for GEM, which were similar to our study. This was confirmed by the results from a clinical trial in non-small-cell lung cancer (NSCLC) patients. They found no pharmacokinetic interaction, but showed an increase in dFdCTP accumulation which improved the antitumor activity (23). This increase would be the consequence of the inhibition by PTX of cytidine deaminase, the enzyme responsible of the production of the inactive metabolites: dFdU, leading to an increase in the ratio dFdC/dFdU and an increase of dFdCTP in tumors. This inhibition is a PTX-induced ROS mechanism and can be overturned by N-acetylcysteine (41).The metabolic pathway of GEM is presented in Fig. S5.
However, other studies by the same authors reached different conclusions. Synergy was demonstrated between GEM-PTX in the same type of cancer (non-small-cell lung cancer cells) and PTX caused an increase in deoxycytidine kinase and cytidine deaminase activity despite a decrease in their mRNA and PTX decreased deoxycytidine kinase protein but did not affect cytidine deaminase protein (42), leading to a decrease in dFdU, but PTX did not affect significantly the intracellular accumulation of the triphosphate metabolite. The authors reported that above 20 μM of GEM a saturation of deoxycytidine kinase occurred (43) and also that PTX decreased the systemic clearance and volume of distribution of GEM (44).
Antagonism between these two drugs was found in a study where GEM and PTX were used simultaneously or sequentially in human lung A549, breast MCF7, and pancreas adenocarcinoma P-SW cell lines. The authors concluded that GEM antagonized the cell killing from PTX. At that time, they also urged caution for the clinical trials combining both drugs (45). Nevertheless, the combination GEM and nab-PTX extended patient survival. The protocol used in common practice is administration of 125 mg/m2 of nab-paclitaxel followed by 1000 mg/m2 of gemcitabine IVover 30–40 min on days 1, 8, and 15 of each 28-day cycle (46,47).
There are other possible reasons of the success of the combination GEM-PTX, beyond the increase in the active metabolite dFdCTP. Fragmentation of DNA was found with this drug combination in one study (5). It was possible that GEM and PTX acted on the same pathway among the Bax/Bcl2 apoptotic pathway and especially the Bcl-2-related mitochondrial apoptotic pathway, but perhaps on different targets since JI seemed better. In the treatment schedule where PTX was followed by GEM, there was an increase of the ratio Bax/Bcl2 (Bax is pro-apototic and Bcl2 is anti-apoptotic) (5). A potential reason for the additivity observed in vitro, but of the good efficacy in vivo of the combination GEM-PTX, may be the inhibitory effect of PTX on the pancreatic stellate cells (PSC), demonstrated in a model using a 3D culture (48).
At a ratio of 10/1, GEM/PTX was found synergistic in PANC-1 cells (combination index = 0.5). These values correspond to 8343 nM of GEM and 293 nM of PTX. It is important to note that the IC50 found with PANC-1 cells by the authors (GEM IC50 = 60,736 nM, PTX IC50 = 9369 nM) were much higher than our values (49).
Three-Drug Interactions
The interaction equations do not consistently lead to the same conclusions. The interaction TFP-GEM-PTX appeared to be antagonistic for JI and synergistic for CI. As the boxplots in Fig. S4 show less bias and are less variable for the CI, the interaction was probably more synergistic, close to additivity.
In one study, synergy was described between the oncolytic adenovirus AdNuPARmE1A that target the Notch signaling pathway, in combination with gemcitabine and nab-paclitaxel in xenograft and PDX models. TFP acts on the Notch pathway via its effect on cancer stem cell marker CD44. Moreover, the authors explained that gemcitabine and paclitaxel could act together via the activation of NF-κB and trapping of the NF-κB transcription factor in order to act as a decoy system, preventing the activation of pro-survival genes and promoting apoptosis. These mechanisms of action could explain the synergy observed between TFP, GEM, and PTX because it would be an interaction between the two pathways: Notch and NF-κB. However, this adenovirus was also synergistic with gemcitabine and nab-paclitaxel used as single agents contrary to our study that showed synergy, close to additivity, of TFP with GEM and antagonism for TFP-PTX (50).
In another study, the combination of GEM with a Notch inhibitor, PF-03084014 (a selective γ-secretase inhibitor) prevented the activation of Notch target genes, inhibited tumor cell proliferation, reduced angiogenesis, decreased the tumor-resident CSC, and induced apoptosis (51).
Moreover, the synergy, close to additivity, observed can be the consequence of an interaction on the Bax/Bcl2 apoptotic pathway because, as described above, in the treatment schedule where PTX was followed by GEM, the ratio of Bax/Bcl2 increased (5). TFP is also known to increase Bax and decrease Bcl2 (8,9).
To optimize any effects further, sequential treatments should be studied. One report showed that doxorubicin (4 h) followed by PTX (24 h) and then by 48 h washout before 24 h of GEM treatment achieved the maximum effect due to cell cycle perturbations (52).
Figure 5 provides a unique Bheat-spot^ method for presenting a four-dimensional relationship. The graph displays the three-drug concentrations used and the colors indicate the nature of the interactions that were found. It is very complicated designing interaction studies with three drugs and concise presentation of study results can be challenging.
Limitations
The determination of IC50 is subject to variation depending on the plates used and on delays between the seeding and the determination of IC50. These variations can also be due to the different methods used (MTT, sulforhodamine assay, Coulter counter) and may be the consequence of different methods of analysis (different software and equations).
The definitions and the assumptions for each interaction equation are different, but both worked well for this preliminary screening. They indicate the uncertainty of assuming simple relationships and interactions when data are limited and mechanisms are complicated. To have a better understanding of the type of interaction between these drugs and to correct any inconsistencies, a more mechanistic model is needed. Additional experiments assessing the cell cycle, apoptosis, and stem cells will provide more information for future models allowing more specificity where the interactions take place and the type of interactions (21,53).
We also assessed equations for uncompetitive and non-competitive mechanisms but they did not work. Our ψ estimates exhibited very narrow confidence intervals leaving little room or need for additional interaction terms. An extension of the Ariens et al.’s (12) competitive interaction model was recently proposed (54) with addition of several interaction terms for multiple drugs similar to our ψ term. Like our approach, it maybe useful for screening cell culture data prior to generating more mechanistic insights from additional measurements.
Due to the heterogeneity of CSC (31,36), it is possible that the use of one drug against one or several specific pathways will not be sufficient to affect all of the CSC; multiple drugs that are complementary to each other may be necessary.
This study was conducted in vitro and the nature of the interaction can change in vivo. For example, interaction between sorafenib and everolimus was found slightly antagonistic in cell cultures, but an in vivo study with mice showed a synergistic effect (55). Thus, in vivo xenograft experiments could confirm or disprove the degree and nature of the interactions. Use of 3-D cell cultures may offer reliability, because drug resistance found in vivo appeared also in 3-D cell culture for colon cancer HCT-116 cells (56,57). Moreover, a 3-D cell culture allows heterogeneity of cells combining PDAC (pancreatic ductal adenocarcinoma) and PSC. The PSC cells produce a dense extracellular matrix as well as enzymes; thus, stroma was created naturally and produced an environment closer to human tumors. The authors used methylcellulose to induce the formation of spheroids (58). These spheroids were supposed to have cancer stem-like properties. It would be interesting to study sequential treatments, as the gemcitabine-paclitaxel interaction is schedule-dependent (5).
CONCLUSIONS
The CI and JI interaction equations do not always agree, but use of ψ allows assessment of further interactions for two or three drugs. According to estimates of ψ, the combination of TFP-GEM was synergistic, close to additivity, and TFP-PTX was antagonistic. The interaction GEM-PTX was additive, and TFP-GEM-PTX was synergistic, close to additive. The TFP IC60-GEM IC60-PTX IC60 appeared as the best combination and also reduced the number of cells by 82.1–90.2%. These results indicate reasonable potential for therapeutic benefit for this three-drug combination. Assessing the impact of each drug on CSC, cell cycling and the apoptosis pathway is needed to confirm our assumptions and provide better understanding of mechanisms of action of this three-drug combination.
Supplementary Material
ACKNOWLEDGMENTS
This work was supported by Grant GM 24211 from the National Institutes of Health. We thank Dr. David D’Argenio for his help with ADAPT and Dr Gilbert Koch for advice on drug interaction modeling.
Footnotes
Graphs allowing rotation of Figures 2 to 5 can be found in the Supplementary Materials.
Electronic supplementary material The online version of this article (https://doi.org/10.1208/s12248–018-0235–4) contains supplementary material, which is available to authorized users
REFERENCES
- 1.Cancer.net. Pancreatic cancer: treatment options: ASCO (American Society of Clinical Oncology); [updated 12/2016; cited 2017 6/6]. Available from: http://www.cancer.net/cancer-types/pancreatic-cancer/treatment-options.
- 2.ANSM. Summary of product characteristics (Gemcitabine): Agence nationale de sécurité du médicament et des produits de santé; [updated 29/11/2013; cited 2017 16 june]. Available from: http://agence-prd.ansm.sante.fr/php/ecodex/rcp/R0233325.htm.
- 3.Cancer.gov. Combination of Nab-paclitaxel and gemcitabine improves survival in patients with metastatic pancreatic cancer: National Cancer Institute; [updated 15/11/13; cited 2017 07/06]. Available from: https://www.cancer.gov/types/pancreatic/re-search/nab-paclitaxel-gemcitabine.
- 4.EMA. Summary of product characteristics (Nab-paclitaxel): European Medicine Agency; [cited 2017 16 june]. Available from: http://www.ema.europa.eu/docs/en_GB/document_library/EPAR_-_Product_Information/human/000778/WC500020435.pdf.
- 5.Oliveras-Ferraros C, Vazquez-Martin A, Colomer R, De Llorens R, Brunet J, Menendez JA. Sequence-dependent synergism and antagonism between paclitaxel and gemcitabine in breast cancer cells: the importance of scheduling. Int J Oncol. 2008;32(1):113–20. [PubMed] [Google Scholar]
- 6.Shu CH, Yang WK, Shih YL, Kuo ML, Huang TS. Cell cycle G2/M arrest and activation of cyclin-dependent kinases associated with low-dose paclitaxel-induced sub-G1 apoptosis. Apoptosis. 1997;2(5):463–70. [DOI] [PubMed] [Google Scholar]
- 7.Polischouk AG, Holgersson A, Zong D, Stenerlöw B, Karlsson HL, Möller L, et al. The antipsychotic drug trifluoperazine inhibits DNA repair and sensitizes non-small cell lung carcinoma cells to DNA double-strand break–induced cell death. Mol Cancer Ther. 2007;6(8):2303–9. [DOI] [PubMed] [Google Scholar]
- 8.Yuan K, Yong S, Xu F, Zhou T, McDonald JM, Chen Y. Calmodulin antagonists promote TRA-8 therapy of resistant pancreatic cancer. Oncotarget. 2015;6(28):25308–19. [DOI] [PMC free article] [PubMed] [Google Scholar]
- 9.Yeh C-T, Wu ATH, Chang PMH, Chen K-Y, Yang C-N, Yang S-C, et al. Trifluoperazine, an antipsychotic agent, inhibits cancer stem cell growth and overcomes drug resistance of lung cancer. Am J Respir Crit Care Med. 2012;186(11):1180–8. [DOI] [PubMed] [Google Scholar]
- 10.Cheng H, Lin C-F, Shih J-H, Wu ACH, inventors; Acenda Pharma, Inc, assignee Phenothiazine derivatives and methods of use thereof. United States patent US 9695138B1; 2017/07/04. [Google Scholar]
- 11.Koch G, Schropp J, Jusko WJ. Assessment of non-linear combination effect terms for drug-drug interactions. J Pharmacokinet Pharmacodyn. 2016;43(5):461–79. [DOI] [PMC free article] [PubMed] [Google Scholar]
- 12.Ariens EJ, Van Rossum JM, Simonis AM. Affinity, intrinsic activity and drug interactions. Pharmacol Rev. 1957;9(2):218–36. [PubMed] [Google Scholar]
- 13.Earp J, Krzyzanski W, Chakraborty A, Zamacona MK, Jusko WJ. Assessment of drug interactions relevant to pharmacodynamic indirect response models. J Pharmacokinet Pharmacodyn. 2004;31(5):345–80. [DOI] [PubMed] [Google Scholar]
- 14.Chakraborty A, Jusko WJ. Pharmacodynamic interaction of recombinant human interleukin-10 and prednisolone using in vitro whole blood lymphocyte proliferation. J Pharm Sci. 2002;91(5):1334–42. [DOI] [PubMed] [Google Scholar]
- 15.D’Argenio DZ, Schumitzky A, Wang X. ADAPT 5 user’s guide: pharmacokinetic/pharmacodynamic systems analysis software. Los Angeles: Biomedical Simulations Resource; 2009. [Google Scholar]
- 16.Zhao L, Au JLS, Wientjes MG. Comparison of methods for evaluating drug-drug interaction. Front Biosci Elite Ed. 2010;2:241–9. [DOI] [PMC free article] [PubMed] [Google Scholar]
- 17.Yao J, Cai H-h, Wei J-s, An Y, Ji Z-l, Lu Z-p, et al. Side population in the pancreatic cancer cell lines SW1990 and CFPAC-1 is enriched with cancer stem-like cells. Oncol Rep. 2010;23(5):1375–82. [DOI] [PubMed] [Google Scholar]
- 18.Hait WN, Pierson NR. Comparison of the efficacy of a phenothiazine and a bisquinaldinium calmodulin antagonist against multidrug-resistant P388 cell lines. Cancer Res. 1990;50(4):1165–9. [PubMed] [Google Scholar]
- 19.Midha KK, Korchinski ED, Verbeeck RK, Roscoe RMH, Hawes EM, Cooper JK, et al. Kinetics of oral trifluoperazine disposition in man. Br J Clin Pharmacol. 1983;15(3):380–2. [DOI] [PMC free article] [PubMed] [Google Scholar]
- 20.Verbeeck RK, Cardinal J-A, Hill AG, Midha KK. Binding of phenothiazine neuroleptics to plasma proteins. Biochem Pharmacol. 1983;32(17):2565–70. [DOI] [PubMed] [Google Scholar]
- 21.Zhu X, Straubinger RM, Jusko WJ. Mechanism-based mathematical modeling of combined gemcitabine and birinapant in pancreatic cancer cells. J Pharmacokinet Pharmacodyn. 2015;42(5):477–96. [DOI] [PMC free article] [PubMed] [Google Scholar]
- 22.Avan A, Crea F, Paolicchi E, Funel N, Galvani E, Marquez VE, et al. Molecular mechanisms involved in the synergistic interaction of the EZH2 inhibitor 3-deazaneplanocin A with gemcitabine in pancreatic cancer cells. Mol Cancer Ther. 2012;11(8):1735–46. [DOI] [PMC free article] [PubMed] [Google Scholar]
- 23.Kroep JR, Giaccone G, Voorn DA, Smit EF, Beijnen JH, Rosing H, et al. Gemcitabine and paclitaxel: pharmacokinetic and pharmacodynamic interactions in patients with non-small-cell lung cancer. J Clin Oncol. 1999;17(7):2190–7. [DOI] [PubMed] [Google Scholar]
- 24.Yilmaz B, Kadioglu YY, Aksoy Y. Investigation of the pharmacokinetics of gemcitabine and 2′,2′-difluorodeoxyuridine in human plasma by liquid chromatography. Anal Biochem. 2004;332(2):234–7. [DOI] [PubMed] [Google Scholar]
- 25.Administration FaD. Gemcitabine injection [updated 8/2017 cited 201710/23]. Available from: https://www.accessdata.fda.gov/drugsatfda_docs/label/2017/209604s000lbl.pdf. [Google Scholar]
- 26.Esumi Y, Mitsugi K, Seki H, Takao A, Kawai M. Placental transfer, lacteal transfer and plasma protein binding of gemcitabine. Xenobiotica. 1994;24(10):957–64. [DOI] [PubMed] [Google Scholar]
- 27.Liebmann JE, Cook JA, Lipschultz C, Teague D, Fisher J, Mitchell JB. Cytotoxic studies of paclitaxel (Taxol®) in human tumour cell lines. Br J Cancer. 1993;68(6):1104–9. [DOI] [PMC free article] [PubMed] [Google Scholar]
- 28.Administration FaD. Clinical pharmacology and biopharmaceutics review 2004. [updated 2004; cited 2017 10/23]. Available from: https://www.accessdata.fda.gov/drugsatfda_docs/nda/2005/21660_ABRAXANE_biopharmr.PDF.
- 29.Administration FaD. ABRAXANE for injectable suspension (paclitaxel protein-bound particles for injectable suspension) (albumin-bound) [updated 01/07/2005; cited 2017 10/23]. Available from: https://www.accessdata.fda.gov/drugsatfda_docs/label/2005/021660lbl.pdf.
- 30.Skoda J, Hermanova M, Loja T, Nemec P, Neradil J, Karasek P, et al. Co-expression of cancer stem cell markers corresponds to a pro-tumorigenic expression profile in pancreatic adenocarcinoma. PLoS One. 2016;11(7):1–18. [DOI] [PMC free article] [PubMed] [Google Scholar]
- 31.Penchev VR, Rasheed ZA, Maitra A, Matsui W. Heterogeneity and targeting of pancreatic cancer stem cells. Clin Cancer Res. 2012;18(16):4277–84. [DOI] [PMC free article] [PubMed] [Google Scholar]
- 32.Lee G, Hall RR, Ahmed AU. Cancer stem cells: cellular plasticity, niche, and its clinical relevance. J Stem Cell Res Ther. 2016;06(10):1–20. [DOI] [PMC free article] [PubMed] [Google Scholar]
- 33.Breidert M, Keck T, Makowiec F, Lohrmann C, Harder J, Fischer R. Early recurrence of pancreatic cancer after resection and during adjuvant chemotherapy. Saudi J Gastroenterol. 2012;18(2):118–21. [DOI] [PMC free article] [PubMed] [Google Scholar]
- 34.Lonardo E, Cioffi M, Sancho P, Crusz S, Heeschen C. Studying pancreatic cancer stem cell characteristics for developing dew treatment strategies. J Vis Exp. 2015;100:1–9. [DOI] [PMC free article] [PubMed] [Google Scholar]
- 35.Vaz AP, Ponnusamy MP, Seshacharyulu P, Batra SK. A concise review on the current understanding of pancreatic cancer stem cells. J Cancer Stem Cell Res. 2014;2(4):1–12. [DOI] [PMC free article] [PubMed] [Google Scholar]
- 36.Rao CV, Mohammed A. New insights into pancreatic cancer stem cells. World J Stem Cells. 2015;7(3):547–55. [DOI] [PMC free article] [PubMed] [Google Scholar]
- 37.Zhu Y-Y, Yuan Z. Pancreatic cancer stem cells. Am J Cancer Res. 2015;5(3):894–906. [PMC free article] [PubMed] [Google Scholar]
- 38.Rajeshkumar NV, Rasheed ZA, Garcia-Garcia E, Lopez-Rios F, Fujiwara K, Matsui WH, et al. A combination of DR5 agonistic monoclonal antibody with gemcitabine targets pancreatic cancer stem cells and results in long-term disease control in human pancreatic cancer model. Mol Cancer Ther. 2010;9(9):2582–92. [DOI] [PMC free article] [PubMed] [Google Scholar]
- 39.Li C, Wu JJ, Hynes M, Dosch J, Sarkar B, Welling TH, et al. c-Met is a marker of pancreatic cancer stem cells and therapeutic target. Gastroenterology. 2011;141(6):2218–27. e5 [DOI] [PubMed] [Google Scholar]
- 40.Kroep J, Giaccone G, Tolis C, Voorn D, Loves W, Van Groeningen C, et al. Sequence dependent effect of paclitaxel on gemcitabine metabolism in relation to cell cycle and cytotoxicity in non-small-cell lung cancer cell lines. Br J Cancer. 2000;83(8):1069–76. [DOI] [PMC free article] [PubMed] [Google Scholar]
- 41.Frese KK, Neesse A, Cook N, Bapiro TE, Lolkema MP, Jodrell DI, et al. nab-Paclitaxel potentiates gemcitabine activity by reducing cytidine deaminase levels in a mouse model of pancreatic cancer. Cancer Discov. 2012;2(3):260–9. [DOI] [PMC free article] [PubMed] [Google Scholar]
- 42.Shord SS, Patel SR. Paclitaxel alters the expression and specific activity of deoxycytidine kinase and cytidine deaminase in non-small cell lung cancer cell lines. J Exp Clin Cancer Res. 2009;28:76. [DOI] [PMC free article] [PubMed] [Google Scholar]
- 43.Shord SS, Camp JR, Young L. Paclitaxel decreases the accumulation of gemcitabine and its metabolites in human leukemia cells and primary cell cultures. Anticancer Res. 2005;25(6B):4165–72. [PubMed] [Google Scholar]
- 44.Shord SS, Faucette SR, Gillenwater HH, Pescatore SL, Hawke RL, Socinski MA, et al. Gemcitabine pharmacokinetics and interaction with paclitaxel in patients with advanced non-small-cell lung cancer. Cancer Chemother Pharmacol. 2003;51(4):328–36. [DOI] [PubMed] [Google Scholar]
- 45.Theodossiou C, Cook JA, Fisher J, Teague D, Liebmann JE, Russo A, et al. Interaction of gemcitabine with paclitaxel and cisplatin in human tumor cell lines. Int J Oncol. 1998;12(4):825–32. [DOI] [PubMed] [Google Scholar]
- 46.Porter C, Waddell JA, Solimando JD. Cancer chemotherapy update: nab-paclitaxel plus gemcitabine regimen for pancreatic cancer. Hosp Pharm. 2014;49(1):18–22. [DOI] [PMC free article] [PubMed] [Google Scholar]
- 47.Von Hoff DD, Ervin T, Arena FP, Chiorean EG, Infante J, Moore M, et al. Increased survival in pancreatic cancer with nab-paclitaxel plus gemcitabine. N Engl J Med. 2013;369(18):1691–703. [DOI] [PMC free article] [PubMed] [Google Scholar]
- 48.Lee JH, Kim SK, Khawar IA, Jeong SY, Chung S, Kuh HJ. Microfluidic co-culture of pancreatic tumor spheroids with stellate cells as a novel 3D model for investigation of stroma-mediated cell motility and drug resistance. J Exp Clin Cancer Res. 2018;37(1):4. [DOI] [PMC free article] [PubMed] [Google Scholar]
- 49.Meng H, Wang M, Liu H, Liu X, Situ A, Wu B, et al. Use of a lipid-coated mesoporous silica nanoparticle platform for synergistic gemcitabine and paclitaxel delivery to human pancreatic cancer in mice. ACS Nano. 2015;9(4):3540–57. [DOI] [PMC free article] [PubMed] [Google Scholar]
- 50.Mato-Berciano A, Raimondi G, Maliandi MV, Alemany R, Montoliu L, Fillat C. A NOTCH-sensitive uPAR-regulated oncolytic adenovirus effectively suppresses pancreatic tumor growth and triggers synergistic anticancer effects with gemcitabine and nab-paclitaxel. Oncotarget. 2017;8(14):22700–15. [DOI] [PMC free article] [PubMed] [Google Scholar]
- 51.Yabuuchi S, Pai SG, Campbell NR, de Wilde RF, De Oliveira E, Korangath P, et al. Notch signaling pathway targeted therapy suppresses tumor progression and metastatic spread in pancreatic cancer. Cancer Lett. 2013;335(1):41–51. [DOI] [PMC free article] [PubMed] [Google Scholar]
- 52.Zoli W, Ricotti L, Barzanti F, Dal Susino M, Frassineti GL, Milandri C, et al. Schedule-dependent interaction of doxorubicin, paclitaxel and gemcitabine in human breast cancer cell lines. Int J Cancer. 1999;80(3):413–6. [DOI] [PubMed] [Google Scholar]
- 53.Miao X, Koch G, Straubinger RM, Jusko WJ. Pharmacodynamic modeling of combined chemotherapeutic effects predicts synergistic activity of gemcitabine and trabectedin in pancreatic cancer cells. Cancer Chemother Pharmacol. 2016;77(1):181–93. [DOI] [PMC free article] [PubMed] [Google Scholar]
- 54.Wicha SG, Chen C, Clewe O, Simonsson USH. A general pharmacodynamic interaction model identifies perpetrators and victims in drug interactions. Nat Commun. 2017;8(1):2129. [DOI] [PMC free article] [PubMed] [Google Scholar]
- 55.Pawaskar DK, Straubinger RM, Fetterly GJ, Hylander BH, Repasky EA, Ma WW, Jusko WJ. Synergistic interactions between sorafenib and everolimus in pancreatic cancer xenografts in mice. Cancer Chemother Pharmacol. 2013;71(5):1231–40. [DOI] [PMC free article] [PubMed] [Google Scholar]
- 56.Karlsson H, Fryknas M, Larsson R, Nygren P. Loss of cancer drug activity in colon cancer HCT-116 cells during spheroid formation in a new 3-D spheroid cell culture system. Exp Cell Res. 2012;318(13):1577–85. [DOI] [PubMed] [Google Scholar]
- 57.Temraz S, Mukherji D, Alameddine R, Shamseddine A. Methods of overcoming treatment resistance in colorectal cancer. Crit Rev Oncol Hematol. 2014;89(2):217–30. [DOI] [PubMed] [Google Scholar]
- 58.Ware MJ, Keshishian V, Law JJ, Ho JC, Favela CA, Rees P, et al. Generation of an in vitro 3D PDAC stroma rich spheroid model. Biomaterials. 2016;108:129–42. [DOI] [PMC free article] [PubMed] [Google Scholar]
Associated Data
This section collects any data citations, data availability statements, or supplementary materials included in this article.