
Figure 8.
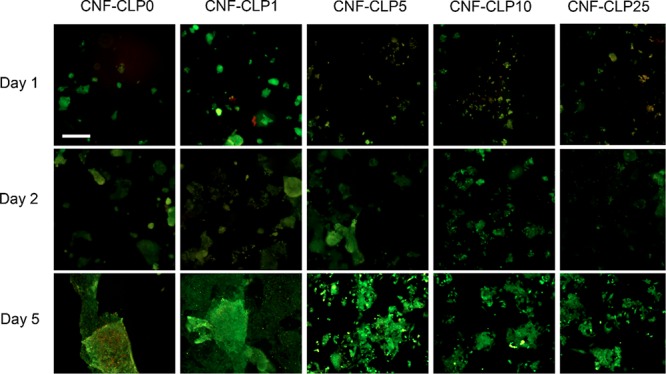
Fluorescence microscopy images of HepG2 cells, seeded on the formulated scaffolds, after 1 day, 2 days, and 5 days of incubation, with increasing relative concentrations of lignin to dry CNF (from 0 to 25%). Scale bar, 100 μm.
Official websites use .gov
A
.gov website belongs to an official
government organization in the United States.
Secure .gov websites use HTTPS
A lock (
) or https:// means you've safely
connected to the .gov website. Share sensitive
information only on official, secure websites.
Fluorescence microscopy images of HepG2 cells, seeded on the formulated scaffolds, after 1 day, 2 days, and 5 days of incubation, with increasing relative concentrations of lignin to dry CNF (from 0 to 25%). Scale bar, 100 μm.