

Abstract
Background:
The femoral-sided anatomic footprint of the anterior cruciate ligament (ACL) has been widely studied during the past decades. Nonanatomic placement is an important cause of ACL reconstruction (ACLR) failure.
Purpose:
To describe femoral tunnel placement in ACLR through use of a comprehensive 3-dimensional (3D) cylindrical coordinate system combining both the traditional clockface technique and the quadrant method. Our objective was to validate this technique and evaluate its reproducibility.
Study Design:
Descriptive laboratory study.
Methods:
The EOS Imaging System was used to make 3D models of the knee for 37 patients who had undergone ACLR. We designed an automated cylindrical reference software program individualized to the distal femoral morphology of each patient. Cylinder parameters were collected from 2 observers’ series of 3D models. Each independent observer also manually measured the corresponding parameters using a lateral view of the 3D contours and a 2-dimensional stereoradiographic image for the corresponding patient.
Results:
The average cylinder produced from the first observer’s EOS 3D models had a 30.0° orientation (95% CI, 28.4°-31.5°), 40.4 mm length (95% CI, 39.3-41.4 mm), and 19.3 mm diameter (95% CI, 18.6-20.0 mm). For the second observer, these measurements were 29.7° (95% CI, 28.1°-31.3°), 40.7 mm (95% CI, 39.7-41.8 mm), and 19.7 mm (95% CI, 18.8-20.6 mm), respectively. Our method showed moderate intertest intraclass correlation among all 3 measuring techniques for both length (r = 0.68) and diameter (r = 0.63) but poor correlation for orientation (r = 0.44). In terms of interobserver reproducibility of the automated EOS 3D method, similar results were obtained: moderate to excellent correlations for length (r = 0.95; P < .001) and diameter (r = 0.66; P < .001) but poor correlation for orientation (r = 0.29; P < .08). With this reference system, we were able to describe the placement of each individual femoral tunnel aperture, averaging a difference of less than 10 mm from the historical anatomic description by Bernard et al.
Conclusion:
This novel 3D cylindrical coordinate system using biplanar, stereoradiographic, low-irradiation imaging showed a precision comparable with standard manual measurements for ACLR femoral tunnel placement. Our results also suggest that automated cylinders issued from EOS 3D models show adequate accuracy and reproducibility.
Clinical Relevance:
This technique will open multiple possibilities in ACLR femoral tunnel placement in terms of preoperative planning, postoperative feedback, and even intraoperative guidance with augmented reality.
Keywords: knee, ACL, 3D modeling, stereoradiographic imaging
The anterior cruciate ligament (ACL) is an important stabilizer of the knee and is frequently injured. Epidemiologic studies demonstrate that around 400,000 ACL reconstructions (ACLR) are performed each year worldwide.30
Malpositioning of the femoral tunnel has been identified as the most common technical cause of ACLR failure, with misplacement seen in 80% of revision surgeries.1,25,26 Common errors can lead to a vertical graft, instability, and impingement at the intercondylar notch. Furthermore, anterior placement of the femoral tunnel can lead to restriction and tightness of the graft in knee flexion. An additional anteromedial portal has been preferred over the transtibial technique for its trend toward anatomic placement, better resisting anterior tibial translation and rotational forces.9,17,27
Of the many available techniques for tunnel positioning in ACLR, the clockface system is still used even after concerns were reported regarding its interobserver reliability.10,21 Indeed, the use of a 2-dimensional reference in a 3-dimensional (3D) volume limits the applicability of the clockface technique. The Bernard and Hertel quadrant method has been widely used and standardized since its initial description,2,12,28 however, in the sagittal plane, the grid coordinates are impossible to apply directly during a knee arthroscopy without additional fluoroscopy.15,18 Encouraging developments include descriptions of new anatomic landmarks for guiding arthroscopic tunnel placement, such as the lateral intercondylar ridge, bifurcate ridge, and apex of the deep cartilage, and efforts have been made to prove their reproducibility.11,30 Newer computer-assisted surgery techniques, either for navigation or for active robotic surgery, still make use of the quadrant method, a two-dimensional method.3,22,29 Globally, few 3D descriptions of femoral tunnel positioning have been proposed since the quadrant method in 1997.
The EOS Imaging System, introduced commercially in 2007, is now being studied for a variety of orthopaedic conditions, especially in spine surgery. This technology captures biplanar radiographic images of the patient in an upright, physiologic position with a true 1:1 scale for both size and volume. Based on work on particle detection by Nobel prize–winning physicist Georges Charpak, this imaging system emits lower doses of radiation than conventional radiography14 (Figure 1). From these simultaneous orthogonal views, the generation of a skeletal 3D model is simplified. Our group previously compared reconstructions using EOS and CT scanning; models from the biplanar stereoradiographic images were efficient and precise, with good interrater and intrarater reproducibility. At the femur, we obtained a mean error of 1.0 mm (95% CI, 1.0-1.1 mm) for the surface analysis between EOS models compared with CT reconstructions when using oblique projections. With the same projections, an intertechnician reproducibility study of EOS reconstructions found an absolute difference of 1.2 mm (95% CI, 0.8-1.5 mm) (J. Montreuil et al, unpublished data, November 2019).
Figure 1.

EOS Imaging System.
In the current study, we describe femoral tunnel placement in ACLR using a new, comprehensive, 3D cylindrical reference that combines the benefits of both the traditional clockface technique and the quadrant method. Our objective was to validate this technique and evaluate its reproducibility. Considering other 3D studies, we expected that this cylindrical template will correspond to the Bernard and Hertel grid within 5 mm in length in the deep-shallow axis and 2 mm in diameter for the mediolateral and high-low axes.9,22 Furthermore, we hypothesized that this method will aid in evaluating postoperative tunnel positioning. We compared actual femoral tunnel aperture position to a described target that is within the range of the known anatomic 5th and 95th percentiles.28 In the deep-shallow axis, this corresponds to 24% and 37%, respectively, whereas for the high-low axis, the values correspond to 28% and 43%, respectively.28 We believe that this method will allow for preoperative planning, intraoperative guidance, and postoperative feedback on femoral tunnel placement in ACLR.
Methods
Patients
A total of 37 patients were selected from a cohort (Prospective Collection of Clinical and Radiological Data in Knee Patients) at the Centre Hospitalier de l’Université de Montréal in accordance with the ethics committee of that institution. Radiological data were collected for 25 men and 12 women (21 right knees and 16 left knees operated) with a mean ± SD age of 31.8 ± 3.0 years. The patients underwent surgery between the years 2008 and 2011 by the same surgeon (F.L.) using a homogeneous technique that entailed the following: hamstring graft, single-bundle, constant graft sizing method, anteromedial femoral portal drilling, “in and out” technique, and Endobutton femoral fixation. The research protocol included preoperative EOS (EOS Imaging) biplanar image acquisition of the lower limbs with anteroposterior-lateral and oblique (45°-45°) views. At 6 months after surgery, a second set of biplanar orthogonal radiographic images was recorded using the same parameters as preoperatively.
3D Models Including Tunnels
The pre- and postoperative pairs of orthogonal radiographs were processed through use of IdeFX software (LIO) to regenerate the generic 3D models of the femur and tibia so they were personalized to each patient. As proposed by our previous study (J. Montreuil et al, unpublished data, November 2019), we used the oblique views to create these models because this process facilitated identification of anatomic landmarks while minimizing superposition. Each generic 3D model was modified and regenerated to match each patient's morphology as accurately as possible. This was based on the moving least squares optimization method, which was followed until the projected contours on 2 radiographic planes matched the boundaries of the bones on orthogonal radiographs.6,35 Then, the femoral and tibial tunnels were identified on the postoperative acquisitions. To represent these tunnels, an adjustable truncated cone was designed because the lateral portion of the tunnel was more narrow due to integration and ossification at the time of the postoperative EOS acquisition. This conical shape was added to the IdeFX software and was fitted manually during evaluation by one of 2 resident doctors (observer 1, J.M.; observer 2, J.S.), who were blinded to any information about the patients. Another set of EOS 3D models was assessed to verify the interrater reproducibility of the entire process. This regeneration sequence took less than 10 minutes per model, as underlined in our first validation study (J. Montreuil et al, unpublished data, November 2019). A total of 74 postoperative 3D models with tunnels were obtained (Figure 2).
Figure 2.

EOS 3-dimensional (3D) modeling method.
Cylindrical Reference Conception
For the purpose of this study, arthroscopic terms are used to describe the method (Figure 3). A cylindrical description of the femoral tunnel position in the intercondylar notch allows the combination of 2 known techniques, the clockface method and the Bernard and Hertel quadrant method, in a unique 3D fashion. We defined this cylindrical coordinate system with a standard 3-axis system (X, Y, Z). Starting from the origin, a radius (X), an angle (θ), and a depth (Z) coordinate allow for the description of any point on the cylinder (Figure 4). Even if the radius is used in the cylinder coordinate system, the diameter is used as a validation parameter because it respects the initial quadrant method. Measured directly from Blumensaat's line to the posterior condyles, it allows a better comparison between measurements techniques. With this reference being fitted and fixed in the intercondylar notch, the radius and the angle could be given in a similar fashion to the clockface technique. The X-axis (angle θ) would be parallel to the posterior condyle line with the diameter individualized and representing high-low and mediolateral limits of the cylinder. The deep-shallow coordinate, along the long axis of the cylinder, would reproduce the quadrant method.
Figure 3.

Lateral view of distal femur with knee arthroscopy terminology compared to usual references (anterior-posterior).
Figure 4.

Cylindrical coordinate system. Cynlindrical reference: from the origin, a radius (R), an angle (θ), and a depth (Z) coordinate allow for the description of any point on the cylinder.
Cylindrical Reference Fixation
After deciding on the components of the coordinate system, we proceeded with fixation of the reference within boundaries. The 3D models issued from EOS Imaging in IdeFX software had predefined regions that included the intercondylar notch. Thus, notch surface mapping of every individual model (Figure 5) allowed for the creation of an automatic and personalized fitted cylinder for every patient. The diameter and orientation were obtained by minimizing the distance between homologous points on a generic cylinder against the intercondylar notch. In the sagittal plane, in concordance with the initial quadrant method description, this technique oriented the cylinder as parallel as possible to the roof of the intercondylar notch corresponding to the Blumensaat line. It also defined the higher and lower borders of the cylindrical coordinate system. The anterior and posterior edges of the lateral femoral condyle served as borders to extend the Z-axis in the same way as Bernard et al2 described the deep and shallow parameters. The origin of the Z-axis was placed at the posterior outlet of the notch at the deepest coordinate. Because the ACL is located deep in the notch, extrapolation from a shallow origin would lead to certain imprecisions.8
Figure 5.

Intercondylar notch surface mapping with EOS Imaging System.
The 3D models issued from EOS also provided known metrics such as the bicondylar axis and the posterior condyle line. When the cylinders were viewed from a frontal plane, the X-axis of the cylindrical reference was defined as parallel to the posterior condyle line. The Y-axis was therefore at 90° and centered on the highest point of the notch (Figure 6). As previously stated, the diameter was individualized and was indicated by the high-low and mediolateral limits of the cylinder. These origins and boundaries of the cylinder were computed, and 37 cylinders were automatically created for the postoperative models of both observers. All computations of the proposed methods were performed with MatLab software (The MathWorks) in addition to the standard functions using IdeFX.
Figure 6.

Automated tridimensional cylinder reference system fitted in the intercondylar notch on (A) frontal and (B) sagittal views.
Cylindrical Reference Validation
To validate this automated EOS 3D technique, the orientation, length, and diameter of the 74 cylinders were extracted and compared with 2 other measurement techniques: manual 3D measurement (manual EOS) and manual radiographic (manual XR). As well, we executed an intertest reliability study between the 3 measurement techniques. With respect to the manual EOS measures, the projected contours of the 3D models from a perfectly lateral view were obtained. These manipulations allowed for a clear identification of the intercondylar notch roof corresponding to the Blumensaat line as seen on a true lateral stereoradiographic image. Using this stereoradiographic image, the manual XR measurements were performed with the quadrant method.2 As discussed further, any small malrotation on biplanar radiographs could not be adjusted from the initial image acquisition.
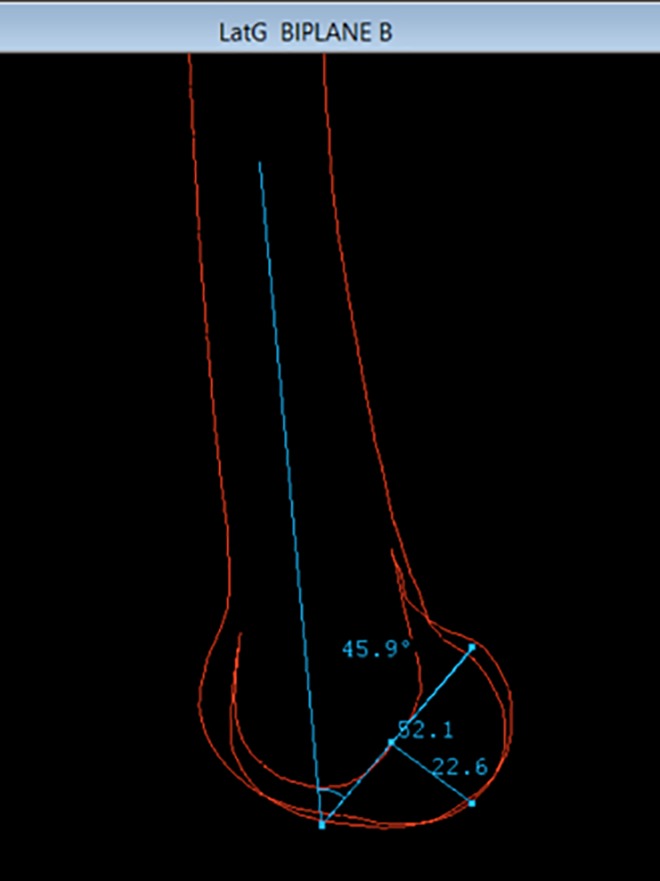
The length and diameter were first compared among the automated EOS, manual EOS, and manual XR measures. In the sagittal plane, the cylinder length was measured from the anterior to posterior edges of the lateral femoral condyle along the Blumensaat line. The diameter of the cylinder was measured at the lowest aspect of the lateral femoral condyle, at 90° from the long axis of the cylinder. Finally, the cylinder’s orientation was calculated as the angle between the distal femoral anatomic axis and the cylinder’s Z-axis on a lateral view. This same angle was manually measured on every 3D contour (Figure 7) and on the corresponding lateral stereoradiographic image (Figure 8).
Figure 7.
Manual validation measurements on 3-dimensional contours.
Figure 8.

Manual validation measurements on lateral stereoradiographic image with femoral condyles spacing suggesting suboptimal rotation.
Statistical Analysis
A minimum sample size of 21 patients per group for this study was calculated with an α of 5%, a β of 10%, and the anticipated differences in length and diameter previously stated. Estimates for intraclass correlation coefficients (ICCs) and their 95% CIs among the 3 measurement techniques were calculated by use of SPSS (Version 25; IBM Corp) based on a mean-rating (k = 3), absolute-agreement, 2-way mixed-effects model. The same software was used to perform paired t tests with Pearson correlation for an interobserver reliability study of the cylinder parameters. PRISM software (GraphPad) was used for illustration of correlation matrices. Reliability was considered poor for ICC <0.5, moderate for ICC 0.5-0.75, good for ICC 0.75-0.90, and excellent for ICC >0.90.4,19,32
Anatomic Tunnel Placement Location
It is possible to describe and project any desired point based on the coordinate system implemented. Most important, we attempted to highlight the anatomic position of the femoral tunnel aperture. Being on the cylinder’s surface, this target has the individualized radius as the X-coordinate. Furthermore, the initial Bernard et al2 study described the anatomic femoral tunnel position as being at 28.5% in the Y-axis (high-low). Using basic trigonometry, a 28.5% position along the medial wall of the lateral femoral condyle translates into 2 possible angles in our reference depending on the side operated. These angles are 0.45 radians (≅26°) for the left knee and 2.69 radians (≅154°) for the right knee. Not surprisingly, these 2 angles that were generated correspond to the commonly described anatomic 2-o’clock (left) and 10-o’clock (right) positions. With the final coordinate being the depth along the Z-axis, we used Bernard et al’s initial description to place our target position. This point was placed at 24.8% from the posterior edge of the lateral femoral condyle.
According to our 3D reference, the ideal point coordinate (P) for a left ACL is then
P (0.45 radians, 0.248 × length, 1.00 × notch radius).
This coordinate system can be adapted to guide the placement of any single or double-bundle femoral tunnel (Figure 9).
Figure 9.

Three-dimensional location of anatomic femoral anterior cruciate ligament insertion.
Description of Postoperative Tunnel Aperture Position
Postoperative tunnel identification for the 37 patients was performed by both observers. We described the actual positioning of the femoral tunnel aperture in our cylindrical coordinate system by intersecting the axis of the femoral tunnel with the surface of the cylinder. We were able to express every tunnel’s crossing point with the same coordinate system (angle, length, diameter) (Figure 10). The actual and ideal points both being on the cylinder, the radius X-coordinate remains constant. However, differences were seen in terms of height (angle) and in the deep-shallow position along the intercondylar notch. These results were plotted as a modified grid.
Figure 10.

Actual tunnel axis (green dots) compared with anatomic (black dot) femoral anterior cruciate ligament insertion.
Results
Initially, cylinder parameters were collected automatically from each observer’s series of EOS 3D models (automated EOS). Then, each independent observer manually measured the same parameters on 3D contours (manual EOS) and on the stereoradiographic images (manual XR). For the metrics obtained by the automated method, the first observer’s (J.M.) cylinder had a mean orientation of 30.0° (95% CI, 28.4°-31.5°), a length of 40.4 mm (95% CI, 39.3-41.4 mm), and diameter of 19.3 mm (95% CI, 18.6-20.0 mm). The same metrics for the second observer’s (J.S.) series were 29.7° (95% CI, 28.1°-31.3°), 40.7 mm (95% CI, 39.7-41.8 mm), and 19.7 mm (95% CI, 18.8-20.6 mm), respectively (Table 1 and Figure 11).
TABLE 1.
Overall Evaluation of Cylinder Parametersa
| Parameter | Modality | Observer 1 | Observer 2 |
|---|---|---|---|
| Angle, deg | Automated EOS | 30.0 (28.4-31.5) | 29.7 (28.1-31.3) |
| Manual EOS | 35.6 (33.6-37.5) | 38.8 (37.6-40.0) | |
| Manual XR | 34.8 (33.6-36.0) | 37.4 (36.1-38.6) | |
| Length, mm | Automated EOS | 40.4 (39.3-41.4) | 40.7 (39.7-41.8) |
| Manual EOS | 45.8 (44.7-46.9) | 42.3 (41.1-43.6) | |
| Manual XR | 44.7 (43.3-46.1) | 40.4 (38.5-42.3) | |
| Diameter, mm | Automated EOS | 19.3 (18.6-20.0) | 19.7 (18.8-20.6) |
| Manual EOS | 21.7 (20.9-22.4) | 19.1 (18.5-19.7) | |
| Manual XR | 21.7 (20.4-22.9) | 20.3 (18.9-21.7) |
aValues are expressed as mean (95% CI). n = 37; α = 5%. EOS, EOS Imaging System; XR, stereoradiographic.
Figure 11.

Column graph of intertest cylinder validation mean and 95% CIs. Automatized, automated EOS 3D system; XR, stereoradiographic.
According to paired t test, the first observer’s automated EOS 3D cylinder had an average orientation of 5.6° (95% CI, 3.8° to 7.4°) less than the manual EOS technique. This same measurement was 9.2° (95% CI, 7.6° to 10.8°) for the second observer. When we compared the automated EOS versus manual XR measurements, observer 1 had an orientation absolute difference of 4.9° (95% CI, 3.0° to 6.7°) and observer 2 had a difference of 7.7° (95% CI, 5.6° to 9.8°). Regarding length, the first observer’s automated EOS cylinder was on average 5.5 mm (95% CI, 4.5 to 6.5 mm) shorter than manual EOS measures, whereas the same parameter was 1.6 mm (95% CI, 0.8 to 2.5 mm) for the second observer. Observer 1 obtained an automated EOS length that was 4.3 mm (95% CI, 3.2 to 5.4 mm) shorter than by manual XR, whereas observer 2’s measurement was 0.3 mm (95% CI, –1.6 to 2.2 mm) longer. Regarding diameter, the first observer’s automated EOS cylinder was 2.4 mm (95% CI, 1.6 to 3.1 mm) smaller than with manual EOS measures, whereas it was found to be 0.7 mm (95% CI, −0.4 to 1.8 mm) larger for the second observer. Observer 1 obtained an automated EOS diameter 2.4 mm (95% CI, 1.2 to 3.5 mm) smaller than with radiographs, whereas observer 2 obtained a diameter 0.5 mm (95% CI, −2.1 to 1.1 mm) smaller (Tables 2 and 3).
TABLE 2.
Intertest Paired t Test for Observer 1a
| Parameter | Modality | Mean | 95% CI |
|---|---|---|---|
| Angle, deg | A vs E | –5.59 | –7.42 to –3.76 |
| A vs XR | –4.86 | –6.71 to –3.00 | |
| Length, mm | A vs E | –5.46 | –6.47 to –4.46 |
| A vs XR | –4.33 | –5.43 to –3.23 | |
| Diameter, mm | A vs E | –2.37 | –3.15 to –1.58 |
| A vs XR | –2.35 | –3.46 to –1.23 |
a n = 37; α = 5%. A, automated EOS; E, manual EOS; XR, manual stereoradiographic.
TABLE 3.
Intertest Paired t Test for Observer 2a
| Parameter | Modality | Mean | 95% CI |
|---|---|---|---|
| Angle, deg | A vs E | –9.18 | –10.75 to –7.60 |
| A vs XR | –7.71 | –9.82 to –5.61 | |
| Length, mm | A vs E | –1.61 | –2.46 to –0.75 |
| A vs XR | 0.33 | –1.58 to 2.24 | |
| Diameter, mm | A vs E | 0.66 | –0.44 to 1.75 |
| A vs XR | –0.54 | –2.14 to 1.07 |
an = 37; α = 5%. A, automated EOS; E, manual EOS; XR, manual stereoradiographic.
For all 3 measuring modalities, intertest correlation (r) was calculated independently, along with a global ICC for every parameter of the cylinder. They all demonstrated positive correlations (Figure 12). For orientation, the automated EOS versus manual EOS methods gave a moderate correlation (r = 0.50; P < .001), whereas both the automated EOS versus manual XR and the manual EOS versus manual XR gave poor correlations (r = 0.18; P = .28 and r = 0.13; P = .45, respectively). However, for the length, the automated EOS versus both manual EOS and manual XR measures gave moderate correlations (r = 0.60; P < .001 and r = 0.66; P < .001, respectively). Also, manual XR compared with manual EOS measures showed a good correlation (r = 0.76; P < .001). For the diameter, the automated compared with manual EOS measures gave a poor correlation (r = 0.40; P = .015), whereas the automated compared with manual XR gave a moderate correlation (r = 0.50; P = .002). The manual EOS versus manual XR also had a moderate correlation (r = 0.56; P < .001). Overall, the global intertest correlation gave a poor correlation for orientation (r = 0.44; 95% CI, 0.08-0.68). However, the length and the diameter showed moderate overall correlations of 0.68 (95% CI, 0.15-0.87) and 0.63 (95% CI, 0.33-0.80), respectively (Table 4).
Figure 12.

Intertest Pearson correlation matrices. Automatized, automated EOS 3D system; EOS, manual 3D; XR, manual stereoradiographic.
TABLE 4.
Intertest Global Intraclass Correlationsa
| Parameter | ICC | 95% CI |
|---|---|---|
| Angle | 0.44 | 0.08-0.68 |
| Length | 0.68 | 0.15-0.87 |
| Diameter | 0.63 | 0.33-0.80 |
aICC, intraclass correlation coefficient.
For the interobserver reliability, the cylinders as measured via automated EOS, manual EOS, and manual XR all showed poor interobserver correlation for orientation (r = 0.29; P = .08, r = 0.14; P = .41, and r = 0.48; P < .001, respectively). For length, the automated method gave an excellent correlation (r = 0.95; P < .001), whereas the manual EOS and manual XR both had a moderate correlation between observers (r = 0.66; P < .001 and r = 0.45; P < .001, respectively). For diameter, the automated, manual EOS and manual XR all gave a moderate correlation between observers (r = 0.64; P < .001, r = 0.53; P < .001, and r = 0.72; P < .001, respectively) (Table 5).
TABLE 5.
Interobserver Correlationsa
| Parameter | Modality | ICC | Significance |
|---|---|---|---|
| Angle | Automated EOS | 0.29 | .08 |
| Manual EOS | 0.14 | .41 | |
| Manual XR | 0.48 | <.01 | |
| Length | Automated EOS | 0.95 | <.01 |
| Manual EOS | 0.66 | <.01 | |
| Manual XR | 0.45 | .01 | |
| Diameter | Automated EOS | 0.64 | <.01 |
| Manual EOS | 0.53 | <.01 | |
| Manual XR | 0.72 | <.01 |
an = 37; α = 5%. EOS, EOS Imaging System; ICC, intraclass correlation coefficient; XR, stereoradiographic.
Finally, we displayed the coordinates of each patient’s femoral tunnel aperture in the cylindrical coordinate system for both observers’ series of reconstructions (Figure 13). As stated earlier, the Y-axis high-low coordinate is given by a sine ratio of its corresponding angle. The target point was then placed according to the initial description by Bernard et al2: 24.8% in the deep-shallow Z-axis and 28.5% in the high-low Y-axis. The population 5th to 95th percentile anatomic footprint, as studied by Parkar et al,28 was also templated as limits. The mean coordinates at the center of the femoral tunnel aperture for the first observer’s series were 37.6° ± 4.6° (or 0.66 ± 0.08 radians) and 41.0% ± 3.0% in length. The same parameters for the second observer’s series were 38.3° ± 5.7° (0.66 ± 0.1 radians) and 42.0% ± 3.0% in length. The average Euclidian distance between the actual and anatomic tunnel position was 8.1 ± 1.1 mm for the first observer’s series and 9.5 ± 1.5 mm for the second observer’s series.
Figure 13.

Actual tunnel aperture placement with the cylindrical reference in the intercondylar notch for both observers. ACLR, anterior cruciate ligament reconstruction.
Discussion
This study successfully evaluated the validity and reliability of a novel cylindrical coordinate system in the analysis of ACLR femoral tunnel placement. This cylindrical reference was developed with the use of 3D models issued from EOS biplanar radiographs, which provide a low-radiation, highly efficient alternative to CT. We were able to validate these automated cylinders with parameters that were measured manually on corresponding 3D models as well as on the initial radiograph images. This cylindrical coordinate system allowed us to illustrate femoral tunnel placement in a previously unseen 3D fashion. To define coordinates of the anatomic placement in this 3D reference, we were able to execute mathematical conversions and merge 2 previously studied approaches: the clockface method and the Bernard-Hertel quadrant method.
Three-dimensional modeling demonstrates clear advantages in ACLR tunnel placement. It is able to represent the actual morphology of the intercondylar notch as seen by the surgeon during an arthroscopic surgery. Recently, 3D modeling using CT scans have gained popularity because of its improved bony description. However, for ACLR, most proposed techniques using 3D-CT actually produce a 2-dimensional analysis with the quadrant method on a medial view of the lateral condyle. Few studies have actually described the ACLR femoral aperture with 3D coordinates. To our knowledge, Luites et al,23 using well-designed computer navigation software, are the only investigators who also used a cylindrical reference in describing ACLR. However, their method was based on real-time navigation with optoelectric cameras and dynamic reference bases. Thus, the lack of availability and applicability of such a perioperative digitization system as well as the inability to produce preoperative planning are major limitations of this technique. Because multiple groups at our research center are focusing on deep machine learning and automated processes, we were able to design a cylindrical reference system that could be produced automatically from an EOS 3D knee reconstruction. Although the present study outlines the initial technique to fit a cylindrical reference in the intercondylar notch, we are aware that further refinements could take into account that the notch dimensions are often variable and that the Blumensaat line is not always straight.16,20 To our knowledge, we are the first group to use biplanar stereoradiographic imaging to describe femoral tunnel positioning in ACLR.
The parameters targeted for the validation of the cylinder were the orientation, length, and diameter. These metrics were compared between the automated EOS method, a manual measure on the EOS 3D contours, and manual measures on lateral radiographs as initially described by the quadrant method. Although the orientation of the intercondylar notch roof is not widely reported, the reported deep-shallow length and high-low height in the literature are consistent with our results.5,7,9,20,24,34 Of the 3 parameters, the angle between the cylinder’s long axis and the anatomic distal femoral axis was undoubtedly the one that accounted for the most variability among measurement techniques. The natural bowing of the femur in the sagittal plane, combined with subjective manual measurements, could explain the variability between the measuring modalities. For future studies, other landmarks could be used for orientation. In contrast, the length and diameter of the automated EOS cylinders were consistently within the previously identified targets, being 5 mm for length and 2 mm for diameter, when compared with the standard manual measures on lateral radiographs.
Following the same tendency, our method showed adequate intertest ICCs among all 3 measuring techniques for both length and diameter, while giving a poor correlation for orientation. In terms of interobserver reproducibility, similar results were obtained, with moderate to excellent correlations for length and diameter. Most important, our results showed better reproducibility with the automated process than the standard manual XR measurements. We believe that overall, the cylinder’s length, which is also influenced by its orientation within the distal femur, is the most important parameter. Overall, our results support the adequacy of the proposed method for length determination. As well, we would like to refine the analysis for the diameter even if acceptable results were obtained. Comparing a 3D technique with a monoplanar distance in the high-low axis could explain the discrepancies obtained. Also, as previously stated, since the manual techniques (EOS contours and stereoradiography) were exposed to human operator errors in obtaining a perfect lateral image, malrotation could contribute to the differences observed. In fact, both observers needed to manually rotate the transparent 3D model before proceeding with their measurements. Similarly, as seen in Figure 8, some biplanar stereoradiographic acquisitions did not display a perfect lateral image of the operated knee. Although we are satisfied with the validation of this cylindrical coordinate system, we believe that adjusting these factors could improve the overall precision of our method.
Displaying the location of all apertures on a single graph allowed us to analyze 3D femoral tunnel placement in a novel fashion. Although acknowledging the discrepancies in the literature concerning ideal femoral tunnel placement, we opted to compare our reconstructions with an anatomic placement as historically described by Bernard et al.2 We also included the population anatomic 5th to 95th percentile interval as shared by Parkar et al28 in their systematic review. Compared with these targets, both observers’ series displayed an average postoperative femoral tunnel placed in a shallower and higher position in the intercondylar notch. In fact, from a frontal perspective, the tunnels had an angular component of around 10° more than the ideal 2- and 10-o’clock positions. The linear distance between the center of the actual femoral tunnel aperture and the anatomic target underlines the overall precision of the tunnel placement. Both observers’ series showed a distance less than 10 mm. Proportionally, the average reamer used for femoral tunnel drilling in ACLR has a diameter of 8 mm. The impact of this small difference in femoral tunnel placement on the biomechanics of the knee has not yet been determined.
This technique can open the door to multiple preoperative, perioperative, and postoperative possibilities in ACLR as well as in other knee surgeries. In our opinion, the efficiency of the low-irradiation, biplanar, stereoradiographic imaging combined with the recent progress in automation and deep learning will allow for a tailored preoperative approach to ACLR. During surgery, this 3D reference could also be used with augmented reality for navigation or to customize a surgical guide in order to avoid grossly misplaced tunnels. In fact, previous studies have shown that visual aids improve the precision and reliability of tunnel placement in ACLR.13,31 Finally, postoperative 3D feedback on tunnel placement could also be beneficial as underlined by previous studies.33 However, the present method entails certain limitations. As previously stated, our group will need to improve some parameters in the conception of the cylindrical reference, notably the orientation. Our technique will also need to consider that the notch dimensions are often variable and the Blumensaat line is not always straight. Furthermore, the accessibility of such a system is limited, restricting our knowledge about reproducibility among different centers. This reproducibility will need to be established before our technique is scaled. Sharing data among institutions using EOS will augment the sample size while providing other surgeons with different surgical techniques. This should improve the precision and generalizability of our method.
Conclusion
This novel 3D cylindrical coordinate system, using biplanar stereoradiographic imaging and low-irradiation imaging, showed a precision comparable with standard manual measurements in ACLR femoral tunnel placement. Our results also suggest that automated cylinders issued from EOS show adequate accuracy and reproducibility. Even though the results of this preliminary study are promising, we strive to improve our methods by refining further parameters to evaluate and revalidate the present method, especially focusing on the spatial orientation. We also plan to scale up the study to other centers using the EOS imaging technology with different orthopaedic surgeons.
Footnotes
Final revision submitted December 17, 2019; accepted December 23, 2019.
One or more of the authors has declared the following potential conflict of interest or source of funding: This study was sponsored by grants from the Natural Sciences and Engineering Research Council of Canada, Canada Research Chairs, Mitacs, and MEDTEQ. T.C. and J.A.D.G. have received research support and royalties from EOS Imaging and have licensed patents to EOS Imaging. AOSSM checks author disclosures against the Open Payments Database (OPD). AOSSM has not conducted an independent investigation on the OPD and disclaims any liability or responsibility relating thereto.
Ethical approval for this study was obtained from the research ethics committee of the Centre Hospitalier de l’Université de Montréal (project No. 2008-2564).
References
- 1. Behrend H, Stutz G, Kessler MA, Rukavina A, Giesinger K, Kuster MS. Tunnel placement in anterior cruciate ligament (ACL) reconstruction: quality control in a teaching hospital. Knee Surg Sports Traumatol Arthrosc. 2006;14(11):1159–1165. [DOI] [PubMed] [Google Scholar]
- 2. Bernard M, Hertel P, Hornung H, Cierpinski T. Femoral insertion of the ACL: radiographic quadrant method. Am J Knee Surg. 1997;10(1):14–21. [PubMed] [Google Scholar]
- 3. Burkart A, Debski RE, McMahon PJ, et al. Precision of ACL tunnel placement using traditional and robotic techniques. Comput Aided Surg. 2001;6(5):270–278. [DOI] [PubMed] [Google Scholar]
- 4. Cicchetti DV. Guidelines, criteria, and rules of thumb for evaluating normed and standardized assessment instruments in psychology. Psychol Assess. 1994;6(4):284–290. [Google Scholar]
- 5. Colombet P, Robinson J, Christel P, et al. Morphology of anterior cruciate ligament attachments for anatomic reconstruction: a cadaveric dissection and radiographic study. Arthroscopy. 2006;22(9):984–992. [DOI] [PubMed] [Google Scholar]
- 6. Cresson T, Branchaud D, Chav R, Godbout B, Guise JA. 3D shape reconstruction of bone from two x-ray images using 2D/3D non-rigid registration based on moving least-squares deformation. Paper presented at: SPIE Medical Imaging; 2010; San Diego, California. [Google Scholar]
- 7. Davis TJ, Shelbourne KD, Klootwyk TE. Correlation of the intercondylar notch width of the femur to the width of the anterior and posterior cruciate ligaments. Knee Surg Sports Traumatol Arthrosc. 1999;7(4):209–214. [DOI] [PubMed] [Google Scholar]
- 8. Edwards A, Bull AM, Amis AA. The attachments of the anteromedial and posterolateral fibre bundles of the anterior cruciate ligament, part 2: femoral attachment. Knee Surg Sports Traumatol Arthrosc. 2008;16(1):29–36. [DOI] [PubMed] [Google Scholar]
- 9. Forsythe B, Kopf S, Wong AK, et al. The location of femoral and tibial tunnels in anatomic double-bundle anterior cruciate ligament reconstruction analyzed by three-dimensional computed tomography models. J Bone Joint Surg Am. 2010;92(6):1418–1426. [DOI] [PubMed] [Google Scholar]
- 10. Han Y, Hart A, Martineau PA. Is the clock face an accurate, precise, and reliable measuring tool for anterior cruciate ligament reconstruction? Arthroscopy. 2014;30(7):849–855. [DOI] [PubMed] [Google Scholar]
- 11. Hart A, Han Y, Martineau PA. The apex of the deep cartilage: a landmark and new technique to help identify femoral tunnel placement in anterior cruciate ligament reconstruction. Arthroscopy. 2015;31(9):1777–1783. [DOI] [PubMed] [Google Scholar]
- 12. Hwang MD, Piefer JW, Lubowitz JH. Anterior cruciate ligament tibial footprint anatomy: systematic review of the 21st century literature. Arthroscopy. 2012;28(5):728–734. [DOI] [PubMed] [Google Scholar]
- 13. Ilahi OA, Mansfield DJ, Urrea LH II, Qadeer AA. Reliability and reproducibility of several methods of arthroscopic assessment of femoral tunnel position during anterior cruciate ligament reconstruction. Arthroscopy. 2014;30(10):1303–1310. [DOI] [PubMed] [Google Scholar]
- 14. Illes T, Somoskeoy S. The EOS imaging system and its uses in daily orthopaedic practice. Int Orthop. 2012;36(7):1325–1331. [DOI] [PMC free article] [PubMed] [Google Scholar]
- 15. Inderhaug E, Larsen A, Waaler PA, Strand T, Harlem T, Solheim E. The effect of intraoperative fluoroscopy on the accuracy of femoral tunnel placement in single-bundle anatomic ACL reconstruction. Knee Surg Sports Traumatol Arthrosc. 2017;25(4):1211–1218. [DOI] [PubMed] [Google Scholar]
- 16. Iriuchishima T, Ryu K, Aizawa S, Fu FH. Blumensaat’s line is not always straight: morphological variations of the lateral wall of the femoral intercondylar notch. Knee Surg Sports Traumatol Arthrosc. 2016;24(9):2752–2757. [DOI] [PubMed] [Google Scholar]
- 17. Jepsen CF, Lundberg-Jensen AK, Faunoe P. Does the position of the femoral tunnel affect the laxity or clinical outcome of the anterior cruciate ligament-reconstructed knee? A clinical, prospective, randomized, double-blind study. Arthroscopy. 2007;23(12):1326–1333. [DOI] [PubMed] [Google Scholar]
- 18. Kawakami Y, Hiranaka T, Matsumoto T, et al. The accuracy of bone tunnel position using fluoroscopic-based navigation system in anterior cruciate ligament reconstruction. Knee Surg Sports Traumatol Arthrosc. 2012;20(8):1503–1510. [DOI] [PubMed] [Google Scholar]
- 19. Koo TK, Li MY. A guideline of selecting and reporting intraclass correlation coefficients for reliability research. J Chiropr Med. 2016;15(2):155–163. [DOI] [PMC free article] [PubMed] [Google Scholar]
- 20. Koukoubis TD, Glisson RR, Bolognesi M, Vail TP. Dimensions of the intercondylar notch of the knee. Am J Knee Surg. 1997;10(2):83–87. [PubMed] [Google Scholar]
- 21. Kraeutler MJ, Patel KV, Hosseini A, Li G, Gill TJ, Bravman JT. Variability in the clock face view description of femoral tunnel placement in ACL reconstruction using MRI-based bony models. J Knee Surg. 2018;31(10):965–969. [DOI] [PubMed] [Google Scholar]
- 22. Luites JW, Wymenga AB, Blankevoort L, Eygendaal D, Verdonschot N. Accuracy of a computer-assisted planning and placement system for anatomical femoral tunnel positioning in anterior cruciate ligament reconstruction. Int J Med Robot. 2014;10(4):438–446. [DOI] [PubMed] [Google Scholar]
- 23. Luites JW, Wymenga AB, Blankevoort L, Kooloos JM, Verdonschot N. Development of a femoral template for computer-assisted tunnel placement in anatomical double-bundle ACL reconstruction. Comput Aided Surg. 2011;16(1):11–21. [DOI] [PubMed] [Google Scholar]
- 24. Luites JWH, Wymenga AB, Blankevoort L, Kooloos JGM. Description of the attachment geometry of the anteromedial and posterolateral bundles of the ACL from arthroscopic perspective for anatomical tunnel placement. Knee Surg Sports Traumatol Arthrosc. 2007;15(12):1422–1431. [DOI] [PMC free article] [PubMed] [Google Scholar]
- 25. Marchant BG, Noyes FR, Barber-Westin SD, Fleckenstein C. Prevalence of nonanatomical graft placement in a series of failed anterior cruciate ligament reconstructions. Am J Sports Med. 2010;38(10):1987–1996. [DOI] [PubMed] [Google Scholar]
- 26. MARS Group, Wright RW, Huston LJ, et al. Descriptive epidemiology of the Multicenter ACL Revision Study (MARS) cohort. Am J Sports Med. 2010;38(10):1979–1986. [DOI] [PMC free article] [PubMed] [Google Scholar]
- 27. Musahl V, Plakseychuk A, VanScyoc A, et al. Varying femoral tunnels between the anatomical footprint and isometric positions: effect on kinematics of the anterior cruciate ligament-reconstructed knee. Am J Sports Med. 2005;33(5):712–718. [DOI] [PubMed] [Google Scholar]
- 28. Parkar AP, Adriaensen M, Vindfeld S, Solheim E. The anatomic centers of the femoral and tibial insertions of the anterior cruciate ligament: a systematic review of imaging and cadaveric studies reporting normal center locations. Am J Sports Med. 2017;45(9):2180–2188. [DOI] [PubMed] [Google Scholar]
- 29. Petermann J, Kober R, Heinze R, Frölich JJ, Heeckt PF, Gotzen L. Computer-assisted planning and robot-assisted surgery in anterior cruciate ligament reconstruction. Oper Tech Orthop. 2000;10(1):50–55. [Google Scholar]
- 30. Rayan F, Nanjayan SK, Quah C, Ramoutar D, Konan S, Haddad FS. Review of evolution of tunnel position in anterior cruciate ligament reconstruction. World J Orthop. 2015;6(2):252–262. [DOI] [PMC free article] [PubMed] [Google Scholar]
- 31. Schep NW, Stavenuiter MH, Diekerhof CH, et al. Intersurgeon variance in computer-assisted planning of anterior cruciate ligament reconstruction. Arthroscopy. 2005;21(8):942–947. [DOI] [PubMed] [Google Scholar]
- 32. Shrout PE, Fleiss JL. Intraclass correlations: uses in assessing rater reliability. Psychol Bull. 1979;86(2):420–428. [DOI] [PubMed] [Google Scholar]
- 33. Sirleo L, Innocenti M, Innocenti M, Civinini R, Carulli C, Matassi F. Post-operative 3D CT feedback improves accuracy and precision in the learning curve of anatomic ACL femoral tunnel placement. Knee Surg Sports Traumatol Arthrosc. 2018;26(2):468–477. [DOI] [PubMed] [Google Scholar]
- 34. Zantop T, Wellmann M, Fu FH, Petersen W. Tunnel positioning of anteromedial and posterolateral bundles in anatomic anterior cruciate ligament reconstruction: anatomic and radiographic findings. Am J Sports Med. 2008;36(1):65–72. [DOI] [PubMed] [Google Scholar]
- 35. Zeighami A, Dumas R, Kanhonou M, et al. Tibio-femoral joint contact in healthy and osteoarthritic knees during quasi-static squat: a bi-planar X-ray analysis. J Biomech. 2017;53:178–184. [DOI] [PubMed] [Google Scholar]