Abstract
Atomistic simulations of nucleic acids are prohibitively expensive and, consequently, reduced models of these compounds are of great interest in the field. In this work, we propose a physics-based coarse-grained model of nucleic-acid bases in which each base is represented by several (3 to 5) interaction centers. Van der Waals interactions are modeled by Lennard-Jones spheres with a 12–6 potential energy function. The charge distribution is modeled by a set of electric dipole moments located at the centers of the Lennard-Jones spheres. The method for computing the Lennard-Jones parameters, electric dipole moments (their magnitude and orientation) and positions of the interaction centers is described. Several models with different numbers of interaction centers were tested. The model with 3-center Cytosine, 4-center Guanine, 4-center Thymine and 5-center Adenine satisfactorily reproduces the canonical Watson-Crick hydrogen bonding and stacking interaction energies of the all-atom AMBER model. The computation time with the coarse-grained model is reduced seven times compared to that of the all-atom model.
Introduction
The molecular dynamics (MD) and Monte Carlo (MC) methods are standard simulation techniques applied to biomolecular systems. Although all-atom models provide insight into molecular motions at the atomic level, their relatively high computational costs prevents a study of long time-scale motions of macro-molecular systems. The CHARMM1, AMBER2 and BMS3 force fields, developed for all-atom MD-simulations of nucleic acids, offer the most detailed description of interactions within the system. All-atom MD simulations have helped in understanding processes such as drug-nucleic acid binding, dependence of double-helix flexibilty on sequence or the influence of ions and solvent on nucleic acid structure.4,5 Although all-atom MD simulations can successfully predict some properties of small nucleic acid molecules and their complexes, the high number of interacting atoms prevents their application to larger systems.
Coarse-grained models, which treat groups of atoms as single interaction centers, increase the efficiency of computations in two ways: they reduce the number of interaction centers so that a smaller number of particle-particle distances must be evaluated, and they remove the high frequency motions of protons leading to an allowable increase in the time step for integrating Newton’s equations in MD algorithms. Although some of the precision of all-atom models is lost, coarse-graining is currently the only way to study very large time-scale motions of large biomolecular systems.
Most coarse-grained models of nucleic acids developed so far implement simple harmonic6–11, Morse12, or Gō-like potentials13 to describe nucleotide base-pairing and other specific long-range interactions. These approaches, however, require knowledge of the native topology of nucleic acids and their complexes with proteins. Only a few force fields, designed for coarse-grained models of nucleic acids,8,14,15 have been derived based (partially or fully) on the physics of the interactions in these macromolecules. A quite successful three-center-per-nucleotide model, satisfactionary reproducing thermal (denaturation/renaturation) and mechanical (persistence length) properties of DNA, was proposed recently by Knotts et al.16 and later improved by Sambirski et al..17,18 In their model, nucleic acid bases are replaced by spherical beads (one per base), which interact with specific Gō-like potentials distinguishing between base-base stacking and base-base hydrogen bonding. In this paper, we propose a model of nucleic acid bases, which lacks Gō-like potential terms and which is based on the physics of interacting particles.
One of the possible approaches to coarse-graining nucleic acid bases makes use of the Gay-Berne (GB) potential, which was developed to describe close contact repulsion and long-range attraction of nonspherical compounds.19–22 It was combined with the point-multipole expansion (GB-EMP model) and applied to simple molecules such as: benzene, methanol and water.23 Since the GB model represents a set of atoms as a single ellipsoid, the shape of the molecule is reproduced better for simple symmetric compounds like benzene. Therefore, parametrization of a GB-EMP model for nonsymmetrical molecules such as nucleic acid bases must lead to relatively crude approximations of the shape and volume occupied by the molecules. Some applications such as DNA-protein docking, require very good reproduction of the shapes and volumes of the interacting molecules. In this application, an alternative approach relying on replacing a group of atoms with several spherical interaction centers, rather than with a single ellipsoid, seems more appropriate. This approach for modeling protein-DNA recognition was recently proposed by Poulain et al..24 They modeled purines and pyrimidines with three and two neutral spherical beads, respectively, placed at the center of mass of selected groups of atoms. The Lennard-Jones beads have the same energy well-depth and differ only in radii, which are computed as simple averages of the van der Waals radii of the atoms comprising the beads.
In this paper, we propose a more precise method, by replacing the set of atoms with a small set of Lennard-Jones beads with electric dipole moments located in their centers (dipolar beads). The Lennard-Jones parameters as well as the positions of the beads are determined by fitting them to the all-atom AMBER van der Waals energy. The dipole moments are fitted to the quantum mechanical electrostatic potential. The model shows good reproduction of hydrogen bonding and stacking interaction energies of atomic models with moderate speedup of energy computations (about seven times).
Methods
In the method described below, it is assumed that each chemical compound can be modeled as a rigid body with several interaction centers. The number of centers per rigid body may vary depending on the type of molecule and, in general, depends on its size and chemical composition, reflecting a balance between the speed of computations and the desired accuracy of the model.
The local coordinate frame of each rigid body is located at the center of mass, and its axes are aligned with the principal axes of the moment of inertia. The relative position and orientation of two rigid bodies are described by a translation vector R and a set of three Euler angles, Φ ≡ [ϕ, ψ, θ], respectively25. The interactions between rigid bodies are divided into van der Waals and electrostatic components, with the former modeled with a Lennard-Jones 12–6 energy function and the latter, in general, with a multipole-multipole interaction energy.
In the next two sections, the method of parametrization of the new interaction centers is described. It is first assumed that the number of interaction centers as well as their positions in the local coordinate frames are fixed, separately for each type of base. Then, the method for searching for optimal positions of the dipolar beads is described in the section “Positions of beads”.
Lennard-Jones potential energy
The 12–6 form of the Lennard-Jones potential energy is one of the most commonly used approximations of van der Waals interactions applied in all-atom molecular dynamics simulations.26 Its analytical form depends on two adjustable parameters (σ, ϵ) and the distance r between interacting centers
| (1) |
where σ is a so-called contact parameter (the distance at which the interaction energy equals zero) and ϵ is the energy well-depth. Because Lennard-Jones interactions are computed for all pairs of particles in the system, (N(N +1)/2) pairs of (σ, ϵ) parameters are required for a complete description of the Lennard-Jones energy. In practice, this number is reduced in two ways. First, atom types are defined. Atoms with similar chemical properties are grouped together and the same pairs of Lennard-Jones parameters are assigned to them. Second, the Lennard-Jones parameters for interaction of unlike atoms are computed from the parameters of like atoms by application of so-called mixing rules. The most commonly used Lorentz-Berthelot mixing rules express the interaction parameters of unlike atoms by arithmetical and geometrical averages of σ and ϵ, respectively
| (2a) |
| (2b) |
where single-indexed σ and ϵ are the interaction parameters of like atoms, and double-indexed parameters are applied to interactions between unlike atoms.
In all-atom force fields, the Lennard-Jones parameters are obtained by fitting to experimental data. Without the approximations described above, the number of parameters would greatly exceed the amount of available experimental data, thus making the fitting problem unfeasible. In the procedure described below, these approximations are discarded. The number of interaction centers in coarse-grained models is several times smaller than in all-atom models, leading to a natural reduction of the number of parameters.
Formula (1) can also be written in the form:
| (3) |
where (σ, ϵ) are replaced by (A, B) parameters, the latter being related to the former by simple relations
| (4a) |
| (4b) |
Formulas (1) and (3) are equivalent, but only the latter one is linear in its parameters (A, B).
Let us first consider two molecules, denoted by m and n, approximated by rigid bodies with Mm and Mn Lennard-Jones interaction centers (see Figure 1). The total number of intermolecular interactions is Nmn = Mm·Mn (for the rigid body approximation used here, intramolecular interactions are irrelevant). The local coordinate systems assigned to each molecule are denoted by O′ and O″ and the positions of the interaction centers in the local coordinate frames of their rigid bodies are denoted by r′i and r″j, where i = 1, …, Mm and j = 1, …, Mn. The position of the O″ in the O′ coordinate frame is denoted by R. The rotation, which transforms the O″ into O′ coordinate frame, is described by the Euler angles Φ [and the corresponding rotation matrix25 ]. The set of all intermolecular distances between the interaction centers is represented by a matrix , whose elements are given by the formula
| (5) |
where, the the operation transforms the vector r″j from the O″ to O′ coordinate frame.
Figure 1:
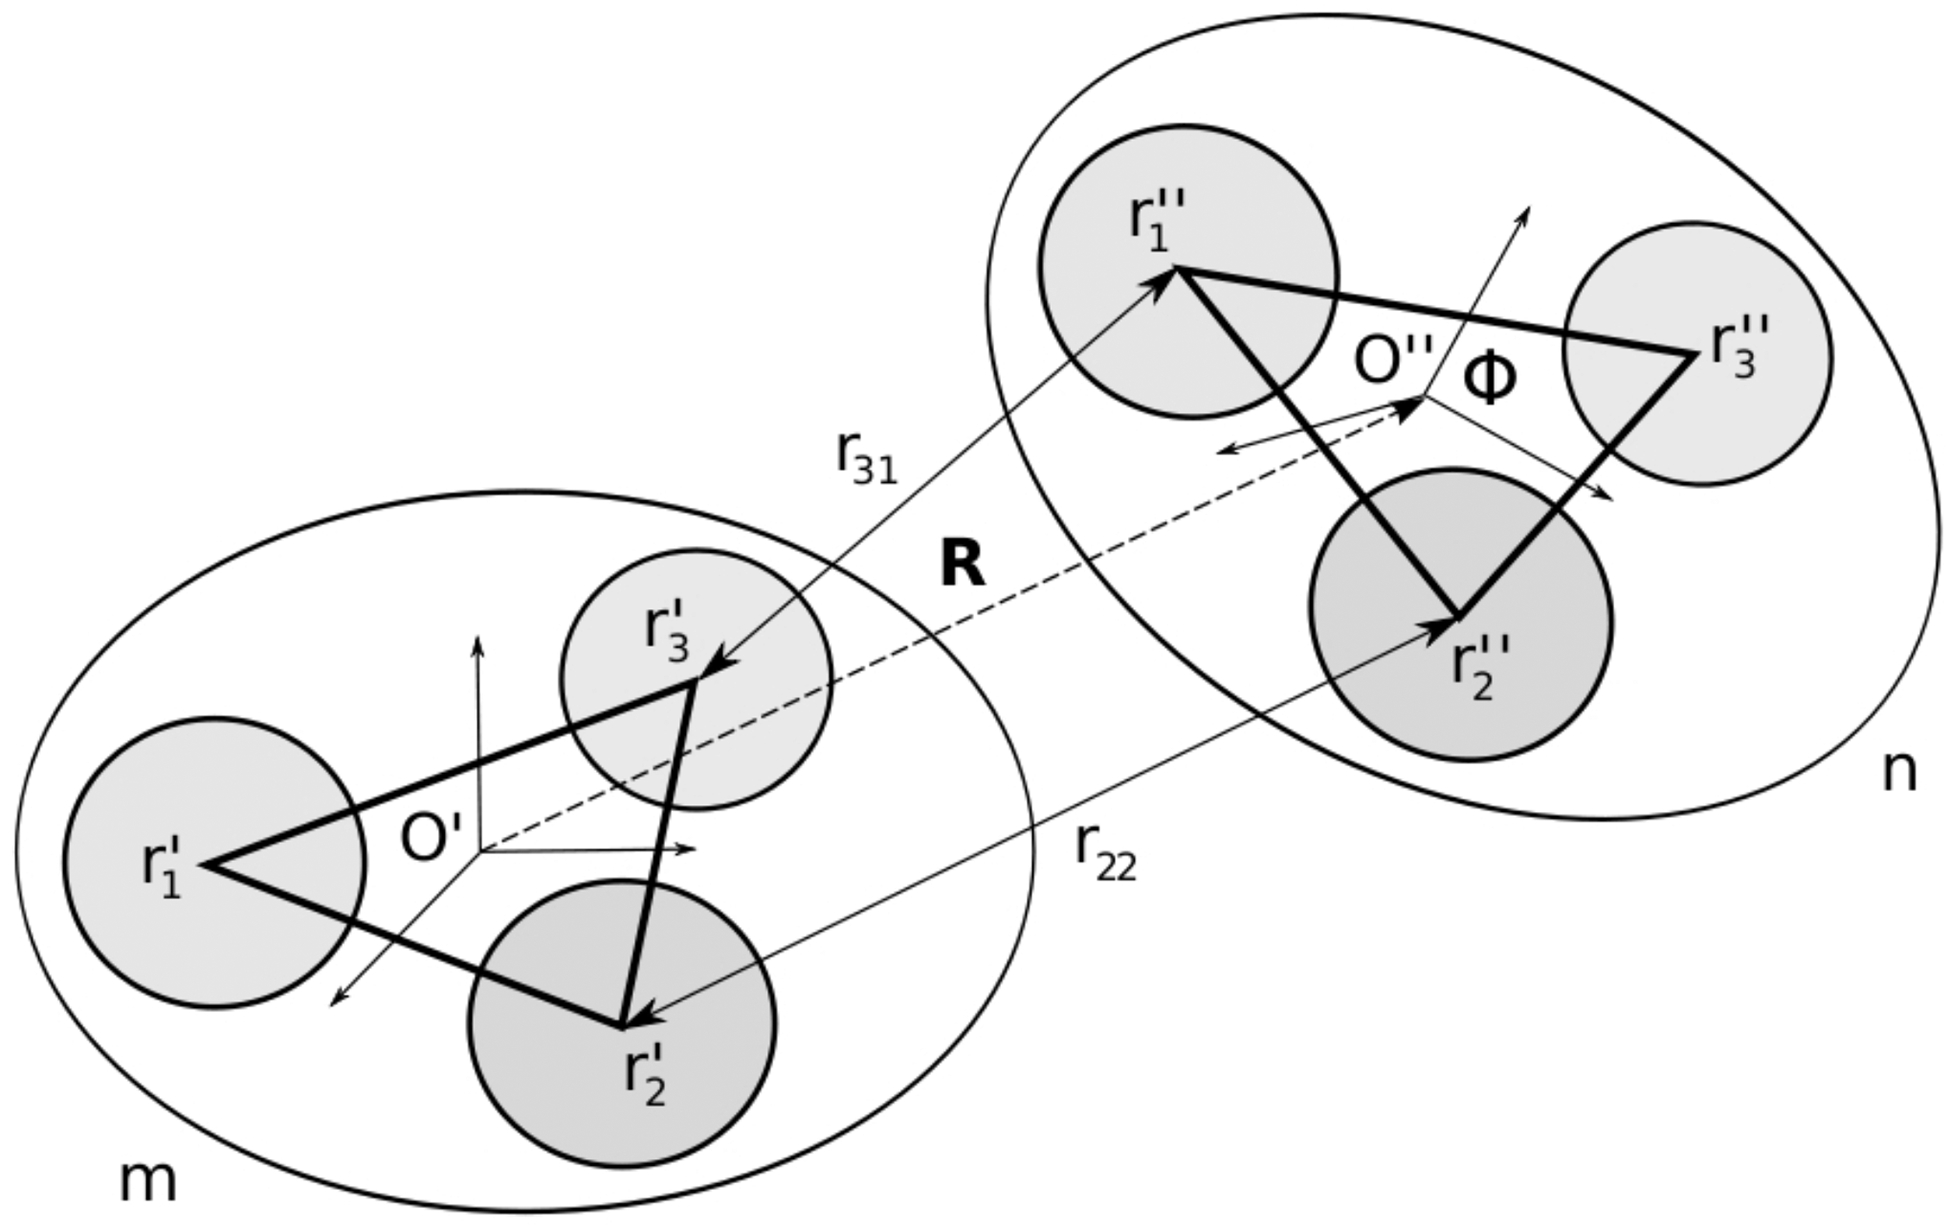
Geometry of two rigid bodies m and n with Mm = 3 and Mn = 3 interaction centers, respectively. Local coordinate frames O′ and O″ are assigned to the rigid bodies. The positions of the interaction centers in the local coordinate frames are denoted by r′ and r″ vectors. The position of the O″ origin in the O′ coordinate frame is defined by the translation vector R. The rotation, which transforms the O″ frame into the O′ frame is defined by the Euler angles Φ. The distances between the centers of interaction are given by the equation (5).
The Lennard-Jones energy for the two-body system is
| (6) |
where Aij and Bij are the elements of matrices A and B of Lennard-Jones coefficients.
The interaction energy of two Lennard-Jones spheres, given by equation (3), can be rewritten as a scalar product of vectors: U12–6(r) = [r−12, r−6] · [A, B]T. Analogously, for the two-compound system with Mm + Mn interaction centers, and a total of Nmn intermolecular pairwise interactions, the intermolecular Lennard-Jones energy (6) can be written as a scalar product
| (7) |
where
| (8) |
The column vector Y is built of rows of matrices A and B with elements A1 = A11, and B1 = B11, . In other words and for i = 1, …, Mm and j = 1, …, Mn.
The elements of the vector r are composed of rows of a distance matrix , whose elements are given by equation (5) i.e., r1 = r11, . This relation can also be rewritten as: for i = 1, …, Mm and j = 1, …, Mn.
The target function for the two-body system is
| (9) |
where is the reference all-atom AMBER interaction energy of rigid bodies m and n in the configuration k defined by the vector [Rk, Φk]. The summation runs over a large number (Kmn) of random conformations (grid points). The method of grid generation is described in the section “Reference grids”. The target function (9) depends on known parameters, i.e., the vectors [Rk, Φk] and the corresponding reference AMBER energy . The parameters with respect to which the target function should be optimized are the positions of the centers of interaction in their local coordinate frames (r′, r″) and the Lennard-Jones parameter vector Y. In this section, we consider optimization with respect to only the Lennard-Jones parameter vector Y, keeping the positions of the interaction centers fixed. The optimization of the target function with respect to the positions of the interaction centers is described in the section “Positions of beads”.
The target function for a many-body system is the sum of the two-body χ2’s
| (10) |
We simplify the notation here and denote the vector of positions of all interaction centers in the local coordinate frames of their rigid bodies by r′ (i.e. for the two-body target function, the [r′, r″] vector is denoted by just r′, for the many-body target function, [r′, r″, r‴, …] is denoted by r′). Because the positions of the new centers r′ are kept fixed, the minima of expression (10) is a solution of the gradient equations
| (11) |
This is a well-known linear least-squares fitting problem, and the corresponding normal equations are given by
| (12) |
where is a Kmn × Nmn matrix built of Kmn row-vectors X, and U′ is the Kmn-dimensional column-vector of the reference (AMBER) energies. They are solved for Y with the Singular Value Decomposition (SVD) method.27
Electrostatic energy
The electrostatic interactions of the coarse-grained system are modeled by a set of electric dipole moments located at the interaction centers. The electrostatic potential generated by a set of dipole moments pi at the point rj is given28 by
| (13) |
As in the previous section, we assume that the positions of the centers r′i are fixed. The dipole moments were determined by linear-least squares fitting to the quantum mechanically generated reference potential . The procedure for fitting dipole moments is analogous to that of determining a set of charges by fitting the electrostatic potential, which is well described in the literature.29–31 The target function for fitting the orientations and magnitudes of the dipole moments to the QM-generated electrostatic potential is similar to that given by equation (9), and is defined as
| (14) |
where the index j corresponds to different grid points given by the vector rj. The total dipole moment of a collection of dipoles was constrained to the QM-determined reference (ptot) with the method of Lagrange multipliers (λk).32
Application of the gradient equations
| (15) |
to formula (14) leads to a set of linear equations analogous to expression (12), which are solved by the SVD method.27
The electrostatic interaction energy between two rigid bodies m and n is given by
| (16) |
where |rij| is given by formula (5), pi = p′i and , where p′ and p″ denote dipole moments described in the local coordinate frames of rigid-bodies m and n, respectively.
Positions of beads
Given the procedure for computing optimal Lennard-Jones parameters and dipole moments, the next problem is finding the optimal positions of the interacting centers, r′. Except for highly symmetric molecules, the optimal positions are different for electrostatic and van der Waals interactions. In principle, the best accuracy is obtained by separating the centers for these two types of interactions. Unfortunately, that would increase the energy-computation time by a factor of about four because the number of necessary distance computations would increase by that factor. Therefore, to define a usable model, the positions of the interaction centers for the Lennard-Jones spheres and the dipole moments are kept the same.
The procedures described above present the method for computing optimal parameters for a given r′. The set of the linear equations can be solved and the computed parameters (Y, p) substituted back into equations (10) and (14), obtaining the minimum values of the target functions and for a given r′. This procedure defines the hypersurface of the optimal target functions in the r′ space. The total hypersurface of the optimal χ2’s in the r′ space is defined as a weighted average
| (17) |
with r′ being the same for the positions of the Lennard-Jones spheres and the dipole moments. The weights are introduced because the Lennard-Jones and electrostatic target functions are related to slightly different physical quantities. The target function (10) is related to the energy while the function (14) corresponds to the electrostatic potential. The latter target function can also be defined in terms of energy but, because the electrostatic energy in equation (16) is quadratic (rather than linear) in form in the dipole moment components, it would lead to a nonlinear least-squares problem, which is more time consuming and more difficult to solve. The basis for the assignment of weights is presented in the “Results and Discussion” section.
The hypersurface defined by equation (17) is searched for r′ with non-gradient minimization methods such as Simplex or Powell.27
Number of interaction centers
Another unknown factor in the coarse-graining procedure is the number of interaction centers for each base. This parameter determines the desired balance between the speed and accuracy of the coarse-grained model. Increasing the number of interaction centers improves the reproduction of the energy surface, but also increases the cost of the computations. Therefore, the number of interaction centers must be chosen by careful examination of the quantities of interest and of the computational efficiency of the models with different numbers of interaction centers, as described in the “Results and Discussion” section.
Reference grids
The coarse-graining procedure described above relies on the reference AMBER and QM data to which the parameters of the analytical expressions are fitted. For the electrostatic component, the set of reference data was the electrostatic potential generated at the grid points around each molecule.
The coordinates of the bases were taken from standard reference frames.33 In this model, the bond lengths and bond angles of the bases are based on the average glycosyl geometries of purines and pyrimidines in high-resolution crystal structures of nucleic-acid analogs from the Cambridge Structure Database. Hydrogen atoms were added afterwords, and their positions were optimized at the MP2/6-31G(d,p) level while keeping the positions of the other atoms fixed. The geometry optimization, including placement of hydrogen atoms, was performed using the GAMESS software.34,35
The electrostatic potential around each base was calculated using the GAMESS package at the MP2/6-31G(d,p) level. Points at which the potential was calculated were located on 4 layers at distances 1.4, 1.6, 1.8 and 2.0 times the value of the van der Waals radii of the atoms. The density of the points was 16 points per square angstrom in all four layers. Based on this electrostatic potential, partial charges for all bases were also computed using the methodology by Singh and Kollman.36
For the Lennard-Jones parametrization, the reference data were van der Waals interaction energies evaluated for all possible pairs of bases. For each pair of rigid bodies, 105 random conformations (defined by the vector [R, Φ]) were generated with the upper energy cutoff criterion set to −0.01 kcal/mol. The number of generated grid points was much larger than for the electrostatic potential fitting procedure because of the higher dimensionality of the sampled space, which is 6 for the Lennard-Jones interactions (3 translations and 3 rotations) and 3 for the electrostatic potential (3 translations only). The cutoff criterion excludes the higher energy repulsion part of the Lennard-Jones interaction and the weak long-range attractive interactions of distant molecules from the fitting procedure, leaving only the most important part close to the energy minima. The reference Van der Waals energy at each grid point was evaluated by using the parameters of the all-atom AMBER force field.2
Results and Discussion
The method described above was applied to the set of four DNA bases: adenine (A), guanine (G), thymine (T) and cytosine (C). The minimum and maximum numbers of interaction centers per base were set to 3 and 5, respectively. A total of 9 models, which are listed in Table I, were tested. To determine what weight factors should be assigned for the electrostatic and van der Waals interactions in equation (17), we took the advantage of the fact that the van der Waals forces are dominant for base-stacking stabilization, and they make a significant contribution to stabilization of the Watson-Crick hydrogen-bonding conformation.37 The balance between exchange repulsion and dispersion attraction, represented by the Lennard-Jones potential in our model, determines the equilibrium distance for base stacking. The same type of balance for Watson-Crick hydrogen bonding is affected more by electrostatic interactions, which shortens the equilibrium distance of the interacting bases. Considering the dominant presence of van der Waals interactions in base stacking and the significant presence of van der Waals interactions in hydrogen bonding, we decided that a good reproduction of the van der Waals interactions is more important than reproduction of the electrostatic interactions, and assigned wLJ = 1.0 and welec = 0.0 in the optimization procedure. It should be stressed here, that such an assignment of weights affects only the procedure for searching for the optimal positions r′ of the dipolar beads. Once such positions are found, the optimal dipole moments are computed as described in the section “Electrostatic energy”. This means that such an assignment of weights degrades the quality of the electrostatic potential only slightly because the procedure is still able to reproduce this potential relatively well, as can be seen in Figures 2 and 3. For all four bases, the electrostatic potential generated by the set of dipole moments of the 3445 model closely reproduces the major features of the electrostatic potential generated by the sets of partial charges of the AMBER force field. The sign of the electrostatic potential generated by positive/negative partial charges is preserved for the dipolar beads 3445 model as can be seen by comparing Figures (2a) with (2b) for Cytosine; (2c) with (2d) for Guanine; (3a) with (3b) for Thymine (with the exception of the methyl group); and (3c) with (3d) for Adenine.
Table I:
Nine tested models with different numbers of interaction centers.a
| 1 | 3 | 3 | 3 | 3 | 12 |
| 2 | 3 | 3 | 4 | 4 | 14 |
| 3 | 3 | 3 | 4 | 5 | 15 |
| 4 | 3 | 4 | 4 | 4 | 15 |
| 5 | 3 | 4 | 4 | 5 | 16 |
| 6 | 4 | 3 | 4 | 4 | 15 |
| 7 | 4 | 3 | 4 | 5 | 16 |
| 8 | 4 | 4 | 4 | 4 | 16 |
| 9 | 4 | 4 | 4 | 5 | 17 |
Each entry shows the number of interaction centers for the specified model and base. The last column shows the total number of interaction centers for the specified model.
Figure 2:
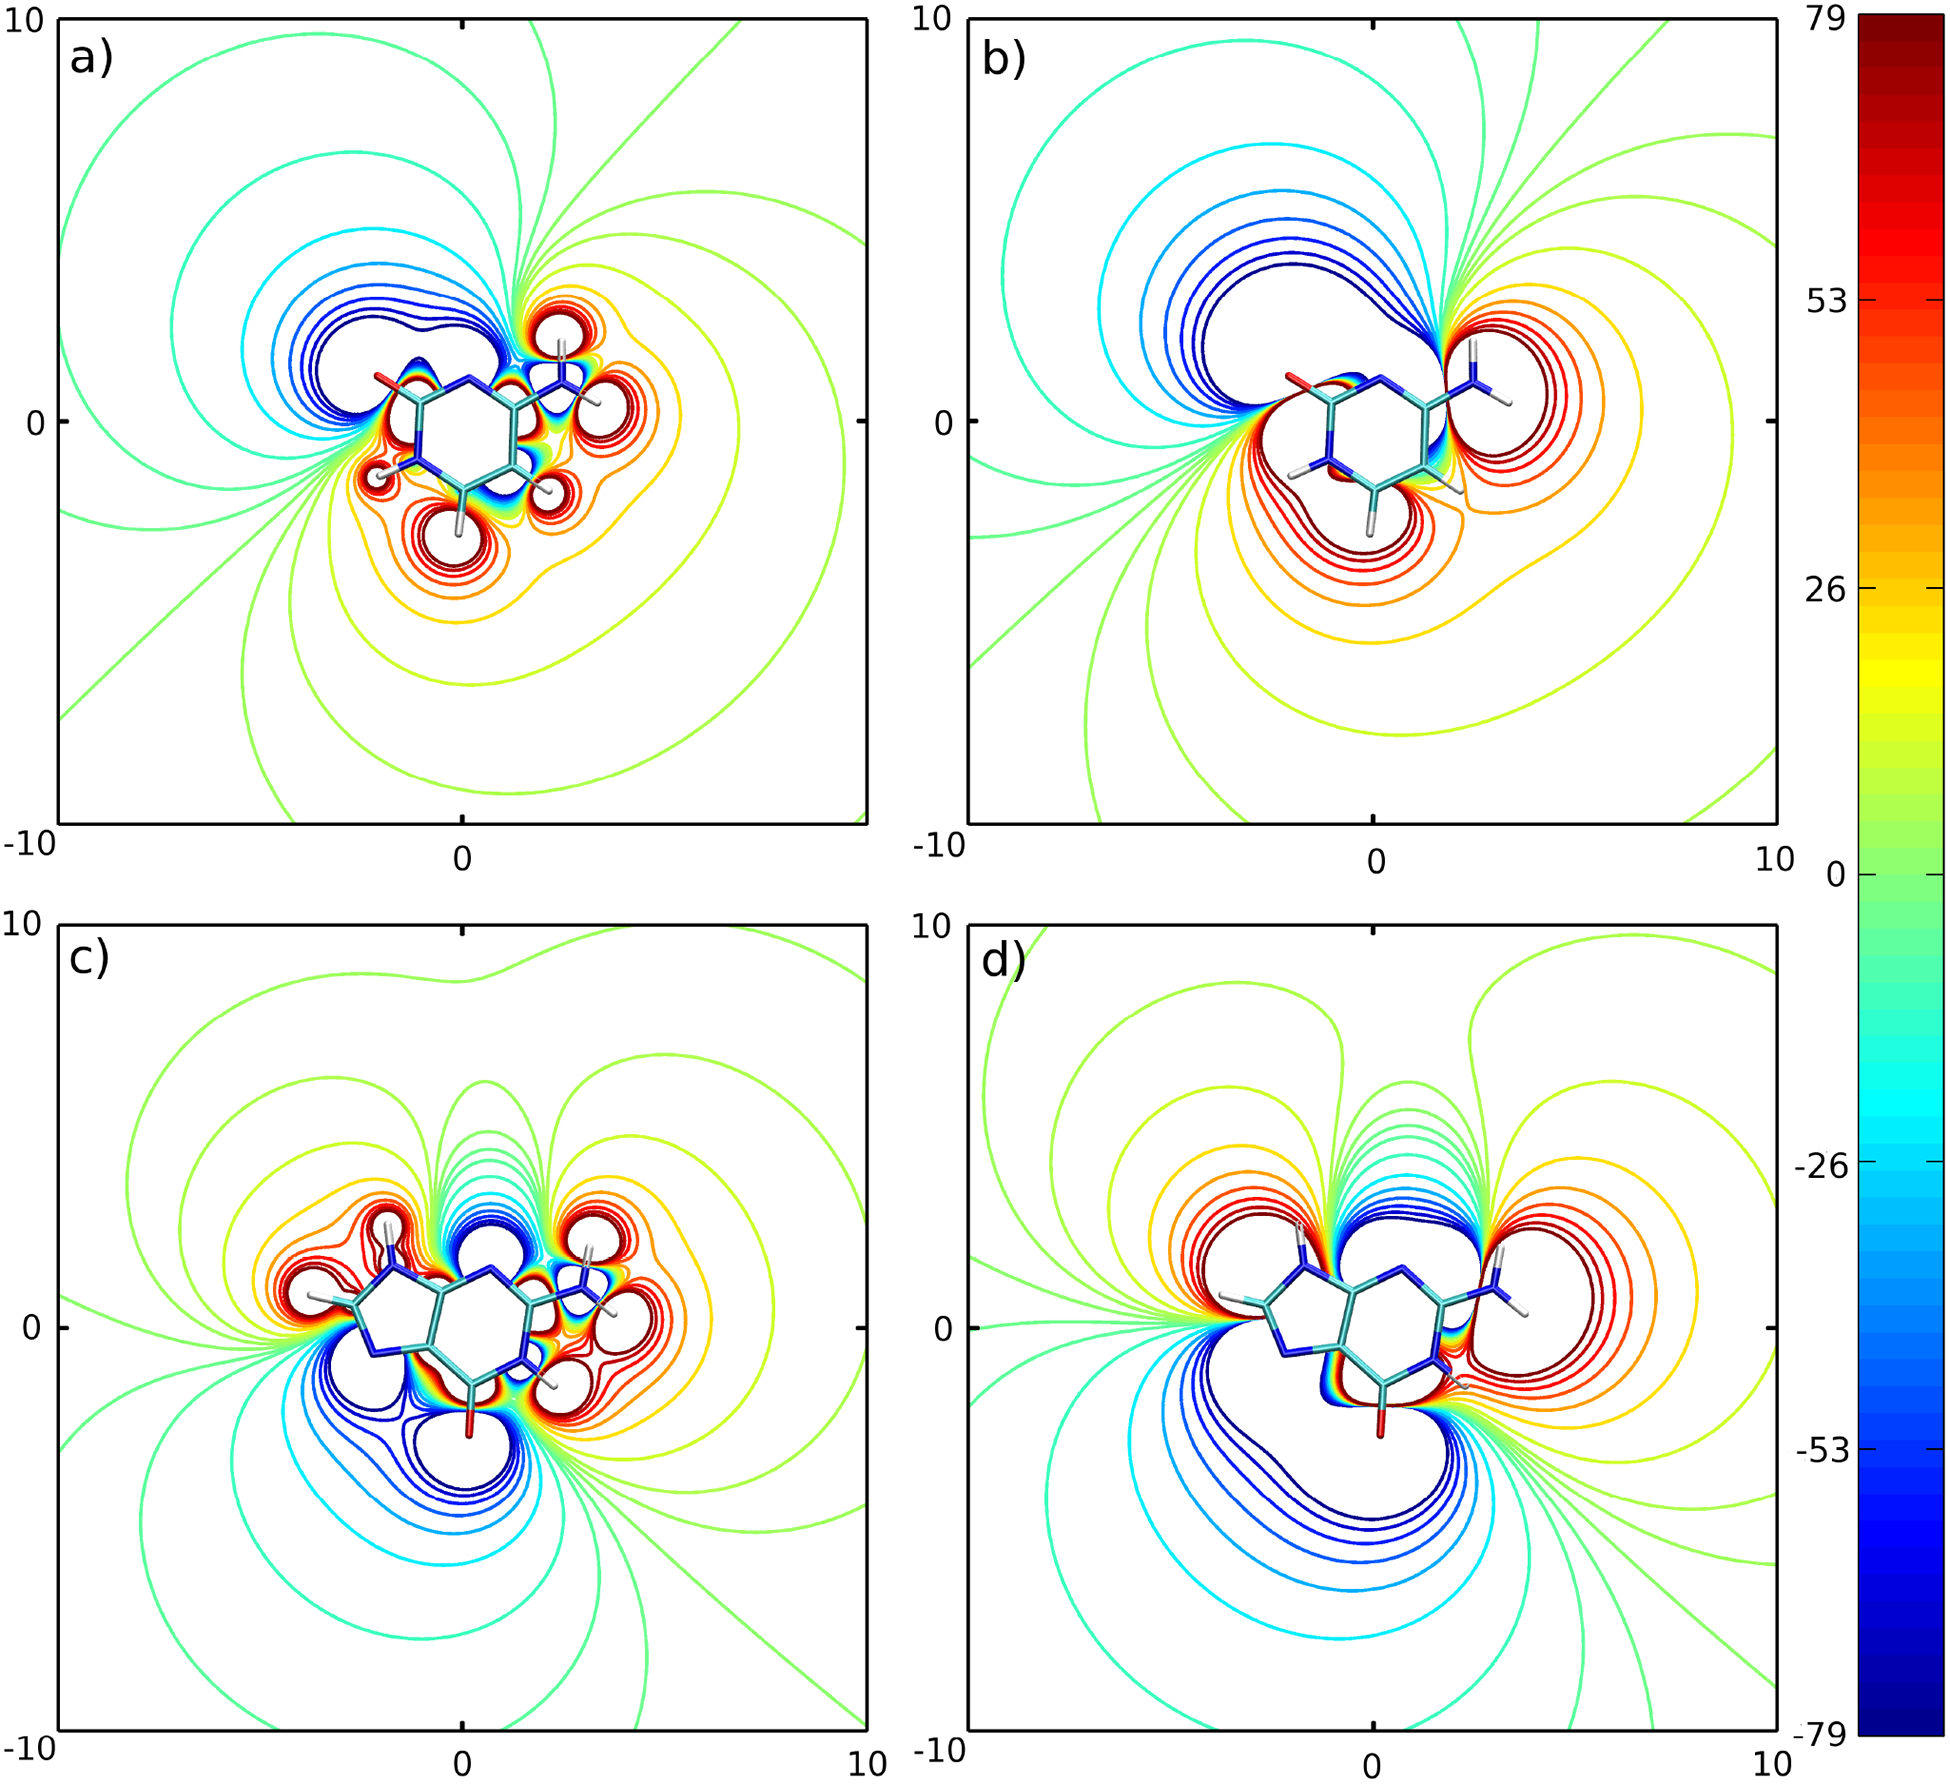
Contours comparing the electrostatic potential generated by a set of AMBER partial charges and by a set of dipole moments computed for the 3445 model. a) Cytosine - partial charges, b) Cytosine - dipole moments, c) Guanine - partial charges, d) Guanine - dipole moments. For clarity, the electrostatic potential inside rings is not shown. The spatial dimensions are given in Å and the electrostatic potential is given in kcal/mol.
Figure 3:
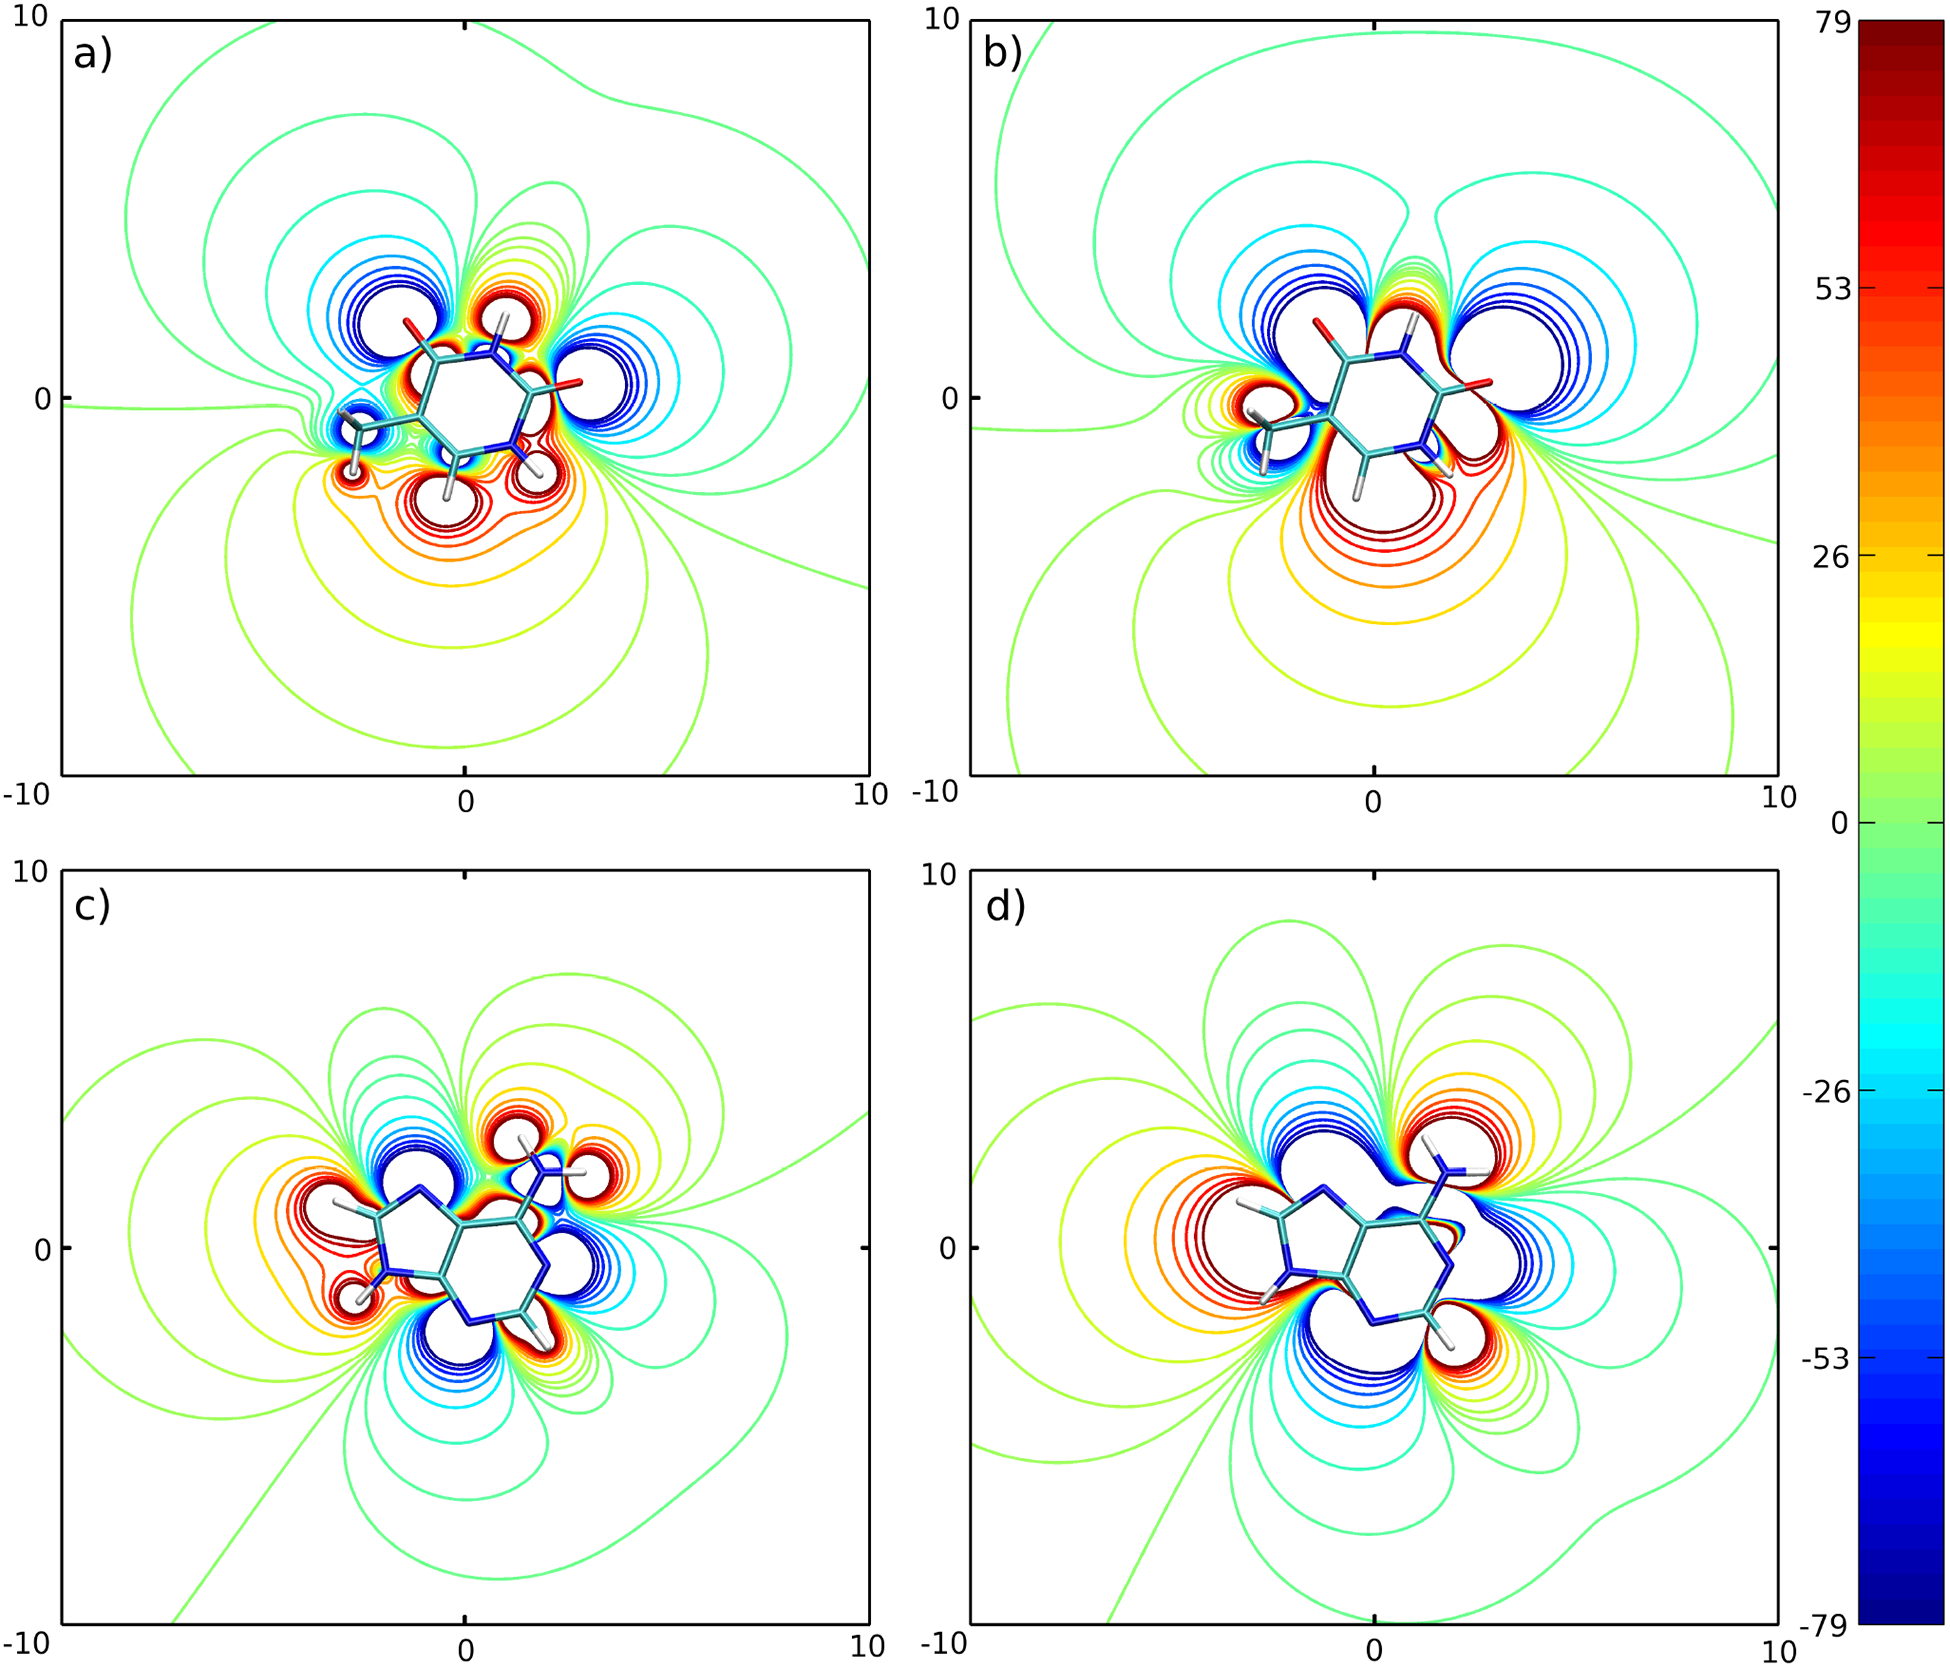
Same as Figure 2 for Thymine and Adenine.
Several criteria of the quality of the models were defined. First, the overall quality of reproduction of the van der Waals energy, the electrostatic potential, and the total energy is reflected by the relative-root-mean-square error (RRMS) defined as
| (18a) |
| (18b) |
| (18c) |
where UvdW is defined by equation (7), U′vdW is the reference (AMBER) van der Waals energy and the summation runs over all van der Waals grid points for selected pairs of interacting molecules. Velec is the electrostatic potential given by equation (13), V′elec is the reference (QM) electrostatic potential, and the summation runs over all electrostatic potential grid points generated for the selected molecules. Utotal is the total energy given by the sum of equations (7) and (16), U′total is the reference total energy evaluated at the van der Waals interaction grid points, and the summation runs over all grid points for selected pairs of interacting particles. The RRMS’s for all models are collected in Table II. The “selected pairs of interacting molecules” means either one pair of the same type of molecules e.g. G-G, C-C etc. shown in columns 2–5 of Table II or all ten possible pairs of interacting molecules shown in the last two columns of Table II.
Table II:
RRMS’s for different coarse grained models.a
| 1 (3333) | 22.4 | 30.5 | 61.8 | 46.5 | 37.8 | 40.6 |
| 2 (3344) | 22.3 | 30.4 | 36.7 | 45.9 | 31.3 | 33.1 |
| 3 (3345) | 22.3 | 30.3 | 37.0 | 43.0 | 30.9 | 32.6 |
| 4 (3444) | 22.2 | 27.6 | 37.4 | 45.6 | 30.4 | 31.1 |
| 5 (3445) | 22.2 | 27.5 | 37.6 | 43.1 | 30.0 | 30.7 |
| 6 (4344) | 21.3 | 29.9 | 36.7 | 45.7 | 30.9 | 33.0 |
| 7 (4345) | 21.4 | 29.8 | 37.1 | 43.0 | 30.5 | 32.5 |
| 8 (4444) | 21.2 | 27.4 | 37.3 | 45.4 | 30.1 | 31.0 |
| 9 (4445) | 21.2 | 27.4 | 37.4 | 43.4 | 29.8 | 30.6 |
The electrostatic potential RRMS’s computed for each of four bases are shown in columns 2–5 in normal type. The Van der Waals energy RRMS’s for pairs of like bases (e.g., G-G, C-C etc.) are shown in columns 2–5 in bold-face type. The total electrostatic potential RRMS’s for all 4 bases, and the total van der Waals energy-RRMS’s for all 10 possible pairs of interacting molecules are shown in the next-to-last column in normal and bold face type, respectively. The total-energy RRMS’s for all 10 possible pairs of interacting molecules are shown in the last column. All RRMS’s are computed according to equations (18a,b,c) as explained in “Results and Discussion”.
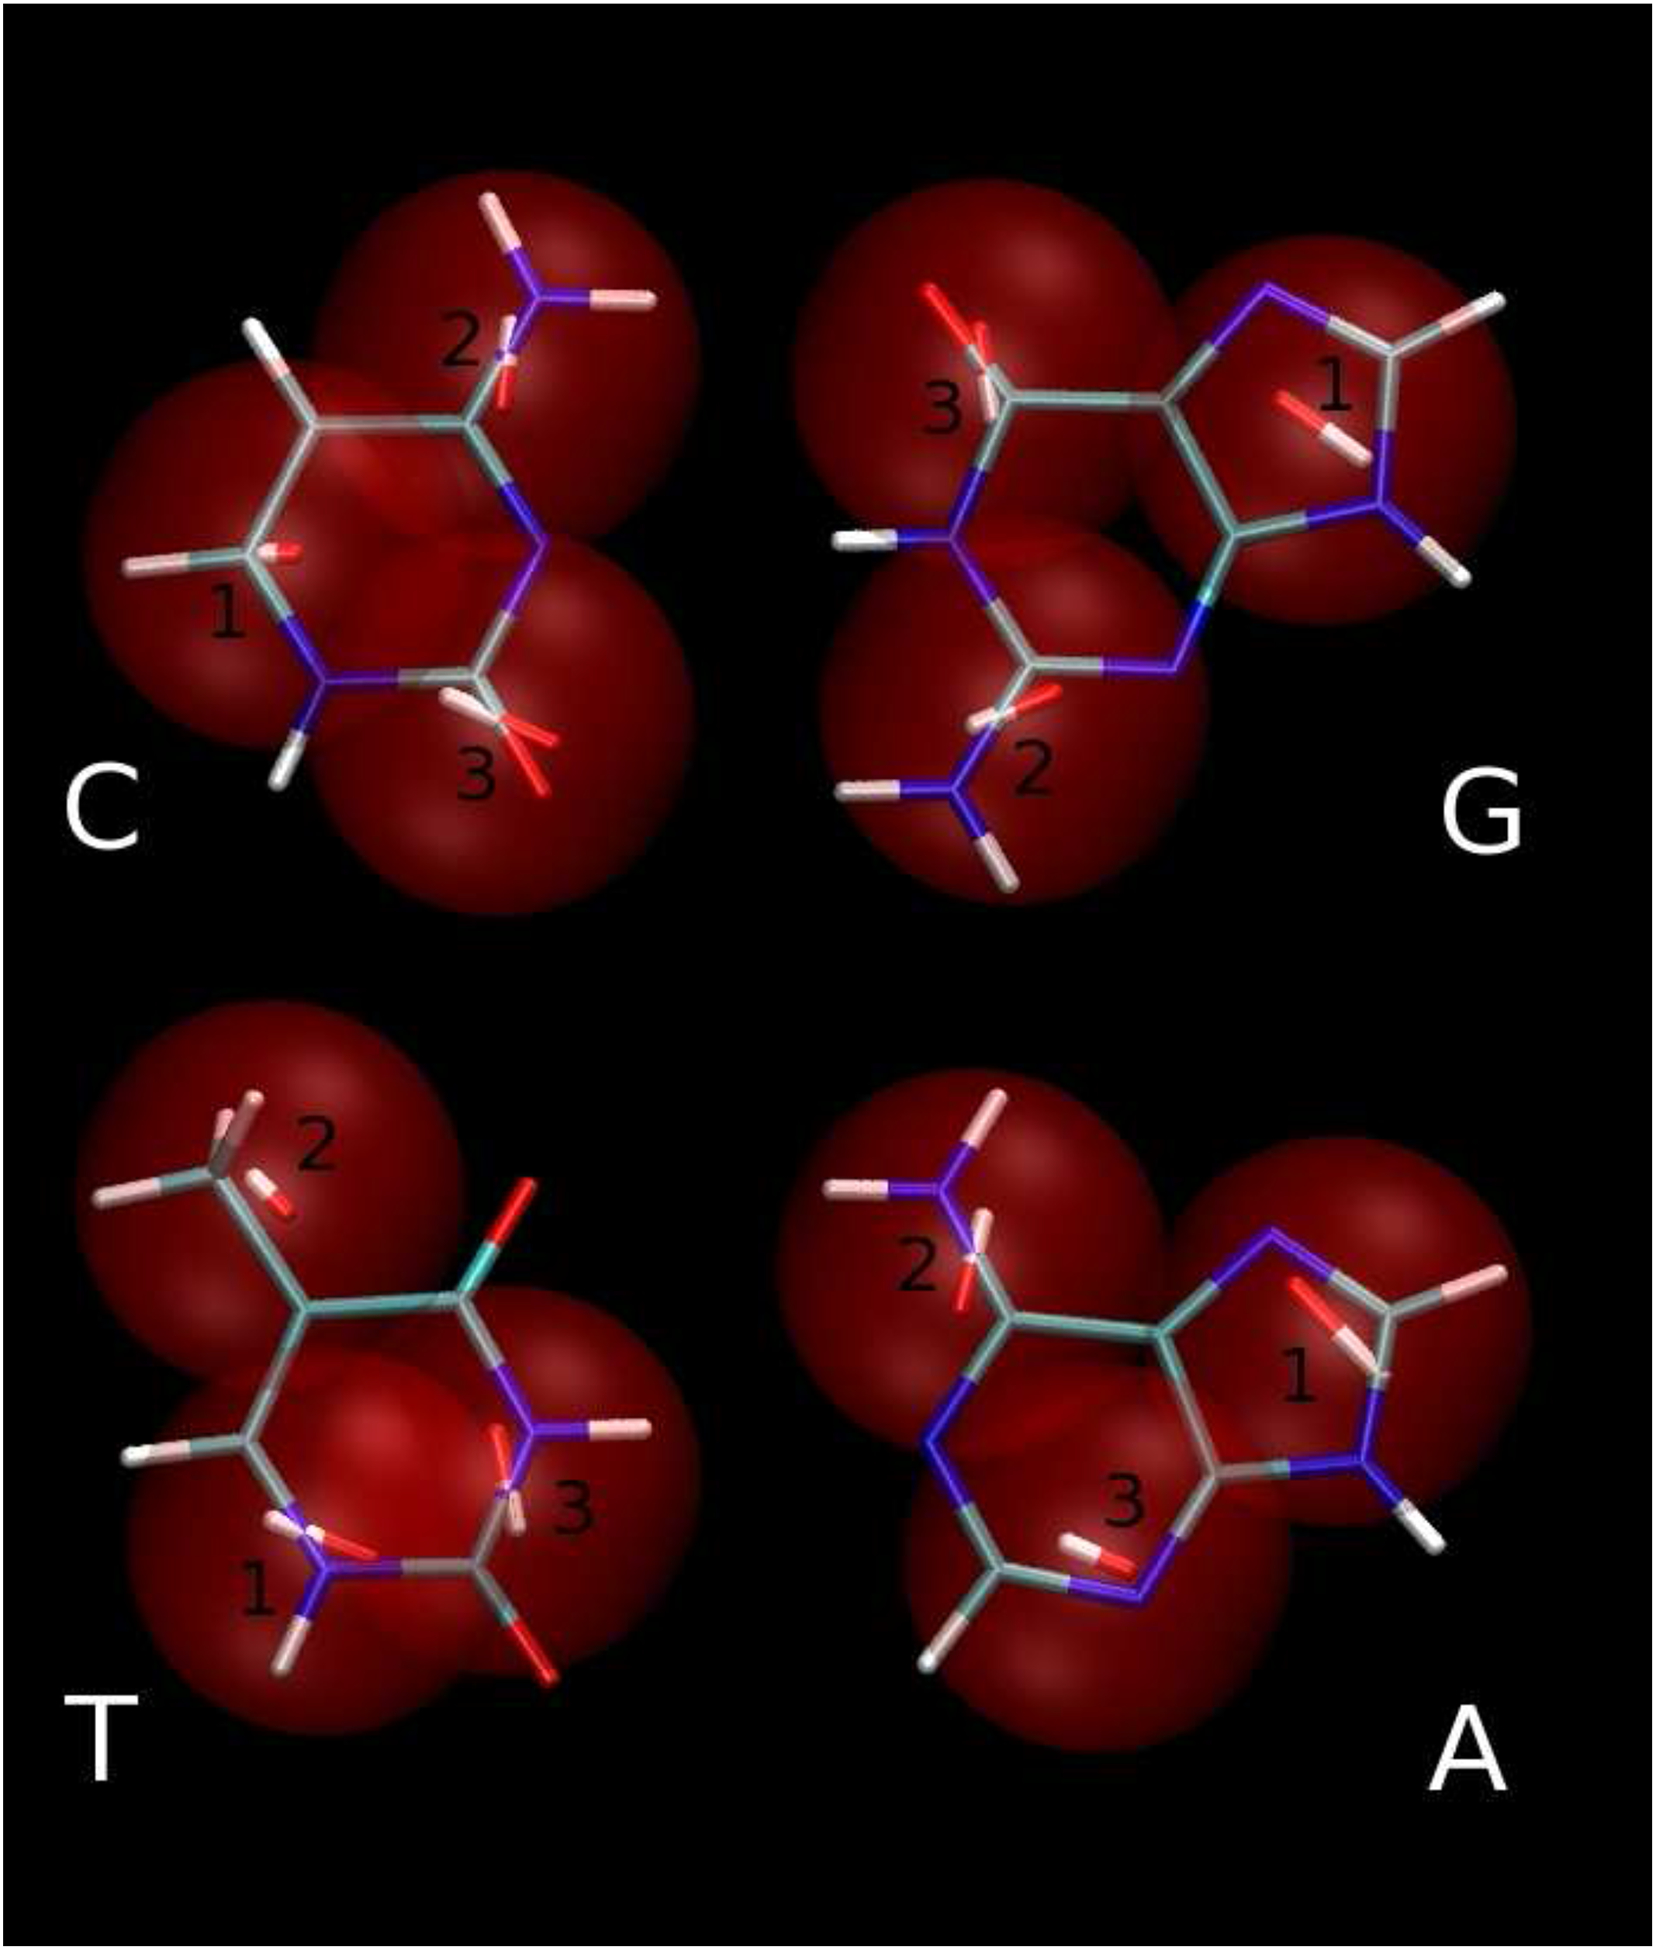
As expected, both the electrostatic and van der Waals RRMS’s decrease as the number of centers increases. For cytosine the quality of the reproduction of the electrostatic potential increases only slightly (the absolute value of the RRMS drops about 1%) as the number of the interaction centers is increased from 3 to 4. For the other pyrimidine (T), the change in the quality is dramatic (the absolute value of the RRMS drops about 25%). The optimization procedure tried to find good positions r′ of the interaction centers which will reproduce the shape (defined approximately by the van der Waals contact distances) of molecules. In Figure 4, generated by the VMD program,38 it can be seen that this goal is easier to achieve for cytosine, which lacks the bulky methyl group of thymine. The 4-center thymine model is shown in the Figure 5. The 3-center model of cytosine and the 4-center model of thymine reproduce the interface of the Watson-Crick hydrogen-bonding arrangement with two dipolar beads (see Figure 5) as opposed to the 3-center thymine model in which the interface of the Watson-Crick arrangement is reproduced by only one dipolar bead (Figure 4). As shown later in this section, the 1-center representation of the Watson-Crick interface in the 3333 model is not good enough for reproduction of the reference curve of energy vs separation distance.
Figure 4:
3333 model of bases overlapped on all-atom model. The dipolar beads are displayed as red spheres with dipole moments located at their centers. Dipole moments are shown as red (−) and white (+) sticks. Bases are arranged in the Watson-Crick hydrogen-bonding conformations C:G (upper pair) and T:A (lower pair). Figure generated by the VMD program.38.
Figure 5:
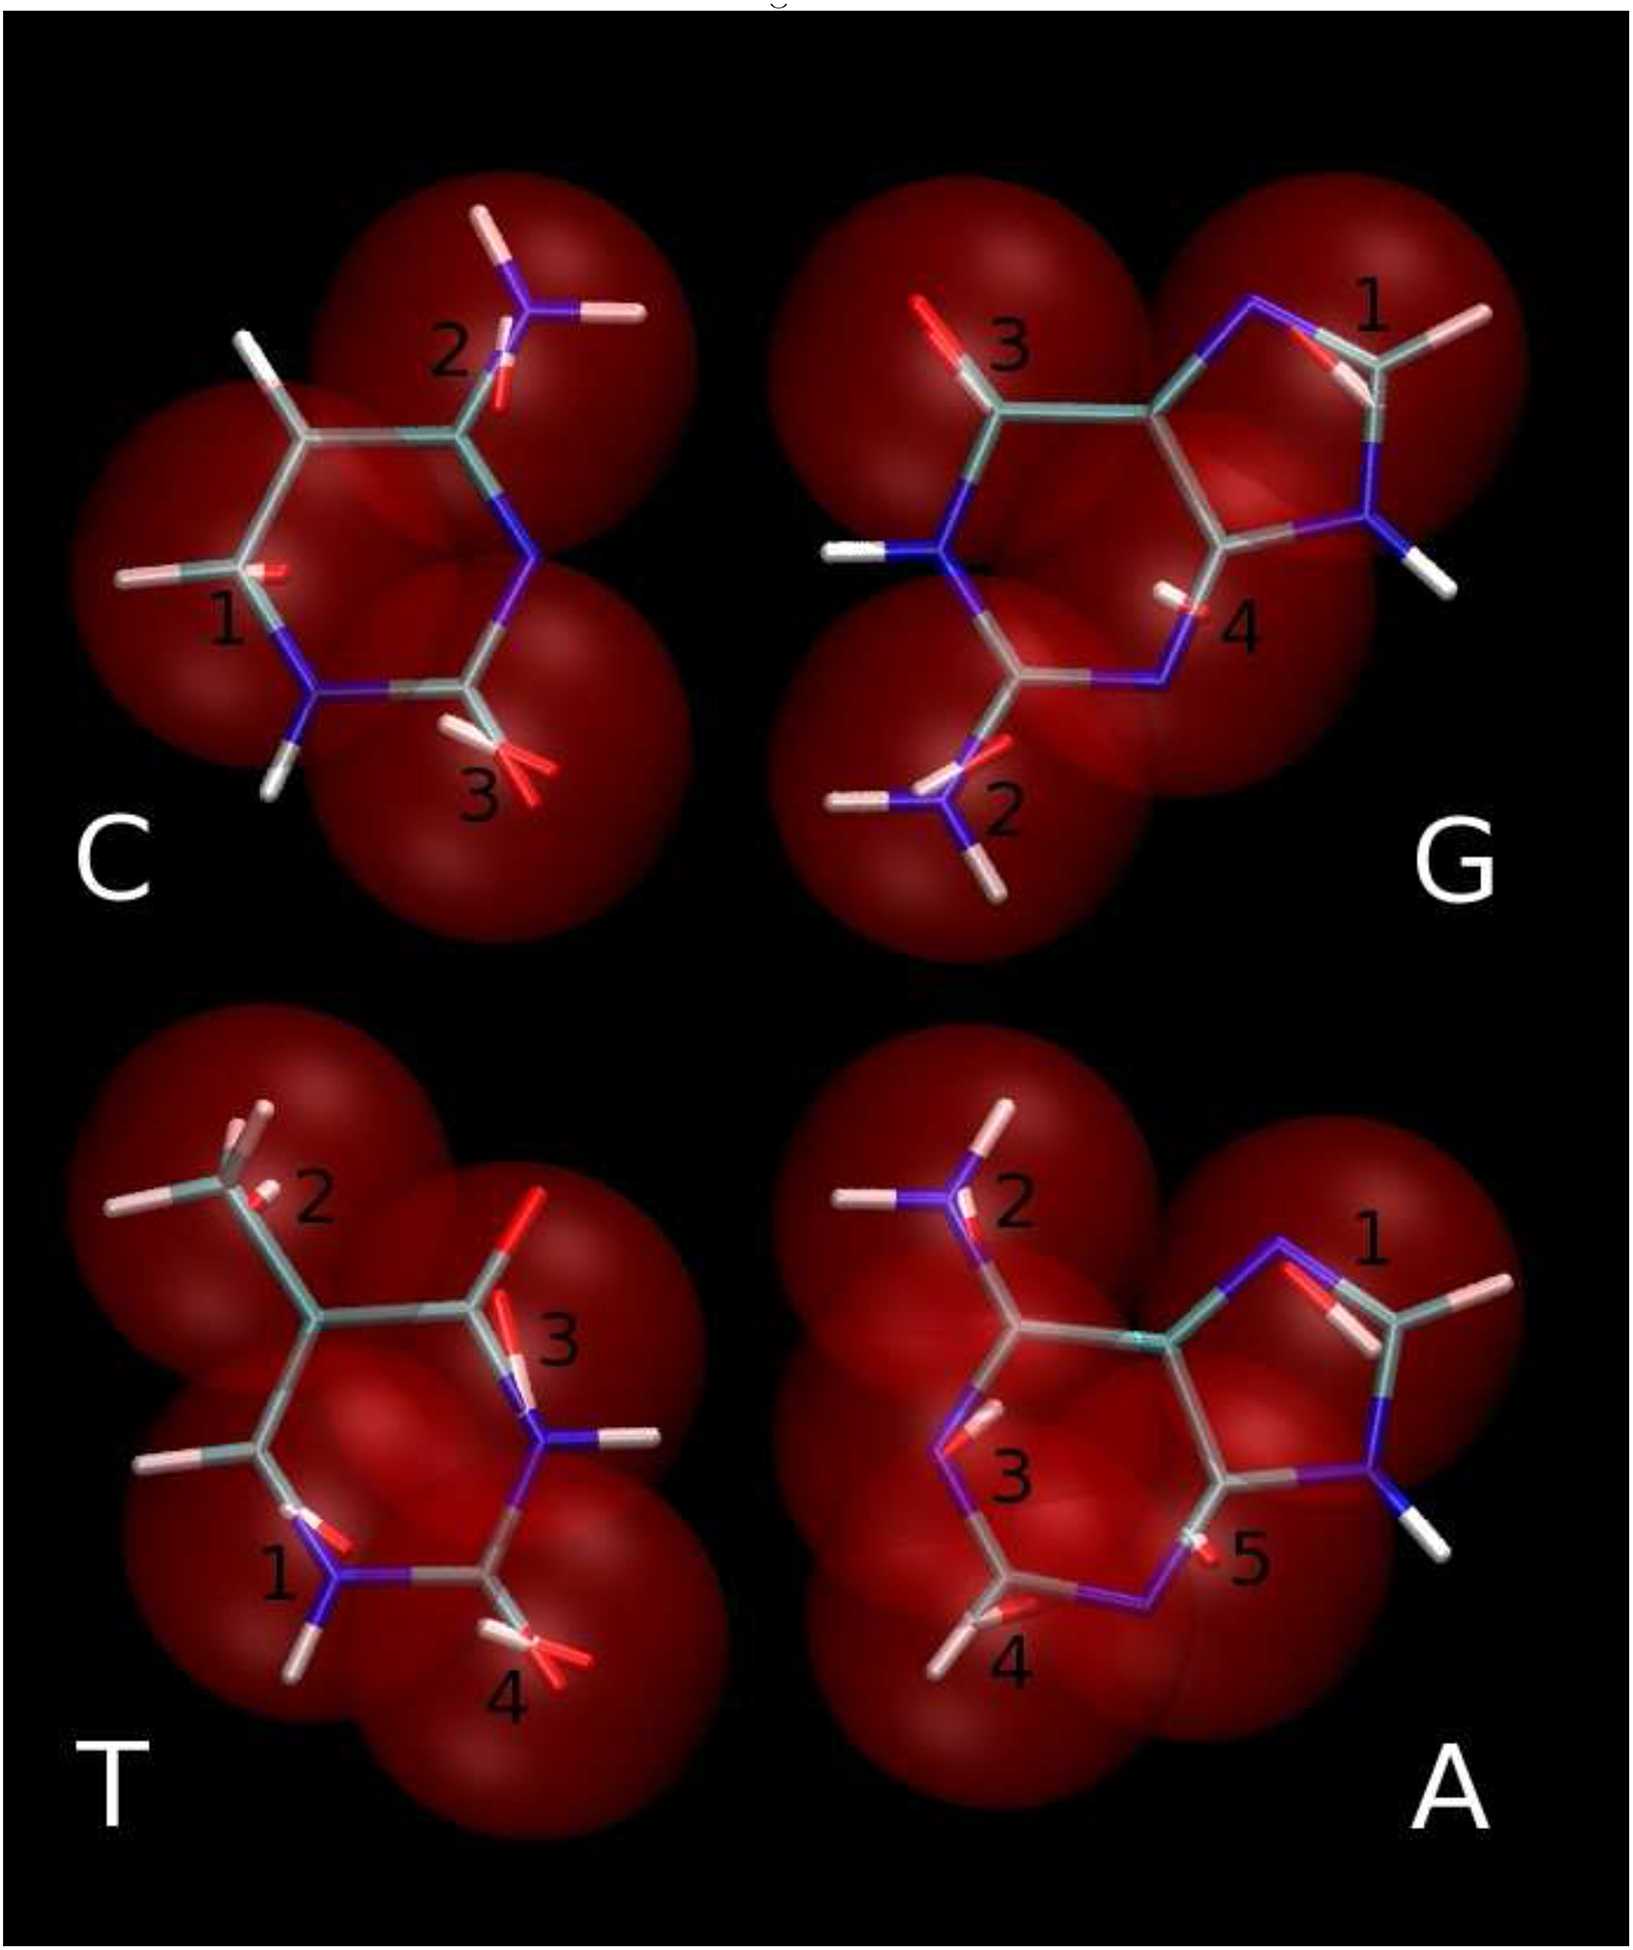
3445 model of bases overlapped on all atom model. Same as Fig. 4 for C:G (upper panels) and T:A (lower panels). Black numbers correspond to dipolar-bead names in Table III.
For both purines, the improvement in the quality of the fit of the electrostatic potential with increasing number of interaction centers is not as significant as for thymine, but considerably larger than for cytosine (Table II). Based on this electrostatic criterion, the 4-center model of guanine is only slightly better than the 3-center model. The electrostatic potential of adenine is most difficult to reproduce, and even the 5-center model fits the reference worse than the 3-center models of cytosine and guanine and the 4-center model of thymine. Because the 5-membered rings of both purines have identical topology and, therefore, very similar chemical properties, the reason for this problem lies in the reproduction of the electrostatics for the 6-membered ring of adenine. This fact is confirmed by the similarity of the positions and orientations, as well as the magnitudes, of the no. 1 dipole moments of both purines shown in Figure 5. Both 6-membered rings of the purines contain an amino group attached to the ring carbon (C2 for guanine and C6 for adenine, with the IUPAC nomenclature used for enumeration of atoms of nucleic acid bases39) which is connected to the nitrogen atom (N3 and N1 for guanine and adenine, respectively). These groups of atoms have a dipolar electrostatic character because the amino group generates a positive electrostatic potential, and the N3/N1 atoms generate a negative one. This is reflected by the dipole moment no. 2 of guanine in Figures 4 and 5 as well as by the dipole moment no. 2 of adenine, shown in the Figure 4. Substitution of the group of atoms: N1, H1, C6, O6 of guanine by one dipolar bead (no. 3) also appears reasonable (Figures 4 and 5). It seems that the problem of electrostatics in adenine depends on a good replacement of atoms C2, H2, N3 by the set of dipole moments. The dipolar character of this group is weaker than the groups described above because the partial charge of the H2 atom is only 0.0598 a.u. compared to e.g., 0.352 of H1 of guanine (in the AMBER force field). Therefore, more dipole moments must be used to improve the quality of reproduction of the electrostatic potential of adenine, as shown in Figure 5. An alternative solution of the problem would be inclusion of charges and possibly quadrupoles in the centers of the beads, but we rejected this approach because it would lead to a significant increase in the cost of the energy computation.
As can be seen in Figure (4) the Watson-Crick hydrogen-bonding interface of the 3-center adenine model is represented by one dipolar bead as was the case for the 3-center model of thymine. The 5-center model of adenine (Figure 5) improves the reproduction of the hydrogen-bonding interface significantly, which leads to improvement of the hydrogen-bonding energy profiles as shown later in this section.
Some conformations of nucleic acid bases are more important for their functionality than others. Hydrogen-bonding interactions are responsible for specific base pairing in DNA, while base-base stacking interactions are responsible for overall stability of the nucleic-acid chain. The reaction coordinates for these specific interactions were defined as follows. The Watson-Crick hydrogen-bonding reaction coordinate was defined by the arrangement of base pairs in the Watson-Crick hydrogen-bonding conformation (as shown in the middle panels of Figures 6 and 7) and by varying their separation along the vector N1-H1 of guanine and N3-H3 of thymine for C:G and A:T base pairs, respectively. For the stacking-interaction reaction coordinate, the standard reference frames for description of the base-pair geometry was used.33 For each of the ten possible base pairs, one of the bases was kept in the standard reference frame and the other was translated simultaneously along and rotated around the z-axis, as shown in Figure 8. The parameters for this transformation (i.e., the helical rise and helical twist) were those characteristic of the geometry of the B-DNA double-helix.40 The interaction energy of the coarse-grained bases along defined coordinates was computed and compared to those generated for the AMBER all-atom model.
Figure 6:
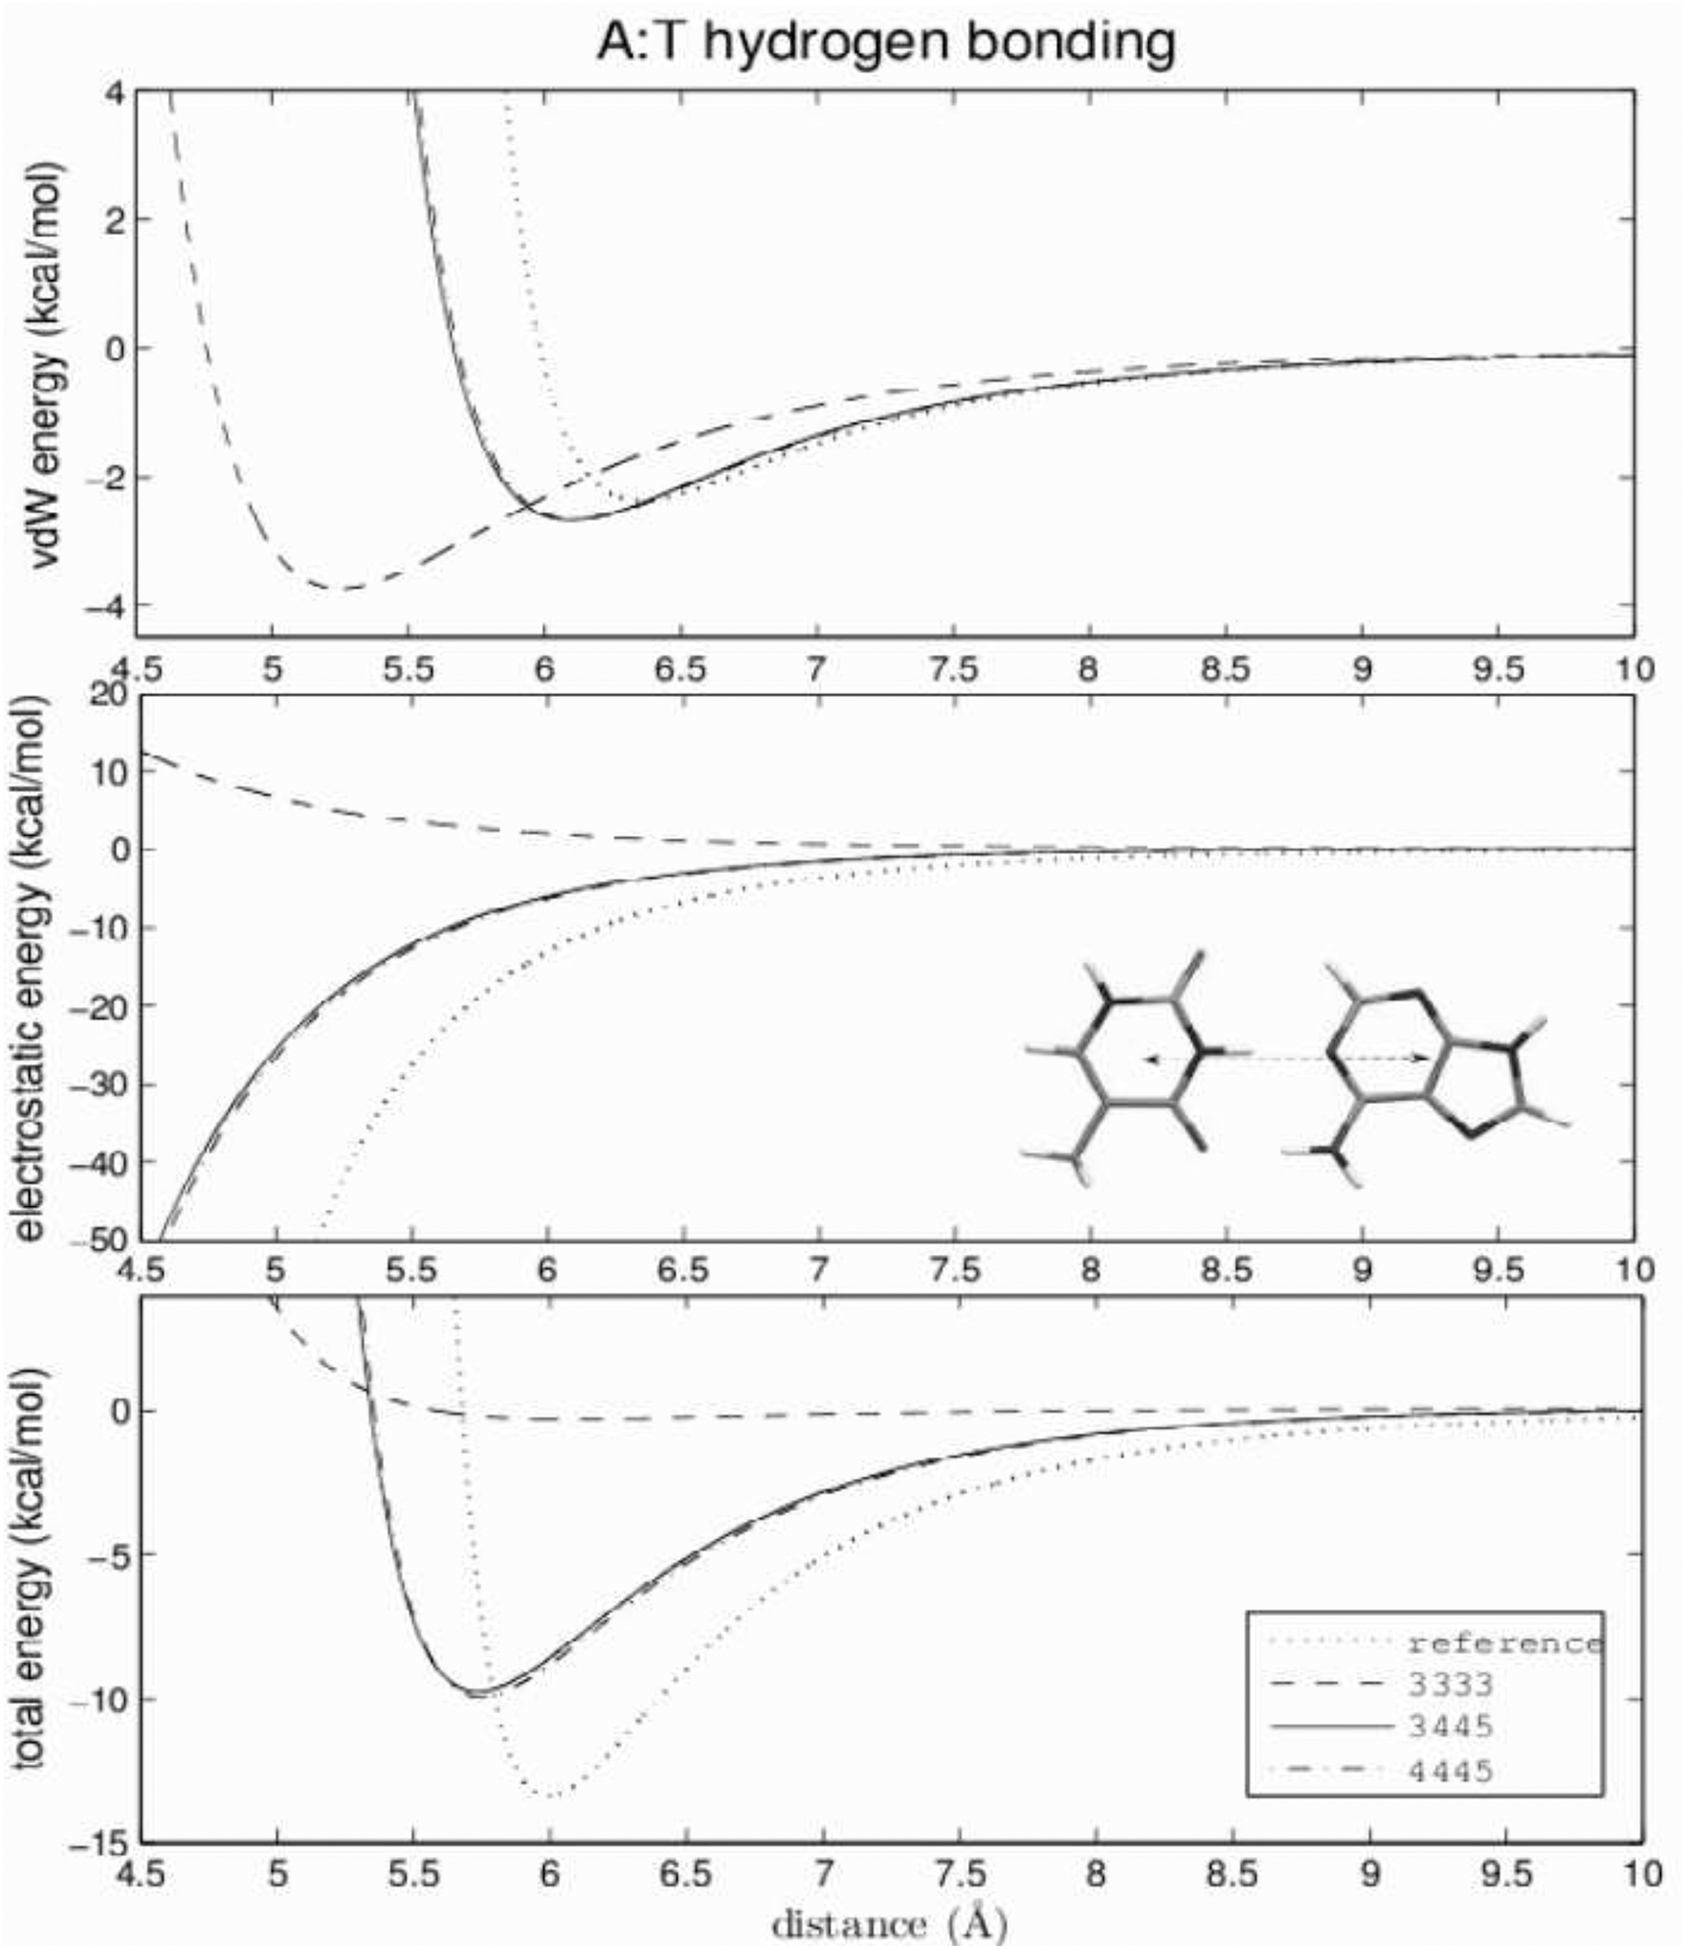
Hydrogen-bonding energies of three selected models and reference AMBER energies for the A:T base pair. Calculated by varying the center of mass distance along the hydrogen-bonding direction. The Watson-Crick hydrogen-bonding conformation is shown in the central panel.
Figure 7:
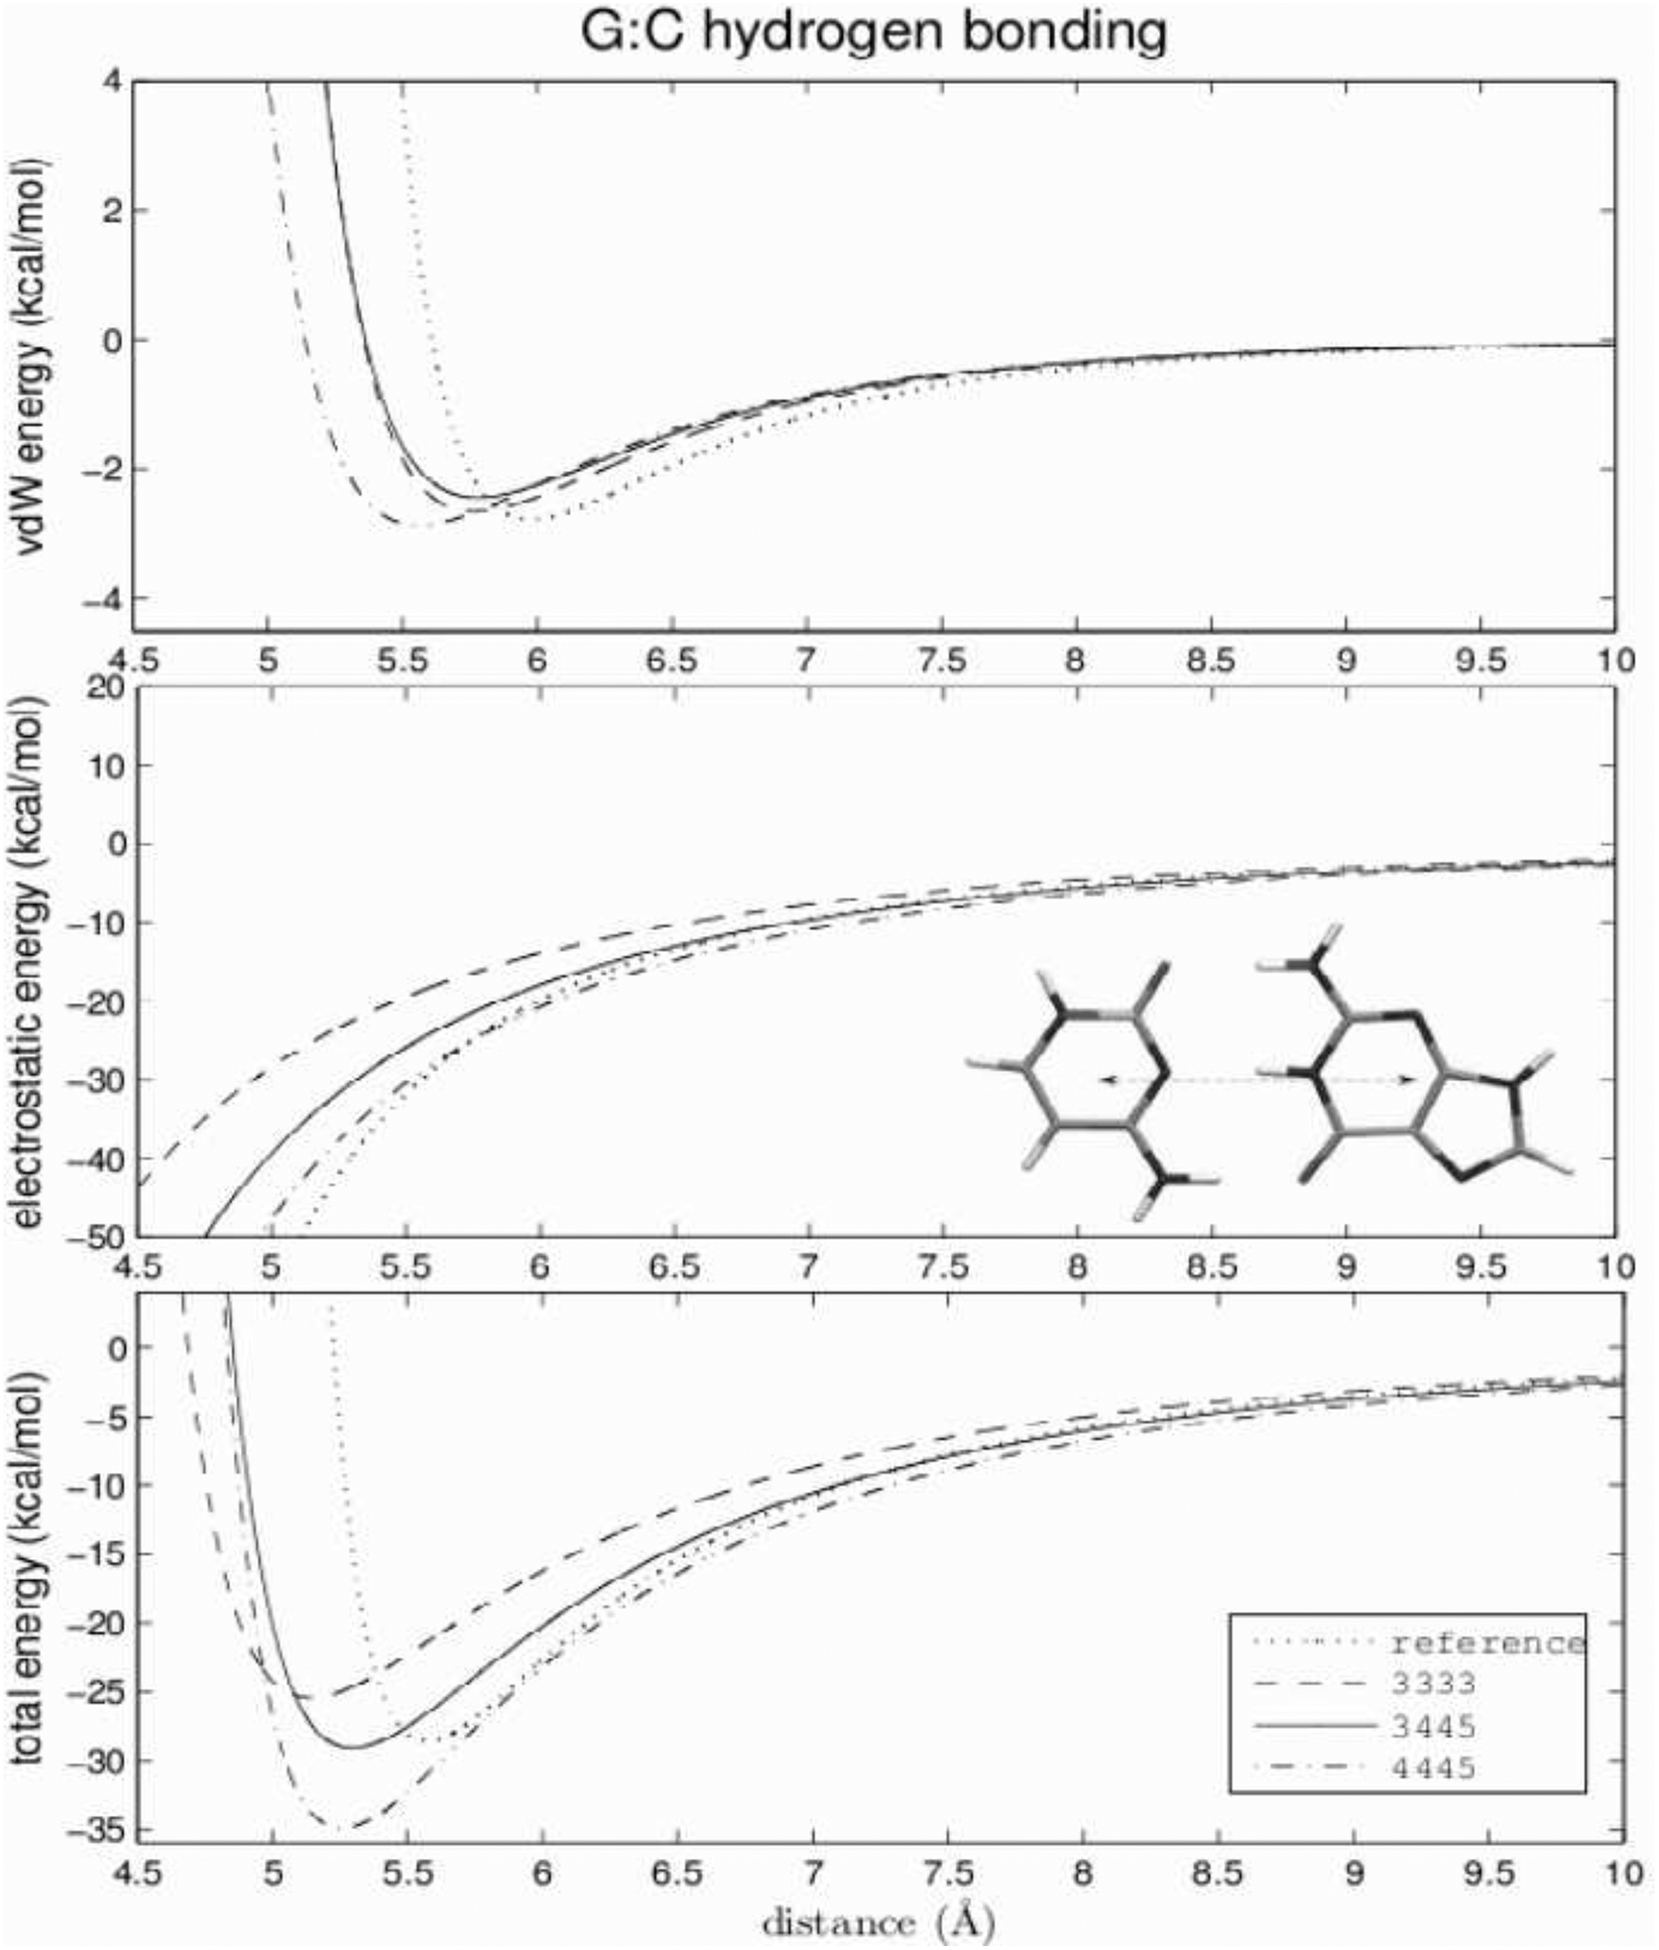
Same as Figure 6 for the G:C base pair.
Figure 8:
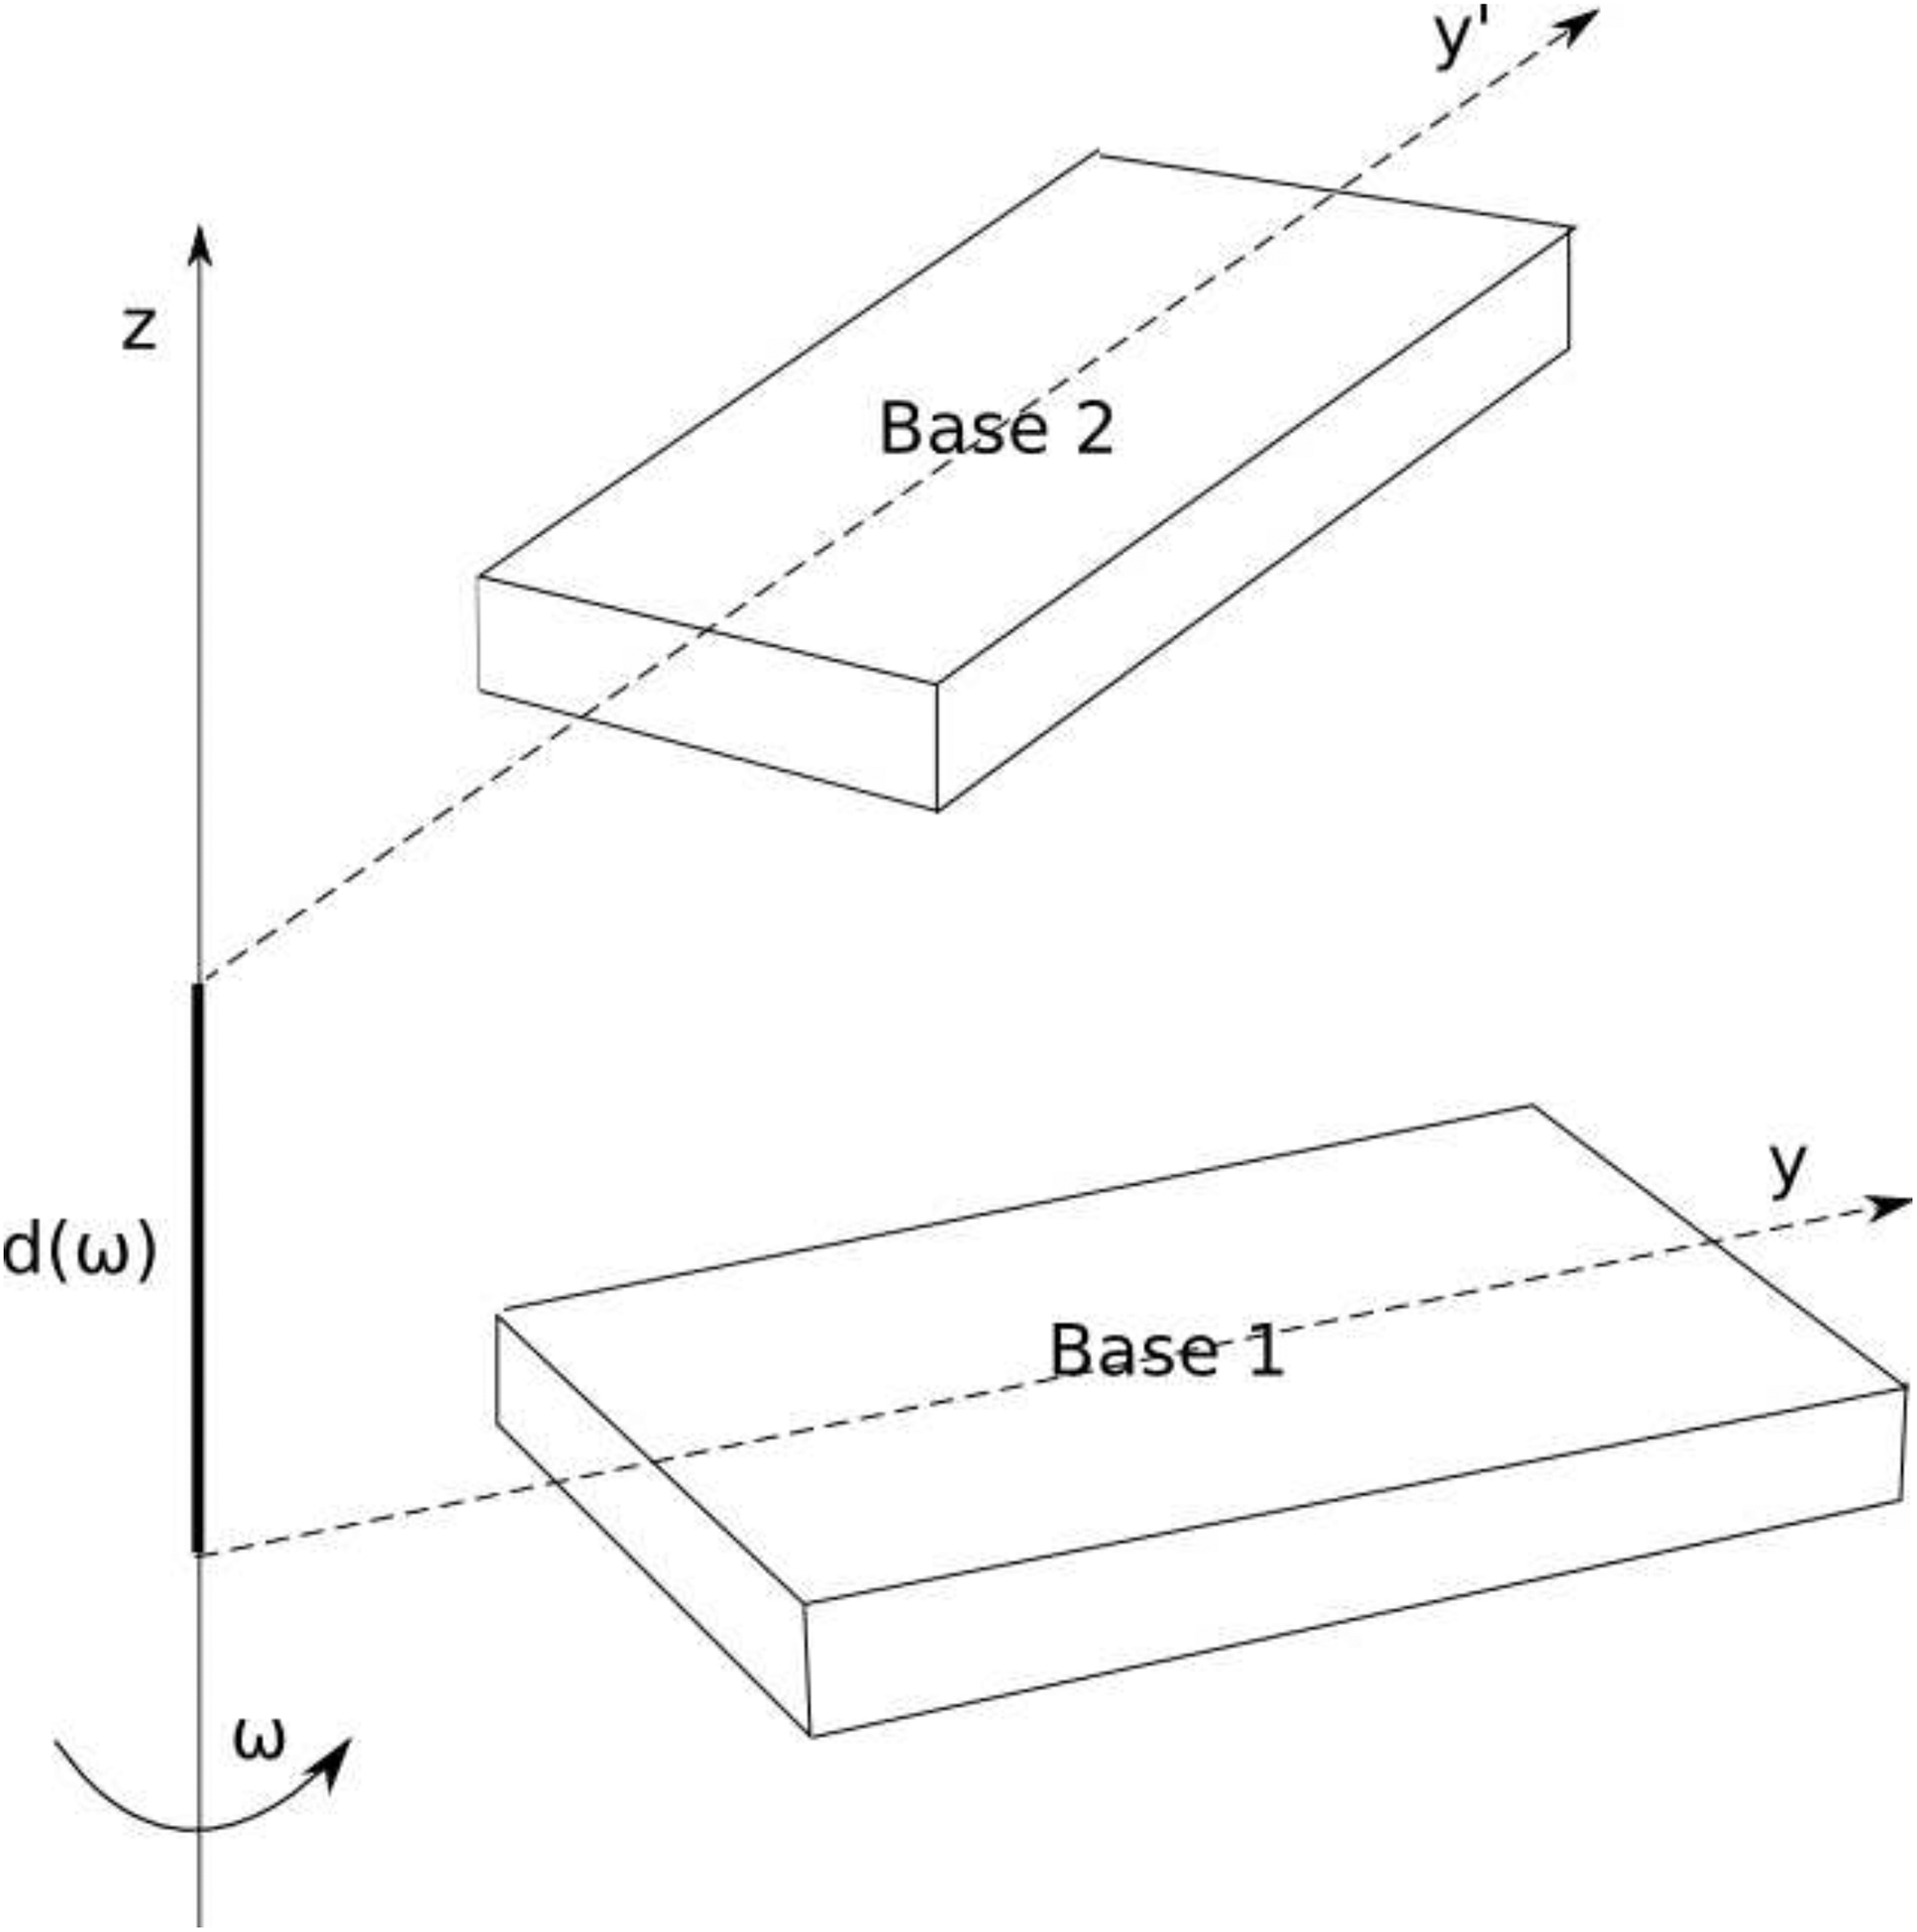
Schematic representation of the stacking reaction coordinate. Base 1 is placed in the standard coordinate system.33 Base 2 is simultaneously rotated around the z-axis by the angle ω and translated along the z-axis by the distance d(ω).40
The top panels of Figures 6 and 7 compare the van der Waals interbase energy between three selected models and the all-atom AMBER model for Watson-Crick hydrogen bonding. As examples, data for only the computationally cheapest 3-center model (dashed line), the most expensive 4445 model (dashed-dotted line) and the 3445 model (continuous line), are shown. The reference (AMBER) data are drawn with a dotted line. For the A:T base pair, the reproduction of the all-atom van der Waals energy curve is very good for all except the 3-center model. The equilibrium distance is about 0.3 Å too small and the minimum is about 0.5 kcal/mol too deep. These discrepancies arise from the fitting compromise between hydrogen-bonding and all other directions present in the grid. The position of the minimum in the G:C hydrogen-bonding curve is also slightly too small. The difference varies between 0.2 and 0.5 Å. The depth of the minimum varies between −2.4 and −3.2 kcal/mol (reference −2.75 kcal/mol).
The electrostatic energies of hydrogen bonding are shown in the middle panels of Figures 6 (A:T) and 7 (G:C). For the A:T base pair, the 3-center model fails completely, leading to unfavorable positive energy for hydrogen-bonding conformations. This observation confirms our former suggestions that the 3333 model, in which the Watson-Crick hydrogen-bonding interface of the A:T pair is modelled by only two dipolar beads (one for each base), and fails to reproduce the reference energy curve reasonably. All other models for A:T and G:C pairs underestimate the absolute value of the electrostatic energy. The error increases as the distance between the bases decreases, affecting mostly the high-energy close contact conformations rarely sampled in MD or MC simulations. The best reproduction of the electrostatic energy is the computationally most expensive 4445 model of the G:C base pair, although the absolute value of the electrostatic energy of close conformations is also underestimated.
The reproduction of Watson-Crick hydrogen-bonding total energies for canonical base pairs are shown in the bottom panels of Figures 6 and 7. For the G:C base pair, the positions of the minima are at most 0.5 Å smaller then the reference value. The depth of the minima varies between 25 and 35 kcal/mol which differs by ±5 kcal/mol from the reference value. Two models with 3-center cytosine and 4-center guanine [3444 (not shown) and 3445] reproduce the Watson-Crick energy curve in the identical best way. The position of the minimum of the total hydrogen-bonding energy differs by about 0.3 Å from reference, and the depth of the minimum is reproduced almost exactly. It should be noted that even the simplest model (3333) generates a reasonable energy curve with the position and depth of the minimum differing by about 0.5 Å and 3 kcal/mol, respectively, from the reference.
The Watson-Crick hydrogen-bonding total energy curve for the A:T base pair is more difficult to reproduce. The 3-center model (3333) fails completely, because of the repulsion of the dipole moments. For all other models, the positions of the minima are within 0.3 Å of the reference value, and the depths are smaller by 3 to 8 kcal/mol. Of the two best models (3444 and 3445) reproducing the G:C hydrogen-bonding total energy curve in the identical best way, the 3445 model performs much better in reproducing the A:T hydrogen-bonding energy.
Based on the quality of reproduction of the Watson-Crick hydrogen-bonding energy, the 3445 model was selected. The reproduction of base-pair stacking energies for this preselected model was checked. The stacking-reaction coordinate was defined by simultaneous translation and rotation of one base with respect to another in the standard coordinate system.33 The equations relating rigid-body translation to rotation, with the helical parameters characteristic for B-DNA,40 were applied. The stacking van der Waals energy curves for ten possible pairs are shown in Figure 9. The model and reference energy curves overlap almost perfectly. The largest difference in the position of the energy minimum is 0.15 Å for the G:T base pair, and the average difference of the equilibrium distance is only 0.07 Å for all 10 pairs. For all pairs but one, the minimum is slightly too shallow. Only one minimum of the C:A pair is deeper than the reference by about 0.2 kcal/mol. The deviation of 1.1 kcal/mol, observed for one C:A minimum is the largest among all 10 pairs. The average deviation of the absolute value of the well-depths of all 10 pairs from the references is only 0.5 kcal/mol.
Figure 9:
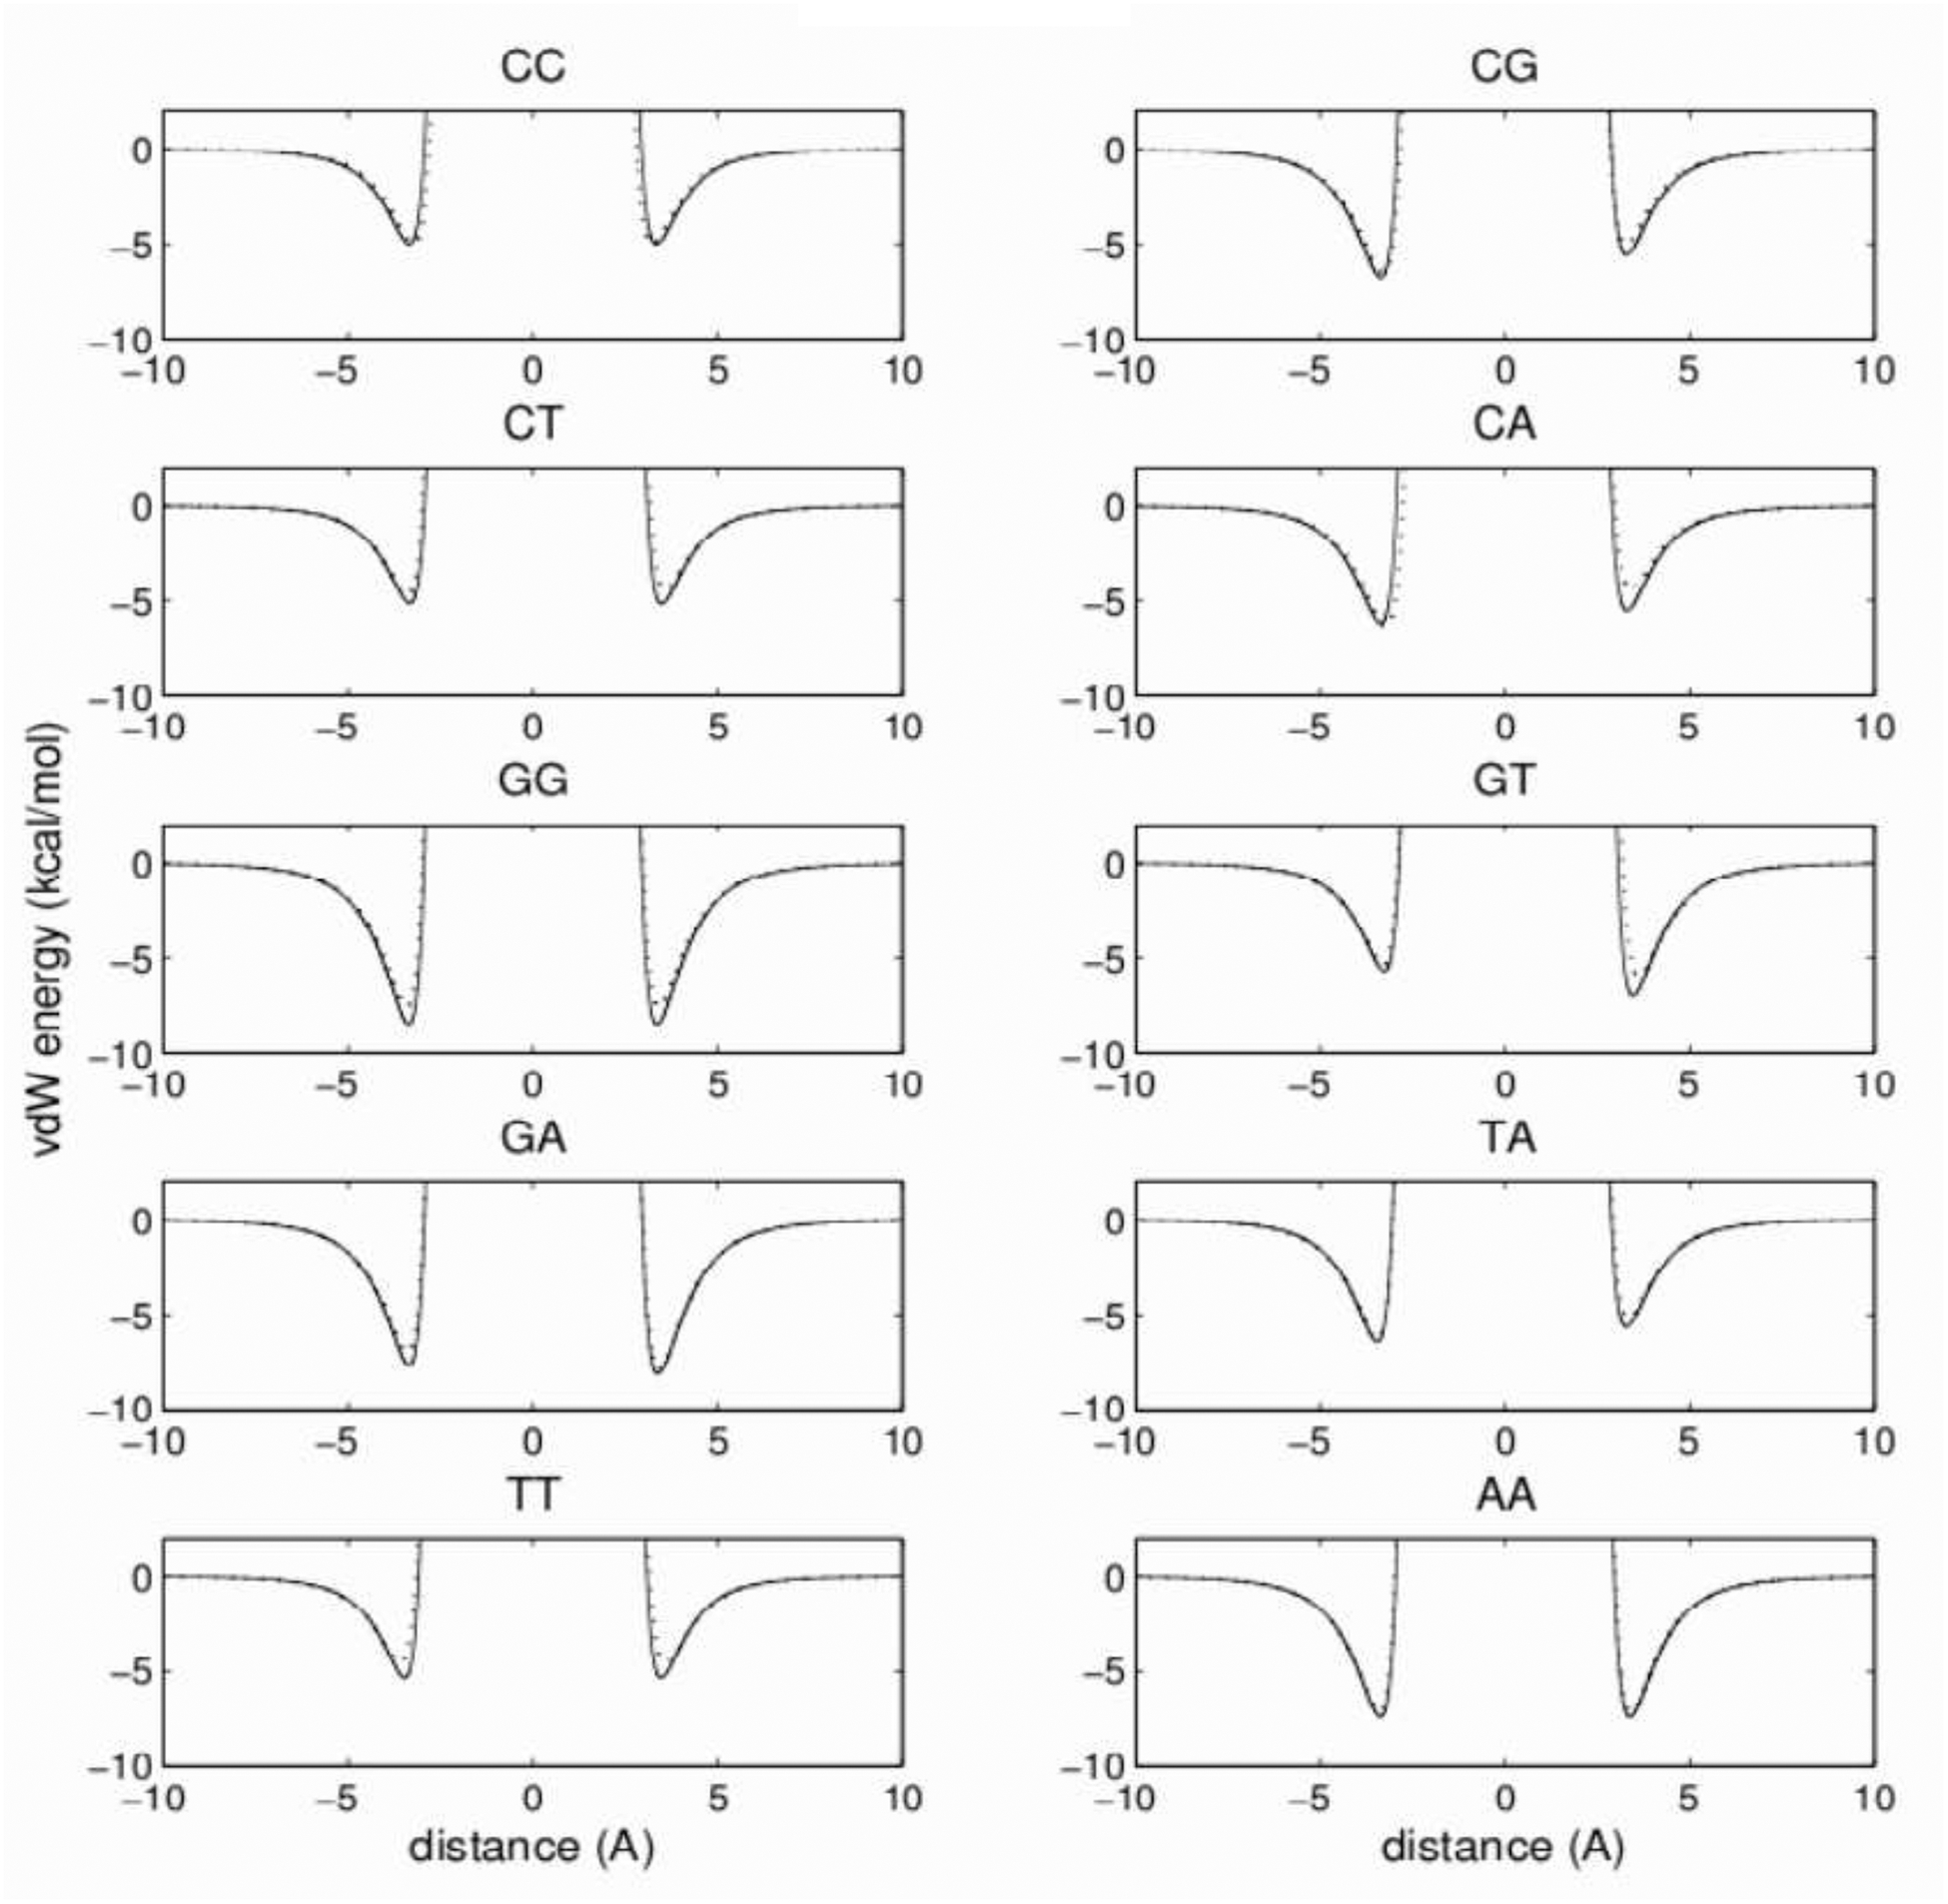
Stacking van der Waals energies for all ten possible base pairs of the 3445 model, calculated by simultaneous translation of the second base along the axis perpendicular to the molecule in both directions, and rotation in the standard coordinate frame (see text). The AMBER reference and 3445 model energies are drawn with solid and dotted lines, respectively.
The reproduction of the electrostatics of the stacking interactions is not as good as for the van der Waals part. The best agreement is obtained for the C:C and G:G base pairs (Figure 10). Other base pairs show qualitative agreement with the reference. The largest discrepancies between these curves occur for distances shorter than the van der Waals contact distance, influencing only the high-energy repulsive part of the total energy. This should not significantly affect MC/MD simulations. In the close vicinity of the minima of the van der Waals energy, the discrepancies among the electrostatic energies are relatively small. As a consequence, the good reproduction of the van der Waals energies is not severely affected by not-as-good reproduction of the electrostatics, as can be seen in Figure 11, which shows the total energy curves of the stacking interactions. The position of the total energy minima is practically unaffected by electrostatics, and the average difference among all 10 pairs between the model and reference remains small, about 0.07 Å. The depth of the minima is more affected, with the average difference from the reference increasing to about 1.6 kcal/mol.
Figure 10:
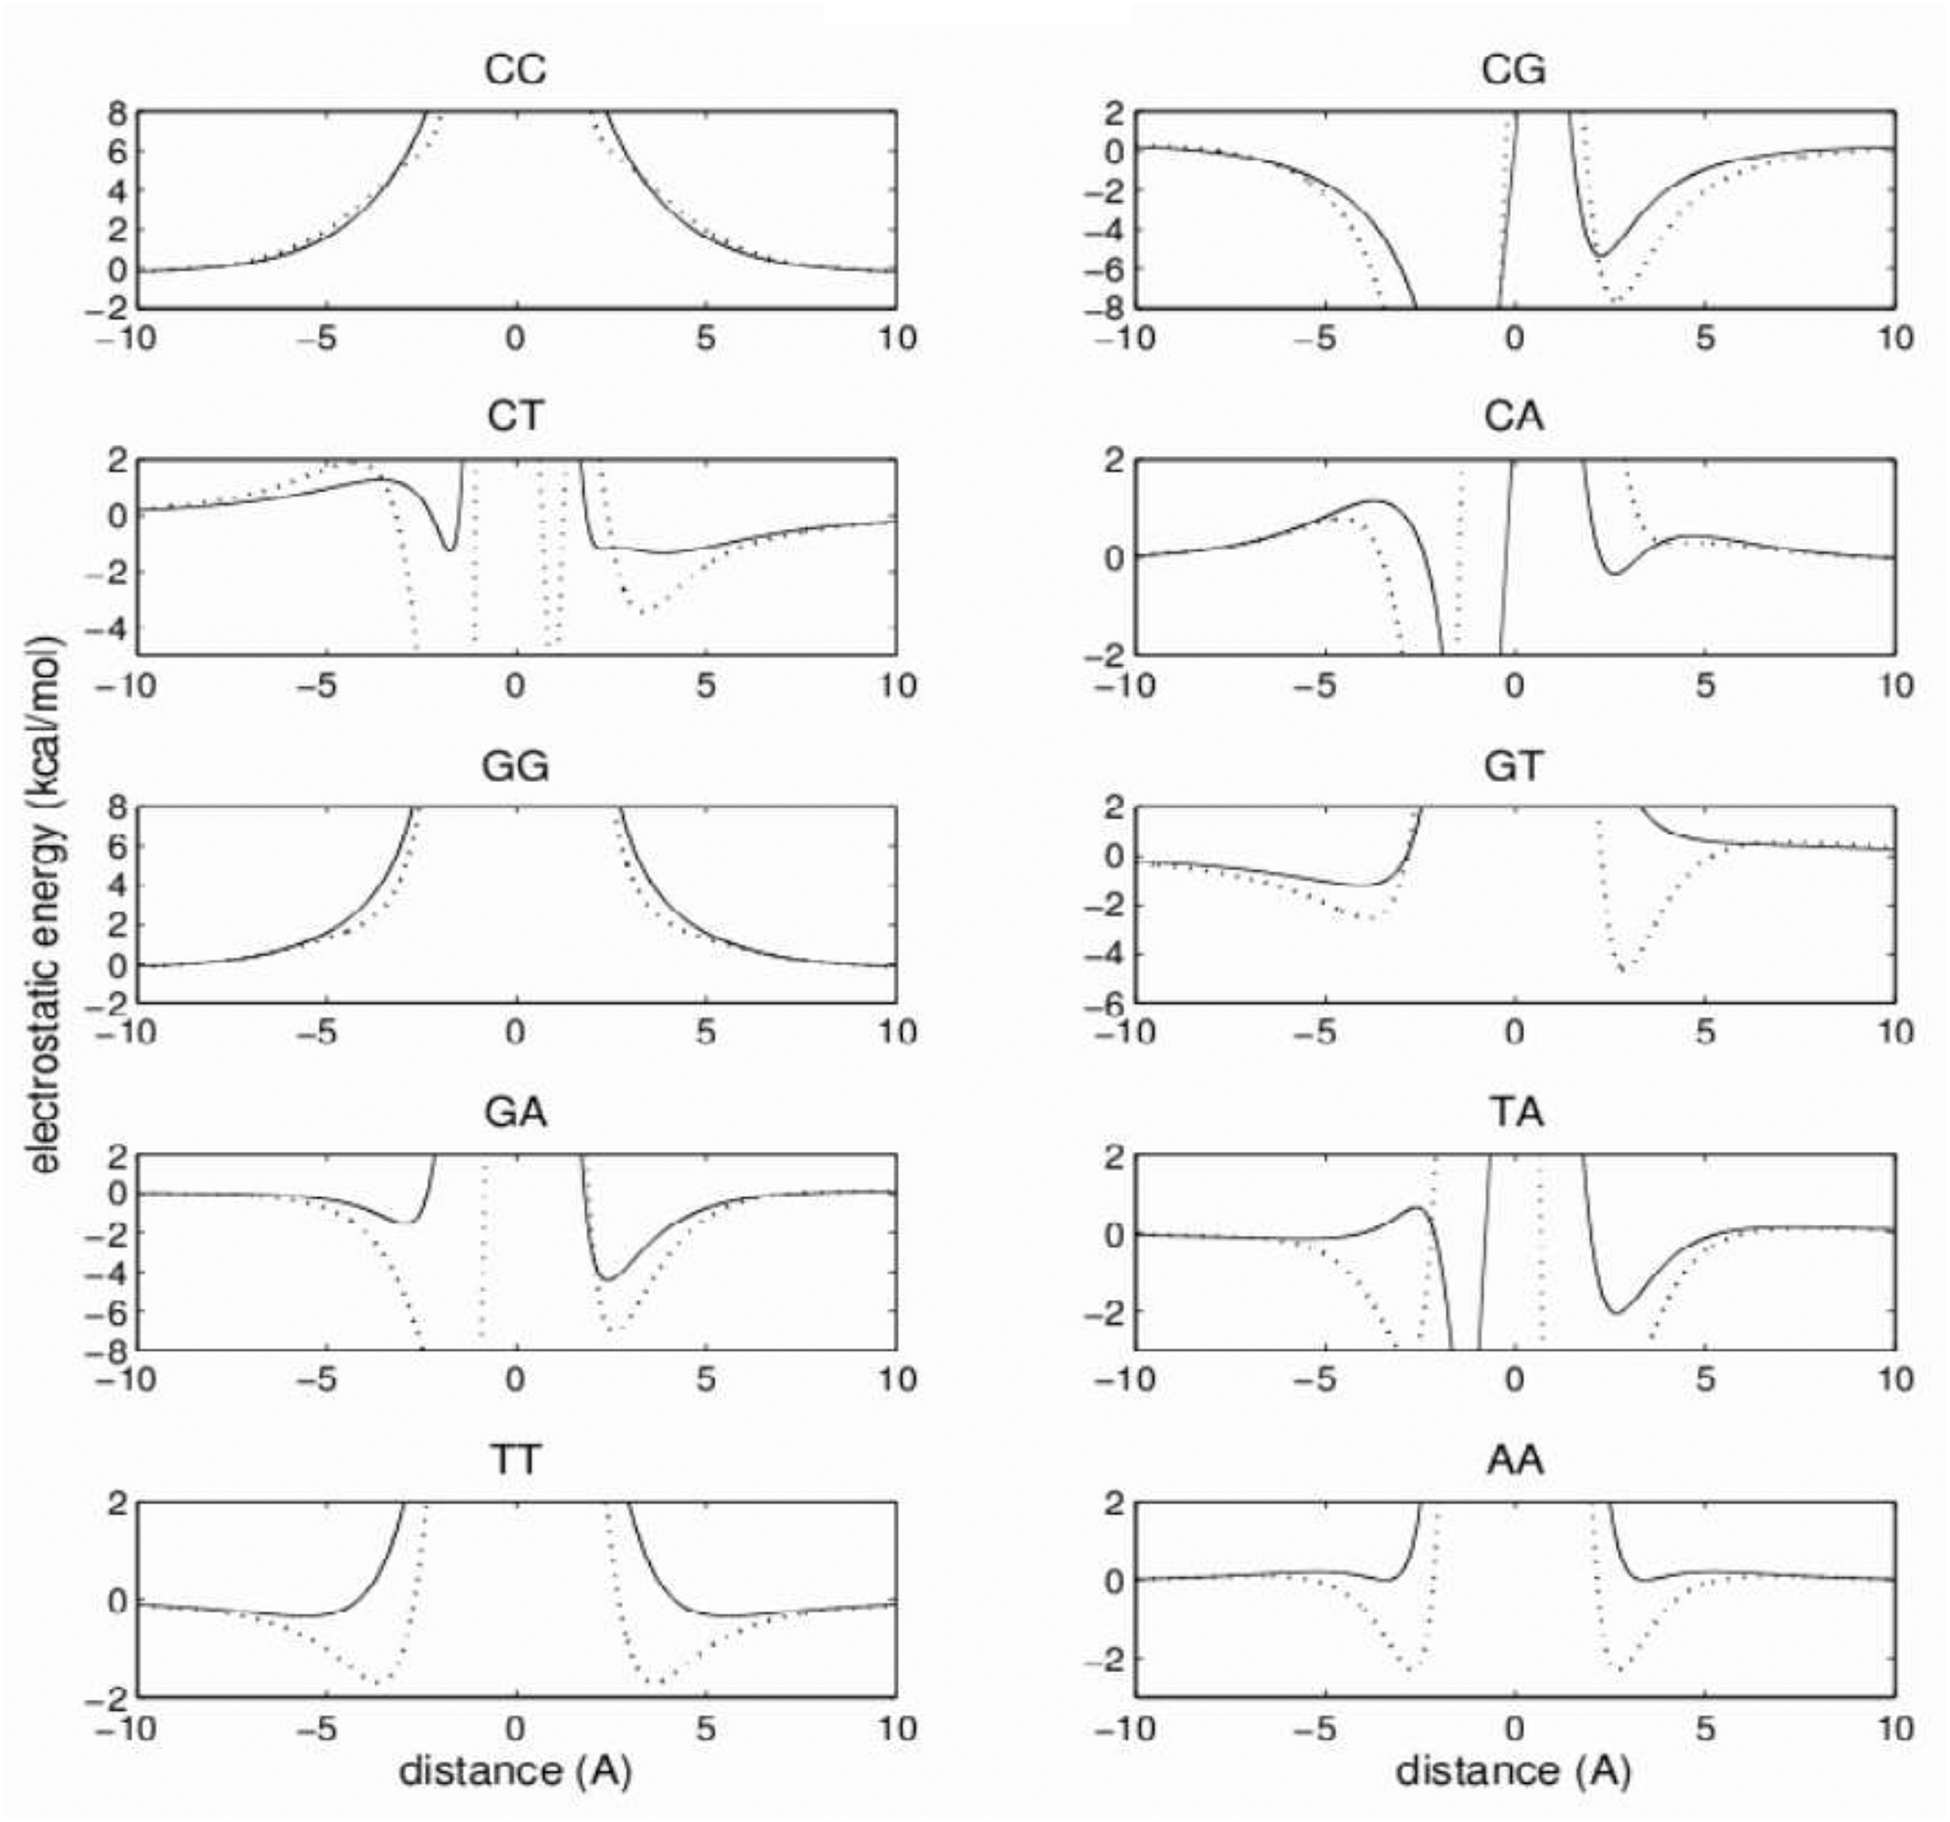
Same as Figure 9, but for stacking electrostatic energies.
Figure 11:
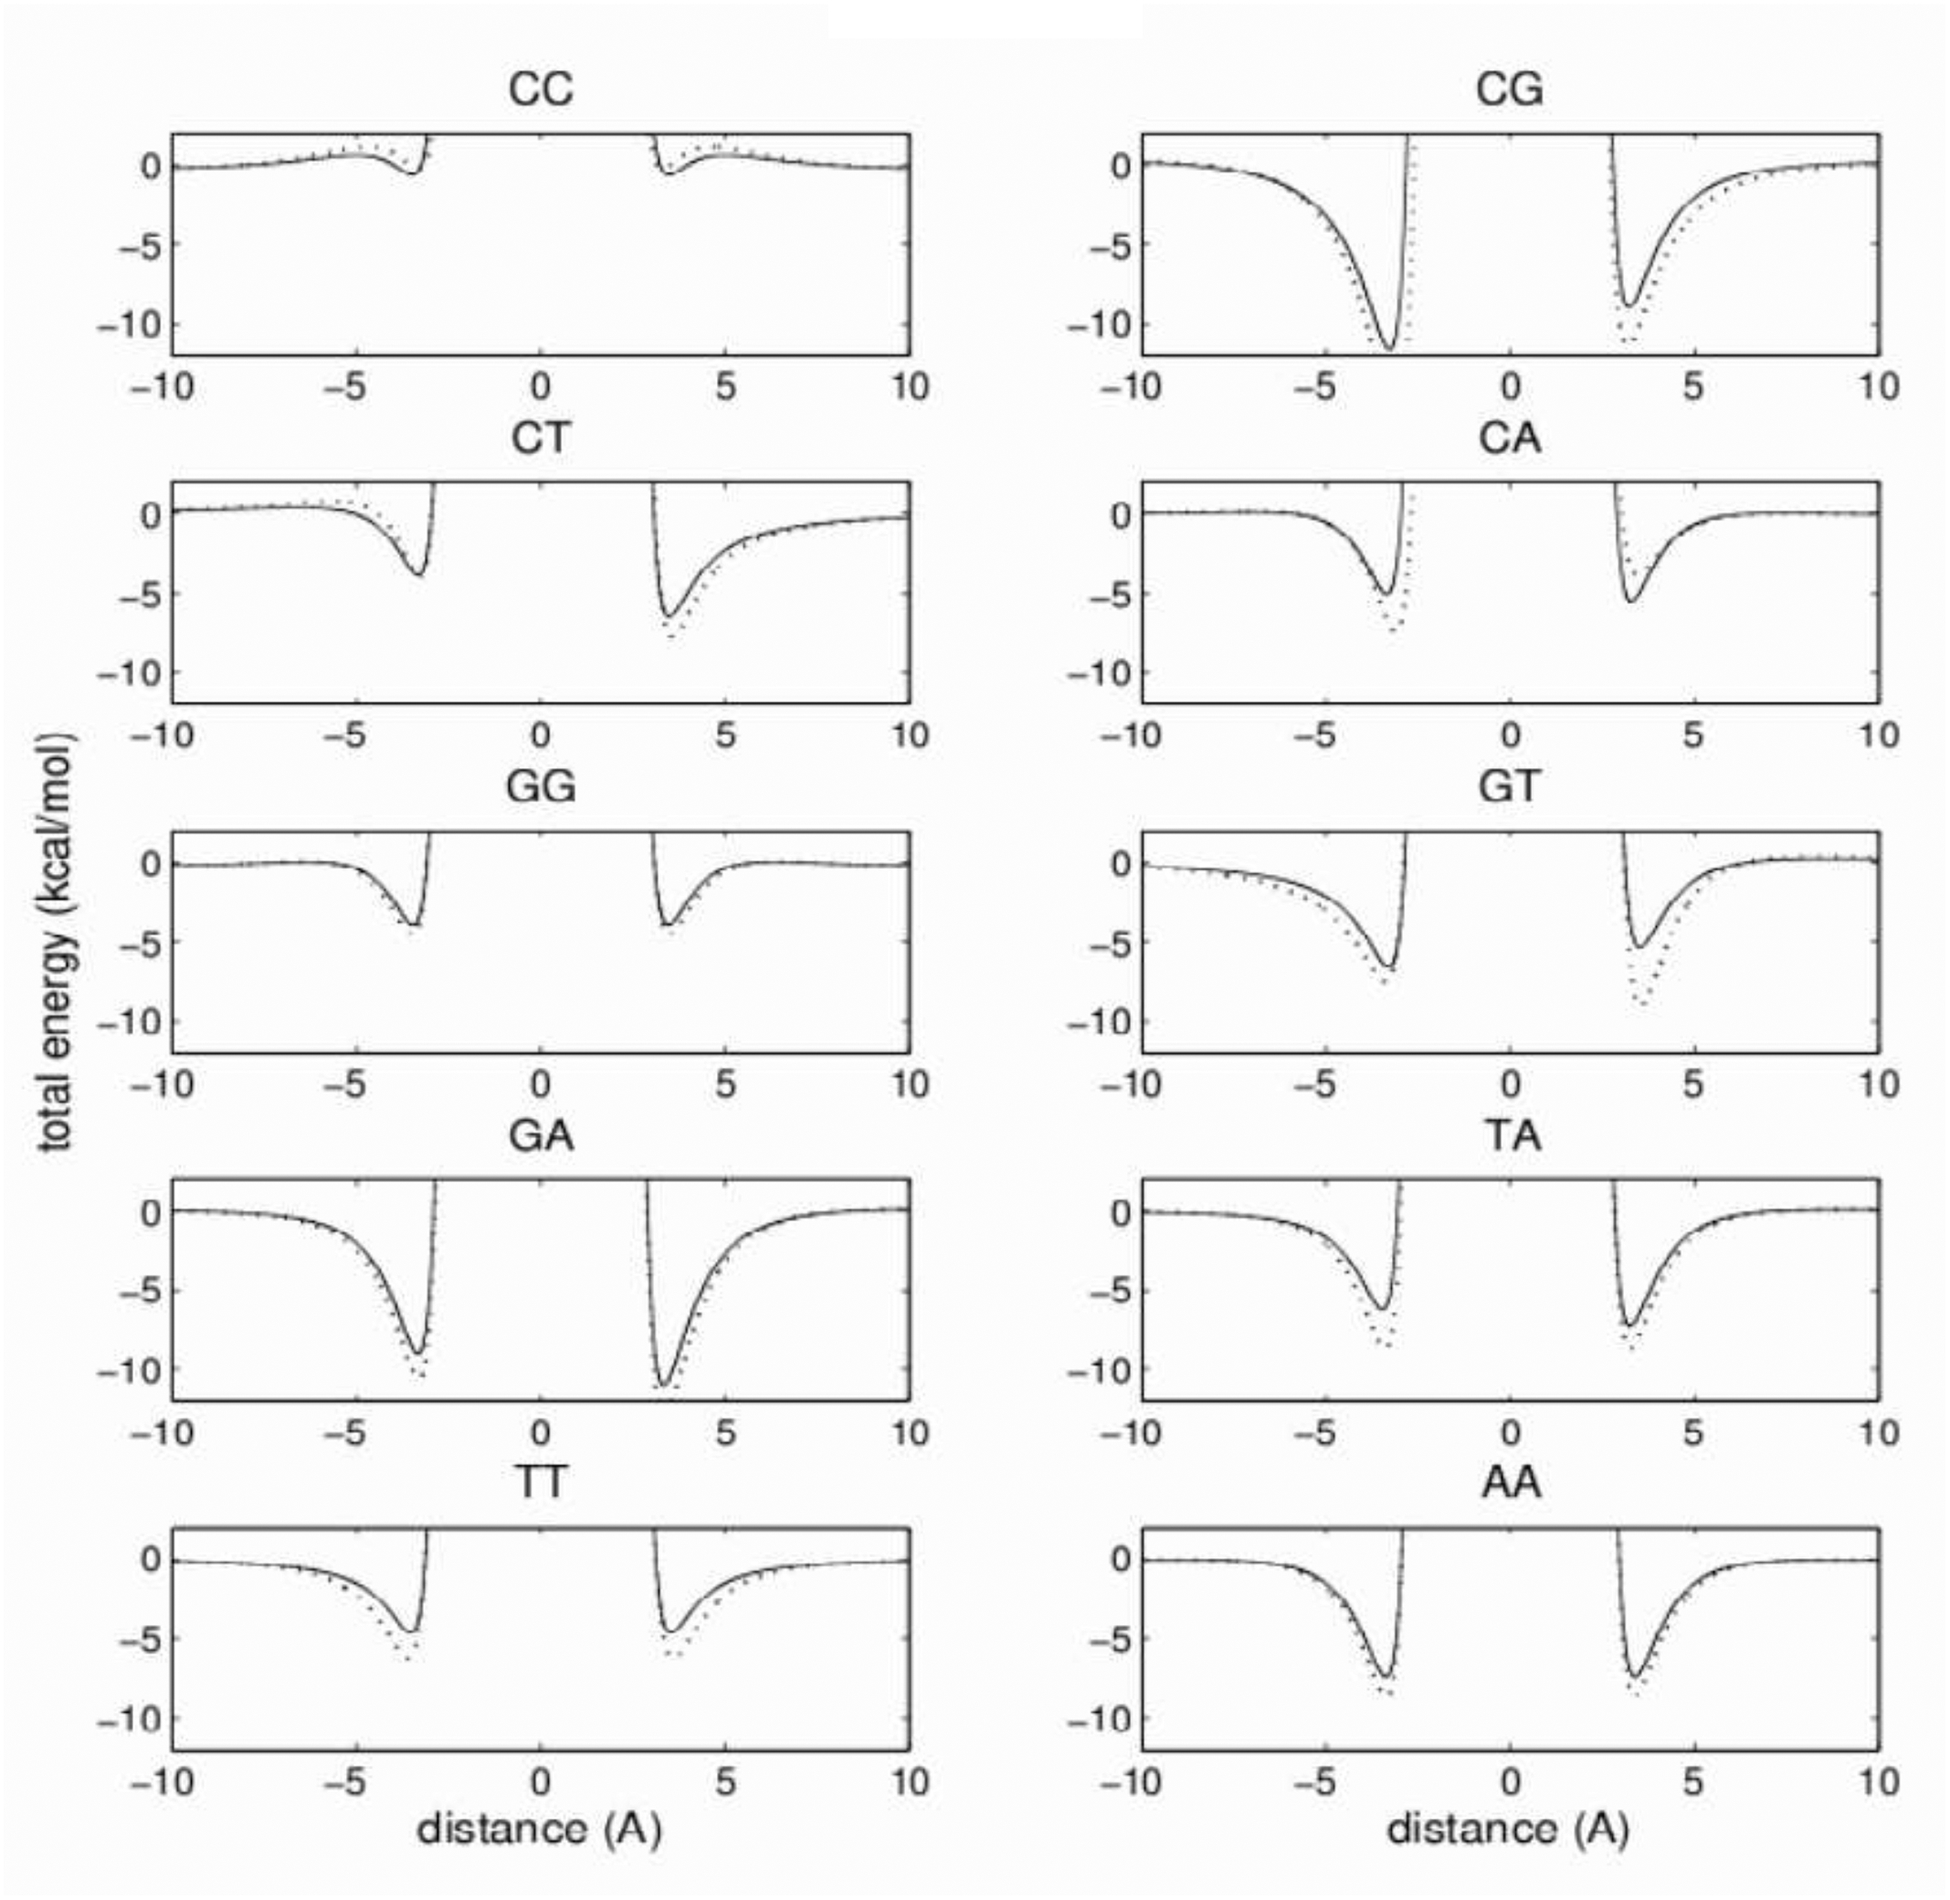
Same as Figure 9, but for stacking total energies.
The 3445 model superimposed on the all-atom model is shown in Figure 5. It can be seen that the dipole moments close to the hydrogen-bonding interface are arranged in an energetically favorable way. On the other hand, for the A:T base pair in the 3333 model shown in the Figure 4, the arrangement of the dipole moments in the Watson-Crick hydrogen-bonding interface is not energetically favorable.
The diagonal elements ϵij, σij of the ϵ and σ matrices and the magnitudes of the dipole moments for the 3445 model are collected in Table III. The well depth varies from 0.1 to 1.4 kcal/mol and the contact distances vary from 3.22 to 3.82 Å for same-type interacting Lennard-Jones spheres. As mentioned in the section “Lennard-Jones potential energy”, the off-diagonal elements are not calculated according to the mixing rules, (2a and 2b) but rather are fitted independently. The deviations of the fitted off-diagonal elements from those calculated from the diagonal ones according to the mixing rules can reach as much as 0.42 kcal/mol (ϵ) and 0.3 Å (σ). All parameters of the model, the on- and off-diagonal elements of the ϵ and σ matrices, the positions of the beads and and all components of the dipole moments are collected in the Supplementary Material.
Table III:
Diagonal elements of Lennard-Jones ϵand σmatrices and dipole-moment magnitudes (|d|) for the 3445 model.a
| C1 | 0.7605 | 3.3177 | 1.3749 |
| C2 | 0.8828 | 3.2999 | 3.5494 |
| C3 | 0.8841 | 3.2310 | 5.0297 |
| G1 | 1.0314 | 3.3646 | 5.0022 |
| G2 | 0.5997 | 3.2739 | 4.2264 |
| G3 | 1.4130 | 3.5517 | 1.9564 |
| G4 | 0.9145 | 3.2675 | 3.9706 |
| T1 | 0.4776 | 3.3293 | 3.0199 |
| T2 | 0.4861 | 3.8231 | 1.0442 |
| T3 | 0.9445 | 3.3597 | 5.1738 |
| T4 | 0.4235 | 3.2199 | 4.6354 |
| A1 | 1.1464 | 3.4852 | 5.1121 |
| A2 | 0.3893 | 3.3145 | 2.2106 |
| A3 | 0.4501 | 3.4048 | 3.1879 |
| A4 | 0.1034 | 3.3401 | 2.6731 |
| A5 | 0.7605 | 3.2935 | 1.3658 |
The names of the dipolar beads are assigned in Figure 5.
Computational efficiency
The improvement in the speed of the energy computations for the cheapest 3333 and the selected 3445 model is shown in the Table IV. The speedup of the electrostatic and van der Waals energy computations arises from the reduction of the number of distance evaluations. Because the form of the Lennard-Jones energy is the same for the coarse-grained and atomic models, the times for evaluation of the van der Waals energies for single pairs are exactly the same. The time for electrostatic-energy evaluation for a pair of dipole moments in the coarse-grained model is longer than in the atomic model. The speedup of the computations can be further improved by implementation of coplanarity of the dipole moments in the function for computing the inter-base electrostatic energy.
Table IV:
Speedup factor of energy computations for the 3333 and 3445 models in comparison with the all-atom model.
| 3333 | 23.2 | 7.8 | 11.2 |
| 3445 | 13.1 | 4.5 | 6.9 |
Conclusions
We have developed a method for replacing an all-atom model of mixtures of compounds with a set of Lennard-Jones spheres with dipole moments located at their centers. The method was applied to the nucleic-acid bases: cytosine, guanine, thymine and adenine. It was shown that the 3-center cytosine, 4-center guanine, 4-center thymine and 5-center adenine model reasonably reproduces both the all-atom Watson-Crick hydrogen-bonding and stacking energies. The speedup of the energy computations with respect to an all-atom model is a factor of about 7. Although it is slower then the alternative GB-EMP model,23 it reproduces the shape and volume of the irregular-shaped compounds better and, therefore, it should be more suitable for simulations of protein-DNA complexes. The model will be incorporated into a coarse-grained model of nucleic acids which is under development in our laboratory. The model lacks the solvation term; however, it should be noted that the bases in DNA structures are shielded from the solvent. The model should, therefore, be suitable for simulating DNA dynamics. For the simulations of DNA base opening and the denaturation process, we will initially use the distance-dependent dielectric constant function proposed by Ramstein and Lavery,41 which we plan to replace later by the Generalized Kirkwood model.42
Supplementary Material
References
- 1.Brooks BR; Brooks CL 3rd; MacKerell AD Jr; Nilsson L; Petrella RJ; Roux B; Won Y; Archontis G; Bartels C; Boresch S; Caflisch A; Caves L; Cui Q; Dinner AR; Feig M; Fischer S; Gao J; Hodoscek M; Im W; Kuczera K; Lazaridis T; Ma J; Ovchinnikov V; Paci E; Pastor RW; Post CB; Pu JZ; Schaefer M; Tidor B; Venable RM; Woodcock HL; Wu X; Yang W; York DM; Karplus M J Comp Chem, 2009, 30, 1545. [DOI] [PMC free article] [PubMed] [Google Scholar]
- 2.Cornell WD; Cieplak P; Bayly CI; Gould IR; Merz KM Jr.; Ferguson DM; Spellmeyer DC; Fox T; Caldwell JW; Kollman PA J Am Chem Soc, 1995, 117, 5179. [Google Scholar]
- 3.Langley DR J Biomol Struct Dyn, 1998, 16, 487. [DOI] [PubMed] [Google Scholar]
- 4.Cheatham TE 3rd; Kollman PA Annual Rev Phys Chem, 2000, 51, 435. [DOI] [PubMed] [Google Scholar]
- 5.Cheatham TE 3rd Curr Opin Struct Biol, 2004, 14, 360. [DOI] [PubMed] [Google Scholar]
- 6.Olson WK Curr Opin Struct Biol, 1996, 6, 242. [DOI] [PubMed] [Google Scholar]
- 7.Rudnicki WR; Bakalarski G; Lesyng B J Biomol Struct Dyn, 2000, 17, 1097. [DOI] [PubMed] [Google Scholar]
- 8.Maciejczyk M; Rudnicki WR; Lesyng B J Biomol Struct Dyn, 2000, 17, 1109. [DOI] [PubMed] [Google Scholar]
- 9.Orozco M; Perez A; Noy A; Luque FJ Chem Soc Rev, 2003, 32, 350. [DOI] [PubMed] [Google Scholar]
- 10.Tepper HL; Voth GA J Chem Phys, 2005, 122, 124906–1. [DOI] [PubMed] [Google Scholar]
- 11.Voltz K; Trylska J; Tozzini V; Kurkal-Siebert V; Langowski J; Smith J J Comp Chem, 2008, 29, 1429. [DOI] [PubMed] [Google Scholar]
- 12.Peyrard M; Bishop AR Phys Rev Lett, 1989, 62, 2755. [DOI] [PubMed] [Google Scholar]
- 13.Hyeon C; Thirumalai D Proc Natl Acad Sci USA, 2005, 102, 6789. [DOI] [PMC free article] [PubMed] [Google Scholar]
- 14.Olson WK; Flory PJ Biopolymers, 1972, 11, 25. [DOI] [PubMed] [Google Scholar]
- 15.Vorobjev YN Biopolymers, 1990, 29, 1503. [DOI] [PubMed] [Google Scholar]
- 16.Knotts IV TA; Rathore N; Schwartz DC; de Pablo JJ J Chem Phys, 2007, 126, 084901–1. [DOI] [PubMed] [Google Scholar]
- 17.Sambirski EJ; Schwartz DC; de Pablo JJ Biophys J, 2009, 96, 1675. [DOI] [PMC free article] [PubMed] [Google Scholar]
- 18.Sambirski EJ; Ortiz V; de Pablo JJ J Phys: Cond Matt, 2009, 21, 034105. [DOI] [PMC free article] [PubMed] [Google Scholar]
- 19.Berne BJ; Pechukas P J Chem Phys, 1972, 56, 4213. [Google Scholar]
- 20.Gay JG; Berne BJ J Chem Phys, 1981, 74, 3316. [Google Scholar]
- 21.Berardi R; Fava C; Zannoni C Chem Phys Lett, 1995, 236, 462. [Google Scholar]
- 22.Berardi R; Fava C; Zannoni C Chem Phys Lett, 1998, 297, 8. [Google Scholar]
- 23.Golubkov PA; Ren P J Chem Phys, 2006, 125, 064103. [DOI] [PubMed] [Google Scholar]
- 24.Poulain P; Saladin A; Hartmann B; Prévost C J Comp Chem, 2008, 29, 2582. [DOI] [PMC free article] [PubMed] [Google Scholar]
- 25.Goldstein H; Poole CP; Safko JL Classical Mechanics, Addison Wesley, 2002. [Google Scholar]
- 26.Allen MP; Tildesley DJ Computer Simulations of Liquids, Oxford University Press, New York, 1987. [Google Scholar]
- 27.Press WH; Teukolsky SA; Vetterling WT; Flannery BP Numerical Recipes. The Art of Scientific Computing, Cambridge University Press, 2007. [Google Scholar]
- 28.Jackson JD Classical Electrodynamics, Wiley, 1998. [Google Scholar]
- 29.Bayly CI; Cieplak P; Cornell WD; Kollman P J Phys Chem, 1993, 97, 10269. [Google Scholar]
- 30.Cieplak P; Cornell WD; Bayly CI; Kollman P J Comp Chem, 1995, 16, 1357. [Google Scholar]
- 31.Sigfridsson E; Ryde U J Comp Chem, 1998, 19, 377. [Google Scholar]
- 32.Vapnyarskii IB Kluwer Academic Publishers, 2001; Encyclopaedia of Mathematics. [Google Scholar]
- 33.Olson WK; Bansal M; Burley SK; Dickerson RE; Gerstein M; Harvey SC; Heinemann U; Lu XJ; Neidle S; Shakked Z; Sklenar H; Suzuki M; Tung CS; Westhof E; Wolberger C; Berman HM J Mol Biol, 2001, 313, 229. [DOI] [PubMed] [Google Scholar]
- 34.Schmidt MW; Baldridge KK; Boatz JA; Elbert ST; Gordon MS; Jensen JJ; Koseki S; Matsunaga N; Nguyen KA; Su S; Windus TL; Dupuis M; Montgomery JA J Comp Chem, 1993, 14, 1347. [Google Scholar]
- 35.Gordon MS; Schmidt MW Elsevier, Amsterdam, 2005; chapter 41, page 1167; Theory and Applications of Computational Chemistry, the first forty years. [Google Scholar]
- 36.Singh UC; Kollman PA J Comp Chem, 1984, 5, 129. [Google Scholar]
- 37.Sponer J; Leszczynski J; Hobza P Biopolymers, 2002, 61, 3. [DOI] [PubMed] [Google Scholar]
- 38.Humphrey W; Dalke A; Schulten K J Mol Graph, 1996, 14, 33. [DOI] [PubMed] [Google Scholar]
- 39.Markley JL; Bax A; Arata Y; Hilbers CW; Kaptein R; Sykes BD; Wright PE; Wuthrich K J Mol Biol, 1998, 280, 933. [DOI] [PubMed] [Google Scholar]
- 40.Lu X-J; Olson WK Nucl Acids Res, 2003, 31, 5108. [DOI] [PMC free article] [PubMed] [Google Scholar]
- 41.Ramstein J; Lavery R Proc Natl Acad Sci USA, 1988, 85, 7231. [DOI] [PMC free article] [PubMed] [Google Scholar]
- 42.Schnieders MJ; Ponder JW J Chem Theory Comput, 2007, 3, 2083. [DOI] [PMC free article] [PubMed] [Google Scholar]
Associated Data
This section collects any data citations, data availability statements, or supplementary materials included in this article.


