

Summary
Activating transcription factor 4 (ATF4) is a master transcriptional regulator of the integrated stress response (ISR) that enables cell survival under nutrient stress. The mechanisms by which ATF4 couples metabolic stresses to specific transcriptional outputs remain unknown. Using functional genomics, we identified transcription factors that regulate the responses to distinct amino acid deprivation conditions. While ATF4 is universally required under amino acid starvation, our screens yielded a transcription factor, Zinc Finger and BTB domain-containing protein 1 (ZBTB1), as uniquely essential under asparagine deprivation. ZBTB1 knockout cells are unable to synthesize asparagine due to reduced expression of asparagine synthetase (ASNS), the enzyme responsible for asparagine synthesis. Mechanistically, ZBTB1 binds to the ASNS promoter, and promotes ASNS transcription. Finally, loss of ZBTB1 sensitizes therapy-resistant T-cell leukemia cells to L-asparaginase, a chemotherapeutic that depletes serum asparagine. Our work reveals a critical regulator of the nutrient stress response that may be of therapeutic value.
In Brief (eToc blurb)
Williams et al. identify mediators of the amino acid response pathway in leukemia and demonstrate that ZBTB1 is necessary for cellular proliferation specifically under asparagine deprivation. ZBTB1 associates with the promoter of ASNS and promotes the transcriptional upregulation of ASNS under asparagine deprivation. Loss of ZBTB1 sensitizes leukemic cells to L-asparaginase treatment in vitro and in vivo.
Graphical Abstract
Introduction
Mammalian cells respond to a wide range of metabolic stresses through a common adaptive pathway, known as the integrated stress response (Pakos-Zebrucka et al., 2016). Amino acid starvation triggers a branch of the ISR regulated by the general control nonderepressible 2 (GCN2) kinase. When activated, GCN2 phosphorylates the eukaryotic initiation factor 2a (eIF2a), which in turn suppresses global translation but promotes translation of select mRNAs, including that of the stress-responsive transcription factor ATF4 (Harding et al., 2000; Ye et al., 2010). ATF4 is the master transcriptional regulator of amino acid metabolism and coordinates the expression of critical metabolic genes that restore cellular homeostasis (Harding et al., 2003; Kilberg et al., 2012; Al-Baghdadi et al., 2017). Many human tumors display activation of GCN2-ATF4 pathway and depend on it to grow in nutrient limited environments (Ye et al., 2010; Horiguchi et al., 2012). Indeed, loss of ATF4 suppresses tumor progression, indicating its essential role in maintaining amino acid pools in cancer cells. Despite being the common mediator of various stress responses and metabolic pathways, ATF4 generates tailored transcriptional outputs to distinct cellular stresses by cooperating with other transcriptional machinery (Figure 1A) (Wortel et al., 2017). The precise mechanisms by which ATF4 activates an appropriate transcriptional program in response to metabolic stresses, however, remain unclear.
Figure 1: A CRISPR-based genetic screen identifies transcription machinery essential for proliferation under serine and asparagine deprivation.

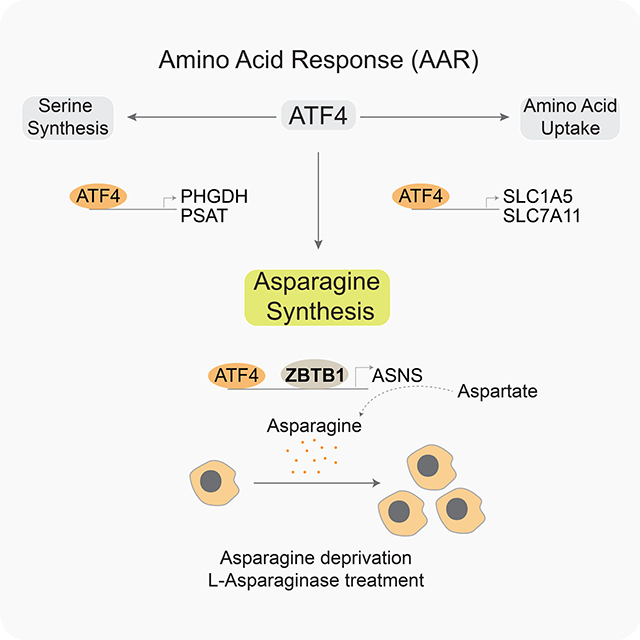
A) Schematic demonstrating the metabolic genes regulated by ATF4, the effector of the integrated stress response.
B) Schematic depicting pooled CRISPR screens under asparagine or serine deprivation using a transcription-focused sgRNA library.
C) Gene scores in Jurkat cells grown in complete versus serine deficient media (left). The gene score is the median log2 fold change in the abundance of all sgRNAs targeting a given gene after 14 population doublings. Most genes, as well as non-targeting control sgRNAs, have similar scores in the presence or absence of serine. The top ten genes differentially required under serine deprivation are shown (right).
D) Gene scores in WT Jurkat cells grown in complete versus asparagine deficient media (left). The top ten genes differentially required under asparagine deprivation are shown (right). Media was depleted of asparagine through the use of L-asparaginase (0.25 U/mL).
E) Changes in the abundance of individual ZBTB1 sgRNAs in complete media (black) or in the absence (gray) of asparagine (top) or serine (bottom).
F) Differential scores of genes required specifically under asparagine deprivation relative to serine deprivation. ZBTB1 is highlighted in blue.
G) Immunoblot analysis of parental, ZBTB1 knockout, and rescued ZBTB1 knockout Jurkat cells (top). β-actin was used as a loading control.
H) Fold change in cell number (log2) of parental (black), ZBTB1 knockout (blue), and rescued ZBTB1 knockout (gray) Jurkat cells after growth in media with indicated asparagine concentrations for 5 days (mean ± SD, n=3).
I) Fold change in cell number (log2) of parental (black), ZBTB1 knockout (blue), and rescued ZBTB1 knockout (gray) Jurkat cells after treatment with indicated asparaginase concentrations for 5 days (mean ± SD, n=3) (top). Representative bright-field micrographs of indicated cells after a 5day asparaginase treatment (bottom).
Statistics: two-tailed unpaired t-test. **P < 0.05, ***P < 0.01, ****P < 0.001.
Here, using a combination of CRISPR-Cas9 genetic screens and metabolomic approaches, we defined transcriptional machineries required for cancer cell proliferation under various amino acid deprivation conditions. Of particular interest, we identified ZBTB1 as an essential transcription factor for leukemic cell growth under asparagine deprivation. In leukemia cells, ZBTB1 binds to the ASNS promoter and regulates its transcription. Remarkably, knockout of ZBTB1 sensitizes therapy resistant T-cell leukemia cells in vitro and in vivo to L-asparaginase, a chemotherapeutic that depletes serum asparagine. Together, these results identify a critical tissue-specific regulator of the nutrient stress response in human T-ALLs that may be relevant to the therapeutic efficacy of L-asparaginase in leukemia.
Results and discussion
A CRISPR-based genetic screen identifies transcriptional machinery essential for proliferation under serine and asparagine deprivation
When depleted of individual amino acids such as serine, cysteine or asparagine, human cells upregulate the expression of several nutrient transporters and biosynthetic enzymes in an ATF4-dependent manner to conserve amino acid pools (Figure 1A and S1A). Among the major targets of ATF4 are asparagine synthetase (ASNS) and serine synthesis enzymes, phosphoglycerate dehydrogenase (PHGDH) and phosphoserine aminotransferase (PSAT), which enable human cells to proliferate under asparagine or serine deprivation, respectively (Zhao et al., 2016; Yang et al., 2018) (Figure 1A). Dependencies on these distinct biosynthetic enzymes provide an opportunity to identify transcriptional machinery regulating specific branches of ATF4-induced metabolic gene expression. We therefore performed a negative selection genetic screen to identify genes whose loss would inhibit the fitness of human cells upon serine or asparagine depletion. Given that mammalian cells respond to amino acid depletion through a transcriptional mechanism, we generated a library consisting of ~20,000 guide RNAs targeting ~2,500 transcription, splicing and epigenetic factors (8 sgRNA per gene as well as 50 intergenic targeting control sgRNAs) in a Cas9-expressing vector (Figure 1B, Table S1). Additionally, for our screens, we used a T-cell acute lymphoblastic leukemia cell line, Jurkat, because of its ability to grow in the absence of serine and asparagine (Figure S1B). Comparing essentialities under different amino acid deprivation conditions should reveal transcriptional processes unique to distinct ATF4 targets and identify novel transcriptional programs.
Among the genes universally essential in the absence of asparagine or serine was ATF4, confirming its general role in the adaptive response to amino acid deprivation (Figure 1C, 1D and S1C). Our screens also identified factors that have been previously reported to be selectively essential under particular amino acid deprivations. For example, the histone H3 methyltransferase G9A (also known as EHMT2) was selectively required for cellular proliferation under serine, but not asparagine deprivation (Figure 1C and S1C). EHMT2 has previously been shown to catalyze the mono and dimethylation of H3K9 and to regulate serine-glycine biosynthesis (Ding et al., 2013). Similarly, another gene required under serine deprivation, SF3B1, regulates PHGDH splicing and serine synthesis (Darman et al., 2015; Brian Dalton et al., 2019) (Figure 1C). These data suggest that amino acid dependencies can be utilized to discover transcriptional machinery regulating essential biosynthetic pathways.
Remarkably, under asparagine deprivation, Zinc Finger and BTB Domain Containing 1 (ZBTB1) was the highest scoring gene with 7 out of 8 sgRNAs being differentially depleted under asparagine, but not serine deprivation (Figure 1D–F). ZBTB1 is a transcription factor with a described role in T-cell differentiation that has not previously been associated with the response to asparagine deprivation or with a role in cellular metabolism (Punwani et al., 2012; Siggs et al., 2012; Zhang et al., 2014). To validate the results of our screen, we used the CRISPR-Cas9 system to generate two clonal knockouts of ZBTB1, in which ZBTB1 protein was undetectable (Figure 1G). While loss of ZBTB1 did not impact proliferation under standard culture conditions, ZBTB1 knockout cells were highly sensitive to asparagine deprivation (Figure 1H) and to treatment with Lasparaginase, a drug that depletes serum asparagine levels (Figure 1I and S1D). Notably, overexpression of an sgRNA resistant ZBTB1 cDNA completely rescued both phenotypes, confirming the results of our genetic screens (Fig 1H,I and S1E). We next asked whether ZBTB1 was involved in the cellular response to deprivation of other amino acids in addition to asparagine in a role similar to ATF4. To test this possibility, we generated clonal knockouts of ATF4 (Figure S2A). Interestingly unlike ATF4 knock out cells, which cannot grow in the absence of asparagine, serine, glutamine or cysteine, ZBTB1 knock out cells were only sensitive to asparagine depletion (Figure 2A and Figure S1F). Furthermore, overexpression of ATF4 did not rescue the sensitivity of ZBTB1 knockout cells (Figure 2B), suggesting that ATF4 requires ZBTB1 to enable cell proliferation under asparagine deprivation. These results indicate that ZBTB1 is specifically involved in the adaptive response to deprivation of asparagine, but not of other amino acids.
Figure 2: ZBTB1 enables de novo asparagine synthesis and is essential for proliferation under asparagine deprivation.

A) Fold change in cell number (log2) of parental, ATF4 knockout, and rescued ATF4 knockout Jurkat cells after growth in complete media (black) or media with indicated asparagine, serine or cysteine concentrations (gray) for 5 days (mean ± SD, n=3) (top). Fold change in cell number (log2) of parental, ZBTB1 knockout, and rescued ZBTB1 knockout Jurkat cells after growth in complete media (black) or media with indicated asparagine, serine or cysteine concentrations (gray) for 5 days (mean ± SD, n=3) (bottom).
B) Immunoblot analysis of parental and ZBTB1 knockout Jurkat cells expressing a control vector or ATF4 cDNA (left). GAPDH was used as a loading control. Fold change in cell number (log2) of parental and ZBTB1 knockout Jurkat cells expressing a control vector or ATF4 cDNA after treatment with indicated asparaginase concentrations for 5 days (mean ± SD, n=3) (right).
C) Metabolites significantly altered between ZBTB1 knockout (right) and rescued ZBTB1 knockout (left) Jurkat cells grown in asparagine-free medium, ranked by p-value.
D) Differential intracellular amino acid abundances of parental (black), ZBTB1 knockout (gray), and rescued ZBTB1 knockout (blue) Jurkat cells grown in asparagine-free medium relative to complete medium (mean ± SD, n=3).
E) Schematic depicting the metabolic routes of asparagine and orotate synthesis from glutamine. Filled circles represent 13C atoms derived from [U-13C]-Glutamine.
F) Abundance of asparagine derived from labeled glutamine in parental, ZBTB1 knockout and rescued ZBTB1 knockout Jurkat cells cultured for 8 hours in media containing [U-13C]-glutamine (2000 uM) in the absence of asparagine. Colors indicate mass isotopomers (mean ± SD, n=3).
G) Fraction of labeled asparagine (top), aspartate (middle), and orotate (bottom) derived from labeled glutamine in parental, ZBTB1 knockout and rescued ZBTB1 knockout Jurkat cells cultured for 8 hours with [U-13C]-glutamine (2000 uM) in the presence or absence of asparagine. Colors indicate mass isotopomers (mean ± SD, n=3).
H) Schematic depicting the requirement of ZBTB1 for ATF4-mediated synthesis of asparagine and cancer cell proliferation under asparagine deprivation.
Statistics: two-tailed unpaired t-test. **P < 0.05, ***P < 0.01, ****P < 0.001.
ZBTB1 enables de novo asparagine synthesis and is essential for proliferation under asparagine deprivation
To begin to understand how loss of ZBTB1 impacts the cellular metabolism of Jurkat cells, we profiled polar metabolites within ZBTB1 knockout Jurkat cells using liquid-chromatography-mass spectrometry (LC-MS) in the presence or absence of asparagine. While asparagine depletion caused few changes (Table S2), we were able to detect significant differences in 20 metabolites between knockout and rescued cells under asparagine depletion (Figure 2C). Of note, [U-13C]-L-glutamine uptake was similar in ZBTB1 knockout cells and their rescued counterparts (Figure S2B). Among the most significantly altered metabolites were TCA cycle intermediates (malate and fumarate) and nucleotides (ATP, GTP and CTP). Across all detected amino acids, asparagine was the only one that decreased substantially in ZBTB1 knockout cells, exhibiting three-fold lower levels as compared to wild type or ZBTB1 cDNA expressing cells (Figure 2D). This finding suggests that loss of ZBTB1 may decrease asparagine availability either by reducing de novo synthesis of asparagine or decreasing its uptake from other sources. To determine whether these cells exhibit reduced asparagine synthesis, we measured the production of asparagine from uniformly heavy carbon labeled glutamine ([U-13C]-L-glutamine) in wild type and ZBTB1 knockout Jurkat cells (Figure 2E). In the presence of asparagine, Jurkat cells synthesize most of their TCA cycle metabolites, nucleotide intermediates and aspartate from glutamine, but they do not synthesize appreciable levels of asparagine (Figure 2F and 2G). In contrast, upon asparagine depletion, oxidative metabolism of the uniformly labeled glutamine to asparagine is the predominant route of asparagine synthesis (Figure 2G). Interestingly, loss of ZBTB1 substantially inhibited the reductive (m+3) and oxidative (m+4) labeling of asparagine from glutamine with minimal impact on glutamine-derived aspartate, suggesting a block in asparagine synthesis in these cells (Figure 2F and 2G). Of note, orotate labeling substantially decreased in ZBTB1 knockout cells, consistent with pyrimidine synthesis inhibition in amino acid deprived cells through inhibition of CAD (Ben-Sahra et al., 2013; Krall et al., 2016). Together, these findings suggest that ZBTB1 is an essential transcription factor for leukemic cells to synthesize asparagine from aspartate when asparagine is limited (Figure 2H).
ZBTB1 regulates ASNS transcription and associates with the ASNS promoter
ZBTB1 is a member of the mammalian ZBTB gene family and involved in the transcriptional regulation of T lymphocyte development (Punwani et al., 2012; Siggs et al., 2012; Zhang et al., 2014), but transcriptional targets of ZBTB1 have not been described. Given that ZBTB1 is required for asparagine synthesis, we reasoned that ZBTB1 might be involved in promoting the transcription of genes relevant to asparagine metabolism. To address this, we performed RNA-seq analysis and identified genes whose expression was altered in the absence of ZBTB1. Consistent with our observation that ZBTB1 is essential for Jurkat cells during asparagine deprivation, we found ASNS as one of the most downregulated genes in ZBTB1 knockout cells compared to wild type cells (Figure 3A). Under asparagine deprivation, Jurkat cells upregulate ATF4 followed by ASNS in order to synthesize asparagine (Figure S3F). Loss of ZBTB1, however, reduces both the baseline and induced transcription of ASNS under asparagine deprivation, but not that of other ATF4 target genes, as measured by RT-qPCR (Figure 3B). In agreement with the mRNA expression data, we observed a marked reduction in ASNS protein levels in ZBTB1 knockout cells at baseline and following L-asparaginase treatment (Figure 3C).
Figure 3: ZBTB1 regulates ASNS transcription and associates with the ASNS promoter.

A) Log2 fold change in transcripts per million (TPM) in ZBTB1 knockout versus parental Jurkat cells grown in standard medium. ASNS is highlighted in red.
B) Relative mRNA levels of indicated genes in parental (black), ZBTB1 knockout (gray) and rescued ZBTB1 knockout (blue) cells grown in complete or asparagine-lacking media (mean ± SD, n=3).
C) Immunoblot analysis of parental, ZBTB1 knockout, and rescued ZBTB1 knockout Jurkat cells grown in the presence or absence of L-asparaginase (0.03 U/mL) for 8 hours. GAPDH was used as a loading control.
D) Schematic depicting ChIP-sequencing performed in FLAG-GFP versus FLAG-ZBTB1 expressing ZBTB1 knockout cells grown in complete (+N) or asparagine-lacking media (-N). Antibodies used for immunoprecipitation are indicated.
E) The proportion of ZBTB1, ATF4 and ZBTB1-ATF4 associated peaks overlapping with specified chromatin features.
F) FLAG-ZBTB1 ChIP-Seq signal from normalized bigwig files quantified over all ZBTB1 peaks identified in either the presence (+N) or absence (-N) of asparagine. The row corresponding to the peak in the ASNS promoter is labeled with red text (left). Scatter plot of p-values of the peaks overlapping between ATF4 and ZBTB1 (right). ASNS is highlighted in red.
G) Venn diagram depicting the number of ZBTB1, ATF4 and overlapping ZBTB1-ATF4 peaks genome-wide (top). Significantly enriched gene ontologies for peaks that overlap in ZBTB1 and ATF4 (bottom).
H) ChIP-Seq tracks near the ASNS promoter for indicated antibodies (right) in the indicated genotype (top two tracks Flag-GFP or bottom two tracks FLAG-ZBTB1) in the presence (+N) or absence (-N) of asparagine.
I) Motifs enriched near ATF4 and ZBTB1 peaks (left). Schematic depicting ATF4 and ZBTB1 motifs present within the promoter of ASNS (right).
J) Electrophoretic mobility shift gel of parental (WT) and mutant ASNS promoter probes with the indicated concentration of recombinant ZBTB1 protein. Stars indicate probe shifts.
K) Immunoblot analysis of parental and ZBTB1 knockout Jurkat cells overexpressing a vector or ASNS cDNA (left). GAPDH was used as a loading control. Fold change in cell number (log2) of parental (black) and ZBTB1 knockout (blue) Jurkat cells expressing a control vector or ASNS cDNA (gray) after treatment with indicated asparaginase concentrations for 5 days (mean ± SD, n=3) (right).
Statistics: two-tailed unpaired t-test. **P < 0.05, ***P < 0.01, ****P < 0.001.
To investigate the genomic localization of ZBTB1, we next performed comprehensive genome-wide mapping of ZBTB1 and ATF4 through chromatin immunoprecipitation with massively parallel DNA sequencing (ChIP-seq) in ZBTB1 knockout Jurkat cells expressing an N-terminal Flag-tagged ZBTB1 cDNA or a control Flag-GFP (Figure 3D). The Flag-tagged ZBTB1 localized to the nucleus and rescued the proliferation of ZBTB1 knockout cells upon asparagine deprivation, indicating that the tagged protein recapitulates the function of the endogenous protein (Figure S3A and S3B). ZBTB1 peaks exhibited a distinctly promoter and intronic distribution similar to that of ATF4 (Figure 3E and S3C). Consistent with previous ChIP-seq studies, ATF4 enriched in the promoters of many metabolic genes involved in the response to nutrient stress including PHGDH, PSAT and SLC1A5 (Figure S3D)(Han et al., 2013).
Visualization of ZBTB1 peaks in the presence or absence of asparagine revealed a high degree of similarity, and 593 high confidence peaks were defined as peaks present in both conditions (Figure 3F). Interestingly, a portion of these ZBTB1 peaks overlap with ATF4 peaks (115 out of 593), suggesting that ZBTB1-associated gene promoters may also be regulated by ATF4 (Figure 3G). Among these peaks overlapping between ATF4 and ZBTB1, the ASNS peak is one of the most significantly enriched for both transcription factors relative to their respective controls (Figure 3F and S3E). Similarly, gene ontology analysis of genes having both ZBTB1 and ATF4 peaks revealed a strong enrichment for asparagine synthesis gene sets (Figure 3G, Table S3). In agreement with the mRNA expression data, ZBTB1 enriched in the promoter of ASNS, but not in the promoters of other key ATF4 target genes that regulate asparagine metabolism (Fig 3H and S3D). Notably, ZBTB1 knockout cells exhibit increased ATF4 enrichment at the ASNS promoter, underlying the increased amino acid deprivation stress observed in these cells due to loss of asparagine synthesis (Figure 3H). Altogether, these findings indicate that ZBTB1 associates with the ASNS promoter and is required for ATF4 to promote ASNS transcription. Previous studies have characterized the role of the N terminal BTB (broad complex, tramtrack, and bric-a-brac) and ubiquitin-binding zinc-finger 4 (UBZ4) domains in the autosumoylation and targeting of ZBTB1 to sites of DNA damage (Matic et al., 2010; Kim et al., 2014). Mutation of known sumoylation sites or deletion of the UBZ4 domain, however, did not affect the ability of ZBTB1 to rescue the proliferation of ZBTB1 knockout Jurkat cells under asparagine deprivation (Figure S3J), suggesting that these sites are not essential for regulating ASNS expression.
We next asked whether ZBTB1 directly binds to DNA at a specific DNA motif (Kim et al., 2014). Motif enrichment for ATF4 identified the previously described “TGATGHAA” binding motif, the canonical nutrient sensing response element (NSRE) within the ASNS promoter (Siu et al., 2002). Similar analysis of ZBTB1 peaks genome-wide revealed a seven-nucleotide motif associated with ZBTB1 peaks, “ARCCRCA”, which is also the RUNX1/2/3 binding motif (Bowers et al., 2010)(Figure 3I and Table S4). The ASNS promoter contains four instances of this motif near the ZBTB1 peak, including one motif directly under the region of highest read density, downstream of the canonical NSRE, where ATF4 binds (Figure 3I). In order to determine whether ZBTB1 directly binds to this motif within the ASNS promoter, we performed an electrophoretic mobility shift assay and validated that a purified zing finger fragment of ZBTB1 binds to this segment of the ASNS promoter (Figure 3J and S3G). Importantly, a fluorescent probe in which the four ZBTB1 motifs were mutated did not show an electrophoretic mobility shift, suggesting specific binding of ZBTB1 protein to the identified motif within this region of the ASNS promoter (Figure 3J). Of note, though RUNX1 and ZBTB1 share binding motifs, RUNX1 transcript levels are unaffected by ZBTB1 loss and overexpression of RUNX1 does not rescue the proliferation of ZBTB1 knockout cells under asparagine deprivation (Figure S3H). These transcription factors are thus unlikely to have overlapping functions in regulating ASNS transcription. In line with the role of ZBTB1 in ASNS regulation, overexpression of ASNS is sufficient to rescue the sensitivity of ZBTB1 knockout cells to asparagine deprivation, similar to that of asparaginase sensitive cell lines (Aslanian, Fletcher and Kilberg, 2001) (Figure 3K, Figure S3K). Interestingly, forced overexpression of ATF4 is not sufficient to induce ASNS expression or impact GCN2 signaling in ZBTB1 knockout cells, suggesting that ATF4 likely requires ZBTB1 for maximal ASNS expression (Figure S3L and S3M).
Together, these data indicate that the direct transcriptional regulation of ASNS by ZBTB1 enables cells to proliferate upon asparagine deprivation. ZBTB1 binding sites on the ASNS promoter overlap with active chromatin marks histone H3 lysine 27 acetylation (H3K27ac) and H3 lysine 4 trimethylation (H3K27ac and H3K4me3) (Figure 3H). Furthermore, Assay for Transposase-Accessible Chromatin using sequencing (ATAC-Seq) experiments showed minimal impact on the accessibility of chromatin near the ASNS promoter in ZBTB1 knockout cells, suggesting that ZBTB1 may act downstream of the establishment of transcriptionally permissive chromatin (Figure S3I).
Loss of ZBTB1 sensitizes therapy resistant T-cell leukemia cells to L-asparaginase in vitro and in vivo
L-asparaginase, which selectively depletes asparagine from serum, is a clinical therapy that inhibits the growth of asparagine-dependent leukemia cells (John G. Kidd, 1953; Haskell et al., 1969). Despite the high survival rate of patients treated with chemotherapeutic agents, about 20% of children and more than 50% of adults with ALL relapse or do not respond to this therapy. Given the role of ZBTB1 in regulating ASNS expression and the response of ZBTB1 knockout cells to asparagine deprivation, we reasoned that loss of ZBTB1 may sensitize asparaginase-resistant cancer cells to L-asparaginase treatment in vivo. To address this, we first determined whether the function of ZBTB1 in regulating ASNS is restricted to leukemias or generalizable to other cancer types. Interestingly, loss of ZBTB1 caused L-asparaginase sensitivity in T-ALLs (CUTTL-1, Jurkat, SUPT-1) and, to a lesser extent, B-ALLs (REH, NALM6), but not to other cancer types such as AML (MOLM-13 or SKM-1), breast (MDA-MB-231) or lung (A549) cancer cell lines (Figure 4A). We observed similar results under physiologically relevant media conditions (Figure S4A). Consistent with this, baseline ASNS expression decreases upon loss of ZBTB1 in T-ALLs, but not in other cell types (Figure 4B).
Figure 4: Loss of ZBTB1 sensitizes therapy resistant T-cell leukemia cells to L-asparaginase in vitro and in vivo.

A) Fold change in cell number of sgControl (gray) versus sgZBTB1 (blue) expressing cell lines treated with L-asparaginase (0.03 U/mL) relative to untreated (mean ± SD, n=3).
B) Immunoblot analysis of indicated cell lines expressing sgControl versus sgZBTB1. GAPDH was used as a loading control.
C) Photon flux detected by In Vivo Imaging System for Jurkat cell lines engrafted into NSG mice normalized to initial photon flux.
D) Kaplan-Meier survival curve of NSG mice engrafted with ZBTB1 knockout versus rescued ZBTB1 knockout Jurkat cells and treated with vehicle or asparaginase (1000 U/kg, twice per week) (left). Box and whisker plots of survival data (right).
E) Photon flux detected by In Vivo Imaging System for CUTLL1 cell lines engrafted into NSG mice normalized to initial photon flux.
F) Kaplan-Meier survival curve of NSG mice engrafted with ZBTB1 knockout versus vector-control CUTLL1 cells and treated with vehicle or asparaginase (1000 U/kg, twice per week) (left). Box and whisker plots of survival data (right).
G) Schematic depicting the role of ZBTB1 in the control of ASNS expression under asparagine depletion.
In c,d,e,f, the boxes represent the median, and the first and third quartiles, and the whiskers represent the minimum and maximum of all data points.
Statistics: two-tailed unpaired t-test. **P < 0.05, ***P < 0.01, ****P < 0.001.
To translate our findings to an in vivo model, we engrafted NOD-SCID gamma (NSG) mice with clonal ZBTB1 knockout Jurkat cells or cDNA rescued counterparts and tested the efficacy of L-asparaginase treatment in these mice. Consistent with previous work, L-asparaginase significantly decreased serum asparagine levels, without impacting the levels of abundant amino acids such as glutamine, when measured after 24 hours (Figure S4C)(LeBoeuf et al., 2019). The treatment was well-tolerated as indicated by animal weights remaining unchanged during the experiment (Nakamura et al., 2018; Chan et al., 2019) (Figure S4B). Mice engrafted with ZBTB1 knockout or rescued Jurkat cells had a median survival of 48 days and 49 days, respectively (Figure 4D). While L-asparaginase treatment only marginally extended median survival of mice with rescued ZBTB knockout cells (52 days), mice engrafted with ZBTB1 knockout cells had lower tumor burden (Figure 4C) and had a significant increase in median survival (62 days) (Figure 4D). Similarly, mice engrafted with another L-asparaginase resistant cell line, CUTLL1, that lacked ZBTB1 survived a median of 32 days when treated with L-asparaginase as compared to a median of 27 days when left untreated (Figure 4E and 4F). Collectively, these findings suggest that loss of ZBTB1 sensitizes T-ALL cell lines to L-asparaginase in vivo and that ZBTB1 may be an amenable therapeutic target for the treatment of L-asparaginase non-responsive T-ALLs (Figure 4G).
Conclusion
ATF4 is the master transcriptional regulator of the cellular response to stress. Here, we identified ZBTB1 as an essential transcription factor for the induction of ASNS, an ATF4-regulated enzyme critical for asparagine synthesis and proliferation upon asparagine depletion (Gwinn et al., 2018). While our work indicates that ATF4 requires ZBTB1 for the induction of ASNS expression upon asparagine deprivation, the precise transcriptional mechanism by which ZBTB1 regulates ASNS is not clear. Given the partial rescue of ZBTB1 knockout cells by ATF4 overexpression, it is possible that these transcription factors act in parallel to regulate ASNS. Future biochemical studies are required to determine how each factor regulates ASNS transcription. Interestingly, the metabolic role of ZBTB1 is restricted to leukemias, suggesting that there are tumor or tissue-specific transcriptional programs involved in the regulation of the amino acid stress response pathway. Our work provides a proof of principle to identify these transcription factors and study regulation of other metabolic genes regulated by ATF4. Finally, targeting ZBTB1 with small molecules may provide an opportunity to specifically inhibit the transcriptional response to L-asparaginase treatment in therapy resistant leukemic cells. Due to the tissue specific function of ZBTB1, such an approach may mitigate toxicities associated with concomitant targeting of amino acid response pathway and L-asparaginase (Gutierrez et al., 2006; Nakamura et al., 2018).
Limitations of the study
While our work has identified important mediators of leukemic cell response to amino acid deprivation, there are certain limitations of our study. This work was performed in leukemia cell lines which, while originating from patients, are imperfect models of human physiology. We have attempted to address this issue through the use of human physiological media; however, future work with small molecule inhibitors will be needed to investigate the role of ZBTB1 in the response L-asparaginase treatment in primary patient-derived leukemias.
LEAD CONTACT AND MATERIALS AVAILABILITY
Further information and requests for resources and reagents should be directed to and will be fulfilled by the Lead Contact, Kıvanc Birsoy (kbirsoy@rockefeller.edu). All unique/stable reagents generated in this study are available from the Lead Contact with a (completed Materials Transfer Agreement/without restriction).
EXPERIMENTAL MODEL AND SUBJECT DETAILS
Mice
All animal studies and procedures were conducted according to a protocol approved by the Institutional Animal Care and Use Committee (IACUC) at the Rockefeller University. Animals were housed in ventilated caging in a specific pathogen free animal facility. Animals were maintained on a standard light-dark cycle with food and water ad libitum. Xenograft tumors were initiated into NOD/SCID male littermates approximately 6–8 weeks in age by injecting 1 million cells in 100 uL of PBS through the tail vein. Tumor burden was measured weekly with an In Vivo Imaging System (IVIS) by injecting 50 uL of d-luciferin (30 mg/mL, BioVision) retro-orbitally. Mice were weighed weekly, and sacrificed after 20% weight loss, or if showing signs of significant distress or loss of limb or motor function. Mice were treated with L-asparaginase (1000 U/kg) twice weekly. Whole blood (100uL) was collected by submandibular vein bleed, and centrifuged at 500g for 5 min at 4C to yield a serum supernatant. Serum was analyzed by LC-MS, as described.
Cell Lines
Cell lines (Jurkat, HeLa, HEK293T, CUTLL1, SUPT1, REH, NALM6, MOLM-13, SKM-1, MDA-MB-231, A549, RPMI-8402, and ALL-SIL) were purchased from ATCC. Cell lines were verified to be free of mycoplasma contamination and the identities of all were authenticated by STR profiling.
Cell Culture Conditions
All cell lines were cultured in RPMI medium containing 2 mM glutamine, 10% fetal bovine serum, penicillin and streptomycin, unless noted otherwise. For experiments performed in human plasma-like medium (HPLM), cells were cultured in HPLM containing penicillin and streptomycin (Cantor et al., 2017). For proliferation assays under asparagine depletion and for tracing experiments, RPMI without amino acids (US Biologicals- R9010–01) was supplemented with individual amino acids at RPMI concentrations. For tracing experiments, [U-13C]-Glutamine (CIL, CLM-1822-H) was used. All cells were maintained at 37C and 5% CO2.
METHOD DETAILS
Cell Proliferation Assays
Cell lines were cultured in 96-well plates at 1,000 cells per well in triplicate in a final volume of 0.2 ml RPMI-1640 media (Corning) under the conditions described in each experiment. A separate group of 3 wells was also plated for each cell line as an initial time point of untreated cells for normalization. After 5 days of growth, 40 μl of Cell Titer Glo reagent (Promega) was added to each well, mixed briefly, and luminescence was read using a SpectraMax M3 plate reader (Molecular Devices). For each well, the fold change in luminescence was calculated as the final luminescence of cells relative to the initial luminescence and reported on a log2 scale and reported as the number of population doublings. In certain figures, fold change in luminescence is calculated relative to untreated cells. Cell culture images were taken using a Primovert microscope (Zeiss).
Generation of Knockout and cDNA Overexpression Cell Lines
sgRNAs (oligonucleotide sequences are indicated in Table S5) were ligated into BsmBI-linearized lentiCRISPR-v2 with T4 ligase (NEB). Lentiviral vectors expressing sgRNAs were transfected into HEK293T cells with lentiviral packaging vectors CMV VSV-G and Delta-VPR using XtremeGene 9 transfection reagent (Roche). Similarly for overexpression, gBlocks (IDT) containing the cDNA of interest were cloned into pMXS linearized with BamHI and NotI by Gibson Assembly (NEB). cDNA retroviral vectors with indicated cDNAs were transfected into HEK293T cells with retroviral packaging plasmids Gag-pol and CMV VSV-G. After 24 hours, media was aspirated and replaced by fresh media. The virus-containing supernatant was collected 48 hours after transfection and filtered using a 0.45 mm filter to eliminate cells. Cells to be transduced were plated in 6-well tissue culture plates and infected in media containing virus and 8 mg/ml of polybrene. Cells were spin infected by centrifugation at 1,100g for 1.5 hr. After transduction, media was changed and cells were selected with puromycin (for sgRNA lentiviral vector) or blasticidin (for overexpression retroviral vectors). Clonal knockout cells were generated from a single cell isolated by serial dilution of selected cells into a 96-well plate. Single cell clones were grown for two weeks, and the resultant knockout clones were expanded. Clones were validated for loss of the relevant protein by immunoblotting.
Immunoblotting
Cells were collected by centrifugation at 600 g for 5 min. Cell pellets were washed twice with ice-cold PBS prior to lysis in cold RIPA lysis buffer (20 mM Tris-Cl pH 7.5, 150 mM NaCl, 1 mM EDTA, 1% Triton X-100, 0.1% SDS, 0.5% sodium deoxycholate) supplemented with protease inhibitors and phosphatase inhibitors (Roche). After sonication of each cell lysate and centrifugation at 20,000 g for 15 min at 4C, supernatants were collected and protein concentration was determined using the Pierce BCA Protein Assay Kit (Thermo Scientific) with bovine serum albumin as a protein standard. Samples were then resolved on 8% or 12% SDS-PAGE gels and analyzed by immunoblotting. Blots were developed using the Li-Cor Odyssey CLx infrared imaging system.
Immunofluorescence
For immunofluorescence assays, 300,000 cells were seeded onto coverslips previously coated with fibronectin. After 12 hours, cells were fixed for 15 minutes at room temperature with 4% paraformaldehyde in PBS. After three PBS washes, cells were permeabilized with cold methanol for 10 minutes at −20C. Cells were washed an additional three times, blocked with 5% normal donkey serum, and incubated with the indicated primary antibody diluted 1:500 in blocking solution for one hour. Cells were washed three times with PBS and incubated with a donkey anti-mouse secondary Alexa Fluor 568 antibody for one hour. Cells were washed three times with PBS, and incubated with a 200 nM solution of DAPI in the dark. Cells were washed three final times, and the coverslip was mounted onto slides with Prolong Gold antifade mounting media (Invitrogen). Images were taken on a Revolve fluorescent microscope (Echo Laboratories).
Metabolite Profiling and Isotope Tracing
Each indicated cell line was cultured in triplicate in 6-well plates and grown for 8 hours in media with or without asparagine. For glutamine tracing experiment, cells were grown in media lacking glutamine supplemented with [U-13C]-glutamine at 2000 uM. Cells were washed three times with 1 mL of cold 0.9% NaCl, and polar metabolites were extracted in 1 mL of cold 80% methanol containing internal standards (MSK-A2–1.2, Cambridge Isotope Laboratories, Inc.). After 10 min extraction by vortexing, samples were centrifuged for 10 min at 10,000 ×g at 4 C and samples were nitrogen-dried before storage at −80C until analysis by LCMS. Analysis was conducted on a QExactive benchtop orbitrap mass spectrometer equipped with an Ion Max source and a HESI II probe, which was coupled to a Dionex UltiMate 3000 UPLC system (Thermo Fisher Scientific, San Jose, CA). External mass calibration was performed using the standard calibration mixture every 7 days.
Dried polar samples were resuspended in 100 μL water and 2 μL were injected into a ZIC-pHILIC 150 × 2.1 mm (5 μm particle size) column (EMD Millipore). Chromatographic separation was achieved using the following conditions: Buffer A was 20 mM ammonium carbonate, 0.1% ammonium hydroxide; buffer B was acetonitrile. The column oven and autosampler tray were held at 25°C and 4°C, respectively. The chromatographic gradient was run at a flow rate of 0.150 mL/min as follows: 0–20 min.: linear gradient from 80% to 20% B; 20–20.5 min.: linear gradient from 20% to 80% B; 20.5–28 min.: hold at 80% B. The mass spectrometer was operated in full-scan, polarity switching mode with the spray voltage set to 3.0 kV, the heated capillary held at 275°C, and the HESI probe held at 350°C. The sheath gas flow was set to 40 units, the auxiliary gas flow was set to 15 units, and the sweep gas flow was set to 1 unit. The MS data acquisition was performed in a range of 70–1000 m/z, with the resolution set at 70,000, the AGC target at 10e6, and the maximum injection time at 20 msec. Relative quantitation of polar metabolites was performed with XCalibur QuanBrowser 2.2 (Thermo Fisher Scientific) using a 5 ppm mass tolerance and referencing an in-house library of chemical standards. Metabolite levels were normalized by cell counting for each condition.
RNA Extraction, Reverse Transcription, Real-time PCR and RNA-Sequencing
RNA was extracted from Jurkat cells using the Qiagen RNeasy mini kit according to the manufacturer’s instructions. 1 ug of RNA was reverse transcribed using the Superscript III Reverse Transcriptase kit (Invitrogen) according to the manufacturer’s instructions. Quantitative real-time PCR (qPCR) was performed using SYBR green master mix and GAPDH was used as a control. The primer sequences are listed in Table S5.
RNA library preparations and sequencing reactions were conducted at GENEWIZ, LLC. (South Plainfield, NJ, USA). RNA samples received were quantified using Qubit 2.0 Fluorometer (Life Technologies, Carlsbad, CA, USA) and RNA integrity was checked using Agilent TapeStation 4200 (Agilent Technologies, Palo Alto, CA, USA).
RNA sequencing libraries were prepared using the NEBNext Ultra RNA Library Prep Kit for Illumina using manufacturer’s instructions (NEB, Ipswich, MA, USA). The sequencing libraries were clustered on a single lane of a flowcell. After clustering, the flowcell was loaded on the Illumina HiSeq instrument (4000 or equivalent) according to manufacturer’s instructions. The samples were sequenced using a 2×150bp Paired End (PE) configuration. Raw sequence data (.bcl files) generated from Illumina HiSeq was converted into fastq files and de-multiplexed using Illumina’s bcl2fastq 2.17 software.
CRISPR-Cas9 Genetic Screen
The epigenetic-focused sgRNA library was designed and the screen performed as previously described (Wang, 2014). Oligonucleotides containing sgRNA sequences were synthesized by Agilent and amplified by PCR and cloned into lentiCRISPR-v2. Briefly, amplicons were inserted into lentiCRISPR-v2, linearized by BsmBI digestion, by Gibson Assembly (NEB). Gibson Assembly products were then transformed into E. coli 10G SUPREME electrocompetent cells (Lucigen). This plasmid pool was used to generate lentivirus-containing supernatants. The titer of lentiviral supernatants was determined by infecting targets cells at several amounts of virus in the presence of polybrene (4 ug/ml), counting the number of drug resistant infected cells after 3 days of selection. 40 million target cells were infected at an MOI of ~0.5 and selected with puromycin (4 ug/ml) 72 hours after infection. An initial pool of 30 million cells was harvested for genomic DNA extraction. The remaining cells were cultured for 14 doublings under specified amino acid deprivation conditions, after which cells were harvested for genomic DNA extraction. sgRNA inserts were PCR amplified, purified and sequenced on a HiSeq 2500 (Illumina) (primer sequences provided below). Sequencing reads were mapped and the abundance of each sgRNA was tallied. Gene score is defined as the median log2 fold change in the abundance between the initial and final population of all sgRNAs targeting that gene. Full result of the screen can be found in the supplementary data. The differential gene score is the difference between the untreated and amino acid deprivation condition gene scores.
Chromatin Immunoprecipitation Sequencing
ChIP analysis was performed as described previously. Briefly, cells were cross-linked with 1% paraformaldehyde for 10 minutes at 37C. Cross-linking was quenched with 125 mM glycine. Cells were pelleted and flash-frozen in liquid nitrogen. Nuclei were isolated and sonicated using a Covaris sonicator. Protein A/G beads were added to 2–4 ug of appropriate antibodies and bound at room temperature for 1.5 hours. Samples were immunoprecipitated with appropriate protein A/G-antibody complexes overnight at 4C. Immunoprecipitates were collected and washed twice each with low salt, high salt, and lithium chloride wash buffers. DNA was eluted, reverse-crosslinked and treated with RNAse and proteinase K before being isolated with a PCR purification kit (Zymogen). DNA was analyzed by quantitative real-time PCR on a QuantStudio 6 Flex Real Time PCR system using SYBR green PCR Master Mix (Applied Biosystems).
ChIP-sequencing samples were sequenced using the Illumina NextSeq 500. ChIP-seq reads are aligned using Rsubread’s align method and predicted fragment lengths calculated by the ChIPQC package (Carroll et al., 2014; Liao, Smyth and Shi, 2019). Normalised, fragment extended signal bigWigs are created using the rtracklayer package. Peak calls are made in HOMER software (Heinz et al., 2010) and their peak summits used in MEME-ChIP software for known and denovo motif discovery (Ma, Noble and Bailey, 2014). Read counts in peaks are calculated using the featureCounts method in the Rsubread library (Liao, Smyth and Shi, 2019). Differential ChIP-seq signal is identified using the binomTest from the edgeR package (Nikolayeva and Robinson, 2014). High confidence ZBTB1 binding events were derived from the intersection of differential ChIP-seq of ZBTB flag samples over their condition matched GFP flag samples (padj < 0.05). Consensus ATF4 peaks are defined as peaks occurring in at least one condition of ATF4 ChIP-seq. Annotation of genomic regions to genes, biological functions and pathways is performed using the ChIPseeker package (Yu, Wang and He, 2015). Meta-peak plot are produced using the soGGi package and ChIP-seq signal heatmaps using the Deeptools and profileplyr software (Ramírez et al., 2014; Carroll and Barrows, 2019).
ATAC-Seq
ATAC-seq was performed as previously described (Buenrostro et al., 2013). Wild-type, ZBTB1 KO or ZBTB1 KO expressing ZBTB1 cDNA cells were treated in the presence or absence of asparagine for 24 hours. Nuclear extracts were prepared from 100,000 cells for each cell line and condition, and incubated with 2.5 μl of transposase (Illumina) in a 50 μl reaction for 30 min at 37 °C. Transposase-fragmented DNA was purified, and the library was amplified by PCR. The library was subjected to high-throughput sequencing using the HiSeq 2000 platform (Illumina). ATAC-seq reads were normalized and displayed as read counts per million mapped reads.
Protein Expression and Purification
The zinc-finger domains of ZBTB1 were N-terminally tagged with a 6X-histidine tag and cloned into a pET vector (Novagen). BL21 Rosetta cells were transformed with the ZBTB1-pET vector and a colony was grown overnight in ampicillin and chloramphenicol at 37C. The overnight culture was scaled to 1L and grown to an A600 of 0.6 before the addition of 0.5mM IPTG and transfer to 16C for growth for 16 hours. Cells were harvested by centrifugation and pellets were lysed with lysis buffer (50 mM Tris-HCl pH 8.0, 300 mM NaCl, 10 mM Imidazole, 1 mM b-mercaptoethanol) containing protease inhibitor. Cells were sonicated and insoluble material was removed by centrifugation. Lysate was loaded onto Ni-NTA resin (Qiagen) and washed twice with wash buffer (50mM Tris-HCl pH 8.0, 300 mM NaCl, 20 mM Imidazole). Protein was eluted with wash buffer containing 250 mM Imidazole, and purity was analyzed by SDS-PAGE.
Gel shift experiments
IRDye 700 and competitor oligonucleotides were purchased from Integrated DNA Technologies (IDT). Oligonucleotide sequences are provided in Table S5. EMSA assays were performed according to Odyssey instructions. Briefly, oligonucleotides were diluted in TE to a final concentration of 20 pmol/uL, and 100 pmol of F and R primers were annealed by heating to 100C and left to slowly cool back to room temperature. Annealed oligos were diluted 1:200 for a working stock solution. Binding reactions contained 10X binding buffer, poly dI-dC, 25 mM DTT, 2.5% Tween 20, relevant oligonucleotides and purified ZBTB1 zinc-finger domain protein. Reactions were performed at room temperature for 30 minutes prior to electrophoresis through a 6% TBE gel (Novex). Gels were imaged using the Odyssey CLx.
QUANTIFICATION AND STATISTICAL ANALYSIS
Statistical analyses were performed on GraphPad Prism 8 or with appropriate computational tools. Error bars represent standard deviation from independent samples or experiments. Sample means, P values, and sample size are indicated in text or figure legends.
DATA AND CODE AVAILABILITY
Raw data from RNA, ChIP and ATAC-sequencing experiments have been deposited in the Gene Expression Omnibus (GEO) and are available under accession code GEO: GSE145783. All other supporting data in this study are available from the Lead Contact on request.
Supplementary Material
Table S1. Differential gene scores for genetic screens, Related to Figure 1.
Table S2. Metabolite profiling data, Related to Figure 2.
Table S3. ATF4 and ZBTB1 overlapping peaks and Gene Ontology, Related to Figure 3.
Table S4. Peaks and Motif Enrichment for ZBTB1 and ATF4, Related to Figure 3.
Table S5. Oligonucleotides used in this study, Related to STAR Methods.
Highlights.
Genetic screens identify transcription factors that regulate amino acid response pathway
ZBTB1 is necessary for the leukemic cell response to asparagine deprivation
ZBTB1 directly binds to ASNS promoter and promotes its transcription
Loss of ZBTB1 sensitizes T-cell leukemia cells to L-asparaginase in vivo
Context and Significance.
Cancer cells display unique amino acid dependencies that can be exploited for therapy. In this study, researchers at the Rockefeller University performed parallel genetic screens to identify genes that enable the response to amino acid deprivation in leukemia. These screens yielded ZBTB1s, a transcription factor that plays a key role in the way that leukemia cells respond to the absence of the amino acid asparagine. Loss of ZBTB1 renders leukemia cells sensitive to low asparagine levels and slows their growth in mice treated with L-asparaginase, a chemotherapeutic drug that removes asparagine from human blood. These findings unravel mechanisms underlying the response of leukemia cells to chemotherapy and, more broadly, nutrient deprivation.
ACKNOWLEDGEMENTS
We thank all members of the Birsoy lab for helpful suggestions. This research is supported by a grant from the STARR Cancer Consortium. This research was also supported by the Center for Basic and Translational Research on Disorders of the Digestive System through the generosity of the Leona M. and Harry B. Helmsley Charitable Trust. K.B. was supported by DP2 (DP2 CA228042-01), Chapman-Perelman MMRF grant, AACR NextGen Grant, and is a Pew-Stewart, Searle and Sidney Kimmel Scholar. O.A.-W. has served as a consultant for H3B Biomedicine, Foundation Medicine Inc, Merck, and Janssen and serves on the scientific advisory board of Envisagenics Inc.; O.A.W. has received prior research funding from H3B Biomedicine unrelated to the current manuscript. K.B serves as a consultant for Nanocare technologies. R.T.W., R.G., and M.C.P. were supported by a Medical Scientist Training Program grant from the National Institute of General Medical Sciences of the National Institutes of Health under award number: T32GM007739 to the Weill Cornell/Rockefeller/Sloan Kettering Tri-Institutional MD-PhD Program. M.C.P. was also supported by an F30/31 Predoctoral Fellowship from the National Cancer Institute under award number: 1-F30CA247026-01. R.T.W. was also supported by an F30/F31 Predoctoral Fellowship from the National Cancer Institute under award number: 1F30CA247199-01. J.G.B. is a Special Fellow of the Leukemia & Lymphoma Society. We thank the Rockefeller University Comparative Bioscience Center and the Genomics Resource Center for their support of the animal and genomic studies, respectively.
Footnotes
DECLARATION OF INTERESTS
The authors declare no competing interests.
Publisher's Disclaimer: This is a PDF file of an unedited manuscript that has been accepted for publication. As a service to our customers we are providing this early version of the manuscript. The manuscript will undergo copyediting, typesetting, and review of the resulting proof before it is published in its final form. Please note that during the production process errors may be discovered which could affect the content, and all legal disclaimers that apply to the journal pertain.
References
- Al-Baghdadi RJT et al. (2017) ‘Role of activating transcription factor 4 in the hepatic response to amino acid depletion by asparaginase’, Scientific Reports. Springer US, 7(1), pp. 1–12. doi: 10.1038/s41598-017-01041-7. [DOI] [PMC free article] [PubMed] [Google Scholar]
- Aslanian AM, Fletcher BS and Kilberg MS (2001) ‘Asparagine synthetase expression alone is sufficient to induce l-asparaginase resistance in MOLT-4 human leukaemia cells.’, The Biochemical journal, 357(Pt 1), pp. 321–8. doi: 10.1042/0264-6021:3570321. [DOI] [PMC free article] [PubMed] [Google Scholar]
- Ben-Sahra I et al. (2013) ‘Stimulation of de novo pyrimidine synthesis by growth signaling through mTOR and S6K1.’, Science (New York, N.Y.), 339(6125), pp. 1323–8. doi: 10.1126/science.1228792. [DOI] [PMC free article] [PubMed] [Google Scholar]
- Bowers SR et al. (2010) ‘Runx1 binds as a dimeric complex to overlapping Runx1 sites within a palindromic element in the human GM-CSF enhancer.’, Nucleic acids research, 38(18), pp. 6124–34. doi: 10.1093/nar/gkq356. [DOI] [PMC free article] [PubMed] [Google Scholar]
- Brian Dalton W et al. (2019) ‘Hotspot SF3B1 mutations induce metabolic reprogramming and vulnerability to serine deprivation’, Journal of Clinical Investigation, 129(11), pp. 4708–4723. doi: 10.1172/JCI125022. [DOI] [PMC free article] [PubMed] [Google Scholar]
- Buenrostro JD et al. (2013) ‘Transposition of native chromatin for fast and sensitive epigenomic profiling of open chromatin, DNA-binding proteins and nucleosome position.’, Nature methods, 10(12), pp. 1213–8. doi: 10.1038/nmeth.2688. [DOI] [PMC free article] [PubMed] [Google Scholar]
- Chan WK et al. (2019) ‘Glutaminase activity of L-asparaginase contributes to durable preclinical activity against acute lymphoblastic leukemia’, Molecular Cancer Therapeutics, 18(9), pp. 1587–1592. doi: 10.1158/1535-7163.MCT-18-1329. [DOI] [PMC free article] [PubMed] [Google Scholar]
- Darman RB et al. (2015) ‘Cancer-Associated SF3B1 Hotspot Mutations Induce Cryptic 3’ Splice Site Selection through Use of a Different Branch Point’, Cell Reports. The Authors, 13(5), pp. 1033–1045. doi: 10.1016/j.celrep.2015.09.053. [DOI] [PubMed] [Google Scholar]
- Ding J et al. (2013) ‘The histone H3 methyltransferase G9A epigenetically activates the serine-glycine synthesis pathway to sustain cancer cell survival and proliferation.’, Cell metabolism, 18(6), pp. 896–907. doi: 10.1016/j.cmet.2013.11.004. [DOI] [PMC free article] [PubMed] [Google Scholar]
- Gutierrez JA et al. (2006) ‘An inhibitor of human asparagine synthetase suppresses proliferation of an L-asparaginase-resistant leukemia cell line.’, Chemistry & biology, 13(12), pp. 1339–47. doi: 10.1016/j.chembiol.2006.10.010. [DOI] [PMC free article] [PubMed] [Google Scholar]
- Gwinn DM et al. (2018) ‘Oncogenic KRAS Regulates Amino Acid Homeostasis and Asparagine Biosynthesis via ATF4 and Alters Sensitivity to L-Asparaginase’, Cancer Cell, 33(1), pp. 91–107.e6. doi: 10.1016/j.ccell.2017.12.003. [DOI] [PMC free article] [PubMed] [Google Scholar]
- Han J et al. (2013) ‘ER-stress-induced transcriptional regulation increases protein synthesis leading to cell death’, Nature Cell Biology. Nature Publishing Group, 15(5), pp. 481–490. doi: 10.1038/ncb2738. [DOI] [PMC free article] [PubMed] [Google Scholar]
- Harding HP et al. (2000) ‘Regulated translation initiation controls stress-induced gene expression in mammalian cells.’, Molecular cell, 6(5), pp. 1099–108. Available at: http://www.ncbi.nlm.nih.gov/pubmed/11106749. [DOI] [PubMed] [Google Scholar]
- Harding HP et al. (2003) ‘An integrated stress response regulates amino acid metabolism and resistance to oxidative stress.’, Molecular cell, 11(3), pp. 619–33. Available at: http://www.ncbi.nlm.nih.gov/pubmed/12667446. [DOI] [PubMed] [Google Scholar]
- Haskell CM et al. (1969) ‘L-asparaginase: therapeutic and toxic effects in patients with neoplastic disease.’, The New England journal of medicine, 281(19), pp. 1028–34. doi: 10.1056/NEJM196911062811902. [DOI] [PubMed] [Google Scholar]
- Horiguchi M et al. (2012) ‘Stress-regulated transcription factor ATF4 promotes neoplastic transformation by suppressing expression of the INK4a/ARF cell senescence factors’, Cancer Research, 72(2), pp. 395–401. doi: 10.1158/0008-5472.CAN-11-1891. [DOI] [PubMed] [Google Scholar]
- Kidd John G., M. D. (1953) ‘Regression of Transplanted Lymphomas Induced in Vivo by Means of Normal Guinea Pig Serum’, Journal of Experimental Medicine, 98(6), pp. 565–582. [DOI] [PMC free article] [PubMed] [Google Scholar]
- Kilberg MS et al. (2012) ‘The Transcription Factor Network Associated With the Amino Acid Response in Mammalian Cells’, Advances in Nutrition: An International Review Journal, 3(3), pp. 295–306. doi: 10.3945/an.112.001891. [DOI] [PMC free article] [PubMed] [Google Scholar]
- Kim H et al. (2014) ‘Transcriptional Repressor ZBTB1 Promotes Chromatin Remodeling and Translesion DNA Synthesis’, Molecular Cell. Elsevier Inc., 54(1), pp. 107–118. doi: 10.1016/j.molcel.2014.02.017. [DOI] [PMC free article] [PubMed] [Google Scholar]
- Krall AS et al. (2016) ‘Asparagine promotes cancer cell proliferation through use as an amino acid exchange factor.’, Nature communications, 7, p. 11457. doi: 10.1038/ncomms11457. [DOI] [PMC free article] [PubMed] [Google Scholar]
- LeBoeuf SE et al. (2019) ‘Activation of Oxidative Stress Response in Cancer Generates a Druggable Dependency on Exogenous Non-essential Amino Acids.’, Cell metabolism. Elsevier Inc., pp. 1–12. doi: 10.1016/j.cmet.2019.11.012. [DOI] [PMC free article] [PubMed] [Google Scholar]
- Matic I et al. (2010) ‘Site-Specific Identification of SUMO-2 Targets in Cells Reveals an Inverted SUMOylation Motif and a Hydrophobic Cluster SUMOylation Motif’, Molecular Cell, 39(4), pp. 641–652. doi: 10.1016/j.molcel.2010.07.026. [DOI] [PubMed] [Google Scholar]
- Nakamura A et al. (2018) ‘Inhibition of GCN2 sensitizes ASNS-low cancer cells to asparaginase by disrupting the amino acid response’, Proceedings of the National Academy of Sciences, p. 201805523. doi: 10.1073/pnas.1805523115. [DOI] [PMC free article] [PubMed] [Google Scholar]
- Pakos-Zebrucka K et al. (2016) ‘The integrated stress response’, EMBO reports, 17(10), pp. 1374–1395. doi: 10.15252/embr.201642195. [DOI] [PMC free article] [PubMed] [Google Scholar]
- Punwani D et al. (2012) ‘Transcription factor zinc finger and BTB domain 1 is essential for lymphocyte development.’, Journal of immunology (Baltimore, Md. : 1950), 189(3), pp. 1253–64. doi: 10.4049/jimmunol.1200623. [DOI] [PMC free article] [PubMed] [Google Scholar]
- Siggs OM et al. (2012) ‘ZBTB1 is a determinant of lymphoid development’, The Journal of Experimental Medicine, 209(1), pp. 19–27. doi: 10.1084/jem.20112084. [DOI] [PMC free article] [PubMed] [Google Scholar]
- Siu F et al. (2002) ‘ATF4 is a mediator of the nutrient-sensing response pathway that activates the human asparagine synthetase gene’, Journal of Biological Chemistry, 277(27), pp. 24120–24127. doi: 10.1074/jbc.M201959200. [DOI] [PubMed] [Google Scholar]
- Wortel IMN et al. (2017) ‘Surviving Stress: Modulation of ATF4-Mediated Stress Responses in Normal and Malignant Cells’, Trends in Endocrinology and Metabolism. Elsevier Ltd, 28(11), pp. 794–806. doi: 10.1016/j.tem.2017.07.003. [DOI] [PMC free article] [PubMed] [Google Scholar]
- Yang X et al. (2018) ‘ATF4 Regulates CD4+T Cell Immune Responses through Metabolic Reprogramming’, Cell Reports. ElsevierCompany., 23(6), pp. 1754–1766. doi: 10.1016/j.celrep.2018.04.032. [DOI] [PMC free article] [PubMed] [Google Scholar]
- Ye J et al. (2010) ‘The GCN2 ATF4 pathway is critical for tumour cell survival and proliferation in response to nutrient deprivation’, The EMBO Journal, 29(12), pp. 2082 LP – 2096. Available at: http://emboj.embopress.org/content/29/12/2082.abstract. [DOI] [PMC free article] [PubMed] [Google Scholar]
- Zhang X et al. (2014) ‘Zbtb1 prevents default myeloid differentiation of lymphoid-primed multipotent progenitors’, Oncotarget, 7(37). doi: 10.18632/oncotarget.11356. [DOI] [PMC free article] [PubMed] [Google Scholar]
- Zhao E et al. (2016) ‘KDM4C and ATF4 Cooperate in Transcriptional Control of Amino Acid Metabolism’, Cell Reports. The Authors, 14(3), pp. 506–519. doi: 10.1016/j.celrep.2015.12.053. [DOI] [PMC free article] [PubMed] [Google Scholar]
Associated Data
This section collects any data citations, data availability statements, or supplementary materials included in this article.
Supplementary Materials
Table S1. Differential gene scores for genetic screens, Related to Figure 1.
Table S2. Metabolite profiling data, Related to Figure 2.
Table S3. ATF4 and ZBTB1 overlapping peaks and Gene Ontology, Related to Figure 3.
Table S4. Peaks and Motif Enrichment for ZBTB1 and ATF4, Related to Figure 3.
Table S5. Oligonucleotides used in this study, Related to STAR Methods.
Data Availability Statement
Raw data from RNA, ChIP and ATAC-sequencing experiments have been deposited in the Gene Expression Omnibus (GEO) and are available under accession code GEO: GSE145783. All other supporting data in this study are available from the Lead Contact on request.