Abstract
The purpose of this study was to investigate metal artifact reduction effect of orthopedics metal artifact reduction (O-Mar) algorithm in computer tomography (CT) image of patients who have undergone total hip arthroplasty (THA) or total knee arthroplasty (TKA).
35 cases of patients who underwent TKA or THA have been recruited in this study. CT image of hip or knee joint was obtained with Philips 256-row CT scanner. Tube voltages of 120 and 140 kilovolt peak (KVP) were set. Afterwards, CT image was reconstructed by O-Mar algorithm to reduce metal artifact. Grade of image quality and severity of metal artifact would be taken into qualitative evaluation. While, quantitative evaluation mainly included measurement of metal artifact volume and 2D measurement of average CT value in region of interest (ROI). The visibility of interface between bone–prostheses was also estimated.
Result of qualitative analysis indicated that score of CT quality was improved and grade of metal artifact was decreased significantly with O-Mar. Quantitative analysis illustrated that volume of beam-hardening (B-H) metal artifact decreased remarkably after reconstruction of O-Mar (P < .001). In addition, O-Mar algorithm reduced 83.3% to 83.7% volume of photon-starvation (P-S) metal artifact. As for result of 2D measurement, CT value in ROI was closer to standard value in O-Mar group CT image (P < .001). Meanwhile, error of CT value also decreased significantly after reconstruction of O-Mar algorithm. Visibility rate of bone–prosthesis interface improved from 34.3% (Non-O-Mar) to 66.7% (O-Mar).
O-Mar algorithm could significantly reduce metal artifact in CT image of THA and TKA in both 2D and three-dimensional (3D) level. Therefore, better image quality and visibility of bone–prostheses interface could be presented. In this study, O-Mar was proved as an efficient metal artifact reduction method in CT image of THA and TKA.
Keywords: arthroplasty, computer tomography, diagnostic accuracy, metal artifact, O-Mar
1. Introduction
In worldwide, the amount of arthroplasty surgery has exceeded 1 million per year, among which total knee arthroplasty (TKA) and total hip arthroplasty (THA) occupied a major percentage.[1] Though surgical technology of arthroplasty was relatively mature, various, and intricate complications always occurred after operation.
Radiography was a common method to detect postoperative complications of arthroplasty. It has high-density resolution in 2D level and could avoid the interference of metal artifact. But main limitation of radiography was overlap of structures and low spatial resolution.[1–3] In order to make accurate diagnosis of complications, computer tomography (CT) examination became essential. According to report of Tang et al, diagnostic accuracy of stability of femoral stem and acetabular cup were merely 44.6% and 67.3% of X-ray, meanwhile they were 39.6% and 74.6% of CT image. Compared with X-ray, CT image has no significant improvement of diagnostic accuracy, which mainly due to the interference of CT metal artifact.[1] The main cause of metal artifact was huge difference of density between metal implant and skeletal muscle tissue.[2–4] The main classification of metal artifact included bright streak artifact caused by beam-hardening, dark band artifact caused by photon-starvation as well as scatter artifact.[2–7] Metal artifact could shelter bone–implant interface, periprosthetic fracture lines, and surrounding tissue, hence resulting in misdiagnosis.[7,8] Consideration of the damage of CT metal artifact, various methods had been used to diminish metal artifact, including application of higher tube voltage and tube current, narrower field of view (FOV) and collimation, thinner scan section.[8] In addition to alteration of scan parameters, metal artifact reduction algorithms were also developed to reduce metal artifact.[9–11]
Orthopedics Metal Artifact Reduction (O-Mar) algorithm was a novel and promising technique which was particularly designed for Philips 256-rows spiral CT scanner. The basic principle of O-Mar was an iterative loop which could segment and extract pixels of metal artifact step by step and eventually reconstruct more accurate image. Since O-Mar emerged in 2012, it's remarkable metal artifact reduction effect was generally reported, especially it's application in large-size orthopedic implants, such as joint prostheses, osteosynthesis plates, and spinal pedicle screws.[9,12] There were several inherent advantages of O-Mar. First, no excess radiation dose was brought by O-Mar algorithm.[9] Second, CT image could be reconstructed with O-Mar, even if CT scan was finished. As for scan parameters, according to previous studies, enhancement of tube voltage could heighten effect of metal artifact reduction of O-Mar technique.[13,14] In order to confirm this view, tube voltages of 120 and 140 kilovolt peak (KVP) were selected in this study.
Currently massive studies have focused on metal artifact reduction effect of O-Mar in 2D level which mainly including improvement of image quality and correction effect of CT value error.[11,15–17] But to our knowledge, no previous studies have focused on metal artifact reduction effect of O-Mar in three-dimensional (3D) level via measurement of the volume of metal artifact. The objective of this study was to investigate metal artifact reduction effect of O-Mar in both reduction of metal artifact in 3D level as well as correction effect of CT value error.
2. Materials and methods
Ethics approval was obtained from Medical Research Ethics Committee of the Second Hospital of Jilin University before execution. This study was conducted in accordance with the principles of Helsinki declaration. Inform consent was obtained from each patient who had been recruited in our study. All information of participants was kept secret.
2.1. Patients’ data
From November 2016 to March 2018, 35 cases of patients aged from 38 to 78 (average age: 61.5 ± 10.9) who had undergone THA or TKA were recruited in our study. The number of patients who have undergone THA was 20 (unilateral: 14, bilateral: 6) and TKA was 15 (unilateral: 12, bilateral: 3). There were 26 hip prostheses and 18 knee prostheses for metal artifact evaluation. The exclusive criterion of this study was as follows:
-
(1)
Patients with severe hyperthyreosis.
-
(2)
Female patients who were within the whole pregnant period.
In addition to inclusive criterion of recruited patients, there were also selection criteria for materials of joint prostheses. The materials of femur and acetabulum prostheses were Ti6Al4V alloy in THA. While, they were Co–Cr–Mo and Ti6Al4V alloy of femur and tibia prostheses in TKA.
2.2. CT image acquisition
CT image was obtained with single-energy 256-rows CT scanner (Philips Healthcare, Japan). The scan parameters were as follows. Tube voltage: 120 and 140 KVP. Tube current: 232 mA. Tube current time: 301 mAs. Rotation time: 0.75 seconds. Layer thickness: 0.9 mm. Increment: 0.45 mm. FOV: 40.0 cm. CTDIvol: 20.8 mGy (120 KVP) and 30.8 mGy (140 KVP). DLP: 705.3 mGy ∗ cm (120 KVP) and 1402.2 mGy ∗ cm (140 KVP). Matrix: 512 × 512. Window setting level: 500 Hounsfield unit (HU). Width: 1500 HU. There were 4 subgroups of CT image in each CT scan consequence: 120 KVP/Non-O-Mar, 120 KVP/O-Mar, 140 KVP/Non-O-Mar, 140 KVP/O-Mar. Eventually, CT data was preserved as Digital Imaging and Communications in Medicine (DICOM) format and imported into Materialise Interactive Medical Image Control System (Version 19.0, IBM Corp, Somers, NY).
2.3. Qualitative analysis
One senior musculoskeletal radiologist who had 7 years’ radiology experience and 1 junior radiologist who had 2 years’ experience evaluated image quality and grade of metal artifacts independently. The evaluation criterion was shown in Tables 1 and 2. While grading CT image, radiologists were kept blinded to message of patients as well as parameters of CT scan. Afterwards average scores of image quality and severity of metal artifact were calculated to compare between O-Mar and Non-O-Mar image. Intraclass correlation coefficients (ICC) were used to represent interobservers’ agreement between senior and junior radiologists.
Table 1.
Qualitative evaluation criterion of metal artifacts.
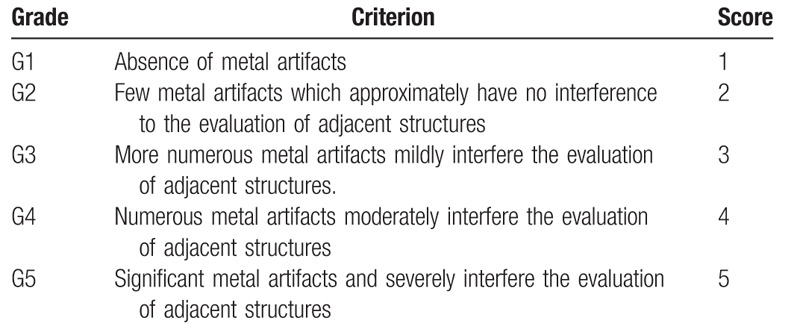
Table 2.
Qualitative evaluation criterion of image quality.

2.4. Quantitative analysis
2.4.1. 3D measurement of beam-hardening metal artifact
Each subgroup of CT image was imported into materialise interactive medical image control system (Mimics) Software individually (Fig. 1). 3D reconstruction was performed with defaulted window of bone tissue (from 225 to 2300 HU) in Mimics Software. Beam-hardening (B-H) metal artifact and bone tissue were selected simultaneously in acquired 3D-model (Fig. 2). Afterwards volume of 3D-model was measured and compared between each subgroup of CT image.
Figure 1.
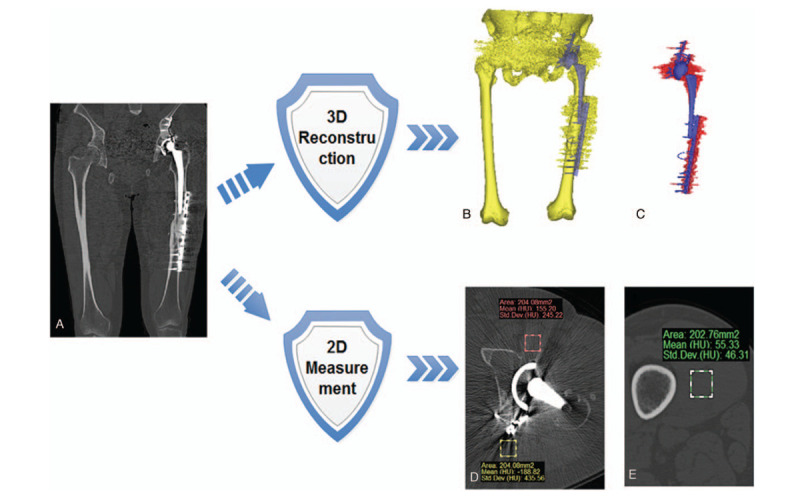
Brief flow chart of measurement procedure. (A) Original CT image, (B) 3D measurement of B-H metal artifact, (C) 3D measurement of P-S metal artifact, (D) 2D measurement of average CT value in ROI, and (E) measurement of standard CT value of muscle in non-metal layer.
Figure 2.
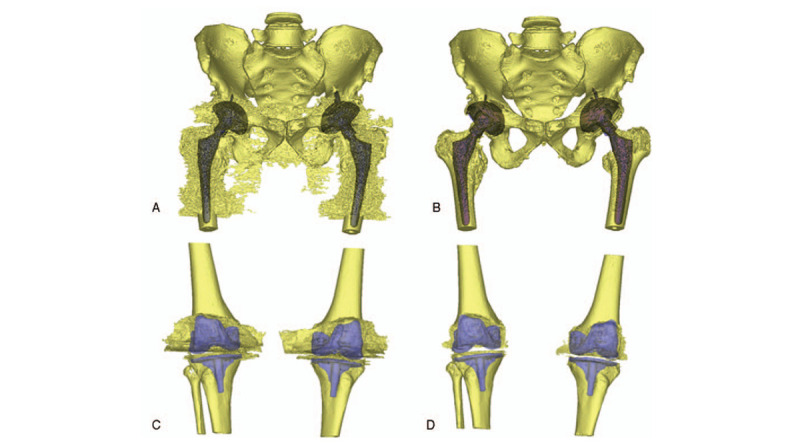
3D reconstruction of CT image and measurement of beam-hardening metal artifact. 3D reconstruction image of a 56-year-old male with bilateral hip prostheses in 2 years’ follow-up (A) and (B); 3D reconstruction image of a female with bilateral knee prostheses in 1-wk postoperative examination (C) and (D). (A and C) Non-O-Mar image; (B and D) O-Mar image. The redundant section of 3D-model was B-H metal artifact.
2.4.2. 3D measurement of photon-starvation metal artifact
Photon-starvation (P-S) metal artifact was reconstructed with CT value default from −1024 to −500 HU. CT value of P-S artifact was approximate with the value of atmosphere (−1000 HU). Therefore, during 3D reconstruction, in order to avoid association with atmosphere, threshold scope (−1024 to −500 HU) was selected, which could comprise majority of P-S metal artifact, meanwhile avoiding P-S artifact interacting with atmosphere. The volume of P-S metal artifact was measured and compared between O-Mar and Non-O-Mar group CT image (Fig. 3).
Figure 3.
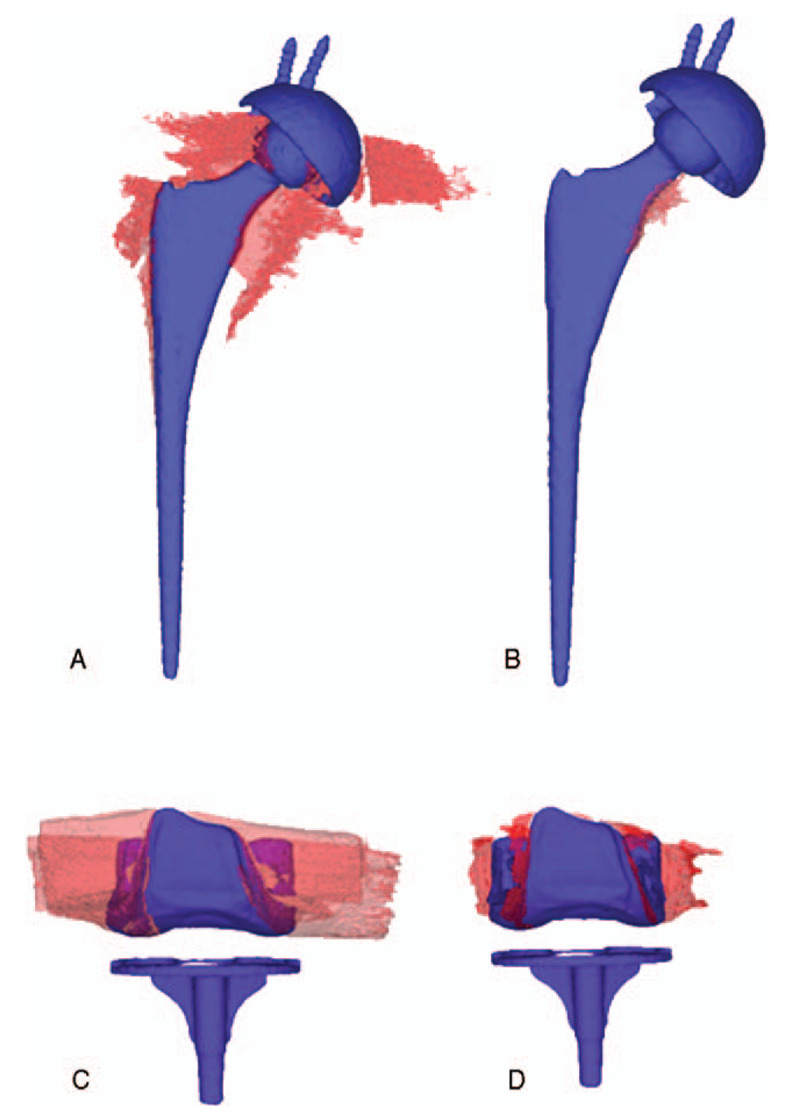
3D reconstruction image of photon-starvation metal artifact and joint prostheses. Non-O-Mar image (A) and O-Mar image (B) of a 68-year-old female who had undergone unilateral total hip arthroplasty. Non-O-Mar image (C) and O-Mar image (D) of a 56-year-old female who had undergone unilateral total knee arthroplasty. After reconstruction of O-Mar, the volume of P-S metal artifact (Red substance) has decreased remarkably.
2.4.3. 2D measurement of average CT value in region of interest
Two rectangular region of interest (ROI) were chosen retrospectively with identical square in each subgroup of CT image. ROIa and ROIb were both selected in location of muscle tissue surrounding prostheses (Fig. 4). ROIa focused on B-H metal artifact (Bright metal artifact). ROIb was focused on P-S metal artifact (Dark metal artifact). The average CT value in ROI was recorded to compare with standard CT value of muscle which was measured in a non-metal layer (Fig. 1). Absolute value of difference between average CT value in ROI and standard CT value of muscle was expressed as |CT value-Standard|, which represented error of CT value in ROI.
Figure 4.
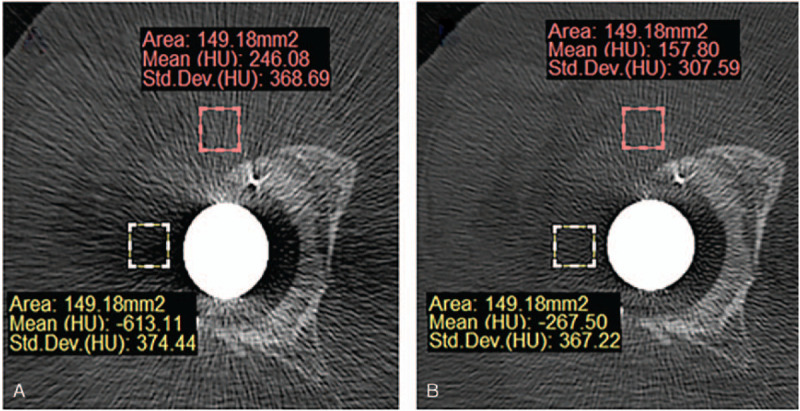
Procedure of 2D measurement of average CT value ROI. Red rectangle was ROIa which focused on B-H metal artifact. Yellow rectangle was ROIb which focused on P-S metal artifact. (A) Non-O-Mar image and (B) O-Mar image.
2.4.4. Visibility of bone–prostheses interface
The visibility of bone–prostheses interface was evaluated by a senior radiologist who has 7 years’ of experience in musculoskeletal radiography. Visible degree of bone–prostheses interface was compared between 120/Non-O-Mar and 120/O-Mar subgroup CT image. The result was described as visible or invisible. In image of THA, the visibility of bone–prostheses interface was viewed in axial and coronal view. Because metal artifact was mainly centralized at femoral side in THA, the interface of femoral stem–femoral medullary cavity was chosen to assess visibility. In image of TKA, visibility of interface was evaluated in sagittal view (Fig. 5). Interface of femoral prostheses–femur resected surface was selected for evaluation because P-S metal artifact was more severe at femoral side in TKA.
Figure 5.
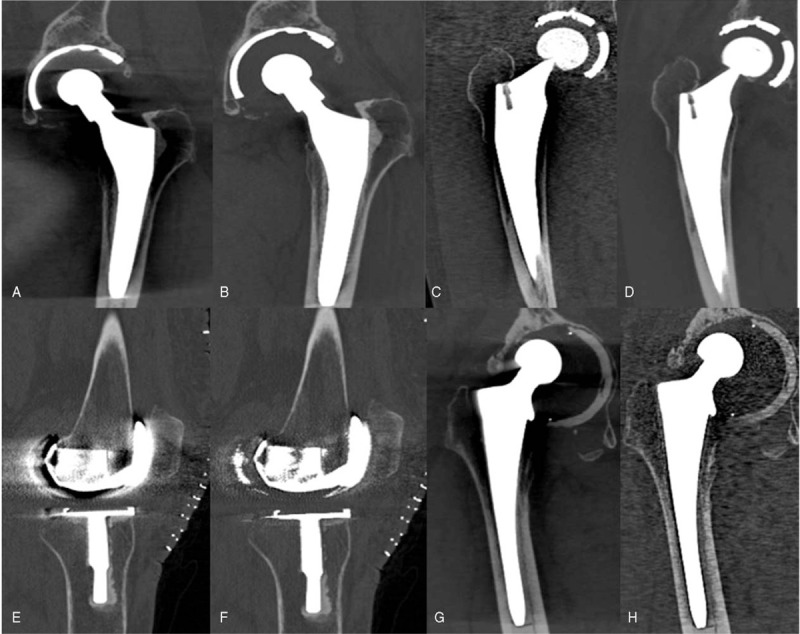
Visibility of interface between bone–prostheses of Non-O-Mar and O-Mar CT image. Coronal view CT image of a 75-year-old male who had undergone unilateral THA 1 yr ago (A and B). Coronal view CT image of a 56-year-old male who had undergone unilateral THA 3 yr ago (C and D). Sagittal view CT image of a 62-year-old female who had undergone bilateral TKA 1 wk ago (E and F). Coronal view CT image of a 73-year-old male who had undergone unilateral THA 8 yr ago (G and H). Non-O-Mar image (A, C, E, and G) and O-Mar image (B, D, F, and H).
3. Statistical analysis
All statistical analysis was carried out using SPSS Statistics for Windows version 21.0 (Released 2012, IBM Corp, Armonk, NY). All parameters were expressed as mean ± standard deviation (SD). Interobserver agreement of image quality and severity of metal artifact was calculated using ICC. ICC value between 0.21 and 0.40 indicated fair agreement; 0.41 and 0.60 indicated moderate agreement; 0.61 and 0.80 indicated good agreement; and >0.81 indicated excellent agreement. 3D volume of metal artifact and CT value in ROI was compared between Non-O-Mar and O-Mar group CT image using paired sample t-test to test statistical significance (with a level of significance α = .05).
4. Result
4.1. Result of qualitative measurement
Result of qualitative measurement indicated that compared with Non-O-Mar image, O-Mar image has lower score of metal artifact and higher score of image quality. ICC values of artifact severity between junior and senior radiologists were 0.92 (Non-O-Mar) and 0.94 (O-Mar). Meanwhile, they were 0.90 (Non-O-Mar) and 0.89 (O-Mar) of image quality (Table 3). All ICC values ranged from 0.81 to 1.0, which illustrated excellent agreement between junior and senior radiologists.
Table 3.
Qualitative score of metal artifact and image quality.

4.2. Result of quantitative measurement
4.2.1. 3D measurement result of metal artifact
In this study, the result of 120/Non-O-Mar group was defined as 100%. As was illustrated in Table 4, after reconstruction of O-Mar, mean total volume of B-H metal artifact and bone tissue in 120 and 140 KVP group decreased from 614.6 cm3 and 573.0 cm3 to 447.3 cm3 and 418.8 cm3, both with significant difference (P < .05) (Table 4 and Fig. 6). Meanwhile, mean volume of P-S metal artifact decreased from 49.1 cm3 to 9.1 cm3 in 120 KVP group, and from 44.15 cm3 to 6.44 cm3 in 140 KVP group (P < .01). On the basis of results of metal artifact volume, it could be concluded that O-Mar algorithm could effectively reduce both B-H and P-S metal artifact in 3D level.
Table 4.
3D measurement result of metal artifact.
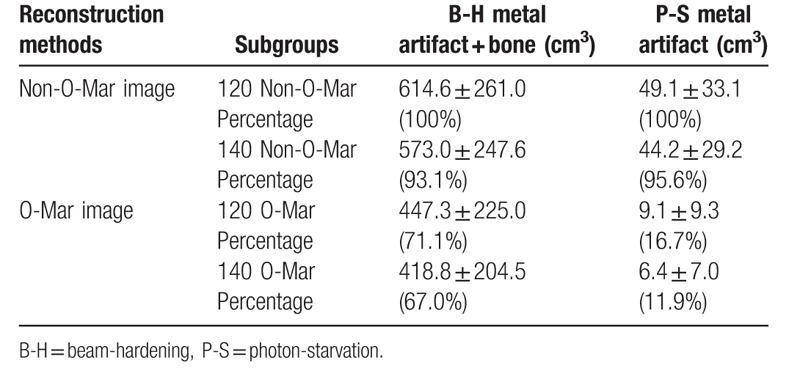
Figure 6.

Volume of metal artifact and error of CT value in ROI. B-H = beam-hardening, CT = computer tomography, HU = Hounsfield unit, O-Mar = orthopedics metal artifact reduction, ROI = region of interest, s = photon-starvation.
4.2.2. 2D measurement result of CT value
|CT value-Standard| could represent the accuracy of CT value and was defined as error of CT value. As was shown in Table 5, after reconstruction of O-Mar, |CT value-Standard| of ROIa decreased from 451.5 and 405.5 HU to 133.1 and 123.0 HU in 120 and 140 KVP group (P < .001) (Table 6). While, |CT value-Standard| of ROIb also decreased from 639.9 and 613.4 HU to 254.8 and 217.8 HU in 120 and 140 KVP group (P < .001). In contrast to Non-O-Mar image, average CT value in ROI was more approximate with standard CT value of muscle in O-Mar image. Reduction of CT value error proved the image correction effect of O-Mar algorithm in 2D level.
Table 5.
2D measurement result of average CT value in ROI.

Table 6.
P value between subgroups of CT image.

4.2.3. Visibility of the interface between bone–prosthesis
In evaluation of visibility of bone–prosthesis interface, it could be concluded that O-Mar could eliminate metal artifact effectively thereby providing more clear visibility of bone–prosthesis interface. In THA, visible rate of interface between femoral stem–femoral medullary cavity improved from 40% (8/20) of Non-O-Mar image to 85% (17/20) of O-Mar image. Meanwhile, visible rate of interface between femoral prostheses-resected femur enhanced from 26.7% (4/15) of Non-O-Mar image to 85.7% (13/15) of O-Mar image.
5. Discussion
It was revealed in this study that with application of O-Mar, the volume of B-H and P-S metal artifact both decreased significantly in CT image of patients who had undergone THA or TKA (P < .001). Meanwhile the visible rate of bone–prostheses interface had remarkable improvement, which might provide higher diagnosis accuracy of postoperative complications. It could also be concluded that O-Mar should be taken into routine CT scan for patients who had undergone THA or TKA.
CT metal artifact has severe interference of diagnosis accuracy in postoperative complications after arthroplasty. It could shield the interface between bone–prosthesis, periprosthetic fracture line, and osteolysis spots on the surface of prosthesis.[2,7,12] For instance, it was reported by Guo et al that owing to metal artifact, diagnostic sensitivity of osteointegration spots on surface of femoral stem was merely 36.4% of conventional CT image which was even lower than 50.4% of X-ray.[16] The poor visibility of osteointegration spots will significantly reduce diagnostic accuracy of prosthetic aseptic loosening. Tang et al have also focused on diagnostic accuracy of fixation stability of cement less THA. They found that accuracy of conventional CT was 39% and 74% in femoral and acetabular side, respectively.[1] The low diagnostic accuracy of conventional CT scan was attributed to metal artifact. In their study, tomosynthesis with metal artifact reduction (T-MAR) image has higher accuracy of 82% and 84% in femoral and acetabular prostheses. All the above studies indicated the importance of accurate image examination in postoperative diagnosis of arthroplasty. Seeing that metal artifact brought misdiagnosis to patients who had undergone THA and TKA, O-Mar was applied to eliminate metal artifact in this study.
It could be found in this study that O-Mar could remove 83.3% to 83.7% volume of P-S metal artifact and reduce total volume of B-H metal artifact and bone by 28.9%, both had significant difference (P < .001). B-H metal artifact was caused by beam-hardening phenomenon. In commercial-available CT scanner, energy spectrum of X-ray was polychromatic. While X-ray transmits material, X-ray with low energy was absorbed preferentially than higher energy X-ray, which becomes more easily penetrated.[2,4,18] That was the basic principle of beam-hardening phenomenon. Therefore, B-H artifact always displays as bright artifact which has high CT value and long diffusion distance. High CT value of B-H artifact also makes it difficult to separate prostheses and B-H metal artifact in 3D level (Fig. 1). Photon-starvation metal artifact was dark artifact which had low CT value. It was investigated as band artifact which laid surrounding prostheses in this study (Fig. 3). Though volume of P-S artifact was lower than B-H artifact, it was considered more harmful to image quality.[17] Owing to short diffusion distance of P-S artifact, it was more likely to shelter interface of bone–prostheses, which would severely decrease diagnosis accuracy of prostheses loosening in THA and TKA.[1,16,18] Tang et al proposed that visibility of bone–implant interface was vital in evaluation of fixation stability of femoral stem in cementless THA.[1] They also illustrated that radiolucent line at bone–implant interface and osteointegration spots on surface of femur prostheses (Spot welds) were of great importance to diagnosis of prostheses loosening. These opinions were proposed not only from clinical practice, but also from in vitro metal artifact reduction studies. One cadaveric experiment about metal artifact reduction effect of projection interpolation (PI) MAR technique in THA was carried out by Malan et al. They concluded that more periprosthetic lesions could be investigated in PI-MAR CT image.[18] In this study, the visible percentage of bone–prostheses interface has improved from 34.3% of Non-O-Mar image to 66.7% of O-Mar image. Clear visibility of bone–prostheses interface would undoubtedly provide higher diagnostic accuracy of prostheses aseptic loosening.
In 2D measurement, |CT value-Standard| was selected at region of periprosthetic muscle to assess CT value correction effect of O-Mar. With O-Mar, this parameter in ROIa and ROIb decreased by 54.8 to 66.0% and 59.6 to 61.6%, respectively, which indicated more precise CT value and better image quality in 2D level (Table 2). Clear visibility of periprosthetic soft tissue would enhance postoperative functional evaluation of vital muscles such as hip abductors in THA and quadriceps femoris in TKA. Han et al particularly depicted CT value correction effect of Metal Artifact Reduction (Mar) Software in THA. They found that average CT value in periprosthetic region such as pelvic wall, bladder, and rectal shelf was more approximate with standard value in Mar image.[14] Siddiqui et al reported the diagnostic accuracy of MARS magnetic resonance imaging (MRI) for metal-on-metal (MoM) THA. It was found in their study that metal the visibility of soft tissue had great enhancement after reconstruction of MARS. Therefore, more postoperative complications such as pseudotumor and atrophy of muscle could be diagnosed.[19,20] Similar conclusion could also be acquired in our research.
As for selection of tube voltage, application of higher tube voltage (140 KVP) could assist metal artifact reduction and CT value correction effect of O-Mar. This conclusion was consistent with previous studies. Massive pervious established studies have concluded that within certain scope, application of higher tube voltages could reinforce metal artifact effect of metal artifact reduction software. Optimal range tube voltage was found to be 124 to 146 KVP which was recommended by Mallinson et al.[13] Philips 256-rows spiral CT machine was single-energy scanner which has tube voltage range between 60 and 140 KVP. According to Mallinson et al's recommendation, tube voltage of 120 and 140 KVP was chosen in this research. But with the increase of tube voltage from 120 to 140 KVP, radiological dose also raised from 20.8 to 30.8 mGy. Excess 10 mGy radiation dose was also brought by higher tube voltage. But application of higher tube voltage in O-Mar image could strengthen metal artifact reduction effect. And radiological dose of 30.8 mGy was still within safety range.
The formidable metal artifact reduction capacity of O-Mar was verified in our study. In comparison of Non-O-Mar image, O-Mar image has fewer metal artifact and better image quality. Though there were various advantages of O-Mar, this technology still has several inherent deficiencies. First, algorithm-related metal artifact was generally reported both in O-Mar and other metal artifact reduction algorithms. According to the study of Shim et al, algorithm-related artifact was investigated during image reconstruction procedure of O-Mar.[12] Algorithm-related artifact has also been defined as an intrinsic shortcoming of O-Mar in previous studies. Jeong et al have focused on the metal artifact reduction efficacy of O-Mar.[9] In their study, new artifact which was absent before reconstruction of O-Mar has been observed. This phenomenon was hypothesized to be inaccuracies of pixel segment and classification. The second deficiency was the poor intensity and image contrast ratio of bone cortex. Shim et al used O-Mar in reverse total shoulder arthroplasty in which O-Mar image was found having worse articulation of greater tuberosity, bone cortex, and deltoid muscle.[12] This phenomenon was also observed in this study. The articulation of bone cortex of acetabulum and femur as well as soft tissue was both attenuated in O-Mar image. In order to avoid misdiagnosis, O-Mar corrected CT was strongly recommended to be combined with Non-O-Mar image.
In addition to inherent shortcomings of O-Mar algorithm, there were also several limitations of this study. First, the sample size of this study was relatively small. Larger sample size should be included in further study. Second, most patients had no postoperative complications such as periprosthetic fracture, aseptic loosening, and periprosthetic osteolysis, so the improvement effect of O-Mar in detection rate of complications might be difficult to analyze. Third, signal–noise ratio (SNR) which could represent image quality was not gauged in this study. Finally, though O-Mar related artifact was generally reported in previous studies, it was not investigated in our study. Above-mentioned deficiencies would be generally remedied in further study.
6. Conclusion
The use of O-Mar algorithm could significantly improve image quality and reduce B-H and P-S metal artifact in both 3D and 2D level. In addition, better visibility of interface between bone–prostheses could also be achieved in O-Mar image. However, O-Mar tends to degrade depiction bone cortex and contrast ratio of image. Therefore, O-Mar algorithm should be taken into routine CT scan of THA and TKA as an indispensable supplement.
Author contributions
Conceptualization: Kesong Zhang, Qing Han, Xiaolin Xu, Yong Zhang, Kerong Yang, Bingpeng Chen, Jincheng Wang.
Data curation: Kesong Zhang, Bingpeng Chen, Jincheng Wang.
Formal analysis: Kesong Zhang, Qing Han, Xiaolin Xu, Yong Zhang, Kerong Yang, Jincheng Wang.
Funding acquisition: Qing Han, Jincheng Wang.
Investigation: Kesong Zhang, Xiaolin Xu, Kerong Yang, Jincheng Wang.
Methodology: Kesong Zhang, Qing Han, Xiaolin Xu, Yong Zhang, Kerong Yang, Bingpeng Chen, Jincheng Wang.
Resources: Qing Han, Kerong Yang, Bingpeng Chen.
Software: Kesong Zhang, Qing Han, Kerong Yang, Bingpeng Chen.
Supervision: Kesong Zhang, Bingpeng Chen, Jincheng Wang.
Validation: Bingpeng Chen, Jincheng Wang.
Visualization: Qing Han, Jincheng Wang.
Writing – original draft: Kesong Zhang, Xiaolin Xu.
Writing – review & editing: Kesong Zhang.
Footnotes
Abbreviations: 3D = three-dimensional, B-H = beam-hardening, CT = computer tomography, DICOM = Digital Imaging and Communications in Medicine, FOV = field of view, HU = Hounsfield unit, ICC = intraclass correlation coefficients, KVP = kilovolt peak, Mimics = materialise interactive medical image control system, MoM = metal-on-metal, MRI = magnetic resonance imaging, O-Mar = orthopedics metal artifact reduction, PI = projection interpolation, P-S = photon-starvation, ROI = region of interest, SD = standard deviation, SNR = signal–noise ratio, THA = total hip arthroplasty, TKA = total knee arthroplasty, T-MAR = tomosynthesis with metal artifact reduction.
How to cite this article: Zhang K, Han Q, Xu X, Jiang H, Ma L, Zhang Y, Yang K, Chen B, Wang J. Metal artifact reduction of orthopedics metal artifact reduction algorithm in total hip and knee arthroplasty. Medicine. 2020;99:11(e19268).
All the tests were approved by the ethics committee of the Second Hospital of Jilin University. This study was conducted in accordance with the principles outlined in the Declaration of Helsinki. Informed consent was obtained from the participants included in this study.
This work was supported by (1) National Natural Science Foundation of China [Grant numbers 81802174]; (2) Department of Science and Technology of Jilin Province, P.R.C [Grant numbers 20170204004GX] and [Grant numbers 20180520115JH]; (3) Jilin Province Development and Reform Commission, P.R.C [Grant numbers 2018C010]; (4) Education Department of Jilin Province, P.R.C [Grant numbers JJKH20180106KJ]; (5) Administration of traditional Chinese medicine of Jilin Province P.R.C [Grant numbers 2018115].
The authors have no conflicts of interest to disclose.
References
- [1].Tang H, Yang D, Guo S, et al. Digital tomosynthesis with metal artifact reduction for assessing cementless hip arthroplasty: a diagnostic cohort study of 48 patients. Skeletal Radiol 2016;45:1523–32. [DOI] [PubMed] [Google Scholar]
- [2].Boudabbous S, Arditi D, Paulin E, et al. Model-based iterative reconstruction (MBIR) for the reduction of metal artifacts on CT. Am J Roentgenol 2015;205:380–5. [DOI] [PubMed] [Google Scholar]
- [3].Elliott MJ, Slakey JB. CT provides precise size assessment of implanted titanium alloy pedicle screws. Clin Orthop Relat Res 2014;472:1605–9. [DOI] [PMC free article] [PubMed] [Google Scholar]
- [4].Winklhofer S, Benninger E, Spross C, et al. CT metal artefact reduction for internal fixation of the proximal humerus: value of mono-energetic extrapolation from dual-energy and iterative reconstructions. Clin Radiol 2014;69:e199–206. [DOI] [PubMed] [Google Scholar]
- [5].Filli L, Luechinger R, Frauenfelder T, et al. Metal-induced artifacts in computed tomography and magnetic resonance imaging: comparison of a biodegradable magnesium alloy versus titanium and stainless steel controls. Skeletal Radiol 2015;44:849–56. [DOI] [PubMed] [Google Scholar]
- [6].Xie S, Li C, Li H, et al. A level set method for cupping artifact correction in cone-beam CT. Med Phys 2015;42:4888–95. [DOI] [PubMed] [Google Scholar]
- [7].Pessis E, Sverzut JM, Campagna R, et al. Reduction of metal artifact with dual-energy CT: virtual monospectral imaging with fast kilovoltage switching and metal artifact reduction software. Semin Musculoskelet Radiol 2015;19:446–55. [DOI] [PubMed] [Google Scholar]
- [8].Fraga-Manteiga E, Shaw DJ, Dennison S, et al. An optimized computed tomography protocol for metallic gunshot head trauma in a seal model. Vet Radiol Ultrasound 2014;55:393–8. [DOI] [PubMed] [Google Scholar]
- [9].Jeong S, Kim SH, Hwang EJ, et al. Usefulness of a metal artifact reduction algorithm for orthopedic implants in abdominal CT: phantom and clinical study results. Am J Roentgenol 2015;204:307–17. [DOI] [PubMed] [Google Scholar]
- [10].Kaewlek T, Koolpiruck D, Thongvigitmanee S, et al. Metal artifact reduction and image quality evaluation of lumbar spine CT images using metal sinogram segmentation. J X-ray Sci Technol 2015;23:649–66. [DOI] [PubMed] [Google Scholar]
- [11].Kidoh M, Utsunomiya D, Oda S, et al. CT venography after knee replacement surgery: comparison of dual-energy CT-based monochromatic imaging and single-energy metal artifact reduction techniques on a 320-row CT scanner. Acta Radiol Open 2017;6: doi: 10.1177/2058460117693463. [DOI] [PMC free article] [PubMed] [Google Scholar]
- [12].Shim E, Kang Y, Ahn JM, et al. Metal artifact reduction for orthopedic implants (O-MAR): usefulness in CT evaluation of reverse total shoulder arthroplasty. Am J Roentgenol 2017;209:860–6. [DOI] [PubMed] [Google Scholar]
- [13].Mallinson PI, Coupal TM, Mclaughlin PD, et al. Dual-energy CT for the musculoskeletal system. Radiology 2016;281:690–707. [DOI] [PubMed] [Google Scholar]
- [14].Han SC, Chung YE, Lee YH, et al. Metal artifact reduction software used with abdominopelvic dual-energy CT of patients with metal hip prostheses: assessment of image quality and clinical feasibility. Am J Roentgenol 2014;203:788–95. [DOI] [PubMed] [Google Scholar]
- [15].Komlosi P, Grady D, Smith JS, et al. Evaluation of monoenergetic imaging to reduce metallic instrumentation artifacts in computed tomography of the cervical spine. J Neurosurg Spine 2015;22:34–8. [DOI] [PubMed] [Google Scholar]
- [16].Guo S, Tang H, Zhou Y, et al. Accuracy of digital tomosynthesis with metal artifact reduction for detecting osteointegration in cementless hip arthroplasty. J Arthroplasty 2018;33:1579–87. [DOI] [PubMed] [Google Scholar]
- [17].Postma AA, Das M, Stadler AA, et al. Dual-energy CT: what the neuroradiologist should know. Curr Radiol Rep 2015;3:16. [DOI] [PMC free article] [PubMed] [Google Scholar]
- [18].Malan DF, Botha CP, Kraaij G, et al. Measuring femoral lesions despite CT metal artefacts: a cadaveric study. Skeletal Radiol 2012;41:547–55. [DOI] [PMC free article] [PubMed] [Google Scholar]
- [19].Siddiqui IA, Sabah SA, Satchithananda K, et al. A comparison of the diagnostic accuracy of MARS MRI and ultrasound of the painful metal-on-metal hip arthroplasty. Acta Orthop 2014;85:375–82. [DOI] [PMC free article] [PubMed] [Google Scholar]
- [20].Huang JY, Kerns JR, Nute JL, et al. An evaluation of three commercially available metal artifact reduction methods for CT imaging. Phys Med Biol 2015;60:1047–67. [DOI] [PMC free article] [PubMed] [Google Scholar]


