

Supplemental Digital Content is available in the text
Keywords: cancer, immune infiltration, podoplanin, prognosis
Abstract
Studies of PDPN in cancers have focused on the interactions with palates through the binding with CECL-2 which mainly express on palates and immune cells, while little is known on its interactions with immune cells.
PDPN expression in cancers was analyzed through Oncomine, GEPIA, and TIMER database. Prognostic value (HR, P value from log-rank test) was evaluated through Kaplan–Meier plotter and OncoLnc database. The correlations between PDPN and the infiltrating levels of immune cells in different cancers, and diverse immune markers in gastric cancer were investigated through TIMER database.
High PDPN expression predicted poor overall survival (OS) and post-progression survival (PPS) particularly in gastric cancer (OS P = .0089; PPS P = .00085), especially among patients with Her-2 (+) and lymph node metastasis. In addition, PDPN was positively correlated with infiltrating levels of immune cells, other than B cells in gastric cancer. However, PDPN showed more correlations with immune markers of M2 type TAM (CD163, VSIG4, MS4A4A) and T cell exhaustion (TIM-3, TOX, and GZMB).
These findings all suggest that high PDPN predicts poor survival outcomes, especially for Her-2 (+) gastric cancer patients. Though inducing M2 type TAM and T cell exhaustion, high PDPN can predict high levels of various immune cells infiltration in STAD. Those correlations may bring new ideas to immunology treatment for gastric cancer patients who do not benefit from the existing immune checkpoint inhibitors.
1. Introduction
Podoplanin (PDPN), which is known as Aggrus, PA2.26 antigen, M2A, and T1α, was first reported in 1996. It is a mucin-type transmembrane protein of 36- to 43-kDa, which is relatively conserved between different species.[1] PDPN is found to express on numerous normal cells, such as lung alveolar type I cells, glomerular podocytes, choroid plexuses, osteoblasts, and some types of neurons. Recent studies have shown that PDPN is also expressed by malignant tumors, such as squamous cell carcinoma,[2,3] malignant mesothelioma,[4] and brain tumors.[5] It is known as a specific marker for lymphatic endothelium[6] and is proved to have a major impact on lymphangiogenesis. Besides, clinical evidences have indicated that PDPN may play an important role in epithelial to mesenchymal transition (EMT) in many different cancer types,[7–9] because its function as a sensitive immunohistochemistry marker of lymphovascular invasion (LVI), which is usually recognized as a significant prognostic factor strongly associated with potential lymph node metastasis.[10] Whereas, its underlying mechanism is still unknown. Given that the cytoplasmic tail of PDPN is extremely short, and extracellular part is much longer,[6] many researchers hypothesis that PDPN mediated interactions is more likely to act through a receptor–ligand interaction way. C-type lectin receptor-2 (CLEC-2) has been proved to be the only known endogenic receptor of PDPN, which is highly expressed on both platelets and immune cells such as tumor associated macrophages (TAMs), neutrophils and dendritic cells (DCs), and so on.[11] However, this receptor–ligand interaction of PDPN has only been extensively studied with regard to platelets.[12–14] There is still little data on how PDPN involves in the interactions with immune cells among cancers through the binding with CLEC-2.
Gastric cancer (GC) is a malignant disease which ranks the top leading cause of cancer-related death in the world.[15] Nowadays, immunotherapy has become a new promising way for anti-cancer therapy. Lung cancer and melanoma appears to benefit a lot from immunotherapy for the promising anti-tumor effects, such as programmed death-1 (PD-1), programmed death ligand-1 (PD-L1) inhibitors and cytotoxic T lymphocyte associated antigen∗ 4 (CTLA4) inhibitors. However, those immunotherapies shows poor clinical efficacy in GC.[16] Thus, there is an urgent need to illuminate the immunophenotypes of tumor–immune interactions and identify the novel immune-related therapeutic targets especially in GC.
In this study, based on database analyzing, we tried to evaluate the expression of PDPN and its correlation with prognosis among different cancer patients. Moreover, we tried to investigate the correlations of PDPN with tumor-infiltrating immune cells and related immune markers under the different tumor microenvironment.
2. Methods
2.1. The mRNA expression of PDPN
2.1.1. Oncomine analysis
Oncomine database covers 65 gene chip data sets, 4700 chips and 480 million gene expression data. The mRNA expression level of PDPN gene among various cancer types was evaluated by Oncomine database (https://www.oncomine.org/resource/login.html).[17] The threshold significance is determined by: P-value of .05, fold change of 2, gene rank of all and data type of mRNA.
2.1.2. GEPIA analysis
The online database Gene Expression Profiling Interactive Analysis (GEPIA) (http://gepia.cancer-pku.cn/index.html) was utilized to evaluate the expression of PDPN in different cancer types. GEPIA[18] is an interactive web that includes 9736 tumors and 8587 normal samples from TCGA and the GTEx projects, which analyse the RNA sequencing expression. The median expression of PDPN mRNA on certain tumor type and normal tissue were analyzed and draw out through bar plot in GEPIA.
2.1.3. TIMER analysis
TIMER is a database incorporated 10,009 samples across 23 cancer types from The Cancer Genome Atlas (TCGA) (https://cistrome.shinyapps.io/timer/).[19] The expression of PDPN in different cancer types were analyzed compared with normal tissues.
2.2. PDPN and clinic prognosis
2.2.1. Kaplan–Meier plotter database
The Kaplan–Meier plotter database is capable to assess the effect of 54,000 genes on survival in 21 cancer types. The largest datasets include breast (n = 6,234), ovarian (n = 2,190), lung (n = 3,452), and gastric (n = 1,440) cancer (https://cistrome.shinyapps.io/timer/).[20] The database was based on the gene-chip and RNA-seq date from Affymetrix microarrays. The relationship between PDPN mRNA expression and survival outcome (overall survival [OS] and post progression survival [PPS]) were assessed by Kaplan–Meier plotter through the data of RNA-seq and gene chip, with a follow-up time of 150 months for OS and 80 months of RPS, respectively. The hazard ratio (HR) with 95% confidence intervals and log-rank P value were evaluated.
2.2.2. OncoLnc database
OncoLnc provides the survival data of 8647 patients of up to 21 cancers, along with RNA-seq expression data of numerous gene performed by The Cancer Genome Atlas (TCGA) (https://www.oncolnc.org/).[21] Survival analyses of OS was performed within 21 cancers types according to different PDPN mRNA expression level by Kaplan–Meier plotter. The mean follow-up time was above 10 years, and Cox P-value was analyzed.
2.3. PDPN and infiltrating level of immune cells and immune marker sets
TIMER is a web resource for systematical evaluations of the clinical impact of different immune cells in diverse cancer types (https://cistrome.shinyapps.io/timer/).[22] First, the abundance of six immune cell types: B cell, CD4 T cell, CD8 T cell, neutrophil, macrophage and dendritic cell in the tumor microenvironment is estimated. We analyzed the correlations between PDPN and infiltrating levels of different immune cells in GC, including CD8+ T cells, CD4+ T cells, B cells, neutrophils, macrophages, and dendritic cells. The gene expression levels against tumor purity was displayed on the left-most panel.[23] The scatter plots showing the purity-corrected partial Spearman's correlation and statistical significance. PDPN expression displayed with log2 RSEM, was set as the x-axis, and the infiltrating level were set as the y-axis. Secondly, the gene markers of tumor-infiltrating immune cells were analyzed including the markers of CD8+ T cells, T cells (general), B cells, monocytes, TAMs, M1 macrophages, M2 macrophages, neutrophils, natural killer (NK) cells, dendritic cells (DCs), T-helper 1 (Th1) cells, T-helper 2 (Th2) cells, follicular helper T (Tfh) cells, T-helper 17 (Th17) cells, Tregs, and exhausted T cells.[24–26] These gene markers are referenced in prior studies.
2.4. Statistical analysis
Survival curves were generated through analysis on OncoLnc and Kaplan–Meier plots. P-values, fold changes, and ranks were displayed on Oncomine database analysis. HR and P value or Cox P-values from a log-rank test were displayed through analysis of Kaplan–Meier plots, and OncoLnc database. The correlations of PDPN expression with clinical characteristics were evaluated by Spearman's correlation and statistical significance, and the strength of the correlation was determined using the following guide for the absolute value: 0.00–0.19 “very weak,” 0.20–0.39 “weak,” 0.40–0.59 “moderate,” 0.60–0.79 “strong,” 0.80–1.0 “very strong.” P < .05 were considered statistically significant. The cancer center ethics committee's approval in Tongji Hospital was granted for the study.
3. Results
3.1. The mRNA expression of PDPN in different types of cancers
The PDPN mRNA expression among various cancers and related para-carcinoma tissues was analyzed through Oncomine database and GEPIA (Fig. 1). In Oncomine database (Fig. 1A), PDPN was significantly over-expressed in GC, central nervous system (CNS) cancer, colorectal cancer, esophageal cancer, head and neck cancer, and pancreatic cancer. In addition, PDPN was significantly lowly expressed in bladder cancer, lung cancer, myeloma, ovarian cancer, and prostate cancer. In GEPIA database (Fig. 1B), among 31 cancer types, PDPN was highly expressed in Stomach adenocarcinoma (STAD), colon adenocarcinoma (COAD), Diffuse Large B-cell Lymphoma (DLBC), Esophageal carcinoma (ESCA), Glioblastoma (GBM), Head and Neck squamous cell carcinoma (HNSC), low-grade glioma (LGG), Lung squamous cell carcinoma (LUSC), Pancreatic adenocarcinoma (PAAD), and Rectum adenocarcinoma (READ).
Figure 1.
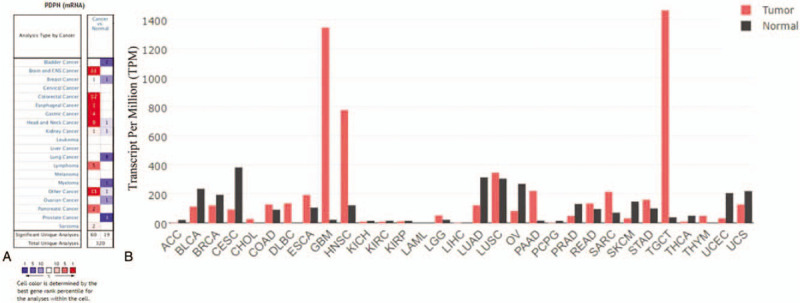
PDPN expression levels in different types of human cancers. (A) PDPN expression level in data sets of different cancer types compared with normal tissues from Oncomine database. The numbers in the colored squares indicate the number of the involved studies. Different colors represent different expression levels of PDPN in those studies, among which red represents high expression and blue represents low expression. The darker the red color, the higher the expression is. The darker the blue color, the lower the expression is. According to these results, PDPN was over-expressed in gastric cancer, central nervous system (CNS) cancer, colorectal cancer, esophageal cancer, head and neck cancer, and pancreatic cancer. In addition, PDPN was lowly expressed in bladder cancer, lung cancer, myeloma, ovarian cancer, and prostate cancer. (B) PDPN expression levels in different types of cancer from GEPIA. The height of bar represents the median expression of certain tumor type or normal tissue. PDPN is also highly expressed in COAD, ESCA, GBM, HNSC, LUSC, PAAD, READ, SARC, STAD, and TGCT, which is consistent with the results from Oncomine database.
Those results were further confirmed by mRNA-seq data through TIMER database (Supplementary Figure 1). The different expressions between tumors and paracarcinoma tissues were compared. PDPN is also significantly over-expressed in STAD. PDPN is significantly highly expressed in COAD, ESCA, HNSC, READ, and STAD and significantly lowly expressed in breast invasive carcinoma (BRCA), bladder urothelial carcinoma (BLCA), Kidney renal clear cell carcinoma (KIRC), Kidney renal papillary cell carcinoma (KIRP), Lung adenocarcinoma (LUAD), Prostate adenocarcinoma (PRAD), Thyroid carcinoma (THCA), and Uterine Corpus Endometrial Carcinoma (UCEC).
The results in three databases showed consistent results of high PDPN expression among COAD, ESCA, HNSC, and STAD. In summary, PDPN was highly expressed in GC confirmed by 3 databases (Oncomine, TIMER, and GEPIA database).
3.2. PDPN and clinic prognosis of STAD
The potential prognosis value of PDPN among different cancer types, especially in GC, was investigated through Kaplan–Meier plotter database (Fig. 2) and verified by OncoLnc database (Supplementary Figure 2A and 2B). First, through Kaplan–Meier plotter database analysis in GC, PDPN expression was significantly correlated with OS and post-progression survival (PPS) in GC. High expression of PDPN predicts poor prognosis among the samples of 876 GC patients (OS n = 876, HR = 1.27, 95% CI = 1.06–1.51, P = .0089; PPS n = 499, HR = 1.45, 95% CI = 1.17–1.81, P = .00085) (Fig. 2A and B). This result was more obvious especially in Her-2 (+) GC patients (OS n = 344, HR = 1.69, 95% CI = 1.3–2.19, P = 6.1E−05; PPS n = 165, HR = 1.71, 95% CI = 1.21–2.43, P = .0021) (Fig. 2C and D). While in Her-2 (−) GC patients, PDPN only showed significant correlations with PPS (PPS n = 334, HR = 1.52, 95% CI = 1.13–2.03, P = .0047), while it has no significant correlations with OS (OS n = 532, HR = 1.21, 95% CI = 0.95–1.55, P = .13) (Fig. 2E and F). Moreover, in Supplementary Table 1, we could see that the medium OS (mOS) among GC patients with high PDPN expression was 3.5-month shorter than those with low PDPN expression patients. Notably, among Her-2 (+) GC patients, the mOS difference reaches to 9.3 months between high PDPN group (17.5 months) and low PDPN group (26.8 months). Similarly, mPPS (medium PPS) is 2.5 months shorter among GC patients with high PDPN expression, while mPPS is 4 month shorter among Her-2 (+) GC patients with high PDPN expression.
Figure 2.
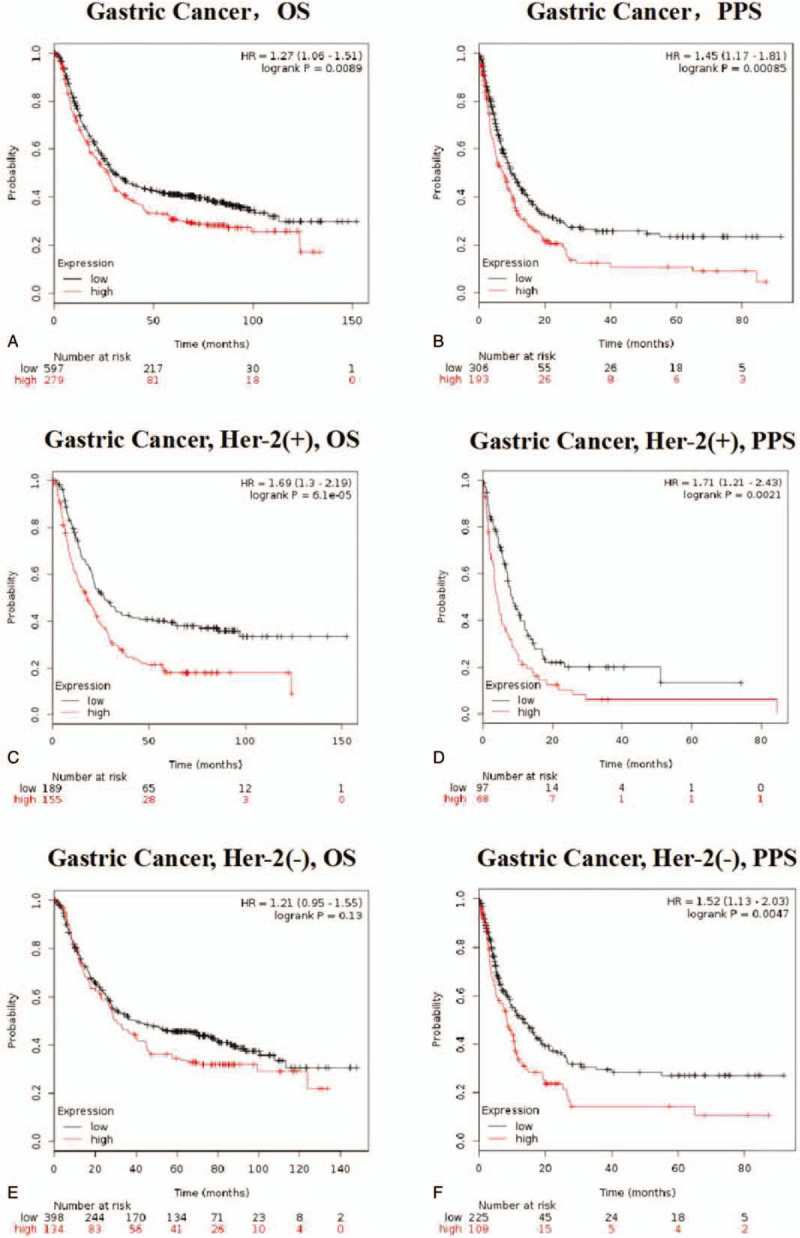
Kaplan–Meier survival curves comparing the high and low expression of PDPN in Gastric cancer (A–F) in the Kaplan–Meier plotter databases. (A and B) OS and PPS survival curves of gastric cancer (n = 876, n = 499). (C and D) OS and PPS survival curves of Her-2(+) gastric cancer (n = 344, n = 165). (E and F) OS and PPS survival curves of Her-2 (−) gastric cancer (n = 532, n = 334). Related medium OS and PPS are displayed in Supplementary Table 1. Those all suggested that PDPN expression may be a potential prognosis marker for STAD, especially for Her-2 (+) gastric cancer patients.
To further confirm those results, OncoLnc was utilized to evaluate the prognostic value of PDPN among different cancer types (Supplementary Figure 2B). In OncoLnc database, the results were consistent that high PDPN expression has significant poor prognosis in STAD (OS P = .00709). While in other cancer types in OncoLnc database, there showed no correlations with survival time. It all suggested that PDPN expression may be a potential prognosis marker for STAD, especially in Her-2 (+) patients.
3.3. High PDPN expression impacts the prognosis of GC especially in patients with Her-2 (+) and lymph node metastasis
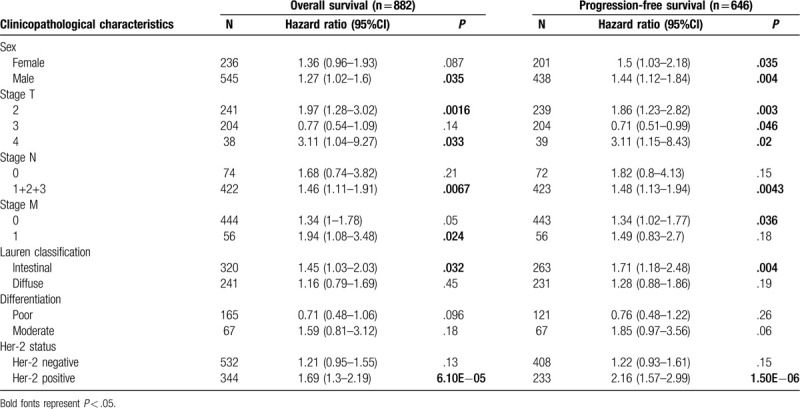
We then evaluated the correlations between PDPN expression with clinical features in STAD in Kaplan–Meier plotter database (Table 1). From the results of our study, high PDPN mRNA expression predicts poor OS and PPS among different clinical features. It is worth noting that high PDPN mRNA expression predicts poor OS and PPS especially in intestinal type of LAUREN classification (OS HR = 1.45, P = .032; PFS HR = 1.71, P = .004). However, it has no significant correlations with diffuse classification. Besides, PDPN also predicts poor prognosis of OS and PFS in positive lymph node metastasis (N1+2+3) (OS N1 + 2 + 3 HR = 1.46, HR = 0.0067; PFS HR = 1.48, HR = 0.0043), which may indicates its important role in lymph node metastasis in GC. For distance metastasis, PDPN expression correlates with OS of M1 gastric patients (OS M1 HR = 1.94, P = .024), which may suggested the predicative role of PDPN in distance metastasis in GC. Of note, high PDPN expression was significantly correlated with OS and PFS among Her-2 (+) GC patients (OS HR = 1.69, P = 6.10E−05; PFS HR = 2.16, P = 1.50E−06). Together, all those results showed that GC with high PDPN expression may significantly correlated with higher risk of lymph node metastasis and distance metastasis. In summary, the prognostic role of PDPN is more significant especially in Her-2 (+) GC patients or patients with metastasis.
Table 1.
Correlation of PDPN mRNA expression and clinical prognosis in gastric cancer with different clinicopathological factors by Kaplan-Meier plotter.
3.4. PDPN expression is correlated with immune infiltration in GC
Through survival analysis, we have demonstrated the prognostic value of PDPN in GC. Since CLEC-2, as the only endogenic receptor of PDPN, mainly expresses in immune cells, we wanted to explore whether PDPN would interacts with CLEC-2 on immune cells in GC. The associations between PDPN expression and the infiltrating level of immune cells among 19 cancer types were then evaluated through TIMER database. Tumor purity is an important factor that influences the analysis of immune infiltration in clinical tumor samples by genomic approaches. PDPN was found to correlate with 13 cancers of B cell infiltration, 13 cancers of CD8+ T cell infiltration, 12 cancers of CD4+ T cell infiltration, 15 cancers of macrophage infiltration, 15 cancers of neutrophil, and 19 cancers of dendritic cell infiltration (Supplementary Table 2, Fig. 3 and Supplementary Figure 3).
Figure 3.
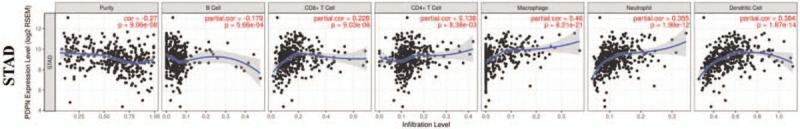
Correlations of PDPN expression with immune infiltration level in STAD (stomach adenocarcinoma). PDPN expression is significantly negatively related to tumor purity and B cell, and it has significant positive correlations with infiltrating levels of CD8+ T cells, CD4+ T cells, macrophages, neutrophils, and dendritic cells in gastric cancer (n = 457).
We found that PDPN was correlated with all those immune cells (B cell, CD8+ T cells, CD4+ T cells, macrophage, neutrophil, DCs) in BLCA, BRCA, LGG, LIHC, KIRC, PAAD and STAD (Supplementary Figure 3 and Supplementary Table 2). In STAD, PDPN expression has significant correlations with all immune cell infiltration levels (Fig. 3A and B). Specifically speaking (Fig. 3A), PDPN expression is negatively related to B cell infiltration (r = −0.179, P = 5.66E−04), and it has significantly positive correlations with infiltration of CD8+ T cells (r = 0.228, P = 9.03E−06), CD4+ T cells (r = 0.138, P = 8.38E−03), macrophages (r = 0.46, P = 8.21E−21), neutrophils (r = 0.355, P = 1.98E−12), and dendritic cells (r = 0.382, P = 1.87E−14). We could imply that high PDPN expression in GC can predict poor prognosis, even though with high infiltrating level of various immune cells.
3.5. Correlations between PDPN expression and immune marker sets in GC
To find out why PDPN associates with high immune cell infiltration while predicts poor survival in GC, the correlations between PDPN expression and typical markers of different types of immune cells were carried out through TIMER database, including CD8+ T cell, T cell (general), B cell, monocyte, tumor associate macrophage, M1 macrophage, M2 macrophage, neutrophils, natural killer cell, dendritic cell (Table 2). Moreover, we also evaluated the makers of different types of functional T cells, such as Th1, Th2, Tfh, Th17, Treg, and T cell exhaustion (Table 2).
Table 2.
Correlation analysis between PDPN and relate genes and markers of immune cells in TIMER in STAD.
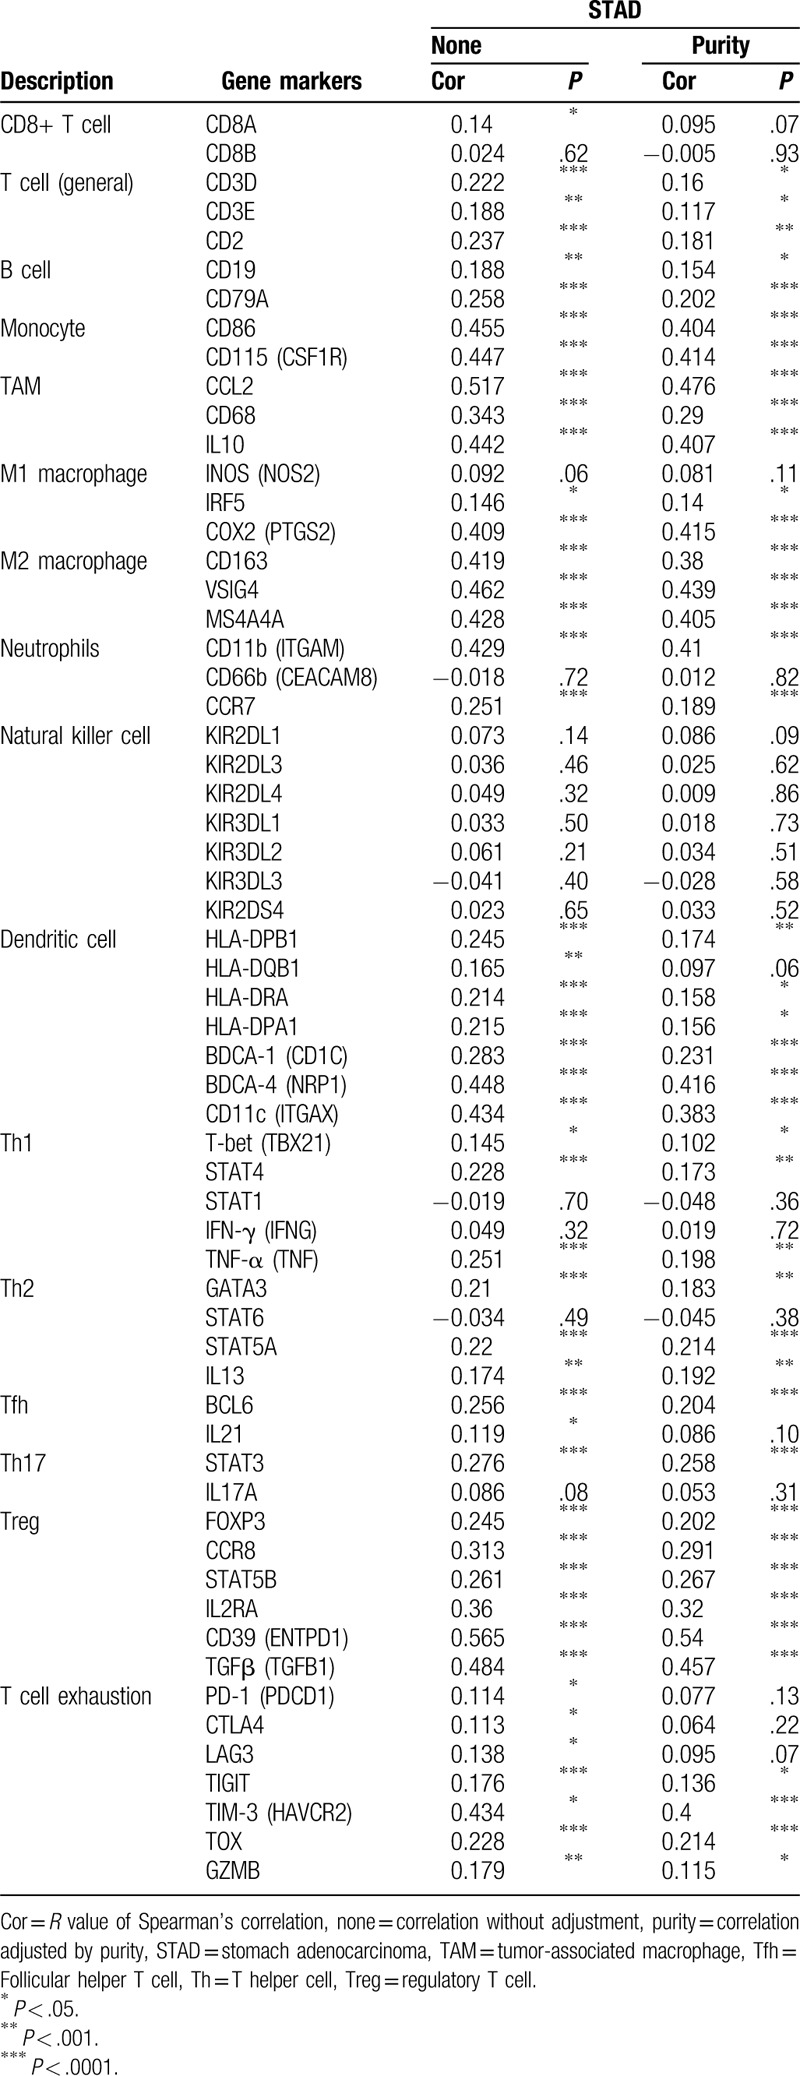
In GC, we found PDPN expression showed no significant correlations with NK cell markers, CD8+ T cell markers, some of M1 macrophage cell markers (NOS2) and Th1, Th2 cell markers (IFN-γ). Besides, PDPN showed very week or week correlations with immune cell markers such T cell, B cell, M1 macrophage, and so on. However, we noticed that PDPN showed significantly moderate correlations with monocyte (ITGAM), TAM markers (CCL2 and IL10), M2 type TAM markers (CD163, VSIG4, and MS4A4A), and DC markers (NRP1 and ITGAX). Notably, among markers of functional T cells, PDPN have significantly moderate correlations with Treg markers sets (CD39, TGF-β). Notably, we also found in T cell exhaustion markers, TIM-3 has a significant moderate correlation with PDPN expression. Those results indicated that high PDPN plays an important role in inducing M2 type TAM and T cell exhaustion. Thus, it explains why PDPN predicts poor survival in GC even with high infiltrating levels of immune cells.
4. Discussion
Cancer immunotherapies, especially in blocking immune checkpoints, have received considerable attention among various tumor types. However, the development of immunotherapy in GC appears to have little progress compared with lung cancer and melanoma. There is an urgent need to find more potential biomarkers in the immunotherapies of GC.
Through our results, PDPN could be a new prognosis biomarker in GC, especially among Her-2 (+) and metastasis cancer patients. In Sakai T's study,[27] among 117 GC patients, they found high expression of PDPN was associated with LN metastasis in T1 early stage of GC. And Raica M[28] also showed that PDPN-positive GC cells select a subgroup of tumors with high potential of invasion and metastasis among 11 advanced GC cases. We further clarified the predicative role of PDPN in survival of GC, especially among Her-2 (+) GC through large sample size analysis. Evidence also showed that PDPN may involve in EMT process and lymph node metastasis.[29] For instance, in cutaneous squamous cell carcinoma (cSCC), PDPN is significantly unregulated in metastatic (P = .002). Furthermore, PDPN has been known as the specific marker for lymphatic vessels, for its role in lymphangiogenesis.[30] Ezrin and moesin, which belong to the ERM (ezrin, radixin, and moesin) protein family, could bind with the cytosolic domain of PDPN, and then rearrange the actin cytoskeleton, which involves in lymphangiogenesis, lymph node metastasis and EMT.[31] Those evidence all suggested that PDPN may involved in the EMT process and play an vital prognosis role in GC, though the underlying mechanism is still unknown.
In fact, the protein of PDPN does not have known functional domains or enzymatic activities.[32] Given that the cytoplasmic tail of PDPN is extremely short, and extracellular part is much longer,[6] researchers hypothesis that PDPN mediated interactions is more likely to act through a receptor–ligand interaction way. CLEC-2, as the only endogenous receptor of PDPN, was highly expressed in platelets and immune cells.[33] The interactions between CLEC-2 and PDPN has been extensively studied in platelets. For instance, Lowe confirmed that PDPN could promote tumor metastasis through the binding with CLEC-2 on platelets.[12] However, the evidence of this interaction between PDPN-expressing cancer cells and immune cells has not been addressed. From our results, we found that PDPN showed an important role in immune infiltration or polarization because of significantly positive correlations with high infiltrating levels of various immune cells (Fig. 3A). However, it showed that PDPN has no significant correlations with B cell infiltration. We assumed that it maybe because CLEC-2 is mainly expressed on platelets and myeloid immune cells, such as DCs, macrophages, T cells, and neutrophils,[34] while it has pretty low expression on B cells.
Among those, PDPN has the highest correlations with macrophage (Cor. = 0.46) and DCs (Cor. = 0.384) infiltration in STAD. Consistent with this, PDPN is also significantly correlated with all 7 markers of DC cells, especially with NRP1 and ITGAX. In non-cancerous diseases, Acton had demonstrated that PDPN, expressing in lymphatic endothelial, interacts with CLEC-2 in DCs to promote DC motility.[35] Conversely, siRNA knock down or genetic deletion of PDPN also resulted in impaired DC migration in vivo in inflammatory disease.[6]
Unfortunately, though DCs functions as the most powerful antigen-presenting cells (APCs), which could activate the anti-tumor effect of T cells, PDPN has no significant correlations with all NK cell markers. Besides, PDPN could aggregate macrophages infiltration, and it was significantly positively correlated with tumor associated macrophage (TAM) marker sets (CCL2, CD68, and IL10), especially M2 type macrophages markers (CD163, VSIG4, and MS4A4A). As the main participants of tumor related inflammation, TAM has vital role in promoting tumor proliferation and migration, immune suppression, and formation of new blood vessels during cancer development.[36] Of which, M1 type macrophages are mainly related to tumor cell identification and attacking, and M2 type is mainly involved in immunosuppression and tumor progression. Macrophages in tumor environments, is influenced by chemotaxis and constantly raised from peripheral circulation. So, we hypothesis that PDPN may participate in the process of M2 type TAM infiltration. Thereby, inhibition of PDPN may reduce the infiltration of TAM, especially the M2 TAM infiltration, thus, improve T cell response, which may become a new thought for immunotherapy. In non-cancer diseases, Rayes J has found deletion of PDPN reduces PDPN-dependent inflammatory macrophage migration to the infected peritoneum. Moreover, pharmacological inhibition of the CLEC-2-PDPN interaction could reduce macrophage infiltrating to the infection site and regulates their inflammatory phenotype in sepsis.[37] All those evidence defines the function of PDPN as a novel biomarker targeting the regulation of macrophage infiltration. However, all those evidence were among non-cancer studies, further studies need be done on the underlining infiltrating mechanism in tumors, especially in STAD.
Apart from those, PDPN was also positively correlated with T cell infiltration and T cell marker sets. Whereas, we found that marker sets of T cell exhaustion (TIM-3, TOX, GZMB, and TIGIT) were significantly correlated, especially for TIM-3 with the highest correlations. TIM-3 is a kind of inhibitory molecules in T cell surface that can cause CD8+ T cell exhaustion (exhausted CD8+ T cells, TEX) in cancers and chronic infections.[38,39] As CTLA-4 and PD-1, TOX is one of the most popular immune treatment targets, E. John Wherry found that TOX+ cells also express inhibitory receptors like PD-1, TIGIT, LAG3, and CD160.[39] They discovered that TOX is the main molecules that regulating TEX differentiation from the level of transcription and epigenetics. In our study, high expression of PDPN also has significantly moderate correlations with TIM-3 and week correlations with TOX, indicating that PDPN's potential role in inducing TEX though TIM-3- and TOX-mediated pathway, thus, facilitate why high PDPN expression correlates with high infiltrating level of immune cells but predicts poor survival in GC. This correlation may bring new ideas to immunology treatment for GC patients who do not benefit from the existing immune checkpoint inhibitors.
However, it should be noted that our study have several limitations. On the one hand, data were collected retrospectively, though they are based on a large sample size from database analysis. More prospective clinical trials are needed. On the other hand, our results only provided indications for the important role of PDPN in the immune environment in GC. However, more vivo and vitro experiments are still needed for further verification on the underlying mechanism of interactions between PDPN and specific immune marker sets and immune cells.
5. Conclusion
In this study, we report that PDPN was highly expressed in STAD, which further predicts poor survival outcomes, especially for Her-2 (+) GC patients. Moreover, our study provides insights that high PDPN can predict high levels of various immune cells infiltration in STAD, though inducing M2 type TAM and T cell exhaustion. Therefore, PDPN may become an emerging cancer biomarker and therapeutic target for GC patients, especially for patients with Her-2 (+).
Acknowledgments
We would like to thank the six-team members (Qi Mei, Xun Yuan, Xue Wang, et al) for the quality assessment and data analyzing work for our study. We appreciate the industrious work of all the staff. This study could not be smoothly conducted without their contribution. This research did not receive any funding from agencies in the public, commercial, or not-for-profit sectors.
Author contributions
Study design and conception: Yuan Chen, Qian Chu and Liya Hu.
Data collection, interpretation, and analysis: Wei Sun, Lei Zhou.
Drafting the manuscript: Liya Hu and Peng Zhang.
Critical revisions of manuscript: Liya Hu and Peng Zhang.
Final approvals: All authors reviewed and approved the final manuscript.
Supplementary Material
Supplementary Material
Supplementary Material
Supplementary Material
Supplementary Material
Supplementary Material
Footnotes
Abbreviations: BLCA = Bladder Urothelial Carcinoma, BRCA = Breast invasive carcinoma, CESC = Cervical squamous cell carcinoma and endocervical adenocarcinoma, CI = Confidence interval, COAD = Colon adenocarcinoma, ESCA = Esophageal carcinoma, GBM = Glioblastoma multiforme, HNSC = Head and Neck squamous cell carcinoma, HR = Hazard ratio, KICH = Kidney Chromophobe, KIRC = Kidney renal clear cell carcinoma, KIRP = Kidney renal papillary cell carcinoma, LGG = Brain Lower Grade Glioma, LIHC = Liver hepatocellular carcinoma, LUAD = Lung adenocarcinoma, LUSC = Lung squamous cell carcinoma, MESO = Mesothelioma, OV = Ovarian serous cystadenocarcinoma, PAAD = Pancreatic adenocarcinoma, PCPG = Pheochromocytoma and Paraganglioma, PRAD = Prostate adenocarcinoma, READ = Rectum adenocarcinoma, SKCM = Skin Cutaneous Melanoma, STAD = Stomach adenocarcinoma, THCA = Thyroid carcinoma.
How to cite this article: Hu L, Zhang P, Sun W, Zhou L, Chu Q, Chen Y. PDPN is a prognostic biomarker and correlated with immune infiltrating in gastric cancer. Medicine. 2020;99:19(e19957).
Novelty and Impact Statements: PDPN is found to be over-expressed in STAD through Oncomine, TIMER and GEPIA database analysis, and it significantly predicts poor prognosis through Kaplan–Meier plotter and OncoLnc database analysis. As CECL-2, the only endogenous receptor of PDPN, mainly expresses on immune cells and plates. We further found out PDPN correlates with high immune infiltrating levels of various immune cells in STAD. However, high PDPN expression significantly has moderate associations with the biomarker of M2 type TAM (CD163, VSIG4, and MS4A4A) and T cell exhaustion (T cell immunoglobulin domain and mucin domain-3 [TIM-3]). These findings all suggest that high PDPN predicts poor survival outcomes and high level of immune cell infiltration in STAD, though inducing M2 type TAM and T cell exhaustion. Those correlations may bring new ideas to immunology cancer treatment for gastric patients who do not benefit from the existing immune checkpoint inhibitors.
All data generated or analyzed during this study are included in this published article [and its supplementary information files]. Data sharing is not applicable to this article as no new data were created or analyzed in this study.
The authors have no funding information to disclose.
The authors have no conflicts of interest to disclose.
Supplemental Digital Content is available for this article.
References
- [1].Scholl FG, Gamallo C, Vilaró S. Identification of PA2. 26 antigen as a novel cell-surface mucin-type glycoprotein that induces plasma membrane extensions and increased motility in keratinocytes. J Cell Sci 1999;112(Pt 24):4601–13. [DOI] [PubMed] [Google Scholar]
- [2].Schacht V, Dadras SS, Johnson LA, et al. Up-regulation of the lymphatic marker podoplanin, a mucin-type transmembrane glycoprotein, in human squamous cell carcinomas and germ cell tumors. Am J Pathol 2005;166:913–21. [DOI] [PMC free article] [PubMed] [Google Scholar]
- [3].Ugorski M, Dziegiel P, Suchanski J. Podoplanin: a small glycoprotein with many faces. Am J Cancer Res 2016;6:370–86. [PMC free article] [PubMed] [Google Scholar]
- [4].Xu M, Wang X, Pan Y, et al. Blocking podoplanin suppresses growth and pulmonary metastasis of human malignant melanoma. BMC Cancer 2019;19:599. [DOI] [PMC free article] [PubMed] [Google Scholar]
- [5].Shibahara J, Kashima T, Kikuchi Y, et al. Podoplanin is expressed in subsets of tumors of the central nervous system. Virchows Arch 2006;448:493–9. [DOI] [PubMed] [Google Scholar]
- [6].Astarita JL, Acton SE, Turley SJ. Podoplanin: emerging functions in development, the immune system, and cancer. Front Immunol 2012;3:283. [DOI] [PMC free article] [PubMed] [Google Scholar]
- [7].Perry C, Soomro I, Kaye P, et al. Analysis of lymphatic and blood vessel invasion biomarkers in T1 esophagogastric adenocarcinomas for improved patient prognostication. Dis Esophagus 2015;28:262–8. [DOI] [PubMed] [Google Scholar]
- [8].Renart J, Carrasco-Ramirez P, Fernandez-Munoz B, et al. New insights into the role of podoplanin in epithelial-mesenchymal transition. Int Rev Cell Mol Biol 2015;317:185–239. [DOI] [PubMed] [Google Scholar]
- [9].Huber GF, Fritzsche FR, Zullig L, et al. Podoplanin expression correlates with sentinel lymph node metastasis in early squamous cell carcinomas of the oral cavity and oropharynx. Int J Cancer 2011;129:1404–9. [DOI] [PubMed] [Google Scholar]
- [10].Swartz MA, Lund AW. Lymphatic and interstitial flow in the tumour microenvironment: linking mechanobiology with immunity. Nat Rev Cancer 2012;12:210–9. [DOI] [PubMed] [Google Scholar]
- [11].Maruyama S, Furuya S, Shiraishi K, et al. Podoplanin expression as a prognostic factor in gastric cancer. Anticancer Res 2018;38:2717–22. [DOI] [PubMed] [Google Scholar]
- [12].Lowe KL, Navarro-Nunez L. Platelet CLEC-2 and podoplanin in cancer metastasis. Thromb Res 2012;129: Suppl 1: S30–7. [DOI] [PubMed] [Google Scholar]
- [13].Chang YW, Hsieh PW, Chang YT, et al. Identification of a novel platelet antagonist that binds to CLEC-2 and suppresses podoplanin-induced platelet aggregation and cancer metastasis. Oncotarget 2015;6:42733–48. [DOI] [PMC free article] [PubMed] [Google Scholar]
- [14].Takemoto A, Miyata K, Fujita N. Platelet-activating factor podoplanin: from discovery to drug development. Cancer Metastasis Rev 2017;36:225–34. [DOI] [PMC free article] [PubMed] [Google Scholar]
- [15].Bray F, Ferlay J, Soerjomataram I, et al. Global cancer statistics 2018: GLOBOCAN estimates of incidence and mortality worldwide for 36 cancers in 185 countries. CA Cancer J Clin 2018;68:394–424. [DOI] [PubMed] [Google Scholar]
- [16].Zhao Q, Cao L, Guan L, et al. Immunotherapy for gastric cancer: dilemmas and prospect. Brief Funct Genomics 2018;1–6. [DOI] [PubMed] [Google Scholar]
- [17].Rhodes DR, Kalyana-Sundaram S, Mahavisno V, et al. Oncomine 3.0: genes, pathways, and networks in a collection of 18,000 cancer gene expression profiles. Neoplasia 2007;9:166–80. [DOI] [PMC free article] [PubMed] [Google Scholar]
- [18].Tang Z, Li C, Kang B, et al. GEPIA: a web server for cancer and normal gene expression profiling and interactive analyses. Nucleic Acids Res 2017;45:W98–102. [DOI] [PMC free article] [PubMed] [Google Scholar]
- [19].Li T, Fan J, Wang B, et al. TIMER: a web server for comprehensive analysis of tumor-infiltrating immune cells. Cancer Res 2017;77:e108–10. [DOI] [PMC free article] [PubMed] [Google Scholar]
- [20].Lanczky A, Nagy A, Bottai G, et al. miRpower: a web-tool to validate survival-associated miRNAs utilizing expression data from 2178 breast cancer patients. Breast Cancer Res Treat 2016;160:439–46. [DOI] [PubMed] [Google Scholar]
- [21].Anaya J. OncoLnc: linking TCGA survival data to mRNAs, miRNAs, and lncRNAs. PeerJ Comput Sci 2016;2:e67. [Google Scholar]
- [22].Aran D, Sirota M, Butte AJ. Systematic pan-cancer analysis of tumour purity. Nat Commun 2015;6:8971. [DOI] [PMC free article] [PubMed] [Google Scholar]
- [23].Pan JH, Zhou H, Cooper L, et al. LAYN is a prognostic biomarker and correlated with immune infiltrates in gastric and colon cancers. Front Immunol 2019;10:6. [DOI] [PMC free article] [PubMed] [Google Scholar]
- [24].Siemers NO, Holloway JL, Chang H, et al. Genome-wide association analysis identifies genetic correlates of immune infiltrates in solid tumors. PLoS ONE 2017;12:e0179726. [DOI] [PMC free article] [PubMed] [Google Scholar]
- [25].Danaher P, Warren S, Dennis L, et al. Gene expression markers of tumor infiltrating leukocytes. J Immunother Cancer 2017;5:18. [DOI] [PMC free article] [PubMed] [Google Scholar]
- [26].Yoshihara K, Shahmoradgoli M, Martinez E, et al. Inferring tumour purity and stromal and immune cell admixture from expression data. Nat Commun 2013;4:2612. [DOI] [PMC free article] [PubMed] [Google Scholar]
- [27].Nakamura Y, Yasuoka H, Tsujimoto M, et al. Importance of lymph vessels in gastric cancer: a prognostic indicator in general and a predictor for lymph node metastasis in early stage cancer[J]. Journal of clinical pathology 2006;59:77–82. [DOI] [PMC free article] [PubMed] [Google Scholar]
- [28].Raica M, Ribatti D, Mogoanta L, et al. Podoplanin expression in advanced-stage gastric carcinoma and prognostic value of lymphatic microvessel density. Neoplasma 2008;55:455–60. [PubMed] [Google Scholar]
- [29].Huong PT, Nguyen LT, Nguyen X-B, et al. The role of platelets in the tumor-microenvironment and the drug resistance of cancer cells. Cancers 2019;11:240. [DOI] [PMC free article] [PubMed] [Google Scholar]
- [30].Chen WS, Cao Z, Sugaya S, et al. Pathological lymphangiogenesis is modulated by galectin-8-dependent crosstalk between podoplanin and integrin-associated VEGFR-3[J]. Nat Commun 2016;7:1–9. [DOI] [PMC free article] [PubMed] [Google Scholar]
- [31].Parhar S, Kaur H, Vashist A, et al. Role of podoplanin in potentially malignant disorders and oral squamous cell carcinoma and its correlation with lymphangiogenesis[J]. Indian J Cancer 2015;52:617. [DOI] [PubMed] [Google Scholar]
- [32].Krishnan H, Rayes J, Miyashita T, et al. Podoplanin: an emerging cancer biomarker and therapeutic target. Cancer Sci 2018;109:1292–9. [DOI] [PMC free article] [PubMed] [Google Scholar]
- [33].Bertozzi CC, Schmaier AA, Mericko P, et al. Platelets regulate lymphatic vascular development through CLEC-2-SLP-76 signaling. Blood 2010;116:661–70. [DOI] [PMC free article] [PubMed] [Google Scholar]
- [34].Mourão-Sá D, Robinson MJ, Zelenay S, et al. CLEC-2 signaling via Syk in myeloid cells can regulate inflammatory responses[J]. Eur J Immunol 2011;41:3040–53. [DOI] [PubMed] [Google Scholar]
- [35].Acton SE, Astarita J, Malhotra D, et al. Podoplanin-rich stromal networks induce dendritic cell motility via activation of C-type lectin receptor CLEC-2. Immunity 2012;37:276–89. [DOI] [PMC free article] [PubMed] [Google Scholar]
- [36].Rodell CB, Arlauckas SP, Cuccarese MF, et al. TLR7/8-agonist-loaded nanoparticles promote the polarization of tumour-associated macrophages to enhance cancer immunotherapy. Nat Biomed Eng 2018;2:578–88. [DOI] [PMC free article] [PubMed] [Google Scholar]
- [37].Rayes J, Lax S, Wichaiyo S, et al. The podoplanin-CLEC-2 axis inhibits inflammation in sepsis. Nat Commun 2017;8:2239. [DOI] [PMC free article] [PubMed] [Google Scholar]
- [38].Wherry EJ, Kurachi M. Molecular and cellular insights into T cell exhaustion. Nat Rev Immunol 2015;15:486–99. [DOI] [PMC free article] [PubMed] [Google Scholar]
- [39].Barber DL, et al. Restoring function in exhausted CD8 T cells during chronic viral infection. Nature 2006;439:682–7. [DOI] [PubMed] [Google Scholar]
Associated Data
This section collects any data citations, data availability statements, or supplementary materials included in this article.