

Abstract
Backgrounds:
Lung adenocarcinoma (LUAD) is one of the most common malignancies, and is a serious threat to human health. The aim of the present study was to assess potential biomarkers for the prognosis of LUAD through the analysis of gene expression microarrays.
Methods:
The gene expression data for GSE118370 was downloaded from the Gene Expression Omnibus (GEO) database. Differentially expressed genes (DEGs) between normal lung and LUAD samples were screened using the R language. The DAVID database was used to analyze the functions and pathways of DEGs. The STRING database was used to the map protein–protein interaction (PPI) networks, and these were visualized with the Cytoscape software. Finally, the prognostic analysis of the hub gene in the PPI network was performed using the Kaplan–Meier tool.
Results:
A total of 406 downregulated and 203 upregulated DEGs were identified. The GO analysis results revealed that downregulated DEGs were significantly enriched in angiogenesis, calcium ion binding and cell adhesion. The upregulated DEGs were significantly enriched in the extracellular matrix disassembly, collagen catabolic process, chemokine-mediated signaling pathway and endopeptidase inhibitor activity. The KEGG pathway analysis revealed that downregulated DEGs were enriched in neuroactive ligand-receptor interaction, hematopoietic cell lineage and vascular smooth muscle contraction, while upregulated DEGs were enriched in phototransduction. In addition, the top 10 hub genes and the most closely interacting modules of the top 3 proteins in the PPI network were screened. Finally, the independent prognostic value of each hub gene in LUAD patients was analyzed through the Kaplan–Meier plotter. Seven hub genes (ADCY4, S1PR1, FPR2, PPBP, NMU, PF4, and GCG) were closely correlated to overall survival time.
Conclusion:
The discovery of these candidate genes and pathways reveals the etiology and molecular mechanisms of LUAD, providing ideas and guidance for the development of new therapeutic approaches to LUAD.
Keywords: differentially expressed genes, gene ontology, kyoto encyclopedia of genes and genomes, lung adenocarcinoma, prognosis, protein–protein interaction
1. Introduction
Lung cancer is a highly differentiated malignant tumor, and the leading cause of cancer-related death in the world.[1] This is majorly classified into small cell lung cancer (SCLC) and non-small cell lung cancer (NSCLC). NSCLC, among which lung adenocarcinoma (LUAD) and lung squamous cell carcinoma (LSQ) are the most common subtypes, accounts for nearly 85% of lung cancers.[2] At the same time, LUAD is the most familiar histological subtype of lung cancer, accounting for almost 50% of all lung cancers in most countries.[3] It has been reported that LUAD is associated with abnormalities, such as epidermal growth factor receptor (EGFR) kinase domain mutations and anaplastic lymphoma kinase (ALK) fusion or rearrangement.[4–7] In recent years, many targeted treatment drugs have been developed for aberrant gene products. Among these, drugs such as gefitinib, erlotinib, and crizotinib, have been widely used in clinical treatment. Unfortunately, merely few patients with LUAD are ideal candidates for targeted therapies.[8] In addition, due to the on-target genetic resistance mutations or off-target mechanisms of resistance, such as the upregulation of bypass signaling pathways, patients receiving these medications may develop resistance and render the treatment ineffective.[9,10] Therefore, revealing the intrinsic mechanisms of LUAD and finding new potential targets is needed for developing effective diagnostic and therapeutic strategies. With the advancement of gene chips and high-throughput second-generation sequencing technologies, more and more genetic data is stored in public databases for researchers to mine. Therefore, the combination of gene expression data with bioinformatics methods can be used to judge the expression of differentially expressed genes (DEGs) in the development and progression of LUAD, and discover potential targets for the treatment of LUAD. For example, Xiao et al used the Gene Cloud Biotechnology Information (GCBI) bioinformatics platform to identify DEGs that eliminated gender differences in LUAD and normal lung tissue. Then, these screened for transcription factor 21 (TCF21) by constructing a gene co-expression network on the GCBI platform. In addition, these used Kaplan–Meier plotters and PrognoScan to assess the prognostic value of TCF 21 in patients with LUAD. It was concluded that the decreased mRNA expression of TCF 21 is a predictor of poor prognosis in patients with LUAD.[11]TCF 21 is inactivated in many cancers due to DNA methylation, which was reported by Jiang et al 1 year later. It was suggested that the development of drugs that target the DNA methylation of TCF21 may have important clinical significance for the treatment or prevention of LUAD.[12]
In the present study, microarray data GSE118370 was downloaded from the Gene Expression Omnibus database (GEO database, http://www.ncbi.nlm.nih.gov/geo). Bioinformatics methods were used to screen for relevant DEGs between disease and normal samples in patients with LUAD. Subsequently, Gene Ontology (GO) terminology and Kyoto Encyclopedia of Genes and Genomes (KEGG) pathway enrichment analysis, and protein–protein interaction (PPI) analysis were performed to screen for key genes and biological pathways that are closely correlated to LUAD patients. Finally, the effect of hub gene expression level on overall survival (OS) was explored. These analysis results can provide new targets in further studies on LUAD.
2. Materials and methods
2.1. Microarray data
The gene expression profiles of the GSE118370 dataset were downloaded from the GEO database (http://www.ncbi.nlm.nih.gov/geo/). The GSE118370 dataset was based on the GPL570 platform, [HG-U133_Plus_2] Affymetrix Human Genome U133 Plus 2.0 Array, which was submitted by Xu et al[13] The GSE118370 dataset contained 12 samples, including 6 LUAD samples and 6 normal lung tissue samples (Table 1).
Table 1.
Information for patients that was used in performing microarray.

2.2. Data preprocessing and DEG screening
The raw data were preprocessed and normalized using the affy package (http://www.bioconductor.org/packages/release/bioc/html/affy.html)[14] under the R environment (version3.5.3, https://www.r-project.org/). Then, the limma package (available at http://www.bioconductor.org/packages/release/bioc/html/limma.html)[15] in R was used to identify DEGs between LUAD samples and normal lung samples. The t-test method was utilized to calculate the P values of genes. Merely genes with | log2fold change | > 2 and P < .05 were considered as DEGs.
2.3. Gene ontology and functional enrichment analysis
The biological function of DEGS was determined by GO enrichment analysis (http://www.geneontology.org).[16] The GO analysis was performed to annotate genes and classify upregulated and downregulated DEGs. The GO terms consisted of 3 parts: biological process (BP), cellular component (CC), and molecular function (MF). The KEGG database (www.genome.jp/kegg/)[17] includes the systematic analysis, annotation, and visualization of gene functions. The database for annotation, visualization and integrated discovery (DAVID, http://david.abcc.ncifcrf.gov/)[18] is a comprehensive functional annotation tool that understands the biological implications behind a large number of genes, and this can be used to analyze the functions of upregulated and downregulated DEGs. The GO enrichment and KEGG pathway analysis were performed using the DAVID online tool. P < .05 was considered statistically significant.
2.4. Construction of the protein–protein interaction (PPI) network and module analysis
The Search Tool for the Retrieval of Interacting Genes/Proteins (STRING, www.string-db.org)[19] is a database that searches for known protein interactions online. The confidence score was set at >0.9 for the PPI analysis. Then, the protein interaction data was imported into the Cytoscape software (version 3.7.1, www.cytoscape.org)[20] to obtain a network map. Afterwards, the most connected modules were analyzed, and the hub gene was identified. P < .05 was considered statistically significant.
2.5. Prognosis analysis using the Kaplan–Meier plotter database
The present study performed an OS analysis of 866 patients with LUAD using the Kaplan–Meier plotter database to assess the prognostic value of the hub gene in patients with LUAD. Gene expression data, and relapse free and OS information were downloaded from the Cancer Genome Atlas (TCGA, http://cancergenome.nih.gov), the GEO database (http://www.ncbi.nlm.nih.gov/geo/), and the European Genome-phenome Archive (EGA, https://www.ebi.ac.uk/ega/).[21] These databases contained gene expression data and survival information from 1928 lung cancer patients, including 866 LUAD patients.
3. Results
3.1. Identification of DEGs in LUAD
The GSE118370 dataset was downloaded from the GEO database. Six LUAD samples and 6 normal lung samples were analyzed. A total of 609 DEGs were identified (|log2fold change | > 2, P < .05), which included 203 upregulated and 406 downregulated genes (Fig. 1A). Subsequently, the expression values of DEGs were hierarchically clustered, and the results were presented in the form of heat maps (Fig. 1B). As shown in Figure 1B, the heat map clearly distinguishes the LUAD samples from normal lung samples.
Figure 1.
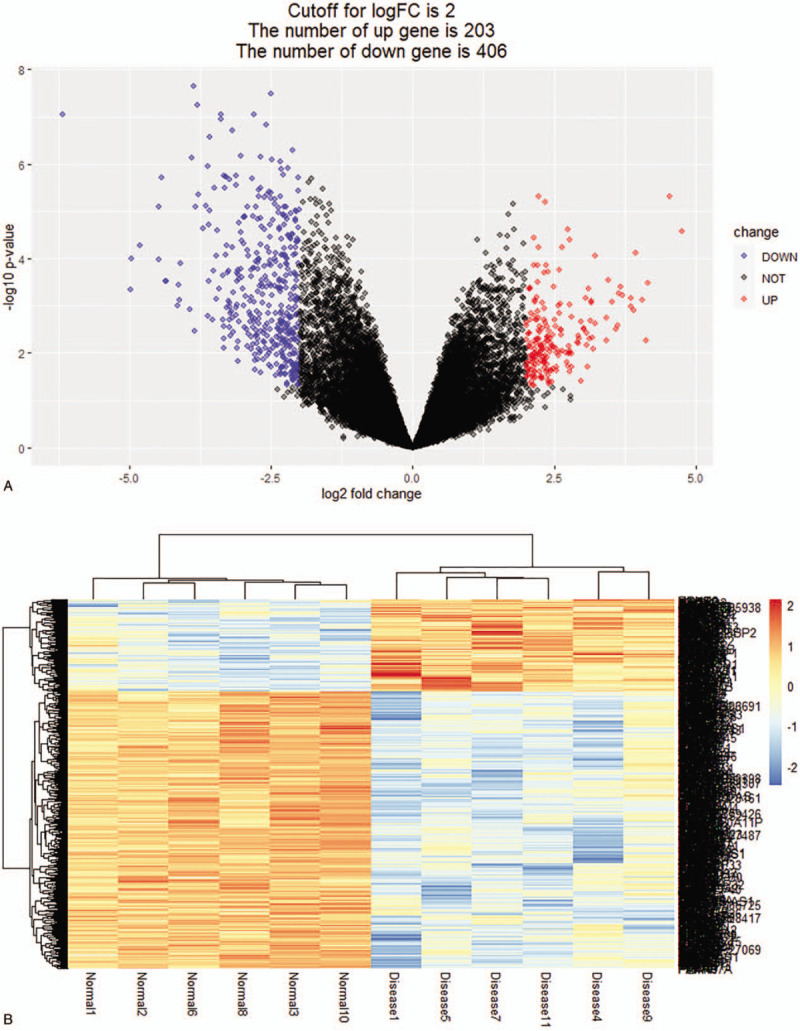
DEGs expression profile in the GEO dataset. (A) A volcano plot of 609 DEGs. Red: upregulation with |log2fold change | > 2, P < .05; blue: downregulation with |log2fold change | > 2, P < .05; black: unchanged genes. (B) Heatmap of the 609 DEGs with |log2fold change | > 2, P < .05. Red: higher expression; blue: lower expression.
3.2. Functional enrichment analysis
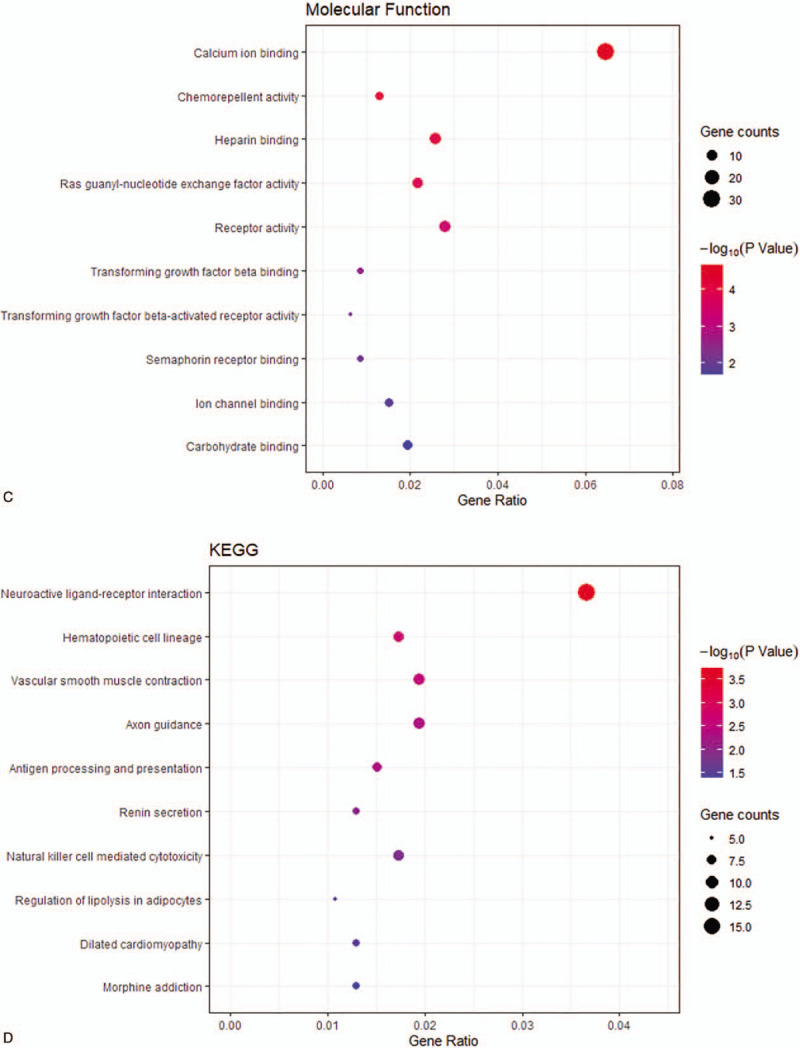
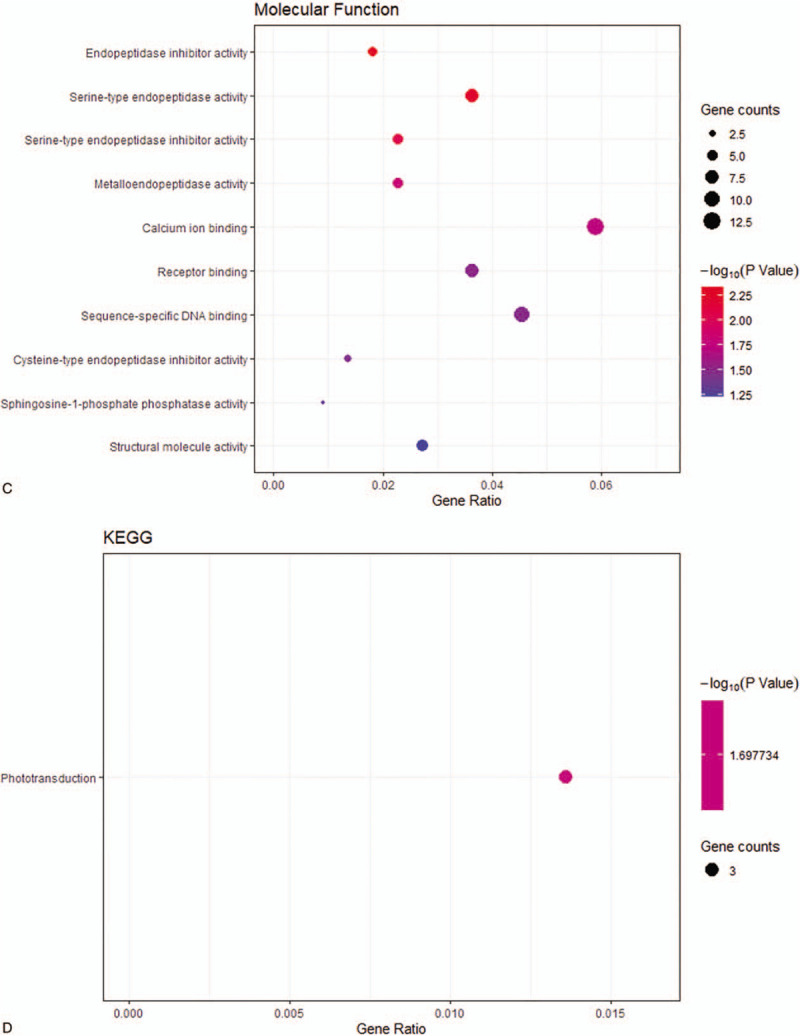
In order to further analyze the function of the identified DEGs, the online software DAVID was used for the GO analysis of DEGs. As mentioned earlier, the GO analysis results consisted of 3 parts: BP, CC, and MF. The results indicated that the downregulated DEGs were significantly enriched in BP-associated angiogenesis, immune response and cell adhesion (Fig. 2 ). In addition, the upregulated DEGs were mainly enriched in the collagen catabolic process, extracellular matrix disassembly, and chemokine-mediated signaling pathway (Fig. 3 ). For the CC, the downregulated DEGs were mainly enriched in the integral component of the plasma membrane, plasma membrane, and integral component of the membrane (Fig. 2 ), while the upregulated DEGs were mainly enriched in the extracellular space, extracellular region and extracellular exosome (Fig. 3 ). Furthermore, through the MF analysis, it was found that the downregulated DEGs were notably enriched in calcium ion binding, chemorepellent activity and heparin binding (Fig. 2 ), while the upregulated DEGs had an evidently enriched endopeptidase inhibitor activity, serine-type endopeptidase activity, and serine-type endopeptidase inhibitor activity (Fig. 3 ).
Figure 2.
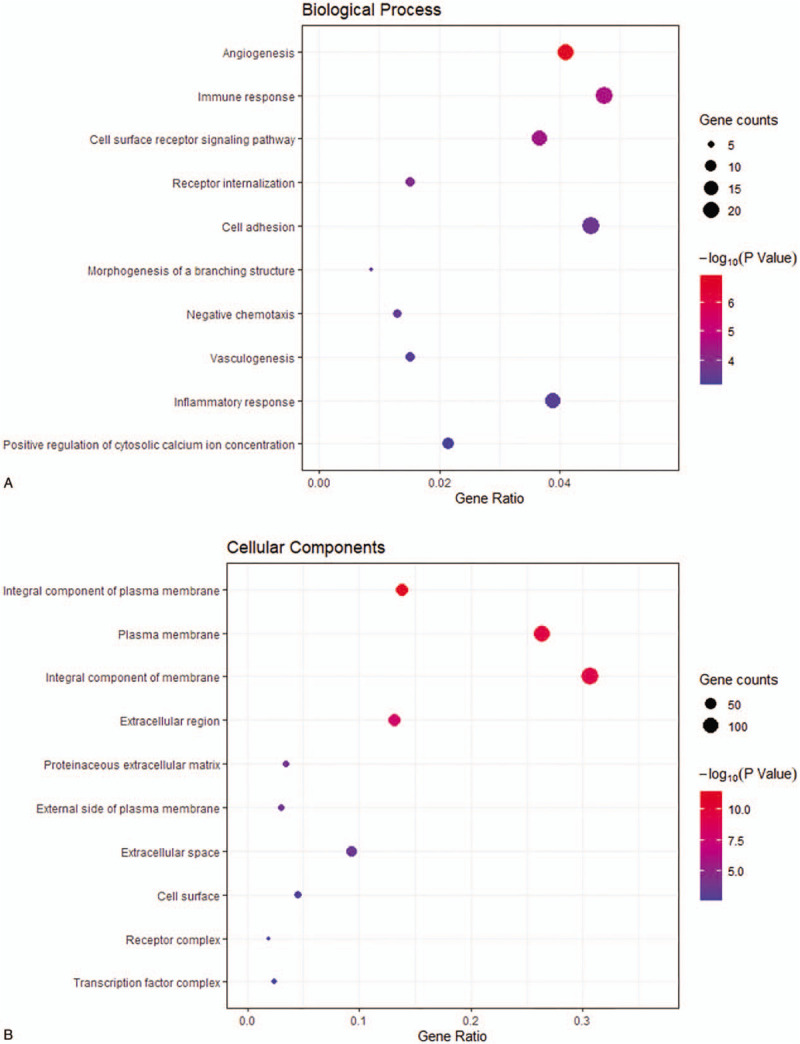
The Gene ontology and KEGG pathway analysis results for downregulated DEGs with |log2fold change | > 2. (A) BP: biological process; (B) CC: cellular component; (C) MF: molecular function; (D) KEGG: Kyoto Encyclopedia of Genes and Genomes.
Figure 2 (Continued).
The Gene ontology and KEGG pathway analysis results for downregulated DEGs with |log2fold change | > 2. (A) BP: biological process; (B) CC: cellular component; (C) MF: molecular function; (D) KEGG: Kyoto Encyclopedia of Genes and Genomes.
3.3. KEGG pathway analysis
KEGG was used to analyze the signaling pathways that downregulate DEGs and upregulate DEG enrichment. The downregulated DEGs were enriched in neuroactive ligand-receptor interaction, hematopoietic cell lineage, and vascular smooth muscle contraction (Fig. 2 ), while the upregulated DEGs were enriched in phototransduction (Fig. 3 ).
3.4. PPI network construction and modules selection
The PPI network visualized by Cytoscape included 174 nodes and 417 edges. Based on the STRING database, a degree of >10 was set as the cutoff criterion, and the top 10 degree scores were considered as the hub genes (Table 2). The hub genes were the following: guanine nucleotide-binding protein G(T) subunit gamma-T1 (GNGT1), adenylate cyclase 4 (ADCY4), formyl peptide receptor 2 (FPR2), pro-platelet basic protein (PPBP), neuromedin U (NMU), platelet factor 4 (PF4), glucagon (GCG), sphingosine 1 phosphate receptor 1 (S1PR1), G protein-coupled receptor 37 (GPR37), and sphingosine-1-phosphate receptor 5 (S1PR5). These genes may play an important role in the development and progression of LUAD. Subsequently, by using the plug-in MODE to detect potential modules, the first 3 most connected modules were obtained, and the proteins of the same module had strong interactions (Fig. 4).
Table 2.
The top 10 DEGs with higher degree scores.

Figure 3.
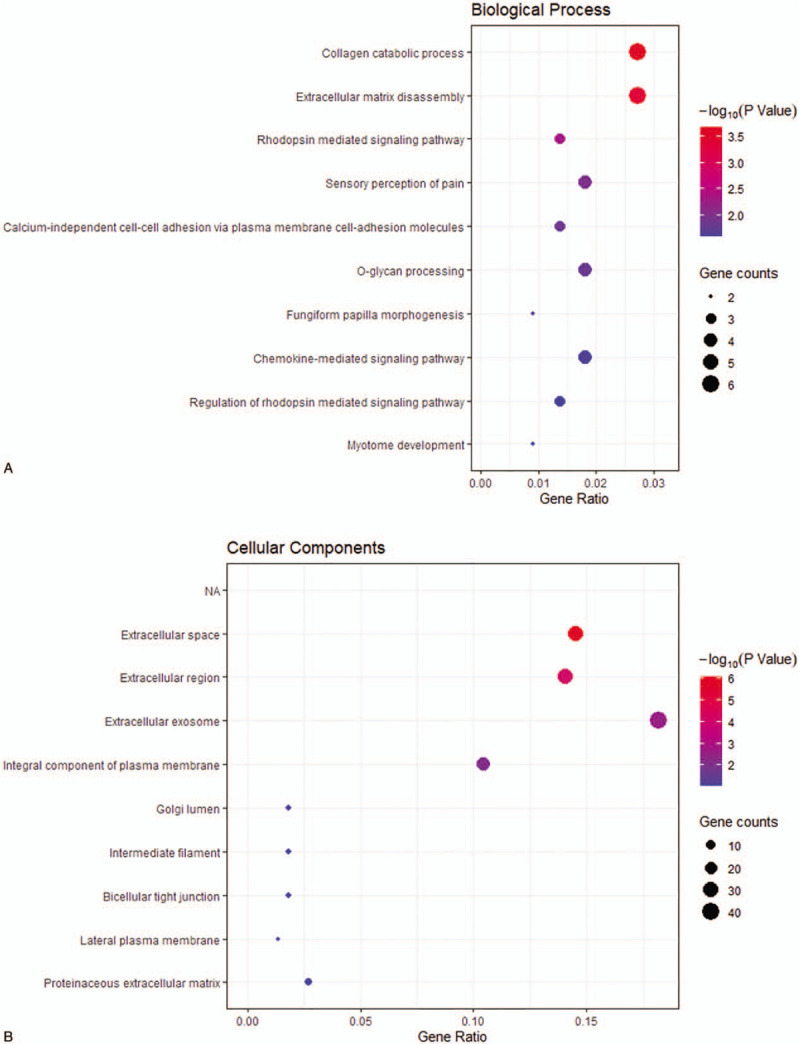
The Gene ontology and KEGG pathway analysis results for upregulated DEGs with |log2fold change | > 2. (A) BP: biological process; (B) CC: cellular component; (C) MF: molecular function; (D) KEGG: Kyoto Encyclopedia of Genes and Genomes.
Figure 4.
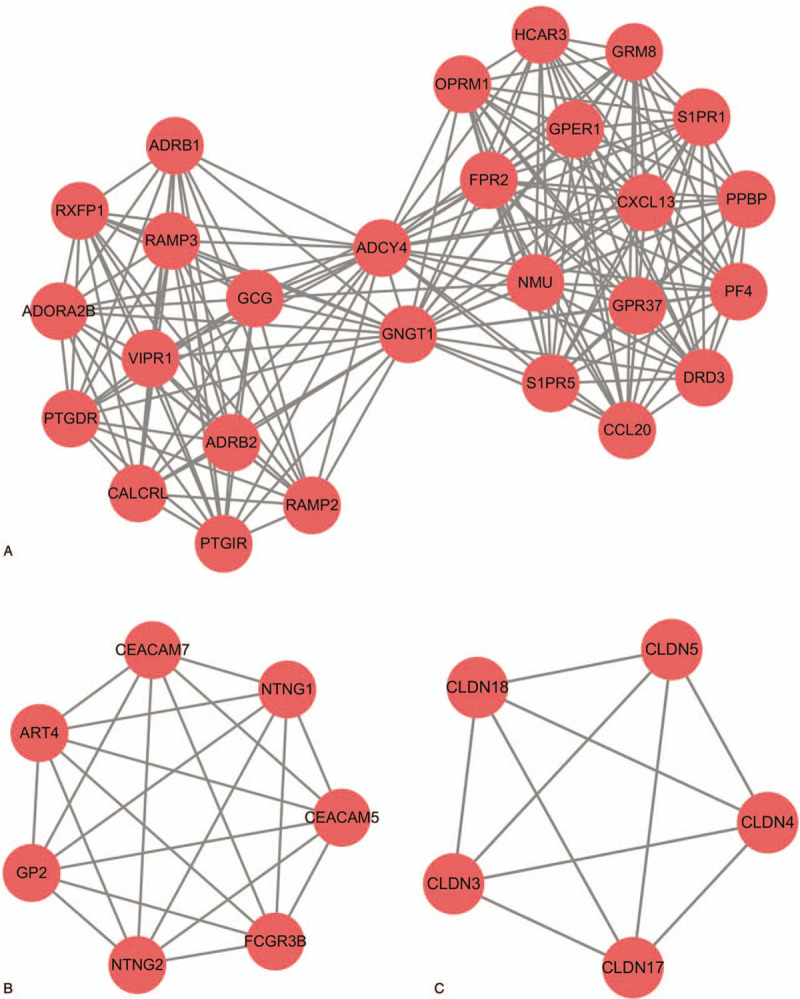
Module analysis of the PPI network. (A) module 1; (B) module 2; (C) module 3.
3.5. Prognostic value of the hub gene
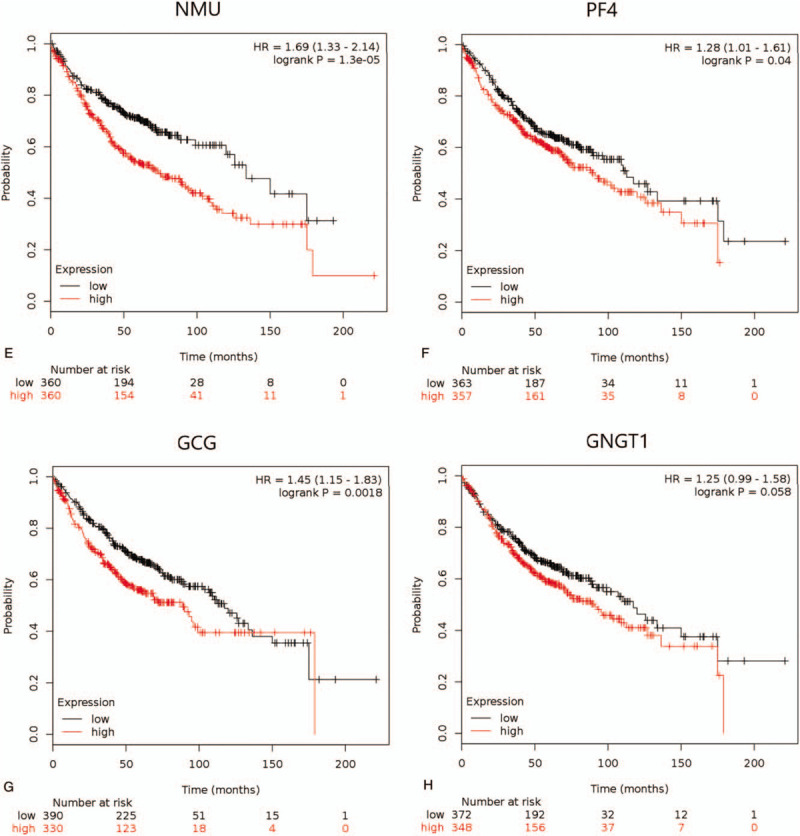
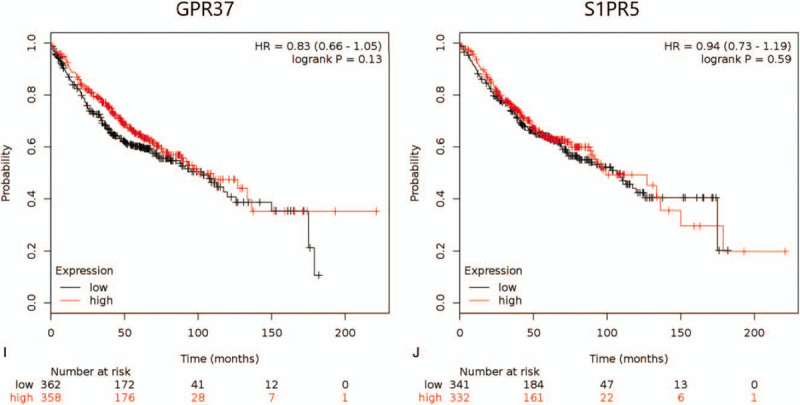
The expression and prognosis of 10 hub genes in LUAD were evaluated by Kaplan–Meier analysis. It was found that the expression levels of 7 hub genes in LUAD patients were closely correlated to OS, and the difference was statistically significant (P < .05, Fig. 5 ). In Figure 5 , the high expression of ADCY4 and S1PR1 was associated with longer OS, while the high expression of FPR2, PPBP, NMU, PF4, and GCG was associated with lower OS. Furthermore, the expression levels of GNGT1, GPR37, and S1PR5 were not significantly correlated with the OS of patients with LUAD.
Figure 3 (Continued).
The Gene ontology and KEGG pathway analysis results for upregulated DEGs with |log2fold change | > 2. (A) BP: biological process; (B) CC: cellular component; (C) MF: molecular function; (D) KEGG: Kyoto Encyclopedia of Genes and Genomes.
Figure 5.
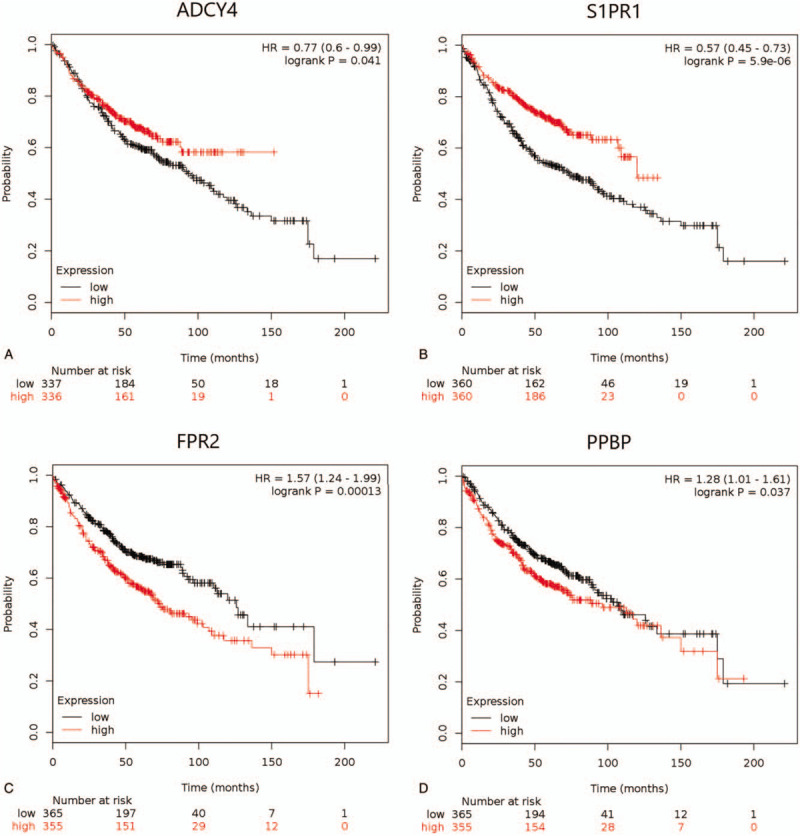
The Kaplan–Meier survival curves by mRNA expression levels of 10 hub genes of 866 LUAD patients (The log-rank P < .05 was statistically significant). (A) ADCY4; (B) S1PR1; (C) FPR2; (D) PPBP; (E) NMU; (F) PF4; (G) GCG; (H) GNGT1; (I) GPR37; (J) S1PR5.
Figure 5 (Continued).
The Kaplan–Meier survival curves by mRNA expression levels of 10 hub genes of 866 LUAD patients (The log-rank P < .05 was statistically significant). (A) ADCY4; (B) S1PR1; (C) FPR2; (D) PPBP; (E) NMU; (F) PF4; (G) GCG; (H) GNGT1; (I) GPR37; (J) S1PR5.
Figure 5 (Continued).
The Kaplan–Meier survival curves by mRNA expression levels of 10 hub genes of 866 LUAD patients (The log-rank P < .05 was statistically significant). (A) ADCY4; (B) S1PR1; (C) FPR2; (D) PPBP; (E) NMU; (F) PF4; (G) GCG; (H) GNGT1; (I) GPR37; (J) S1PR5.
4. Discussion
Regardless of the tremendous progress in the past few years, LUAD still represents as a tumor with poor prognosis when detected at the advanced clinical stage.[22] Therefore, uncovering the etiological and molecular mechanisms of LUAD is of vital importance for therapy and prevention. With the continuous development of gene chip technology and second-generation sequencing technology, gene data has tremendously increased. Hence, determining how to use these data to help humans clarify the relationship between genes and tumors has become a hot research topic.[23]
The present study obtained gene expression data from the GSE118370 dataset, and 203 upregulated and 406 downregulated DEGs were selected between the LUAD sample and normal tissues by bioinformatics analysis.
The GO term analysis results indicated that the downregulated DEGs were mainly enriched in angiogenesis, calcium ion binding and cell adhesion, while the upregulated DEGs were involved in the extracellular matrix disassembly, collagen catabolic process, chemokine-mediated signaling pathway, and endopeptidase inhibitor activity. Angiogenesis is a complex process that plays a key role in maintaining the tumor microenvironment, tumor growth, invasion, and metastasis.[24] Previous studies have shown that the activation of intracellular Ca2+ may affect cancer cell metastasis and tumorigenicity.[25] Cell adhesion molecules, as a class of membrane surface glycoprotein molecules, are involved in the regulation of inflammatory responses, and in tumor spread and metastasis. Epithelial-to-mesenchymal transition (EMT) is characterized by loss of cell adhesion. As previously reported, EMT is one of the key mechanisms that induce tumor invasion and metastasis. A negative or reduced expression of some adhesion molecules correlates with distant metastasis in lung cancer.[26,27] The extracellular matrix is a complex multi-spatial macromolecular network, and extracellular matrix disassembly can promote tumor growth and metastasis.[28–30] Since collagen is the major component of the extracellular matrix, it is the main obstacle to the migration of cancer cells, while collagen synthesis and degradation can affect the process of cancer invasion.[31] Numerous studies have revealed that chemokines play a key role in tumor invasion, angiogenesis, and metastasis.[32] In addition, a study reported that the inhibition of endopeptidase can inhibit the degradation of the extracellular matrix and tumor invasion.[33] The KEGG pathway analysis revealed that the downregulated DEGs were observably enriched in neuroactive ligand-receptor interaction, hematopoietic cell lineage, and vascular smooth muscle contraction. The role of neuroactive steroids reveals the interaction of ligands with receptors. Neuroactive steroids affect the regulation of GABA receptors. Hence, GABA receptors have been considered to control cell proliferation. Furthermore, cell proliferation is a hallmark of cancer.[34] A study revealed that the loss of some hematopoietic cells is associated with aggressive LUADs.[35] Furthermore, a recent study on the expression of lung cancer genes revealed that the vascular smooth muscle contraction pathway is negatively regulated during tumorigenesis.[36] Therefore, studying these signaling pathways could assist in the prediction of cancer progression.
In addition, a DEG PPI network was established, and the top 10 hub genes were identified, which included GNGT1, ADCY4, S1PR1, FPR2, PPBP, NMU, PF4, GCG, GPR37, and S1PR5. The Kaplan–Meier survival analysis concluded that the high expression levels of ADCY4 and S1PR1 were associated with longer OS, while the high expression levels of FPR2, PPBP, NMU, PF4, and GCG were associated with lower OS in LUAD patients. ADCY4 catalyzes the formation of the signaling molecule cAMP in response to G-protein signaling. Welldon et al reported that ADCY4 is significantly associated with calcium signaling pathways.[37] Intracellular Ca2+ activation may affect the tumorigenicity and metastasis of LUAD cells.[25]S1PR1 is a G-protein coupled receptor for the bioactive lysosphingolipid sphingosine 1-phosphate. Studies have shown that S1PR1 can promote the invasion and proliferation of cancer cells by activating ERK signaling pathways.[38] At the same time, S1PR1 and its downstream target VE-cadherin can inhibit the germination of angiogenesis and improve vascular stability, thereby effectively delaying tumor growth.[39] As another G-protein coupled receptor, FPR2 usually directly or indirectly retains the immunological activity of macrophages, and effectively limits tumor progression.[40]PPBP belongs to the CXC chemokine subfamily, and promotes angiogenesis, tumorigenesis and metastasis.[41] Furthermore, a previous study published that the level of PPBP in patients with NSCLC is significantly higher than that in normal people.[42]NMU is a neuropeptide that is a member of the neuromedin family. A recent study revealed that NMU mRNA expression levels in NSCLC patients have a negative correlation with OS.[43]PF4 is an endocrine factor. The study conducted by Ferdinando et al[44] revealed that PF4 promotes platelet accumulation and lung cancer growth. GCG encodes glucagon protein. It acts on glucose metabolism and homeostasis, and regulates blood sugar by increasing gluconeogenesis and reducing glycolysis.[45] Tumors are a rare cause of hypoglycemia. Hypoglycemia manifests as paraneoplastic symptoms of a tumor with a potentially serious prognosis.[46] Thus, the level of GCG expression has a certain indicator of tumor production. These hub genes are directly or indirectly involved in the regulation of LUAD.
In summary, by analyzing the gene expression profiles, the present study established hub genes and important signaling pathways closely correlated to the occurrence and development of LUAD. Many genes are considered to be associated with LUAD.[47] However, it is difficult to determine which genes are the most relevant. Previous studies usually only investigated genes or signaling pathways,[48] and few studies have combined these to identify common parts. Therefore, after screening the hub genes and important signaling pathways, it was found that the calcium signaling pathway, and the angiogenesis and chemokine-mediated signaling pathway were screened in the functional enrichment analysis. Furthermore, it was found that these were correlated to ADCY4, S1PR1, and PPBP in the hub gene, which is worthy of further in-depth study. These findings provide novel insights on the study of the potential biomarkers and pathogenesis of LUAD. However, further molecular biology or cell experiments are needed to verify these findings.
Author contributions
Ye Yu: Methodology, Software, Formal analysis, Writing - Original Draft, Visualization.
Xuemei Tian: Conceptualization, Writing - Review & Editing, Supervision, Project administration, Funding acquisition.
Footnotes
Abbreviations: BP = biological process, CC = cellular component, DAVID = the database for annotation, visualization and integrated discovery, DEGs = differentially expressed genes, EGA = European Genome-phenome Archive, EMT = epithelial-to-mesenchymal transition, GCBI = Gene Cloud Biotechnology Information, GEO = Expression Omnibus database, GO = gene ontology, KEGG = Kyoto Encyclopedia of Genes and Genomes, LSQ = lung squamous cell carcinoma, LUAD = lung adenocarcinoma, MF = molecular function, NSCLC = non-small cell lung cancer, OS = overall survival, PPI = protein-protein interaction, PPI = protein–protein interaction, SCLC = small cell lung cancer, STRING = The Search Tool for the Retrieval of Interacting Genes, TCGA = The Cancer Genome Atlas.
How to cite this article: Yu Y, Tian X. Analysis of genes associated with prognosis of lung adenocarcinoma based on GEO and TCGA databases. Medicine. 2020;99:19(e20183).
This study was supported by grants from the National Natural Science Foundation of China (81772533).
The datasets used and analyzed during the study are available from the corresponding author upon reasonable request.
The authors declare that they have no competing interests.
The datasets generated during and/or analyzed during the current study are publicly available.
References
- [1].Torre LA, Bray F, Siegel RL, et al. Global cancer statistics, 2012. CA 2015;65:87–108. [DOI] [PubMed] [Google Scholar]
- [2].Kadara H, Kabbout M, Wistuba II. Pulmonary adenocarcinoma: a renewed entity in 2011. Respirology 2012;17:50–65. [DOI] [PMC free article] [PubMed] [Google Scholar]
- [3].Pirozynski M. 100 years of lung cancer. Respir Med 2006;100:2073–84. [DOI] [PubMed] [Google Scholar]
- [4].Cai W, Lin D, Wu C, et al. Intratumoral heterogeneity of ALK-rearranged and ALK/EGFR coaltered lung adenocarcinoma. J Clin Oncol 2015;2014:8293. [DOI] [PMC free article] [PubMed] [Google Scholar]
- [5].Herbst RS, Morgensztern D, Boshoff C. The biology and management of non-small cell lung cancer. Nature 2018;553:446–54. [DOI] [PubMed] [Google Scholar]
- [6].Turke AB, Zejnullahu K, Wu YL, et al. Preexistence and clonal selection of MET amplification in EGFR mutant NSCLC. Cancer Cell 2010;17:77–88. [DOI] [PMC free article] [PubMed] [Google Scholar]
- [7].Kwak EL, Bang YJ, Camidge DR, et al. Anaplastic lymphoma kinase inhibition in non–small-cell lung cancer. N Engl J Med 2010;363:1693–703. [DOI] [PMC free article] [PubMed] [Google Scholar]
- [8].Roviello G. The distinctive nature of adenocarcinoma of the lung. Onco Targets Ther 2015;8:2399–406. [DOI] [PMC free article] [PubMed] [Google Scholar]
- [9].Gainor JF, Dardaei L, Yoda S, et al. Molecular mechanisms of resistance to first- and second-generation ALK inhibitors in ALK-rearranged lung cancer. Eur J Cancer 2016;69:S138. [DOI] [PMC free article] [PubMed] [Google Scholar]
- [10].Kobayashi S, Boggon TJ, Dayaram T, et al. EGFR mutation and resistance of non–small-cell lung cancer to gefitinib. N Engl J Med 2005;352:786–92. [DOI] [PubMed] [Google Scholar]
- [11].Xiao J, Liu A, Lu X, et al. Prognostic significance of TCF21 mRNA expression in patients with lung adenocarcinoma. Sci Rep 2017;7:2027. [DOI] [PMC free article] [PubMed] [Google Scholar]
- [12].Xiaodi J, Zhi Y. Multiple biological functions of transcription factor 21 in the development of various cancers. Onco Targets Ther 2018;11:3533–9. [DOI] [PMC free article] [PubMed] [Google Scholar]
- [13].Xu L, Lu C, Huang Y, et al. SPINK1 promotes cell growth and metastasis of lung adenocarcinoma and acts as a novel prognostic biomarker. BMB Rep 2018;51:648–53. [DOI] [PMC free article] [PubMed] [Google Scholar]
- [14].Gautier L, Cope L, Bolstad BM, et al. affy--analysis of Affymetrix GeneChip data at the probe level. Bioinformatics 2004;20:307–15. [DOI] [PubMed] [Google Scholar]
- [15].Diboun I, Wernisch L, Orengo CA, et al. Microarray analysis after RNA amplification can detect pronounced differences in gene expression using limma. BMC Genomics 2006;7:252–60. [DOI] [PMC free article] [PubMed] [Google Scholar]
- [16].Harris MA, Clark J, Ireland A, et al. Gene ontology consortium: the gene ontology (GO) database and informatics resource. Nucleic Acids Res 2004;32:D258–61. [DOI] [PMC free article] [PubMed] [Google Scholar]
- [17].Ogata H, Goto S, Sato K, et al. KEGG: Kyoto encyclopedia of genes and genomes. Nucleic Acids Res 1999;27:29–34. [DOI] [PMC free article] [PubMed] [Google Scholar]
- [18].Jiao X, Sherman BT, Huang W, et al. DAVID-WS: A stateful web service to facilitate gene/protein list analysis. Bioinformatics 2012;28:1805–6. [DOI] [PMC free article] [PubMed] [Google Scholar]
- [19].von Mering C, Huynen M, Jaeggi D, et al. STRING: A database of predicted functional associations between proteins. Nucleic Acids Res 2003;31:258–61. [DOI] [PMC free article] [PubMed] [Google Scholar]
- [20].Shannon P, Markiel A, Ozier O, et al. Cytoscape: a software environment for integrated models of biomolecular interaction networks. Genome Res 2003;13:2498–504. [DOI] [PMC free article] [PubMed] [Google Scholar]
- [21].Győrffy B, Surowiak P, Budczies J, et al. Online survival analysis software to assess the prognostic value of biomarkers using transcriptomic data in non-small-cell lung cancer. PLoS One 2013;8:e82241. [DOI] [PMC free article] [PubMed] [Google Scholar]
- [22].Siegelin MD, Borczuk AC. Epidermal growth factor receptor mutations in lung adenocarcinoma. Lab Invest 2014;94:129–37. [DOI] [PubMed] [Google Scholar]
- [23].Wen P, Chidanguro T, Shi Z, et al. Identification of candidate biomarkers and pathways associated with SCLC by bioinformatics analysis. Mol Med Rep 2018;18:1538–50. [DOI] [PMC free article] [PubMed] [Google Scholar]
- [24].Folkman J. Tumor angiogenesis: therapeutic implications. N Engl J Med 1971;285:1182–6. [DOI] [PubMed] [Google Scholar]
- [25].Li Y, Yu WK, Chen L, et al. Electrotaxis of tumor-initiating cells of H1975 lung adenocarcinoma cells is associated with both activation of stretch-activated cation channels (SACCs) and internal calcium release. Bioelectrochemistry 2018;124:80–92. [DOI] [PubMed] [Google Scholar]
- [26].Kim H, Yoo SB, Sun P, et al. Alteration of the E-Cadherin/(-catenin complex is an independent poor prognostic factor in lung adenocarcinoma. Korean J Pathol 2013;47:44–51. [DOI] [PMC free article] [PubMed] [Google Scholar]
- [27].Peinado H, Marin F, Cubillo E, et al. Snail and E47 repressors of E-cadherin induce distinct invasive and angiogenic properties in vivo. J Cell Sci 2004;117:2827–39. [DOI] [PubMed] [Google Scholar]
- [28].Hynes RO. The extracellular matrix: not just pretty fibrils. Science 2009;326:1216–9. [DOI] [PMC free article] [PubMed] [Google Scholar]
- [29].Bin Lim S, Chua MLK, Yeong JPS, et al. Pan-cancer analysis connects tumor matrisome to immune response. NPJ Precis Oncol 2019;3:15. [DOI] [PMC free article] [PubMed] [Google Scholar]
- [30].Sanderson RD, Yang Y, Kelly T, et al. Enzymatic remodeling of heparan sulfate proteoglycans within the tumor microenvironment: Growth regulation and the prospect of new cancer therapies. J Cell Biochem 2005;96:897–905. [DOI] [PubMed] [Google Scholar]
- [31].Melander MC, Jürgensen HJ, Madsen DH, et al. The collagen receptor uPARAP/Endo180 in tissue degradation and cancer (Review). Int J Oncol 2015;47:1177–88. (Review). [DOI] [PMC free article] [PubMed] [Google Scholar]
- [32].Keeley EC, Mehrad B, Strieter RM. CXC chemokines in cancer angiogenesis and metastases. Adv Cancer Res 2010;106:91–111. [DOI] [PMC free article] [PubMed] [Google Scholar]
- [33].Mitrović A, Mitrović B, Sosič I, et al. Inhibition of endopeptidase and exopeptidase activity of cathepsin B impairs extracellular matrix degradation and tumour invasion. Biol Chem 2016;397:165–74. [DOI] [PubMed] [Google Scholar]
- [34].Watanabe M, Maemura K, Oki K, et al. Gamma-aminobutyric acid (GABA) and cell proliferation: focus on cancer cells. Histol Histopathol 2006;21:1135–41. [DOI] [PubMed] [Google Scholar]
- [35].Ramsey J, Butnor K, Peng Z, et al. Loss of RUNX1 is associated with aggressive lung adenocarcinomas. J Cell Physiol 2018;233:3487–97. [DOI] [PMC free article] [PubMed] [Google Scholar]
- [36].Kerkentzes K, Lagani V, Tsamardinos I, et al. Hidden treasures in “ancient” microarrays: Gene-expression portrays biology and potential resistance pathways of major lung cancer subtypes and normal tissue. Front Oncol 2014;4:251. [DOI] [PMC free article] [PubMed] [Google Scholar]
- [37].Welldon KJ, Findlay DM, Evdokiou A, et al. Calcium induces pro-anabolic effects on human primary osteoblasts associated with acquisition of mature osteocyte markers. Mol Cell Endocrinol 2013;376:85–92. [DOI] [PubMed] [Google Scholar]
- [38].Li MH, Sanchez T, Yamase H, et al. S1P/S1P1 signaling stimulates cell migration and invasion in Wilms tumor. Cancer Letters: 2009;276:0–179. [DOI] [PMC free article] [PubMed] [Google Scholar]
- [39].Gaengel K, Niaudet C, Hagikura K, et al. The sphingosine-1-phosphate receptor S1PR1 restricts sprouting angiogenesis by regulating the interplay between VE-cadherin and VEGFR2. Dev Cell 2012;23:587–99. [DOI] [PubMed] [Google Scholar]
- [40].Liu Y, Chen K, Wang C, et al. Cell surface receptor FPR2 promotes antitumor host defense by limiting M2 polarization of macrophages. Cancer Res 2013;73:550–60. [DOI] [PMC free article] [PubMed] [Google Scholar]
- [41].Strieter RM, Burdick MD, Mestas J, et al. Cancer CXC chemokine networks and tumour angiogenesis. Eur J Cancer 2006;42:0–778. [DOI] [PubMed] [Google Scholar]
- [42].Ulivi P, Mercatali L, Casoni GL, et al. Multiple marker detection in peripheral blood for NSCLC diagnosis. PLoS One 2013;8:e57401. [DOI] [PMC free article] [PubMed] [Google Scholar]
- [43].You S, Gao L. Identification of NMU as a potential gene conferring alectinib resistance in non-small cell lung cancer based on bioinformatics analyses. Gene 2018;678:137–42. [DOI] [PubMed] [Google Scholar]
- [44].Pucci F, Rickelt S, Newton AP, et al. PF4 promotes platelet production and lung cancer growth. Cell Rep 2016;17:1764–72. [DOI] [PMC free article] [PubMed] [Google Scholar]
- [45].Inculet RI, Peacock JL, Gorschboth CM, et al. Gluconeogenesis in the tumor-influenced rat hepatocyte: Importance of tumor burden, lactate, insulin, and glucagon. J Natl Cancer Inst 1987;79:1039–46. [PubMed] [Google Scholar]
- [46].Iglesias P, Díez JJ. Management of endocrine disease: a clinical update on tumor-induced hypoglycemia. Eur J Endocrinol 2014;170:R147–57. [DOI] [PubMed] [Google Scholar]
- [47].Lee BS, Park DI, Lee DH, et al. Hippo effector YAP directly regulates the expression of PD-L1 transcripts in EGFR-TKI-resistant lung adenocarcinoma. Biochem Biophys Res Commun 2017;S0006291X17313384. [DOI] [PubMed] [Google Scholar]
- [48].Wei Y, Yan Z, Wu C, et al. Integrated analysis of dosage effect lncRNAs in lung adenocarcinoma based on comprehensive network. Oncotarget 2015;8:71430–46. [DOI] [PMC free article] [PubMed] [Google Scholar]