Abstract
Background:
Plenty of evidence has suggested that long non-coding RNAs (lncRNAs) have played a vital part may act as prognostic biomarkers in a variety of cancers. The aim of this study was to screen survival-related lncRNAs and to construct a lncRNA-based prognostic model in patients with cutaneous melanoma (CM).
Methods:
We obtained lncRNAs expression profiles and clinicopathological data from the Cancer Genome Atlas (TCGA) and the Genotype-Tissue Expression (GTEx) databases. A lncRNA-based prognostic model was established in training set. The established prognostic model was evaluated, and validated in the validation set. Then, a prognostic nomogram combining the lncRNA-based risk score and clinicopathological characteristics was developed in training set, and assessed in the validation set. The accuracy of the model was evaluated by the discrimination and calibration plots.
Results:
A total of 212 lncRNAs were identified to be differentially expressed in CM. After univariate analysis, LASSO penalized regression analysis, and multivariate analysis, 3 lncRNAs were used to construct risk score model. The proposed risk score model could divide patients into high-risk and low-risk groups with significantly different survival in both training set and validation set. The ROC curve showed good performance in survival prediction in both sets. Furthermore, the nomogram for predicting 3-, 5-, and 10-year OS was established based on lncRNA-based risk score and clinicopathologic factors. The prognostic accuracy of the risk model was confirmed by the discrimination and calibration plots in both training set and validation set.
Conclusions:
We established a novel three lncRNA-based risk score model and nomogram to predict overall survival of CM. The proposed nomogram may provide information for individualized treatment in CM patients.
Keywords: cutaneous melanoma, long non-coding RNAs, nomogram, prognosis
1. Introduction
Cutaneous melanoma (CM) is the most lethal form of skin malignancy.[1] It is characterized by rapid progression, metastasis to regional lymph nodes and distant organs, and limited response to treatment.[2] It is reported that CM is the sixth leading cause of cancer-associated mortality worldwide.[3] Its incidence is rising worldwide, especially in people with light complexion.[4,5] It is estimated that there will be 91,270 patients were diagnosed with CM, and approximately 9,320 individuals died from the condition in 2018 in the United States.[6] Early CM may be cured by surgery, but advanced disease remains a challenge. Despite recent advances in understanding CM biology and genetics, but the prognosis of patients with advanced CM is still poor due to the high potential of CM invasion and metastasis.[7] Therefore, it is essential to explore the novel robust gene-based prognostic nomogram to guide patients’ risk stratification and personalized therapy.
Long non-coding RNAs (lncRNAs) are defined as RNA transcripts longer than 200 nucleotides and are characterized by no protein-coding ability due to lack of an obvious open reading frame.[8] Mounting studies have revealed that lncRNAs get involved in regulation of gene expression and chromatin structure at epigenetic, transcriptional and post-transcriptional levels, and then intervene in pathological processes of multifarious diseases through the mechanisms of competitive endogenous RNA, regulatory signal, protein scaffold, transcript decoy, and transcript guide.[9,10] Many lncRNAs have been identified as key players to serving oncogenic or tumor-suppressive roles in a variety of cancer types.[11,12] Aberrantly expressed lncRNAs can promote cellular proliferation, invasion and metastasis, inhibit apoptosis, and forecast a poor prognosis.[13,14] For instance, overexpression of lncRNA UCA1 expression could promote the proliferation, migration and invasion of laryngeal squamous cell carcinoma cells by activating the Wnt/β-catenin signaling pathway. Thus, lncRNA UCA1 might serve as a promising biomarker for early detection and prognosis prediction of laryngeal squamous cell carcinoma.[13] Accumulating studies have indicated that lncRNAs display important potential application value in diagnosing, treating and predicting the prognosis for malignancy.
At present, the American Joint Committee on Cancer's (AJCC) staging system for tumor-node-metastasis (TNM) is well established for those having a melanoma.[15] However, this staging system is not sufficient to assess prognosis and does not reflect the biological heterogeneity of cancer. There are several factors such as age, tumor site, mitotic rate, and ulceration that can also influence the patients’ survival.[16–18] In addition, this system is not very useful in predicting individual patient outcomes. Thus, continuously developing better prediction models to predict the prognostic of CM more accurately are warranted. In recent years, some prognostic nomograms have been established for predicting the prognosis of CM based on various clinicopathologic characteristics.[19–21] For example, Maurichi et al. developed a nomogram to predict 12-year OS based on 6 variables, including age, Mitotic rate, ulceration, lymphovascular invasion, regression, and sentinel node status.[21] But to the best of our knowledge, no prior prognostic models for CM were established based on a combination of genetic features and clinicopathological features. Therefore, the present study aimed to build a novel lncRNA-based risk score system to predict the prognosis of CM through a comprehensive analysis of TCGA and GTEx sequencing data.
2. Materials and methods
2.1. Datasets collection
RNA sequence data and clinical information for 472 patients with CK were obtained from the Cancer Genome Atlas (TCGA) and all data of 812 normal tissue samples were obtained from the Genotype-Tissue Expression (GTEx) project using the University of California Santa Cruz (UCSC) Xena website (https://xenabrowser.net/datapages/). A total of 10 CK patients were excluded because their survival time was unknown. Finally, 458 patients were included in this study. All CM patients were randomized to training set and validation set by the ratio of 1:1. Approval by Ethics Committee would not be necessary because all data had been collected from public availability of data in the GTEx and TCGA databases.
2.2. The differentially expressed genes (DEGs) screening
The raw data were processed by background correction and normalization by affy package of R/Bioconductor. Based on the corresponding information between probes and genes, the expression level of genes were calculated and presented by mean value of probes. The R package limma was used to identify DEGs between normal samples and tumor samples. Benjamin and Hochberg false discovery rate (FDR) method was used to correct the adjusted P value and correct the occurrence of false positive results. The cut-off standard was defined as adjusted P value < .05 and | log2 fold change (FC)|> 1.
2.3. Construction and evaluation of MC-lncRNA risk score
To discover potential protective (HR < 1) and risky lncRNAs (HR > 1) that are significantly correlated with the overall survival (OS) of patients with CM, a univariate Cox proportional hazards model was used to screen out those with a significant P value < .001. These potential lncRNAs were further selected by using the least absolute shrinkage and selection operator (LASSO) method.[22] The method performs a sub-selection of lncRNAs involved in the prognosis of CM patients by shrinkage of the regression coefficient through imposing a penalty proportional to their size. Finally, most potential indicators are reduced to zero and leave relatively small numbers with non-zero weights. LASSO penalized regression was conducted using “glmnet” package in the R software version 3.5.3 (Institute for Statistics and Mathematics, Vienna, Austria; r-project.org). These candidates were then subjected to a multivariate Cox proportional hazards regression with stepwise selection of variables based on the Akaike information criterion (AIC) for identifying optimal prognostic lncRNAs. A risk score model was constructed for predicting the prognosis of CM patients by taking into account the expression level of these prognostic genes and their estimated correlation coefficient from the multivariate Cox regression model. The risk scores of each sample were calculated according to the risk model. The CM patients were divided into high-risk group and low-risk group based on the median risk score as the cutoff value. Kaplan-Meier curves between high-risk and low-risk group were created and compared using the log-rank test. To evaluate the predictive value of the miRNA-based prognostic model, we drawn the time-dependent receiver operating characteristic (ROC) curve.[23]
2.4. Construction and validation of nomogram
To investigate whether the prognostic gene signature could be independent of other clinicopathological parameters (including age at diagnosis, gender, tumor stage, anatomic site, breslow thickness, ulceration), Cox proportional hazard regression was applied to identify significant prognostic factors with hazard ratios (HRs) and 95% confidence intervals (95% CIs). Variables in the univariate analysis with P values < .05 were selected for multivariate analysis using backward stepwise regression (likelihood ratio). Using the results from the multivariate Cox PH regression, we constructed a nomogram for predicting the 3-year, 5-year and 10-year OS.
Both external (validation set) and internal (training set) were performed to examine the generalizability of the nomogram model. The discrimination and calibration were used to assess the prediction ability and compliance of the nomogram model. The discrimination of the nomogram was evaluated using the C-index (concordance index) similar to the area under ROC curve (AUC), measuring the variation in the predictive ability between predicted and observed outcomes.[24] Calibration plots were used to compare the observed and predicted probabilities for the nomogram.
2.5. Functional enrichment analysis of the prognostic lncRNAs
In order to identify the potential biological roles of the identified lncRNAs, the GO terms and Kyoto Encyclopedia of Genes and Genomes (KEGG) pathway enrichment analyses were carried out through “clusterProfiler” package in R/Bioconductor.[25]
The expression correlation between the prognostic lncRNAs and each protein coding gene were calculated using the Pearson correlation coefficients. The correlation coefficient > 0.4 and P < .01 were considered significantly correlated.
2.6. Statistical analyses
All analyses were performed using SPSS software (SPSS Inc., Chicago, IL, version 23), along with version 3.5.3 of R software (Institute for Statistics and Mathematics, Vienna, Austria; r-project.org). P < .05 was considered statistically different. Categorical data was shown as frequencies and different proportions and was compared using the Chi-squared test or Fisher exact test. Survival curves were created by the Kaplan–Meier method and compared using the log-rank test. We used univariate and multivariate Cox proportional hazard regression analyses to screen the independent prognostic variables of OS (P < .05). The Cox regression coefficients were used to establish a risk score formula. The nomogram was built on the basis of multivariate analysis results by the package of “RMS” in R studio. The area under ROC (Receiver operating characteristic) curve (AUC) and calibration were used to assess the prediction ability and compliance of the nomogram model.[24] Calibration plots were used to compare the observed and predicted probabilities for the nomogram.
3. Results
3.1. Identification of DEGs in CM
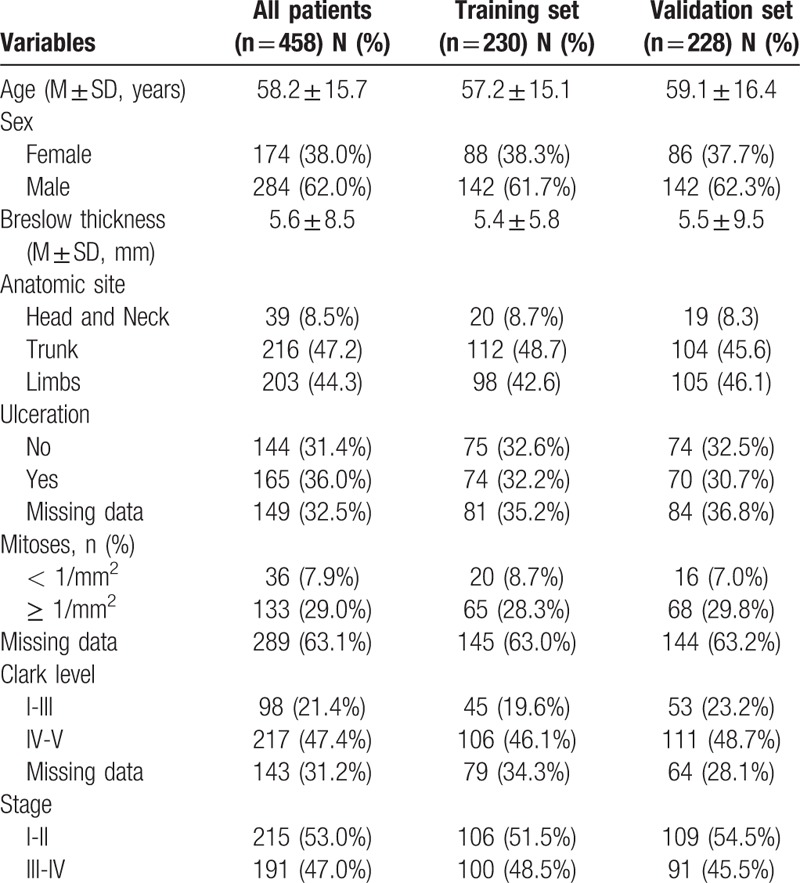
The overall design and flow chart of this study is shown in Figure 1. Based on the cut-off criteria (P value < .01 and |log2 fold change (FC) | > 1.0), 212 differentially expressed lncRNAs (DElncRNAs), including 113 up-regulated and 99 down-regulated lncRNAs were identified in tumor tissues (n = 471) when compared with that of normal tissues (n = 813). The 458 patients were collected and divided randomly into a training set (n = 230) and a validation set (n = 228). The median follow-up time was 91 months (range: 0–937 months) in both sets. The details of clinicopathologic characteristics for both sets were listed in Table 1.
Figure 1.
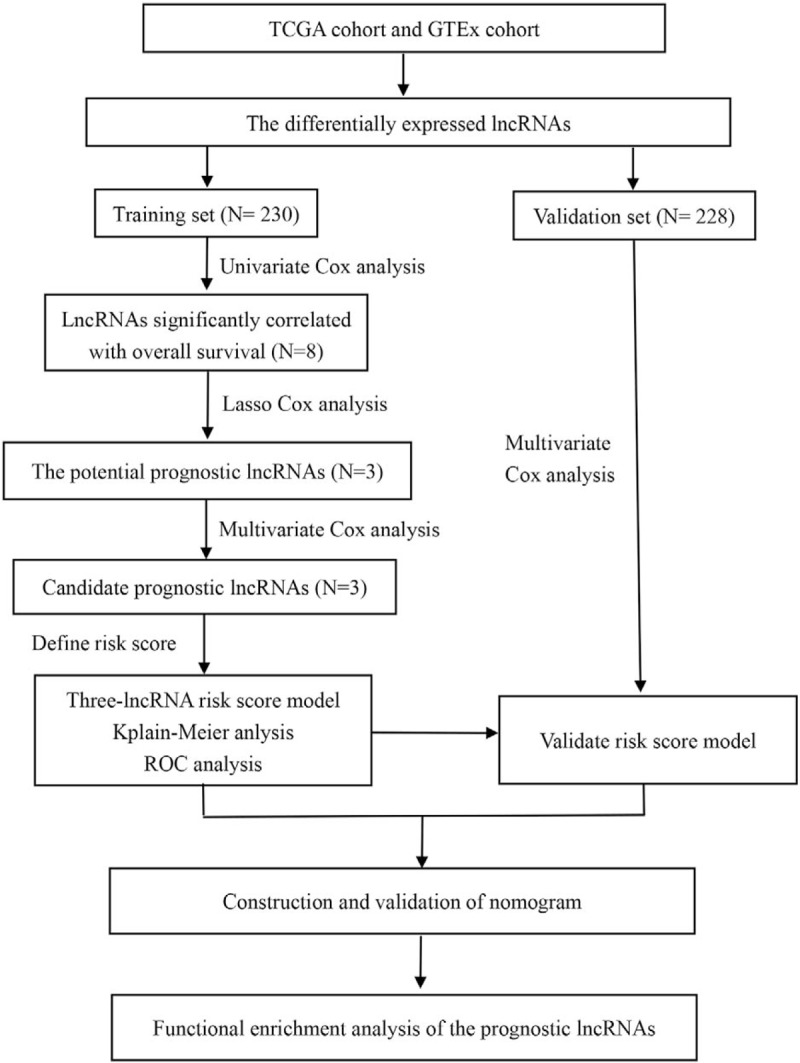
Overall design of the present study.
Table 1.
Clinicopathologic characteristics of CM patients included in this study.
3.2. Establishment and assessment of a risk score model
To identify the OS-related lncRNAs, 212 DElncRNAs were initially subjected to univariate Cox proportional hazards regression analysis in the training set. The result showed that 8 lncRNAs were significantly correlated (FDR < 0.01) with the OS of CM patients, and were subsequently selected into the LASSO penalized regression. Three lncRNAs were identified and were subsequently used for generation of a prognostic signature using multivariate Cox proportional hazards regression with stepwise selection of variables. Finally, 3 lncRNAs (LINC02518, LINC01871, and AC008687.3) were confirmed as independent prognostic genes. These include 2 potential risky genes and 1 potential protective gene.
A prognostic risk score model was constructed using expression levels of these 3 prognostic lncRNAs weighted by their correlation coefficient in the multivariate Cox model (Table 2). The risk score for OS was calculated as follows: risk score = 1.409090362 ∗ (expression value of LINC02518) + −0.272949733 ∗ (expression value of LINC01871) + 3.780111396 ∗ (expression value of AC008687.3). We then used this model to calculate the risk score for each patient in the training set. Using the median of the risk score, as the cutoff value, patients were stratified into high-risk and low-risk group in training sets. The heatmap, the risk score and overall survival time, of these 3 prognostic lncRNAs in training set were shown in Figure 2A. Patients are plotted in ascending order by risk score. The higher the risk score, the shorter the patients’ overall survival time. The risky genes (LINC02518 and AC008687.3) are over-expressed in the high-risk group, while one protective gene (LINC01871) have higher expression levels in the low-risk group. Moreover, it can be found that the normal group has the lowest level of risky gene expression and the highest level of protective gene expression, and the expression level of the low-risk group was between the high-risk and normal groups. Kaplan-Meier curve and time-dependent ROC curves were used to evaluate the prognostic potential of the proposed risk score model. Kaplan-Meier curves showed that patients with high-risk group had a significantly lower OS than patients with the low-risk group (P < .001) (Fig. 4A). The AUCs (Area under the ROC curve) for 3-, 5-, and 10-year OS were 0.717, 0.724, and 0.633 for training set, respectively (Fig. 3A).
Table 2.
Three prognostic lncRNAs significantly associated with OS in the training set.

Figure 2.
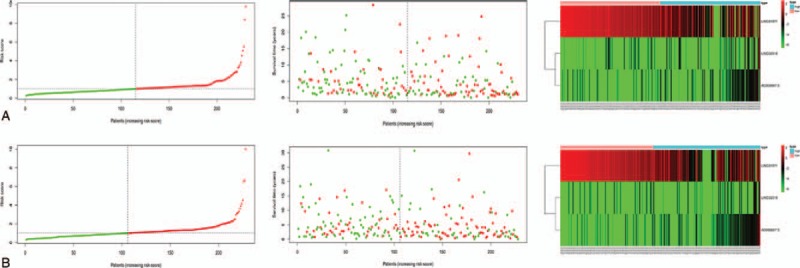
The distribution of risk score, the distribution of survival status, and the heatmap of three-lncRNA signature in training set (A) and in the validation set (B). The distribution of risk scores for all patients. Patients are plotted in ascending order by risk score. The distribution of survival status with red indicating death and green indicating alive. The expression level of 3 lncRNA with red indicating higher expression and green indicating lower expression.
Figure 4.
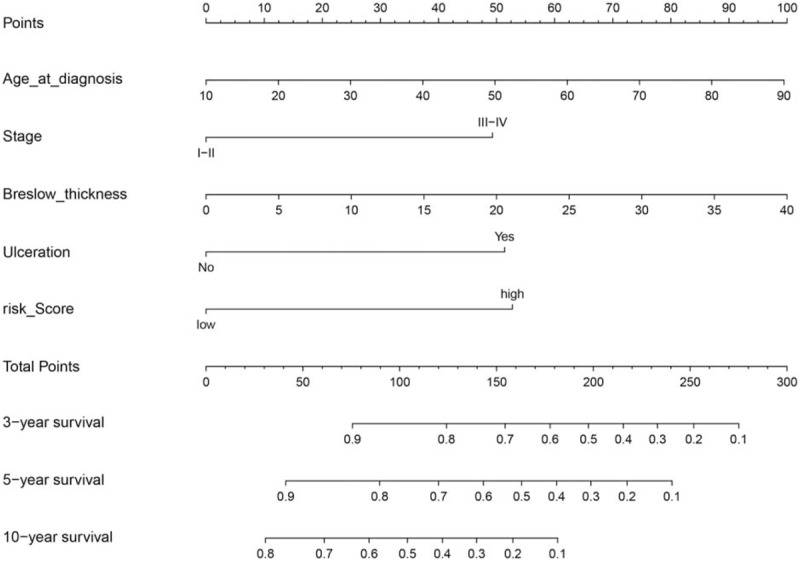
A nomogram for the prediction of 3-, 5-, and 10-year overall survival in CM patients.
Figure 3.
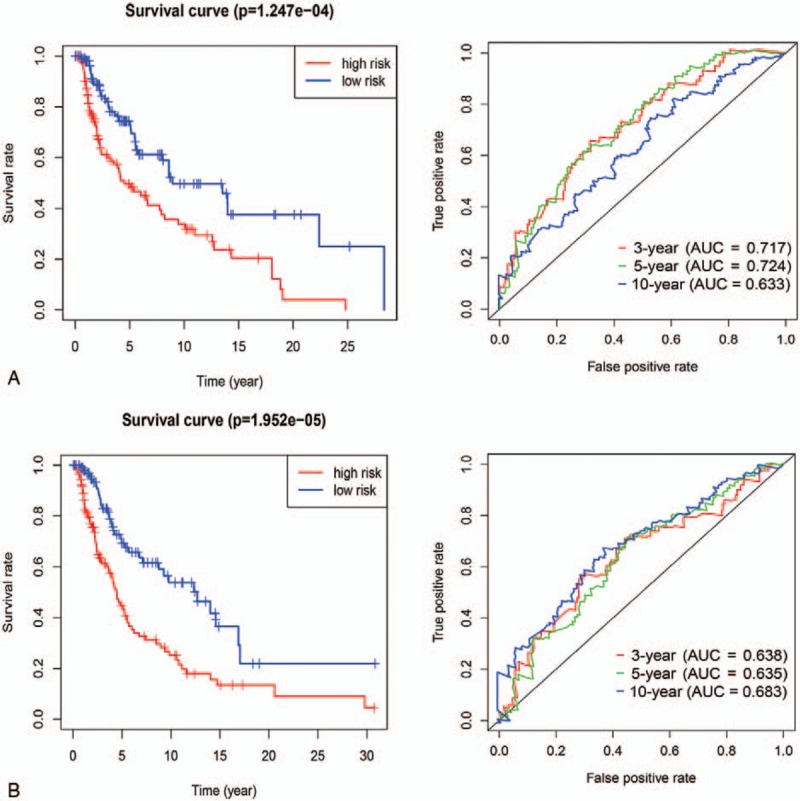
The Kaplan–Meier survival curves and time-dependent ROC curves by the risk score in training set (A) and in the validation set (B).
3.3. Validation of the risk score model
To validate the predictive ability of risk score model, risk scores were calculated with the same formula for patient in the validation set. According to the median of the risk score in the validation cohort, patients were categorized into high-risk group and low-risk group. In the validation set, the distribution of survival status and risk scores of patients (Fig. 2B) have a similar trend with that in the training set. Consistent with the results in the training set, survival analysis showed a significantly lower OS (p < 0.001) in the high-risk group (Fig. 3B). The AUCs for 3-, 5-, and 10-year OS were 0.638, 0.635, and 0.683 for validation set, respectively (Fig. 4B).
3.4. Construction and validation of nomogram
To integrate all independent risk factors of OS for the construction of prognostic nomogram, several clinicopathological factors including RNA-seq based risk score model, age at diagnosis, gender, anatomic site, tumor stage, Breslow thickness, mitoses, ulceration, and Clark level, of each TCGA sample were subjected to univariate and multivariate cox proportional hazards regression analyses. The univariate analysis demonstrated that age at diagnosis, tumor stage, Breslow thickness, ulceration, Clark level, and risk score, were statistically significantly correlated with the OS of CM patients in the training set (Table 3). Further multivariate analysis indicated that 5 variables (age at diagnosis, tumor stage, Breslow thickness, ulceration, and risk score) were independent prognostic factors for OS. Then, we established a nomogram to predict 3-, 5-, and 10-year OS based on multivariate analysis (Fig. 4). The predictive abilities of the nomogram were analyzed by the AUC values. For the training set, the AUC value of the nomogram predicting the 3-, 5-, and 10-year OS rates were 0.816, 0.76, and 0.76, respectively, whereas the AUC value were 0.74, 0.621, and 0.621 in the validation set, respectively (Fig. 5). In addition, we compared the performance of the nomogram with that of the AJCC TNM stage. The predictive ability of our nomogram was significantly superior to that of the TNM staging systems in the training set (AUC = 0.76 vs 0.569). The calibration plots indicated no apparent departure form ideal line with optimal agreement between prediction by nomogram and observation in both the training and validation sets (Fig. 6).
Table 3.
Univariate and multivariate analyses of overall survival in the training set.
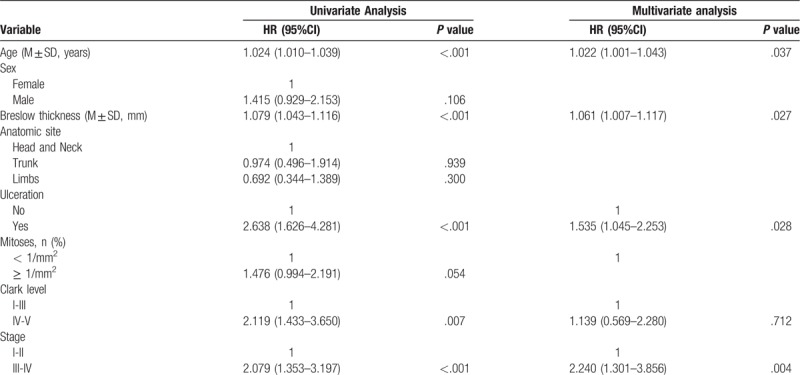
Figure 5.
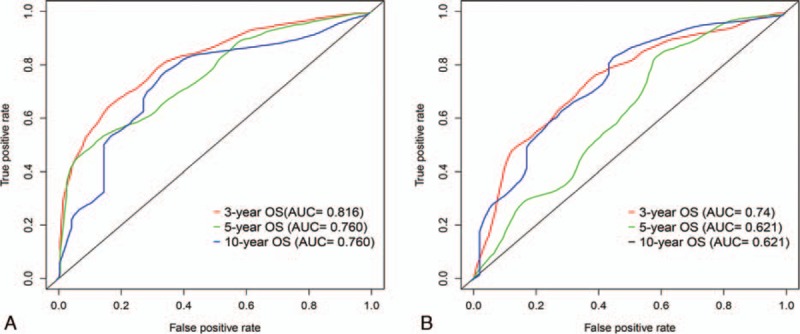
Area under the curves (AUCs) of the nomogram to predict 3-, 5-, and 5-years OS in the training (A) and validation set (B).
Figure 6.
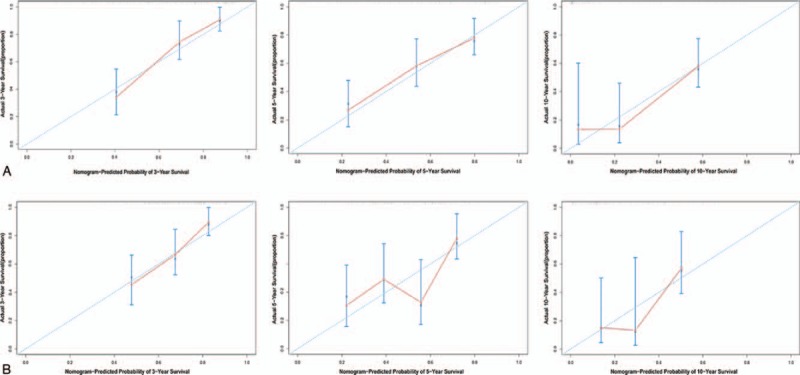
Calibration plots of the nomogram for 3-, 5-, and 10-year OS prediction of the training set (A) and validation set (B).
3.5. Functional enrichment analysis of the three lncRNAs
To evaluate the potential function of the three-lncRNAs, the GO enrichment analysis and KEGG pathways analysis were performed using the co-expressed protein-coding genes of these lncRNAs. With reference to the Pearson coefficient > 0.4 and P < .001, a total of 467 lncRNAs significantly associated with the three lncRNAs were identified. Genes showing the nominal significance level of P < .05 were selected and tested against the background set of all genes with GO annotations and showed in an enriched scatter diagram. We found that regulation of leukocyte activation (GO: 0002694, P = 2.24E–49) was significantly enriched for biological processes. While for cellular component was side of membrane (GO: 0098552, P = 3.28E–24), and for molecular functions was peptide antigen binding (GO: 0042605, P = 2.48E–15) (Fig. 7A). Moreover, we analyzed the KEGG pathway enrichment of these co-expressed genes of the lncRNAs. The KEGG-based enrichment analysis revealed that these genes exhibited significant enrichment in top 10 pathways regarding cell adhesion molecules (CAMs), phagosome, staphylococcus aureus infection, hematopoietic cell lineage, Th17 cell differentiation, Th1 and Th2 cell differentiation, antigen processing and presentation, allograft rejection, Graft-versus-host disease, and type I diabetes mellitus (Fig. 7B).
Figure 7.
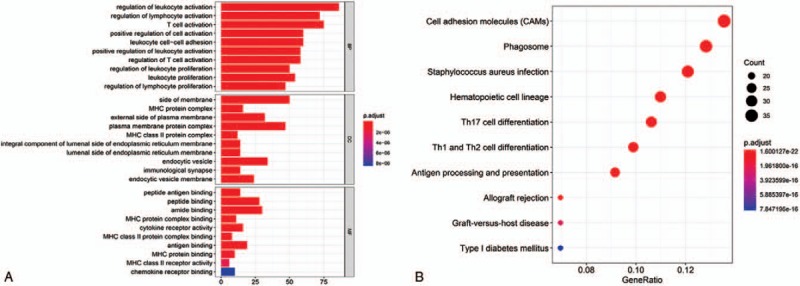
Enrichment of top 10 GO terms (A) and KEGG pathways (B) of differentially expressed mRNAs of the 3 lncRNAs. The node color changes gradually from red to blue in ascending order according to the adjust P values. The size of the node represents the number of counts.
4. Discussion
The AJCC/TNM staging system is routinely used as a staging procedure for CM patients.[15] Significant prognostic heterogeneity still exists in these stage groupings.
In order to improve the prognosis of patients with CM, treatment based on accurate patient stratification into the relevant group is crucial. In recent years, many aberrantly expressed genes have been identified in CM and are significantly associated with the prognosis of CM, suggesting that a deeper understanding of the genetic characteristics of CM may lead to a better risk stratification system.[26–28] In recent years, some prognostic models have been established for predicting the prognosis of CM using only various clinicopathologic characteristics[21] or genetic features.[29] Few CM prognostic models have been established based on a combination of genetic and clinicopathological features. For example, Chen et al[29] used only 4 lncRNAs to construct a prognostic model, without including clinicopathologic variables. In addition, these lncRNAs they obtained were not based on the differentially expressed lncRNAs of melanoma tissue and normal tissue. Therefore, we aimed to identified the differentially expressed lncRNAs associated with OS of CM patients, and establish a novel genetic-clinicopathologic prognostic model through the Cancer Genome Atlas and GTEx databases.
In present study, a total of 458 CM patients was included, and they were randomly assigned to training set and validation set. We identified 212 differentially expressed lncRNAs between CM tissues and adjacent normal tissues. After univariate analysis, LASSO penalized regression analysis, and multivariate analysis, 3 lncRNAs were used to construct risk score model using their expression levels weighted by corresponding correlation coefficient. The predictive performance of the risk score model was good not only in the training set but also in the validation set. The proposed risk score model could divide patients into high-risk and low-risk groups with significantly different survival in both training set and validation set. The ROC curve showed that the risk score model can effectively stratify the risk of CM patients. Furthermore, a nomogram for predicting 3-, 5-, and 10-year OS was established based on lncRNA-based risk score and 5 clinicopathologic factors. The prognostic accuracy of the risk model was confirmed by the discrimination and calibration plots in both training set and validation set. Furthermore, the KEGG pathway analyses showed that several significantly enriched oncological signatures, inflammation, and immune response which might help explain the underlying molecular mechanisms of the model. These results demonstrated that the proposed 3 lncRNA-based risk model could be a useful indicator for CM survival.
Compared to the lncRNA signatures of a previous study,[30] our model has several merits. First, we identified the DElncRNAs between CM tissues and adjacent normal tissues based on TCGA and GTEx databases. However, previous study divided CM patients into early-stage group and advanced-stage group, from which the differentially expressed lncRNAs were identified. Therefore, this will limit the application of their lncRNA signature. Second, these lncRNAs of risk model were identified by LASSO penalized regression and Cox regression analysis in our study. The LASSO algorithm is more accurate than the stepwise regression of a multivariate COX model, especially when dealing with very large datasets.[31] Third, our nomogram combining risk score with conventional clinical parameters like TNM stage shown significantly improved performance, especially in predicting survival, indicating a more accurate reflection of the great heterogeneity of CM.
The dysregulation of lncRNA affects many biological cell processes and ultimately affects the occurrence and development of tumors.[32] Accumulating evidence demonstrated that abnormal expression of lncRNAs is associated with clinicopathological characteristics and prognosis in melanoma, suggesting that lncRNAs may serve as diagnostic or prognostic biomarkers.[33–35] In our study, the risk model included there prognostic lncRNAs (LINC02518, LINC01871, and AC008687.3), of which two (LINC02518 and AC008687.3) was risky genes, and LINC01871 was protective gene. However, to the best of our knowledge, no studies have been conducted on the effects of these 3 lncRNAs, both clinically and from the standpoint of molecular mechanism. Therefore, further research is needed to validate their roles in CM.
Several studies have indicated that the inflammation and immune are significantly associated with progression of melanoma.[36] In our study, functional enrichment analysis indicated that co-expressed genes of the lncRNAs were identified in several immune and inflammation-related pathways including the following: cell adhesion molecules (CAMs), phagosome, staphylococcus aureus infection, Th17 cell differentiation, Th1 and Th2 cell differentiation, antigen processing and presentation, allograft rejection, and Graft-versus-host disease. These results imply that the three lncRNA models may be involved in the regulation of immune and inflammation-related pathways, thereby affecting survival of CM patients.
Several limitations were existed in our study. First, the training set and the validation set were from the same database. An external clinical data from independent cohorts are necessary to validate the three-lncRNA risk model and prognostic nomogram. Second, all analyses in our study are descriptive, further functional experiments are needed to explore the molecular mechanisms of these three lncRNAs. Third, the sample size of this study was limited. Further studies with large-scale and prospective studies are warranted to validate this predictive tool.
5. Conclusions
The present study conducted a novel lncRNA-based prognostic model incorporating three-lncRNA risk score and clinicopathological factors to predict overall survival of CM patients, which may help in clinical decision making for individualized treatment.
Author contributions
Conceptualization: Jun Tian, Yuan Zhang.
Data curation: Jun Tian, Ye Yang.
Formal analysis: Jun Tian, Ye Yang, Meng-yang Li, Yuan Zhang.
Investigation: Jun Tian, Meng-yang Li.
Methodology: Jun Tian, Ye Yang, Meng-yang Li.
Project administration: Jun Tian.
Resources: Jun Tian, Ye Yang.
Software: Jun Tian, Ye Yang.
Supervision: Jun Tian, Meng-yang Li, Yuan Zhang.
Validation: Jun Tian, Yuan Zhang.
Visualization: Jun Tian, Yuan Zhang.
Writing – original draft: Jun Tian, Ye Yang, Meng-yang Li, Yuan Zhang.
Writing – review & editing: Jun Tian, Ye Yang, Meng-yang Li, Yuan Zhang.
Footnotes
Abbreviations: AIC = Akaike information criterion, AJCC = the American Joint Committee on Cancer, CM = cutaneous melanoma, DEGs = differentially expressed genes, DElncRNAs = differentially expressed lncRNAs, FC = fold change, FDR = false discovery rate, GO = Gene Ontology, GTE = the Genotype-Tissue Expression, KEGG = Kyoto Encyclopedia of Gene and Genomes, LASSO = the least absolute shrinkage and selection operator, lncRNA = long non-coding RNAs, OS = overall survival, ROC = receiver operating characteristic, TCGA = the Cancer Genome Atlas, TNM = tumor-node-metastasis, UCSC = the University of California Santa Cruz.
How to cite this article: Tian J, Yang Y, Li My, Zhang Y. A novel RNA sequencing-based prognostic nomogram to predict survival for patients with cutaneous melanoma: clinical trial/experimental study. Medicine. 2020;99:3(e18868).
The datasets used and/or analyzed during the current study are available from the corresponding author on reasonable request.
The authors declare no conflict of interest in this study.
The authors have no funding and conflicts of interest to disclose.
References
- [1].Dimitriou F, Krattinger R, Ramelyte E, et al. The world of melanoma: epidemiologic, genetic, and anatomic differences of melanoma across the globe. Curr Oncol Rep 2018;20:87. [DOI] [PubMed] [Google Scholar]
- [2].MacKie RM, Hauschild A, Eggermont AM. Epidemiology of invasive cutaneous melanoma. Ann Oncol 2009;20: Suppl 6: vi1–7. [DOI] [PMC free article] [PubMed] [Google Scholar]
- [3].Stubblefield J, Kelly B. Melanoma in non-caucasian populations. Surg Clin North Am 2014;94:1115–26, ix. [DOI] [PubMed] [Google Scholar]
- [4].Rastrelli M, Tropea S, Rossi CR, et al. Melanoma: epidemiology, risk factors, pathogenesis, diagnosis and classification. In Vivo 2014;28:1005–11. [PubMed] [Google Scholar]
- [5].Che G, Huang B, Xie Z, et al. Trends in incidence and survival in patients with melanoma, 1974–2013. Am J Cancer Res 2019;9:1396–414. [PMC free article] [PubMed] [Google Scholar]
- [6].Siegel RL, Miller KD, Jemal A. Cancer statistics, 2018. CA Cancer J Clin 2018;68:7–30. [DOI] [PubMed] [Google Scholar]
- [7].Weiss SA, Hanniford D, Hernando E, et al. Revisiting determinants of prognosis in cutaneous melanoma. Cancer 2015;121:4108–23. [DOI] [PMC free article] [PubMed] [Google Scholar]
- [8].DiStefano JK. The emerging role of long noncoding RNAs in human disease. Methods Mol Biol 2018;1706:91–110. [DOI] [PubMed] [Google Scholar]
- [9].Rafiee A, Riazi-Rad F, Havaskary M, et al. Long noncoding RNAs: regulation, function and cancer. Biotechnol Genet Eng Rev 2018;34:153–80. [DOI] [PubMed] [Google Scholar]
- [10].Sanchez Calle A, Kawamura Y, Yamamoto Y, et al. Emerging roles of long non-coding RNA in cancer. Cancer Sci 2018;109:2093–100. [DOI] [PMC free article] [PubMed] [Google Scholar]
- [11].Bubenik J, Swanson MS. STRring up Cancer with lncRNA. Mol Cell 2018;72:399–401. [DOI] [PubMed] [Google Scholar]
- [12].Chen F, Yin S, Zhu J, et al. lncRNA DGCR5 acts as a tumor suppressor in papillary thyroid carcinoma via sequestering miR-2861. Exp Ther Med 2019;17:895–900. [DOI] [PMC free article] [PubMed] [Google Scholar]
- [13].Sun S, Gong C, Yuan K. LncRNA UCA1 promotes cell proliferation, invasion and migration of laryngeal squamous cell carcinoma cells by activating Wnt/beta-catenin signaling pathway. Exp Ther Med 2019;17:1182–9. [DOI] [PMC free article] [PubMed] [Google Scholar]
- [14].Cao T, Shen J, Pan W, et al. Upregulation of long noncoding RNA ANRIL correlates with tumor progression and poor prognosis in esophageal squamous cell carcinoma. J BUON 2018;23:1862–6. [PubMed] [Google Scholar]
- [15].Gershenwald JE, Scolyer RA, Hess KR, et al. Melanoma staging: evidence-based changes in the American Joint Committee on Cancer eighth edition cancer staging manual. CA Cancer J Clin 2017;67:472–92. [DOI] [PMC free article] [PubMed] [Google Scholar]
- [16].Evans JL, Vidri RJ, MacGillivray DC, et al. Tumor mitotic rate is an independent predictor of survival for nonmetastatic melanoma. Surgery 2018;164:589–93. [DOI] [PubMed] [Google Scholar]
- [17].Ribero S, Stucci LS, Marra E, et al. Effect of age on melanoma risk, prognosis and treatment response. Acta Derm Venereol 2018;98:624–9. [DOI] [PubMed] [Google Scholar]
- [18].Namikawa K, Aung PP, Gershenwald JE, et al. Clinical impact of ulceration width, lymphovascular invasion, microscopic satellitosis, perineural invasion, and mitotic rate in patients undergoing sentinel lymph node biopsy for cutaneous melanoma: a retrospective observational study at a comprehensive cancer center. Cancer Med 2018;7:583–93. [DOI] [PMC free article] [PubMed] [Google Scholar]
- [19].Yang J, Pan Z, Zhao F, et al. A nomogram for predicting survival in patients with nodular melanoma: a population-based study. Medicine (Baltimore) 2019;98:e16059. [DOI] [PMC free article] [PubMed] [Google Scholar]
- [20].Zhang Z, Cortese G, Combescure C, et al. Overview of model validation for survival regression model with competing risks using melanoma study data. Ann Transl Med 2018;6:325. [DOI] [PMC free article] [PubMed] [Google Scholar]
- [21].Maurichi A, Miceli R, Camerini T, et al. Prediction of survival in patients with thin melanoma: results from a multi-institution study. J Clin Oncol 2014;32:2479–85. [DOI] [PubMed] [Google Scholar]
- [22].Gao J, Kwan PW, Shi D. Sparse kernel learning with LASSO and Bayesian inference algorithm. Neural Netw 2010;23:257–64. [DOI] [PubMed] [Google Scholar]
- [23].Heagerty PJ, Lumley T, Pepe MS. Time-dependent ROC curves for censored survival data and a diagnostic marker. Biometrics 2000;56:337–44. [DOI] [PubMed] [Google Scholar]
- [24].Wolbers M, Koller MT, Witteman JC, et al. Prognostic models with competing risks: methods and application to coronary risk prediction. Epidemiology 2009;20:555–61. [DOI] [PubMed] [Google Scholar]
- [25].Yu G, Wang LG, Han Y, et al. clusterProfiler: an R package for comparing biological themes among gene clusters. OMICS 2012;16:284–7. [DOI] [PMC free article] [PubMed] [Google Scholar]
- [26].Wang Y, Liu G, Ren L, et al. Long non-coding RNA TUG1 recruits miR29c3p from its target gene RGS1 to promote proliferation and metastasis of melanoma cells. Int J Oncol 2019;54:1317–26. [DOI] [PubMed] [Google Scholar]
- [27].Ren W, Zhu Z, Wu L. FOXD2-AS1 correlates with the malignant status and regulates cell proliferation, migration, and invasion in cutaneous melanoma. J Cell Biochem 2019;120:5417–23. [DOI] [PubMed] [Google Scholar]
- [28].Hu Y, Wang Q, Zhu XH. MiR-135b is a novel oncogenic factor in cutaneous melanoma by targeting LATS2. Melanoma Res 2019;29:119–25. [DOI] [PubMed] [Google Scholar]
- [29].Chen X, Guo W, Xu XJ, et al. Melanoma long non-coding RNA signature predicts prognostic survival and directs clinical risk-specific treatments. J Dermatol Sci 2017;85:226–34. [DOI] [PubMed] [Google Scholar]
- [30].Yang S, Xu J, Zeng X. A six-long non-coding RNA signature predicts prognosis in melanoma patients. Int J Oncol 2018;52:1178–88. [DOI] [PMC free article] [PubMed] [Google Scholar]
- [31].McNeish DM. Using lasso for predictor selection and to assuage overfitting: a method long overlooked in behavioral sciences. Multivariate Behav Res 2015;50:471–84. [DOI] [PubMed] [Google Scholar]
- [32].Ma L, Bajic VB, Zhang Z. On the classification of long non-coding RNAs. RNA Biol 2013;10:925–33. [DOI] [PMC free article] [PubMed] [Google Scholar]
- [33].Shi G, Li H, Gao F, et al. lncRNA H19 predicts poor prognosis in patients with melanoma and regulates cell growth, invasion, migration and epithelial-mesenchymal transition in melanoma cells. Onco Targets Ther 2018;11:3583–95. [DOI] [PMC free article] [PubMed] [Google Scholar]
- [34].Jiao H, Jiang S, Wang H, et al. Upregulation of LINC00963 facilitates melanoma progression through miR-608/NACC1 pathway and predicts poor prognosis. Biochem Biophys Res Commun 2018;504:34–9. [DOI] [PubMed] [Google Scholar]
- [35].Tian Y, Zhang X, Hao Y, et al. Potential roles of abnormally expressed long noncoding RNA UCA1 and Malat-1 in metastasis of melanoma. Melanoma Res 2014;24:335–41. [DOI] [PubMed] [Google Scholar]
- [36].Neagu M, Constantin C, Caruntu C, et al. Inflammation: a key process in skin tumorigenesis. Oncol Lett 2019;17:4068–84. [DOI] [PMC free article] [PubMed] [Google Scholar]


