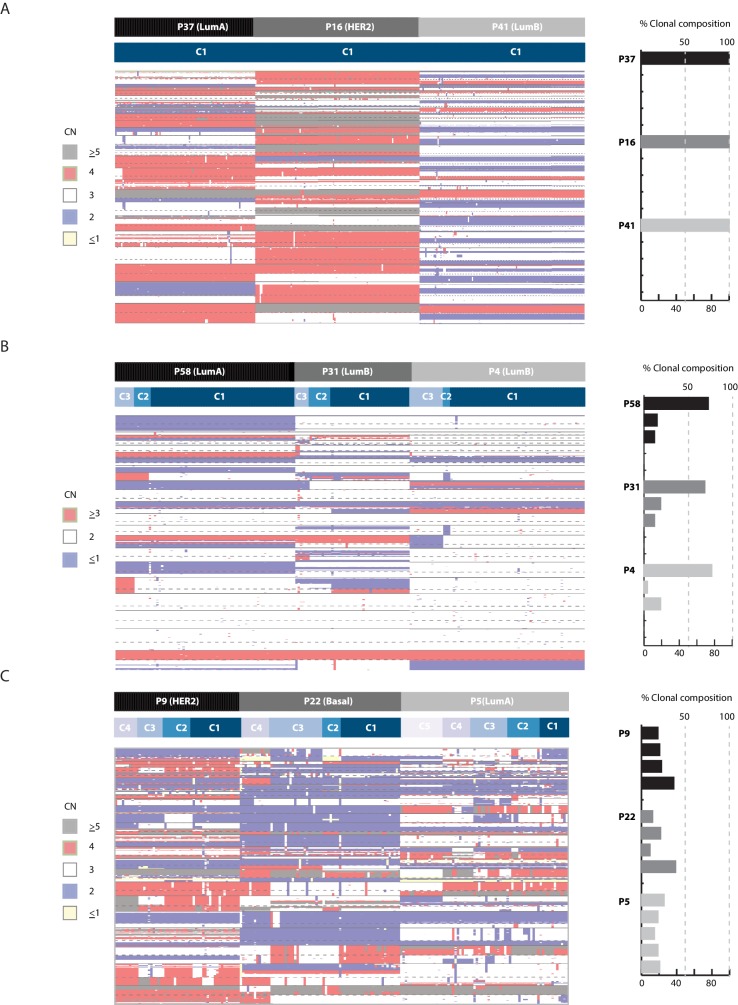
Figure 5. Copy number heterogeneity is associated with biological and clinical parameters and tumors can be classified according to clonal composition.
(A) Bar plot with rank order illustrating CNA heterogeneity as measured by fraction (%) of the genome found to be sub-clonal. Each tumor is denoted at the top of each bar with values of fraction (%) genome sub-clonal also annotated. Categories for association analyses are depicted in panel below. Asterisks denote categories with statistically significant associations based on Wilcoxon rank order tests (p-value=0.0229 and 0.0164 for ER- and polyploidy categories respectively). p-values were rounded and annotated in the figure panel. (B) A representative illustration of a Sanger sequencing trace of DNA from a single normal and single cancer cell from tumor P5, an ER+ tumor. Traces illustrate a G to A transition at position 7578500 of chromosome 17 resulting in a non-sense mutation in the TP53 gene. (C) Correlation analysis between fraction (%) of genome sub-clonal and the log of the tumor size (cm2) as measured by MRI. Pearson’s rank correlation p-value=0.01912. Log of the size was used given the assumption of exponential tumor growth. P5, an ER+, TP53 mutant outlier is excluded from the analysis. (D) Representative MRI images of two patient tumors analyzed in this study illustrating the inverse correlation of tumor size and fraction of genome sub-clonal in ER+ tumors. Red colored ellipses denote tumor positions. (E) Heatmap illustration of three representative tumors displaying different clonal composition patterns. Patterns are: homogenous (P16), heterogeneous with a dominant clone (P14), and heterogeneous without a dominant clone (P5). Top bar denotes tumor identity with bottom bar depicting sub-clones. Heatmap color scheme is provided to the right of the heatmap. (F) Quantification and bar plot illustration of clonal composition as explained in E.


