Abstract
Non-small cell lung cancer (NSCLC) is the major cause of cancer mortality worldwide. Though multidisciplinary therapies have been widely used for NSCLC, its overall prognosis remains very poor, presumably owing to lack of effective prognostic biomarkers. SMAD, a well-known transcription factor, plays an essential role in carcinogenesis. Aberrant expression of SMAD have been found in various cancers, and may be regarded as prognostic indicator for some malignancies. However, the expression and prognostic role of SMAD family member, especially at the mRNA level, remain elusive in NSCLC. In the present study, we report the distinct expression and prognostic value of individual SMAD in patients with NSCLC by analyzing several online databases including ONCOMINE, Gene Expression Profiling Interactive Analysis, Human Protein Atlas database, Kaplan–Meier plotter, cBioPortal, and Database for Annotation, Visualization and Integrated Discovery. The mRNA levels of SMAD6/7/9 in NSCLC were significantly down-regulated in NSCLC, and aberrant SMAD2/3/4/5/6/7/9 mRNA levels were all correlated with the prognosis of NSCLC. Collectively, SMAD2/3/4/5/6/7/9 may server as prognostic biomarkers and potential targets for NSCLC, and thus facilitate the customized treatment strategies for NSCLC patients.
Keywords: bioinformatics analysis, database mining, non-small cell lung cancer, prognostic value, SMAD
1. Introduction
Lung cancer is the leading cause of cancer-related deaths worldwide and a 5-year survival rate <20%.[1] Non-small cell lung carcinoma (NSCLC) is the major common type of lung cancer, accounting for 90% of all lung cancer cases.[2] Lung adenocarcinoma(LUAD) and lung squamous cell carcinoma (LUSC) constitute 50% and 40% of all NSCLC, respectively.[3,4] Even though multidisciplinary therapies have been widely used to treat NSCLC, its overall prognosis remains very poor, presumably owing to lack of effective prognostic biomarkers.[5] Therefore, it is urgent to identify the potential prognostic biomarkers and thus provide better therapeutic strategy for NSCLC patients.[6]
The drosophila mothers against decapentaplegic (SMAD) family comprises 8 members: SMAD1, SMAD2, SMAD3, SMAD4, SMAD5, SMAD6, SMAD7, and SMAD9 (also named SMAD8), which play a key role in various cytokine signaling pathways, such as the transforming growth factor-beta (TGF-β) pathway.[7] Based on differential functions, the mammalian SMAD family members are divided into three classes, including receptor-associated SMAD (R-SMAD): SMAD1, SMAD2, SMAD3, SMAD5, and SMAD9, co-operating SMAD (Co-SMAD): SMAD4, and inhibitory SMAD (I-SMAD): SMAD6, and SMAD7. The SMAD, a well-known transcription factor, plays an essential role in cell proliferation, differentiation, migration, and apoptosis.[8] Evidences revealed that distinct SMAD family members expression has been observed in variety of tumors and may be server as prognostic biomarkers in some malignancies.[9] However, the expression and prognostic value of SMAD family members, especially at the mRNA level, remains elusive in NSCLC.
Emerging evidence indicated that microarray technology and bioinformatic analysis have been widely used to screen genetic alterations in the carcinogenesis and progression of cancer.[10] In this study, we intended to explore the expression and prognosis of SMAD family members in NSCLC patients via mining the online databases, and thus accelerate the identification of potential prognostic biomarkers for NSCLC patients.
2. Materials and methods
2.1. Gene expression analysis
The mRNA levels of SMAD family members in NSCLC were analyzed using ONCOMINE (http://www.oncomine.org/), which is an accessible online cancer microarray database.[11,12] Additionally, gene expression of SMAD members in subtypes of NSCLC were verified by Gene Expression Profiling Interactive analysis (GEPIA) online platform (http://gepia.cancer-pku.cn), which includes RNA sequencing expression data of 9736 tumors and 8587 normal samples.[13] The expression of SMADs between tumor and normal tissues was analyzed using Student t test, and expression of SMADs in different tumor stages of NSCLC was analyzed using F test. P < .01 and fold change >2 were considered significant. In addition, SMAD protein levels were analyzed using the Human Protein Atlas database (HPA) (https://www.proteinatlas.org/) to confirm whether the expression at the mRNA and protein levels matched.
2.2. Survival analysis
The prognostic value of the mRNA levels of SMAD family members was evaluated using Kaplan–Meier Plotter (http://www.kmplot.com), which contains survival information of 2437 NSCLC patients downloaded from Gene Expression Omnibus with clinical data.[14] To evaluate the overall survival (OS), first progression (FP) and post-progression survival (PPS) of NSCLC patients, samples were divided into high and low expression groups according to median mRNA levels with a hazard ratio (HR) with 95% confidence intervals (CI) and log-rank P value. Log-rank P value <.05 were considered significant. Univariate cox analysis was conducted with adjustments to smoking status, clinical stages, chemotherapy, and histology of NSCLC.
2.3. Genetic alteration analysis
To further explore the genetic alterations of SMAD members in NSCLC patients, the genomic profiles like mutations, putative copy-number alterations were obtained from online CBioPortal for Cancer Genomics (http://www.cbioportal.org).[15]
2.4. Functional enrichment analysis
Molecular functions (MF) of SMAD family members at the gene level were performed in GeneMANIA database (http://www.genemania.org), which acts as biological network integration for gene prioritization and predicts gene function.[16] Functional enrichment of SMAD family members such as gene ontology (GO) terms and Kyoto Encyclopedia of Genes and Genomes (KEGG) pathway were performed using the Database for Annotation, Visualization and Integrated Discovery (DAVID).[17,18]
2.5. Ethical statement
All the data of this paper was obtained from the open-access database, we did not get these data from patients or animals directly, nor intervene these patients. So the ethical approval was not necessary.
3. Results
3.1. Gene expression of SMAD family members in NSCLC patients
We firstly evaluated the distinct mRNA level of SMAD family members in NSCLC patients using oncomine database. The results showed that the mRNA levels of SMAD6, SMAD7, and SMAD9 were significantly lower in lung cancer tissues than in normal lung tissues, whereas the differential expressions of SMAD1/2/3/4/5 were not observed between lung cancer tissues and normal tissues (Fig. 1).
Figure 1.
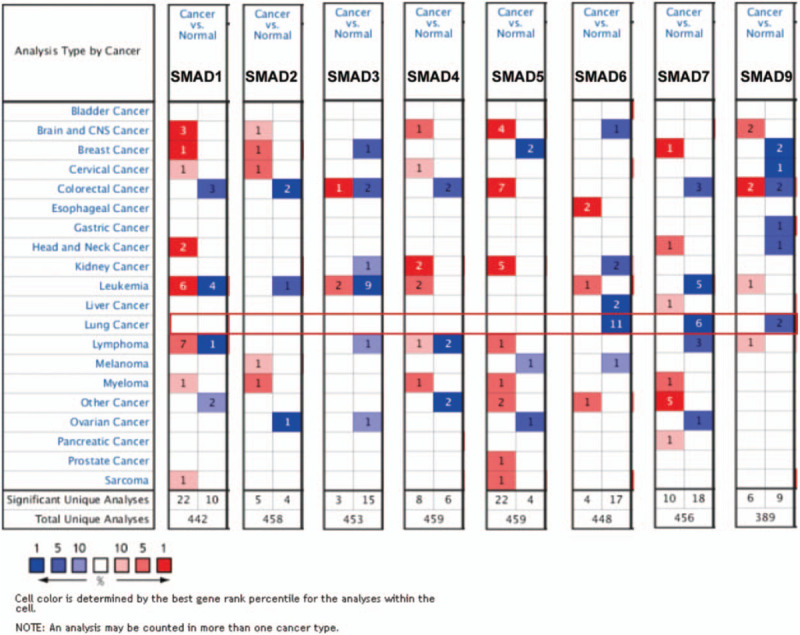
The transcription levels of SMAD family members in different types of cancers (ONCOMINE). The graphic demonstrated the numbers of datasets with statistically significant mRNA over-expression (red) or down-expression (blue) of the target gene. The threshold was designed with following parameters: P value = .001; fold-change = 1.5 and data type, mRNA.
Then, we checked relative mRNA expression of SMAD in subtypes of NSCLC (LUAD and LUSC) compared with that in normal tissue using GEPIA analysis. consistent with the aforementioned results, Figure 2 showed that the mRNA levels of SMAD6, SMAD7, and SMAD9 were significantly decreased in both LUAD and LUSC tissues than in normal lung tissues, whereas the distinct mRNA levels of the rest of SMAD members were not observed between NSCLC tissues and normal tissues. Furthermore, we investigated the expression of SMAD family members in different tumor stages of NSCLC. The expression level of SMAD9 varied in the different tumor stages, while the rest of SMAD expression levels in various tumor stages were not differential (Fig. 3).
Figure 2.
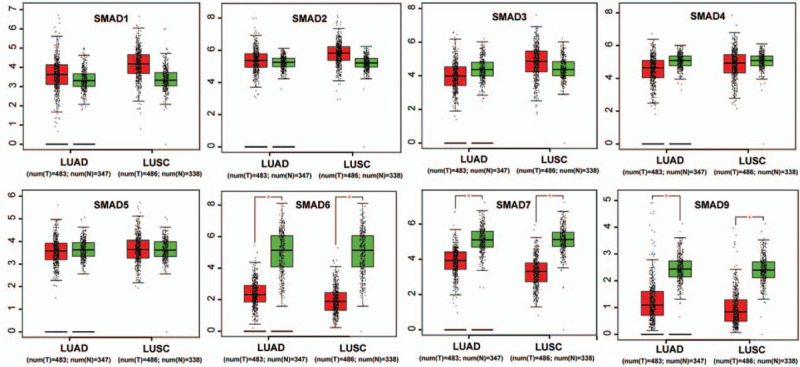
The mRNA expression of SMAD family members in LUAD and LUSC patients (GEPIA). Box plots derived from gene expression data in GEPIA comparing expression of a specific SMAD family member in non–small cell lung cancer tissue and normal tissues, the P value was set up at .01.
Figure 3.
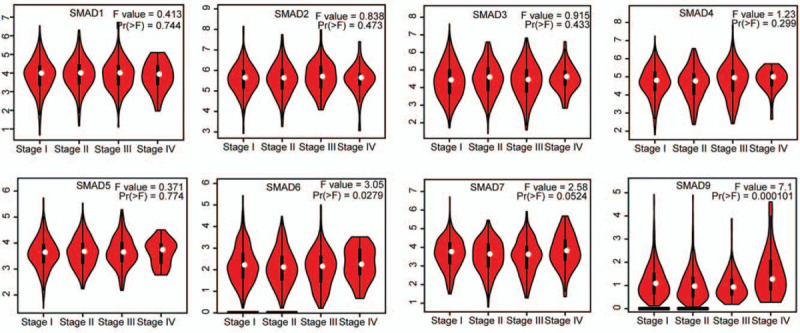
The expression of SMAD family members in different tumor stage of NSCLC patients (GEPIA). Pathological stage plot derived from gene expression data in GEPIA comparing expression of a specific SMAD family member in different stage of NSCLC tissue, the P value was set up at .05.
To validate the proteins expression levels of SMAD family members in NSCLC, we used the HPA database. The results showed the mRNA expression levels of SMAD1, SMAD2, SMAD3, SMAD4, SMAD5, SMAD7, and SMAD9 matched their reported protein expression levels. However, representative images of the SMAD6 protein levels were not available in the HPA database (Fig. 4).
Figure 4.
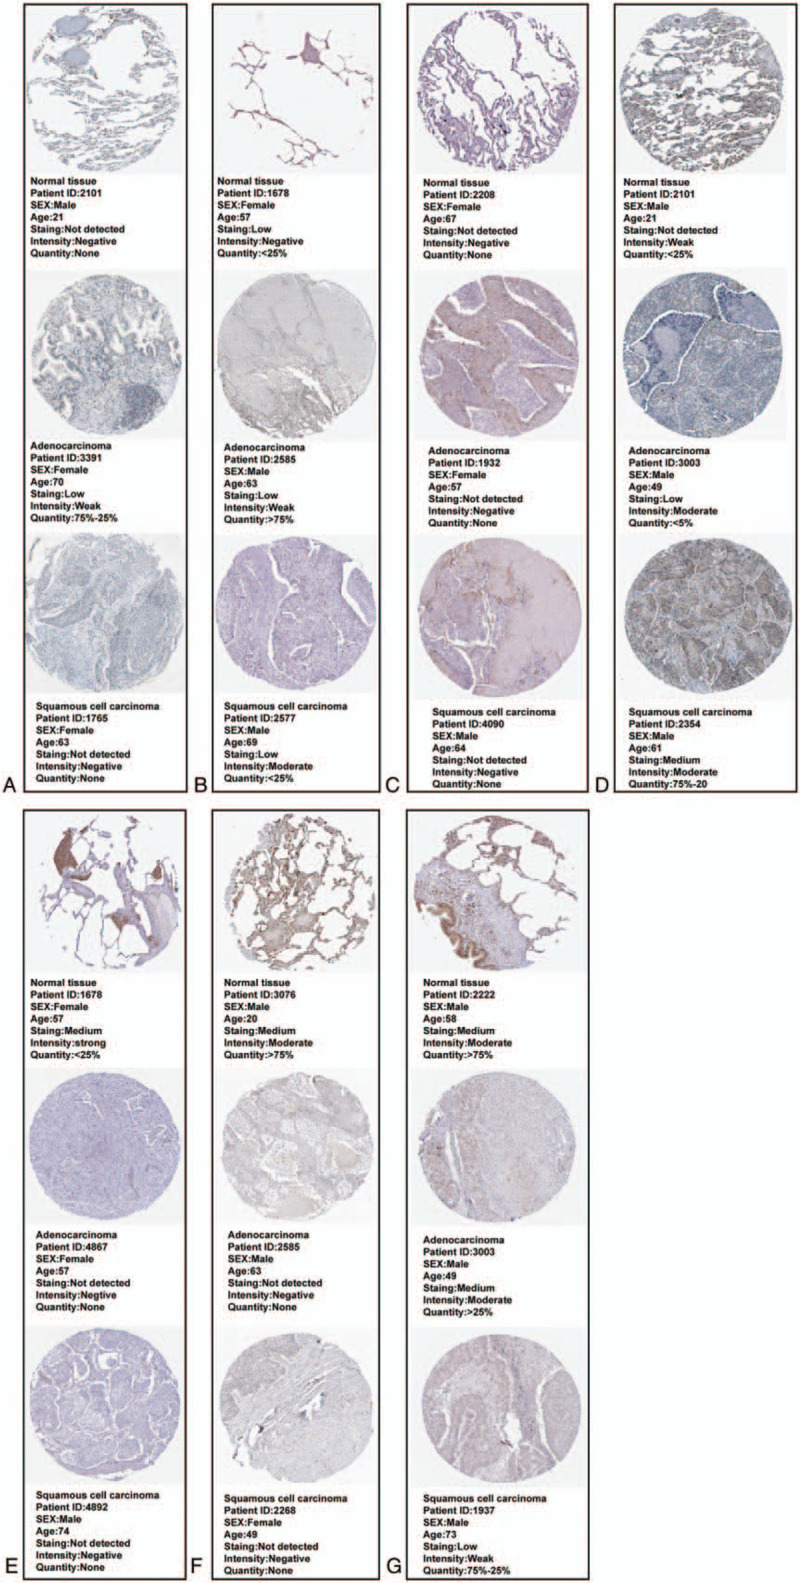
Validation protein expression levels of SMAD family members (SMAD6 was not available) in LUAD and LUSC patients (HPA). (A)SMAD1. (B)SMAD2. (C)SMAD3. (D)SMAD4. (E)SMAD5. (F)SMAD7. (G)SMAD9.
3.2. Prognostic value of SMAD members in all NSCLC patients
We assessed the prognostic significance of the SMAD members in all NSCLC patients using Kaplan–Meier plotter. Increased SMAD2, SMAD4, SMAD5, SMAD6, SMAD7, and SMAD9 mRNA levels were strongly associated with the favorable OS, whereas increased SMAD1 and SMAD3 levels were not related to the OS (Fig. 5). Additionally, high mRNA levels of SMAD4, SMAD5, SMAD6, SMAD7, and SMAD9 or low level of SMAD3 were correlated with favorable FP (Fig. 6). Increased SMAD5, SMAD7, and SMAD9 mRNA levels were predicted to favorable PPS, whereas SMAD1, SMAD2, SMAD3, SMAD4, and SMAD6 mRNA levels were not related to PPS for NSCLC patients (Fig. 7).
Figure 5.
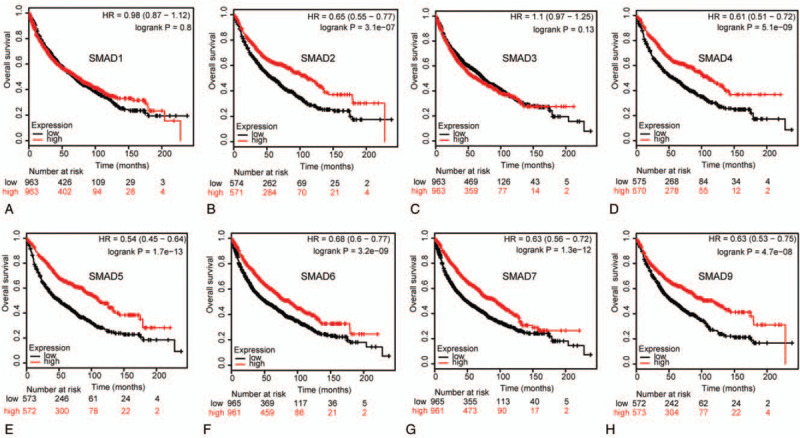
Correlation of SMAD mRNA expression with OS in NSCLC patients (Kaplan-Meier plotter). OS curves of (A) SMAD1 (Affymetrix IDs: 208693_s_at). (B)SMAD2 (Affymetrix IDs: 226563_at). (C)SMAD3 (Affymetrix IDs: 218284_at). (D)SMAD4 (Affymetrix IDs: 235725_at). (E)SMAD5 (Affymetrix IDs: 225223_at). (F)SMAD6 (Affymetrix IDs: 207069_s_at). (G)SMAD7 (Affymetrix IDs: 204790_at). (H)SMAD9 (Affymetrix IDs: 227719_at). The OS survival curve comparing the patient with high (red) and low (black) SMAD family members’ expression in non–small cell lung cancer were plotted from Kaplan–Meier plotter database as the threshold of P value <.05, respectively.
Figure 6.
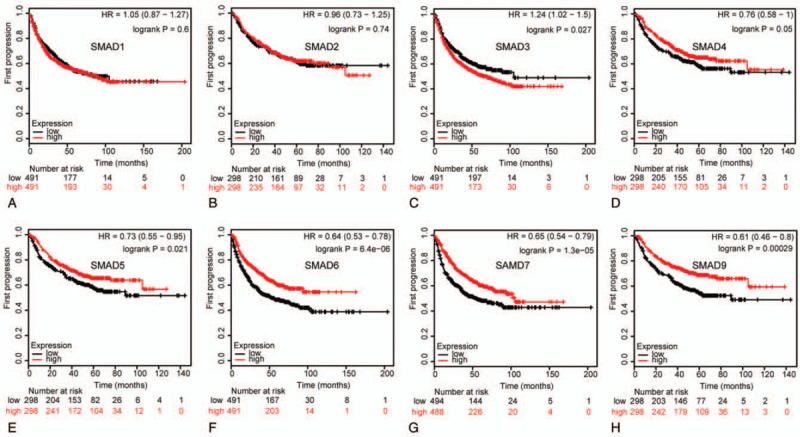
Correlation of SMAD mRNA expression with FP in NSCLC patients (Kaplan-Meier plotter). FP curves of (A) SMAD1 (Affymetrix IDs: 208693_s_at). (B)SMAD2 (Affymetrix IDs: 226563_at). (C)SMAD3 (Affymetrix IDs: 218284_at). (D)SMAD4 (Affymetrix IDs: 235725_at). (E)SMAD5 (Affymetrix IDs: 225223_at). (F)SMAD6 (Affymetrix IDs: 207069_s_at). (G)SMAD7 (Affymetrix IDs: 204790_at). (H)SMAD9 (Affymetrix IDs: 227719_at). The FP survival curve comparing the patient with high (red) and low (black) SMAD family members’ expression in NSCLC were plotted from Kaplan-Meier plotter database as the threshold of P value <.05, respectively.
Figure 7.
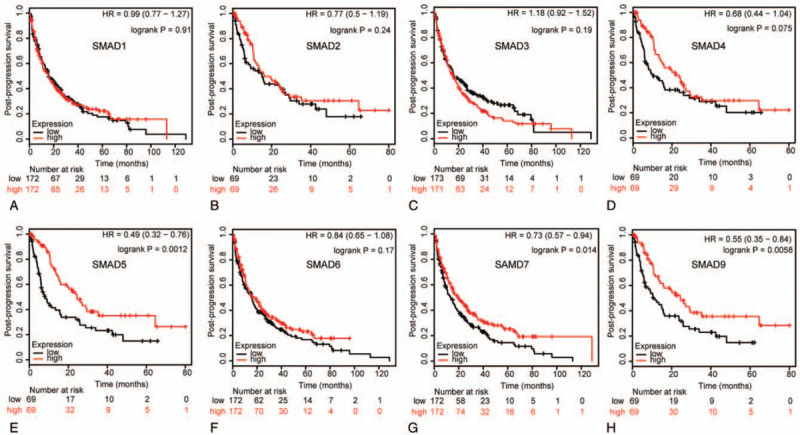
Correlation of SMAD mRNA expression with PPS in NSCLC patients (Kaplan-Meier plotter). PPS curves of (A) SMAD1 (Affymetrix IDs: 208693_s_at). (B)SMAD2 (Affymetrix IDs: 226563_at). (C)SMAD3 (Affymetrix IDs: 218284_at). (D)SMAD4 (Affymetrix IDs: 235725_at). (E)SMAD5 (Affymetrix IDs: 225223_at). (F)SMAD6 (Affymetrix IDs: 207069_s_at). (G)SMAD7 (Affymetrix IDs: 204790_at). (H)SMAD9 (Affymetrix IDs: 227719_at). The PPS survival curve comparing the patient with high (red) and low (black) SMAD family members’ expression in NSCLC were plotted from Kaplan-Meier plotter database as the threshold of P value <.05, respectively.
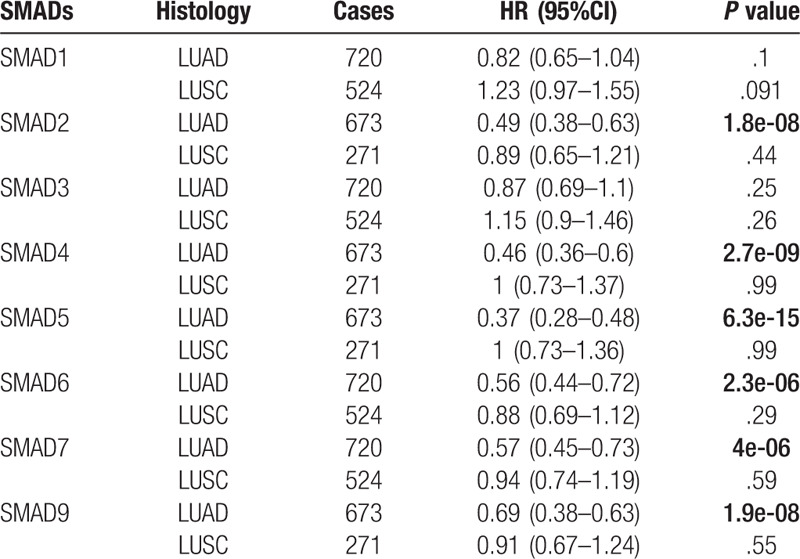
The prognostic value of SMAD family members were analyzed in different subtypes of NSCLC, including LUAD and LUSC. As shown in Table 1, increased SMAD2, SMAD4, SMAD5, SMAD6, SMAD7, and SMAD9 mRNA levels were correlated to longer OS in LUAD patients, and the rest of the SMAD mRNA levels were not correlated with OS in LUAD. For LUSC patients, the correlation between SMAD mRNA expression and OS was not found.
Table 1.
Correlation of SMAD mRNA expression with histology of NSCLC patients.
3.3. Prognostic value of SMAD family members in NSCLC patients with different clinicopathological features
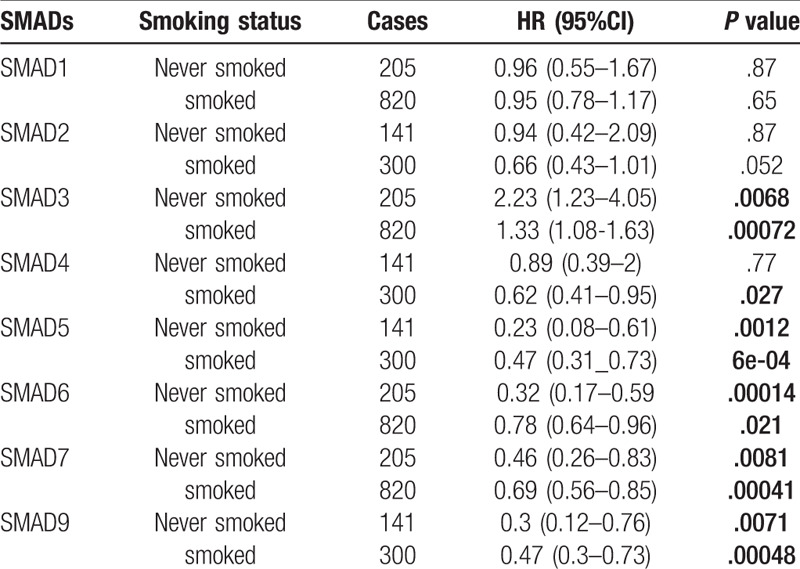
To assess for correlations between SMAD expression and other clinicopathological features, we examined the clinical stages, chemotherapy treatments, and smoking status of patients with NSCLC. As shown in Table 2, elevated SMAD2, SMAD5 and SMAD7 mRNA levels were associated with favorable OS in stages I and II NSCLC. High mRNA levels of SMAD4, SMAD6, and SMAD9 were linked to better OS in stage I NSCLC. As shown in Table 3, the mRNA levels of all SMAD members were not associated with favorable OS in NSCLC patients with or without chemotherapy. Low mRNA level of SMAD3 and high mRNA levels of SMAD5, SMAD6, SMAD7, and SMAD9 were linked to better OS in both smoked and never smoked patients. In addition, high mRNA level of SMAD4 was only correlated with favorable OS in smoked patients (Table 4).
Table 2.
Correlation of SMAD mRNA expression with clinical grades of NSCLC patients.
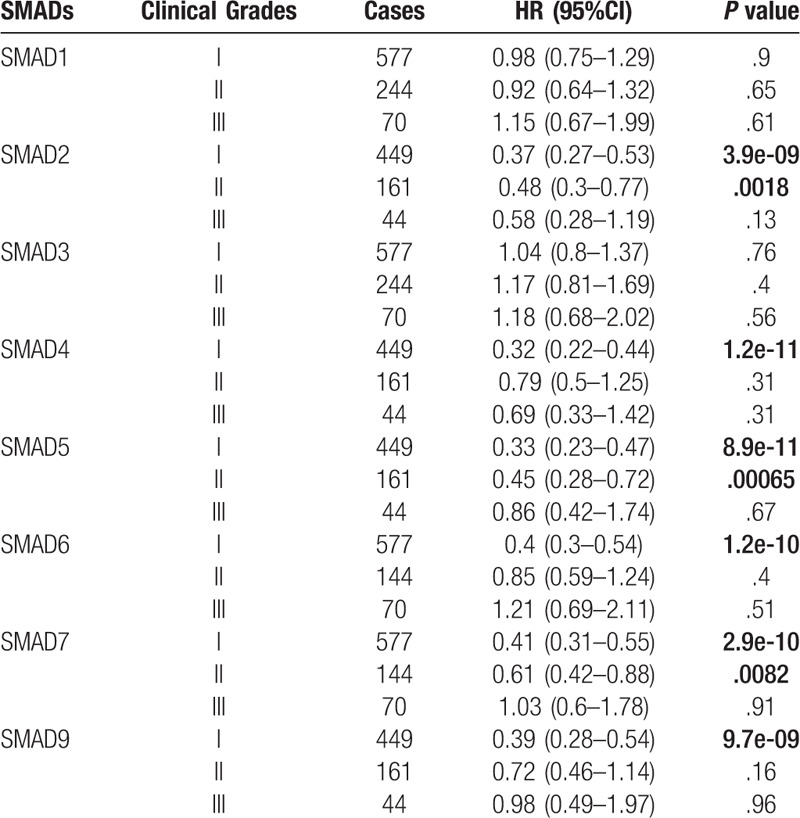
Table 3.
Correlation of SMAD mRNA expression with chemotherapy of NSCLC patient.
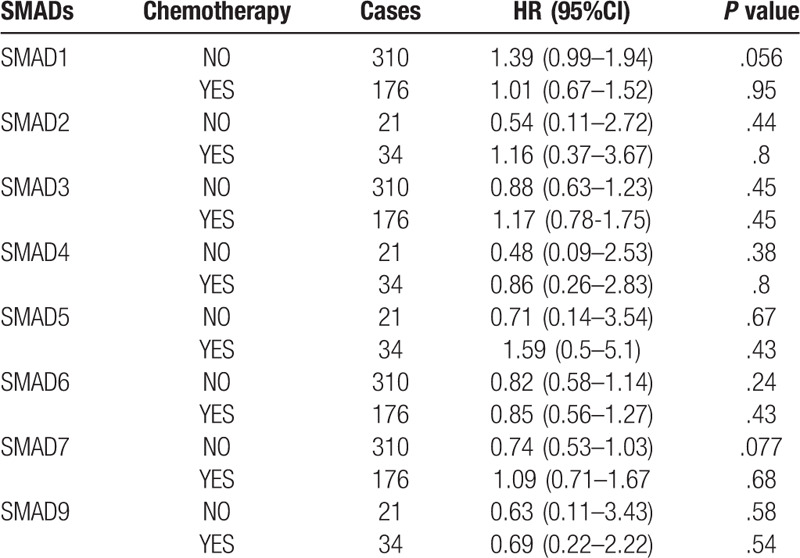
Table 4.
Correlation of SMAD mRNA expression with smoking status of NSCLC patients.
3.4. Genetic alterations of SMAD family members in NSCLC
We evaluated the genetic alterations of SMAD members in NSCLC patients using cBioPortal. Thirteen datasets of NSCLC were analyzed. Among the datasets analyzed, the frequency of gene alterations, including mutations, fusions, amplifications, deep deletions, and multiple alterations ranged from 1.84% (3/163) to 13.6% (77/566), with mutations, amplifications, and deep deletions being the most commonly observed alterations (Fig. 8A). The percentages of genetic alteration in SMAD members for NSCLC varied from 0.4% to 4.0% for individual gene (SMAD1, 1.0%; SMAD2, 2.3%; SMAD3, 1.0%; SMAD4, 4.0%; SMAD5, 0.7%; SMAD6, 0.5%; SMAD7, 1.4%; SMAD9, 0.9%) (Fig. 8B). We analyzed the prognostic roles of SMADs in patients with NSCLC with or without alterations, and did not observe any significant correlation between the presence of alterations and OS and disease-free survival (DFS) (P = .830 and P = .179, respectively; Fig. 8C, D).
Figure 8.
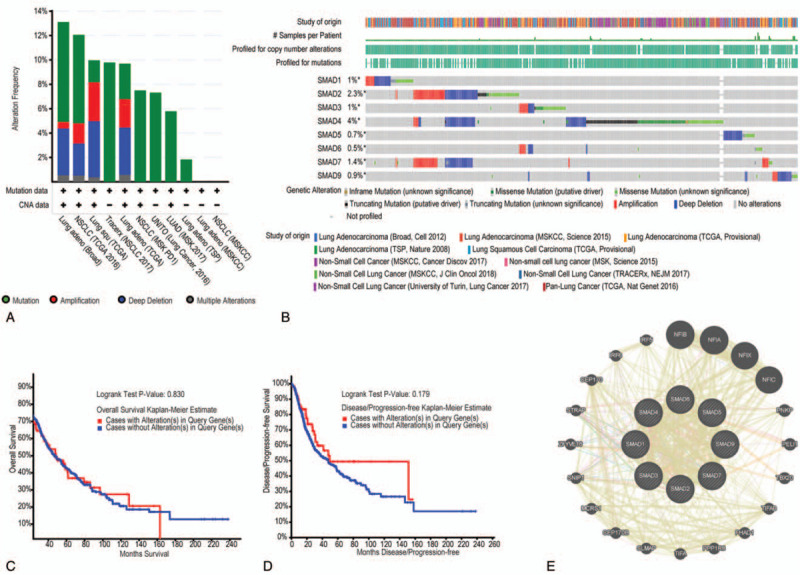
Alteration frequency of SMAD family members and network in NSCLC (cBioPortal and GeneMANIA). (A) Summary of alteration in SMAD family members. (B) OncoPrint visual summary of alteration on a query of SMAD family members. (C) Kaplan-Meier plots comparing OS in cases with/without SMAD family members gene alterations. (D) Kaplan-Meier plots comparing disease-free survival (DFS) in cases with/without SMAD family member alterations. (E) Genegene interaction network among SMAD family members.
We then analyzed a network for SMAD members with their functionally related genes. The results exhibited that 20 genes-DHPS, NFIB, NFIA, NFIX, NFIC, PNKP, PELI1, TBX20, TIFAB, FHAD1, PPP1R8, TIFA, SLMAP, CEP170B, MCRS1, SNIP1, ZFYVE16, STRAP, CEP170, IRF6, and IRF5 were closely associated with SMAD family members. Additionally, all of SMAD family members share protein domains, and SMAD1 and SMAD7, and SMAD2 and SMAD4 coexpressed, and colocalize within the cell (Fig. 8E).
3.5. Functional enrichment analysis of SMAD family members in NSCLC
SMAD functions were analyzed in DAVID, and 50 GO terms were enriched. The enrichment items were classified into 3 functional groups: biological process (BP) group (36 items), cellular component (CC) group (7 items) and molecular function (MF) group (7 items). The top 5 GO terms of DEGs are shown in Table 5. As to BP, SMAD enriched in transforming growth factor beta receptor signaling pathway, ureteric bud development, transcription factor complex, SMAD protein signal transduction and SMAD protein complex assembly. For CC, these genes enriched in nucleus endoderm development, midbrain development, developmental growth and mesoderm formation. In addition, the most enriched GO terms in MF were protein phosphorylation, RNA polymerase II core promoter sequence-specific DNA binding, positive regulation of osteoblast differentiation, palate development and response to hypoxia. KEGG pathways were enriched in TGF-beta signaling pathway, signaling pathways regulating pluripotency of stem cells, hippo signaling pathway, colorectal cancer, pancreatic cancer, adherents’ junction, cell cycle, foxO signaling pathway, HTLV-I infection, pathways in cancer, Inflammatory bowel disease (IBD) and Chagas disease (Fig. 9).
Table 5.
The GO function enrichment analysis of SMAD family members in NSCLC (DAVID).
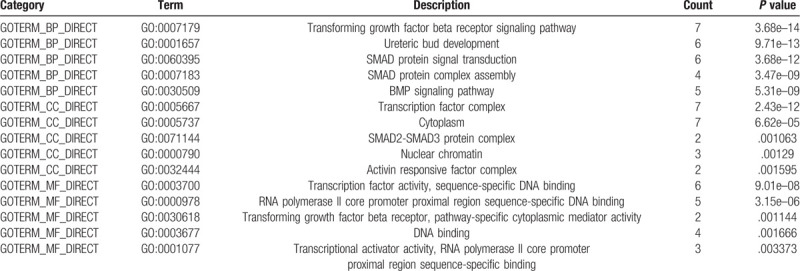
Figure 9.
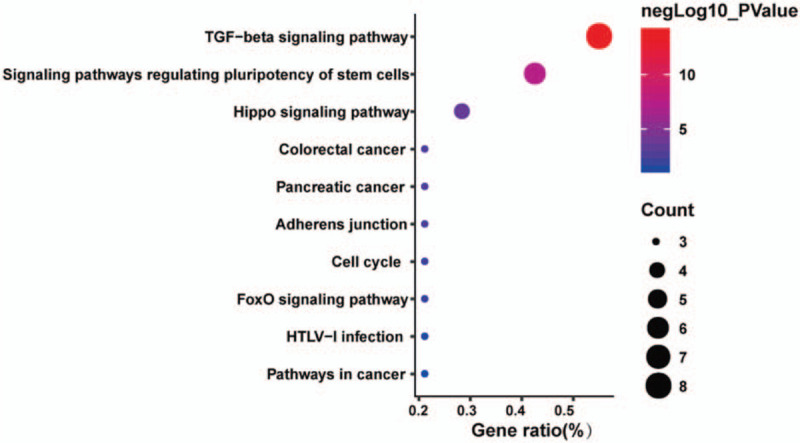
The KEGG pathway enrichment analysis of SMAD family members and neighbor genes in non–small cell lung cancer (DAVID).
4. Discussion
The activation of TGF-β/SMAD pathway has been extensively studied in various carcinomas. However, the differential mRNA expression of SMAD family members in NSCLC patients has largely not been explored. In the present study, we comprehensively explored the expression profiles, prognostic roles (OS, FP, and PPS), genetic alteration, and potential functions of SMAD family members using a bioinformatics approach.
SMAD1/5/9 mediate the signals of the bone morphogenetic proteins (BMPs), which are multifunctional growth factors belonging to TGF-β superfamily and involved in cell growth, apoptosis, morphogenesis, development and immune responses.[19,20] In response to BMP ligands, SMAD1/5/9 can be phosphorylated and activated by the BMP receptor kinase. The phosphorylated form of these proteins can complex with SMAD4, which is important for their functions in the transcription regulation.[21] Previous study showed that the activation of SMAD1/5/9 may promoted tumor cell growth, such as glioma.[22]SMAD1 is often been considered as an oncogene involving in promotion of cancer cell growth and invasion.[23] Gao et al reported that the protein expression of SMAD1 in the LUAD tissues was significantly lower than in normal tissues and it was correlated with lung cancer differentiation and lymphatic metastasis.[24] Interestingly, the tumor suppressive properties of SMAD5 has also been observed in esophageal cancer.[25] Middlebrook et al also reported that ovarian conditional knockout of SMAD1/5 mice developed a disease profile resembling the juvenile form of human granulosa cell tumor.[26] Among the three R-SMAD members, the role of SMAD9 in cancer is ill appreciated. Based on the limited previous studies, the critical roles of SMAD1/5/9 in NSCLC remain largely undefined. Our results demonstrated that the transcription level of SMAD9 in different pathological types of NSCLC was decreased than those in normal tissues, and SMAD9 mRNA level was increased in the advanced clinical stage. We also found that high expressions of SMAD5/9 were associated with favorable OS, FP and PPS in NSCLC patients. These results may be explained by the fact that SMAD1/5/9 play its biological activities may not all depend on its phosphorylation status. Thus, further studies are needed to estimate the association between R-SMAD expression and clinical parameters in NSCLC, and to reveal the exact mechanisms.
SMAD2/3 are the rest of R-SMAD which serve as substrates for TGF-β, and regulate multiple cellular processes, such as cell proliferation, apoptosis, and differentiation.[27] In response to TGF-β signal, SMAD2/3 are phosphorylated by the TGF-β receptors. Following that, phosphorylated SMAD2/3 bind to SMAD4 and translocate to the nucleus where they regulate expression of target genes in a cell type-dependent manner via recruitment of transcriptional coactivator or corepressor.[28] Previous studies showed that the activation of SMAD2/3 could induce cell growth and metastasis in lung cancer.[29] Toyokawa et al reported that high expression of p-SMAD2 predicted poor prognosis in patients with clinical stage I to IIIA NSCLC.[30] Additionally, the high expression of SMAD3 was associated with unfavorable survival in acute myeloid leukemia patients.[31] In consistent with aforementioned studies, we found that high mRNA level of SMAD3 was also associated with poor FP in NSCLC. Unexpectedly, high SMAD2 expression was correlation to better OS in NSCLC, especially in LUAD patients and in clinical grades I or II NSCLC patients. Consequently, the distinct prognostic values of SMAD2 and SMAD3 in NSCLC patients cannot be well explained so far.
As the only member of Co-SMAD, SMAD4 is usually regard as a tumor suppressor gene. It is a common mediator of TGF-β signaling and is involved in TGF-β induced growth inhibition.[32] The activation of SMAD4 could lead to apoptosis or growth arrest in the G1 phase of the cell cycle, and thus involves with tumor formation.[33]
The expression of SMAD4 was negatively correlated with lymphatic metastasis in patients with colon cancer, and its decreased expression was observed in older patients and in those with advanced stages.[34] However, SMAD4 has dual role of tumor-suppressive and tumor-promoting effects on pancreatic cancer.[35] Our results exhibited that increased expression of SMAD4 was linked to better OS in NSCLC patients, especially in LUAD patients and in early stage NSCLC. These results suggested that the underlying molecular mechanisms of SMAD4 are different in various cancers.
The I-SMAD (SMAD6/7) inhibit the activation of R-SMAD by phosphorylation and/or interfering with its nuclear translocation.[36–38]SMAD6/7 have been shown to play a vital role in tumorigenesis, and the distinct expression affect the progression of early lesions and are correlated to poor survival in some certain malignancies.[39] In addition, the expressions of SMAD6/7 were frequently positive in early lesions at the tumor edge, and were inversely correlated to the depth of invasion.[40] In this study, the transcription levels of SMAD6/7 in 2 subtypes of NSCLC were remarkably lower than those in normal tissues. High SMAD6/7 mRNA levels were association with better FP, PPS, and OS, especially in LUAD and early stage tumor.
Genetic alterations of SMAD family members may be associated with pathogenesis and progression of carcinogenesis.[41] We found relatively consistent low levels of alterations in each SMAD in NSCLC, but these alterations had no effect on OS or DFS, suggesting that these changes may not directly impact NSCLC prognosis. To further investigate the MF of the SMAD family members, we performed a network analysis for each SMAD. The results showed that these genes are mainly enriched in tumor related pathways, such as the TGF-β signaling pathway, Hippo signaling pathway, and FoxO signaling pathway. Our research strengthens the understanding of biological function of SMAD family members in NSCLC.
In summary, the mRNA levels of SMAD6/7/9 in NSCLC were significantly down-regulated in NSCLC, and aberrant SMAD2/3/4/5/6/7/9 mRNA levels were all correlated with the prognosis of NSCLC. These results demonstrate that SMAD2/3/4/5/6/7/9 may be prognostic biomarkers and potential targets for NSCLC. Our current study was performed by bioinformatics analysis and the results remain to be confirmed with the corresponding experiments.
Author contributions
Data curation: Dan Li, Chaoqi Zhou.
Methodology: Cheng Qing, Zhiguo Hu, Yiming Huang.
Supervision: Zhenguo Zeng.
Writing-original draft: Zhenguo Zeng, Yuting Yang.
Writing-review and editing: Yanxia Jiang.
Zhenguo Zeng orcid: 0000-0001-5862-1238.
Correction
Affiliation a was appearing incorrectly and has been fixed. The labels in the figure 4 caption have also been corrected.
Footnotes
Abbreviations: BP = biological processes, CC = cellular components, GO = gene ontology, MF = molecular functions, NSCLC = non–small cell lung cancer, SMAD = drosophila mothers against decapentaplegic.
How to cite this article: Zeng Z, Yang Y, Qing C, Hu Z, Huang Y, Zhou C, Li D, Jiang Y. Distinct expression and prognostic value of members of SMAD family in non-small cell lung cancer. Medicine. 2020;99:10(e19451).
The present study was supported by grants from the National Natural Science Funds of China (nos. 81760351 and 81460015).
The authors have no conflicts of interests to disclose.
The Oncomine (https://www.oncomine.org/) was used to perform gene expression profiling analysis. The HPA database (https://www.proteinatlas.org/) was used to perform protein expression analysis. The GEPIA database (http://gepia.cancer-pku.cn) was used to perform gene expression profiling analysis. The Kaplan-Meier Plotter (www.kmplot.com) was used to perform prognostic analysis. The cBioPortal for Cancer Genomics (http://www.cbioportal.org) was used to perform analysis of gene alteration frequency. GeneMANIA (http://www.genemania.org) was used for correlation analysis. The DAVID database (http://david.ncifcrf.gov/) was used to perform functional annotation and pathway enrichment analysis.
References
- [1].Siegel RL, Miller KD, Jemal A. Cancer statistics, 2018. CA Cancer J Clin 2018;68:7–30. [DOI] [PubMed] [Google Scholar]
- [2].Goldstraw P, Ball D, Jett JR, et al. Non-small-cell lung cancer. Lancet 2011;378:1727–40. [DOI] [PubMed] [Google Scholar]
- [3].Travis WD, Brambilla E, Noguchi M, et al. Diagnosis of lung adenocarcinoma in resected specimens: implications of the 2011 International Association for the Study of Lung Cancer/American Thoracic Society/European Respiratory Society classification. Arch Pathol Lab Med 2013;137:685–705. [DOI] [PubMed] [Google Scholar]
- [4].Chen Z, Fillmore CM, Hammerman PS, et al. Non-small-cell lung cancers: a heterogeneous set of diseases. Nat Rev Cancer 2014;14:535–46. [DOI] [PMC free article] [PubMed] [Google Scholar]
- [5].Liu W, Ha M, Yin N. Combination of platelet count and lymphocyte to monocyte ratio is a prognostic factor in patients undergoing surgery for non-small cell lung cancer. Oncotarget 2017;8:73198–207. [DOI] [PMC free article] [PubMed] [Google Scholar]
- [6].Liu K, Jin M, Xiao Li, et al. Distinct prognostic values of mRNA expression of glutathione peroxidases in non-small cell lung cancer. Cancer Manag Res 2018;10:2997–3005. [DOI] [PMC free article] [PubMed] [Google Scholar]
- [7].Heldin CH, Miyazono K, ten Dijke P. TGF-beta signalling from cell membrane to nucleus through SMAD proteins. Nature 1997;390:465–71. [DOI] [PubMed] [Google Scholar]
- [8].Derynck Rik, Zhang Ying E. SMAD-dependent and SMAD-independent pathways in TGF-beta family signalling. Nature 2003;425:577–84. [DOI] [PubMed] [Google Scholar]
- [9].Matveeva A, Kovalevska L, Kholodnyuk I, et al. The TGF-beta- SMAD pathway is inactivated in cronic lymphocytic leukemia cells. Exp Oncol 2017;39:286–90. [PubMed] [Google Scholar]
- [10].Raghavachari N, Barb J, Yang Y, et al. A systematic comparison and evaluation of high density exon arrays and RNA-seq technology used to unravel the peripheral blood transcriptome of sickle cell disease. BMC Med Genomics 2012;5:28. [DOI] [PMC free article] [PubMed] [Google Scholar]
- [11].Rhodes DR, Yu J, Shanker K, et al. ONCOMINE: a cancer microarray database and integrated data-mining platform. Neoplasia 2004;6:1–6. [DOI] [PMC free article] [PubMed] [Google Scholar]
- [12].Rhodes DR, Kalyana-Sundaram S, Mahavisno V, et al. Oncomine 3.0: genes, pathways, and networks in a collection of 18,000 cancer gene expression profiles. Neoplasia 2007;9:166–80. [DOI] [PMC free article] [PubMed] [Google Scholar]
- [13].Tang Z, Li C, Kang B, et al. GEPIA: a web server for cancer and normal gene expression profiling and interactive analyses. Nucleic Acids Res 2017;45:W98–102. [DOI] [PMC free article] [PubMed] [Google Scholar]
- [14].Győrffy B, Surowiak P, Budczies J, et al. Online survival analysis software to assess the prognostic value of biomarkers using transcriptomic data in non-small-cell lung cancer. PLoS ONE 2013;8:e82241. [DOI] [PMC free article] [PubMed] [Google Scholar]
- [15].Cerami E, Gao J, Dogrusoz U, et al. The cBio cancer genomics portal: an open platform for exploring multidimensional cancer genomics data. Cancer Discov 2012;2:401–4. [DOI] [PMC free article] [PubMed] [Google Scholar]
- [16].Montojo J, Zuberi K, Rodriguez H, et al. GeneMANIA: fast gene network construction and function prediction for Cytoscape. F1000Res 2014;3:153. [DOI] [PMC free article] [PubMed] [Google Scholar]
- [17].Huang Da Wei, Sherman Brad T, Lempicki Richard A. Systematic and integrative analysis of large gene lists using DAVID bioinformatics resources. Nat Protoc 2009;4:44–57. [DOI] [PubMed] [Google Scholar]
- [18].Huang Da Wei, Sherman Brad T, Lempicki Richard A. Bioinformatics enrichment tools: paths toward the comprehensive functional analysis of large gene lists. Nucleic Acids Res 2009;37:1–3. [DOI] [PMC free article] [PubMed] [Google Scholar]
- [19].Wakefield Lalage M, Hill Caroline S. Beyond TGFβ: roles of other TGFβ superfamily members in cancer. Nat Rev Cancer 2013;13:328–41. [DOI] [PMC free article] [PubMed] [Google Scholar]
- [20].Lai D, Yang X. BMP4 is a novel transcriptional target and mediator of mammary cell migration downstream of the Hippo pathway component TAZ. Cell Signal 2013;25:1720–8. [DOI] [PubMed] [Google Scholar]
- [21].Ullah I, Sun W, Tang L, et al. Roles of SMADs family and alternative splicing variants of SMAD4 in different cancers. J Cancer 2018;9:4018–28. [DOI] [PMC free article] [PubMed] [Google Scholar]
- [22].Jin X, Nie E, Zhou X, et al. Fstl1 promotes glioma growth through the BMP4/SMAD1/5/8 signaling pathway. Cell Physiol Biochem 2017;44:1616–28. [DOI] [PubMed] [Google Scholar]
- [23].Gordon Kelly J, Kirkbride Kellye C, How Tam, et al. Bone morphogenetic proteins induce pancreatic cancer cell invasiveness through a SMAD1-dependent mechanism that involves matrix metalloproteinase-2. Carcinogenesis 2009;30:238–48. [DOI] [PMC free article] [PubMed] [Google Scholar]
- [24].Gao YQ, Liu M, Zhang H. Expression profiles of SMAD1 protein in lung cancer tissues and normal tissues and its effect on lung cancer incidence. J Biol Regul Homeost Agents 2016;30:165–71. [PubMed] [Google Scholar]
- [25].Zhang Q, Gan H, Song W, et al. MicroRNA-145 promotes esophageal cancer cells proliferation and metastasis by targeting SMAD5., Scand. Scand J Gastroenterol 2018;53:769–76. [DOI] [PubMed] [Google Scholar]
- [26].Middlebrook BS, Eldin K, Li X, et al. SMAD1-SMAD5 ovarian conditional knockout mice develop a disease profile similar to the juvenile form of human granulosa cell tumors. Endocrinology 2009;150:5208–17. [DOI] [PMC free article] [PubMed] [Google Scholar]
- [27].Zhao HW, Li YW, Feng R, et al. TGF-(/SMAD2/3 signal pathway involves in U251 cell proliferation and apoptosis. Gene 2015;562:76–82. [DOI] [PubMed] [Google Scholar]
- [28].Massagué J, Gomis RR. The logic of TGFbeta signaling. FEBS Lett 2006;580:2811–20. [DOI] [PubMed] [Google Scholar]
- [29].Tang YN, Ding WQ, Guo XJ, et al. Epigenetic regulation of SMAD2 and SMAD3 by profilin-2 promotes lung cancer growth and metastasis. Nat Commun 2015;6:8230. [DOI] [PubMed] [Google Scholar]
- [30].Shinto O, Yashiro M, Toyokawa T, et al. Phosphorylated SMAD2 in advanced stage gastric carcinoma. BMC Cancer 2010;10:652. [DOI] [PMC free article] [PubMed] [Google Scholar]
- [31].Zhang J, Zhang L, Cui H, et al. High expression levels of SMAD3 and SMAD7 at diagnosis predict poor prognosis in acute myeloid leukemia patients undergoing chemotherapy. Cancer Gene Ther 2018;26:119–27. [DOI] [PubMed] [Google Scholar]
- [32].Zhou S, Buckhaults P, Zawel L, et al. Targeted deletion of SMAD4 shows it is required for transforming growth factor beta and activin signaling in colorectal cancer cells. Proc Natl Acad Sci USA 1998;95:2412–6. [DOI] [PMC free article] [PubMed] [Google Scholar]
- [33].Dai JL, Bansal RK, Kern SE. G1 cell cycle arrest and apoptosis induction by nuclear SMAD4/Dpc4: phenotypes reversed by a tumorigenic mutation. Proc Natl Acad Sci USA 1999;96:1427–32. [DOI] [PMC free article] [PubMed] [Google Scholar]
- [34].Zeng Y, Zhu J, Shen D, et al. MicroRNA-205 targets SMAD4 in non-small cell lung cancer and promotes lung cancer cell growth in vitro and in vivo. Oncotarget 2017;8:30817–29. [DOI] [PMC free article] [PubMed] [Google Scholar]
- [35].Xia X, Wu W, Huang C, et al. SMAD4 and its role in pancreatic cancer. Tumour Biol 2015;36:111–9. [DOI] [PubMed] [Google Scholar]
- [36].Miyazono K, Suzuki H, Imamura T. Regulation of TGF-beta signaling and its roles in progression of tumors. Cancer Sci 2003;94:230–4. [DOI] [PMC free article] [PubMed] [Google Scholar]
- [37].Afrakhte M, Morén A, Jossan S, et al. Induction of inhibitory SMAD6 and SMAD7 mRNA by TGF-beta family members. Biochem Biophys Res Commun 1998;249:505–11. [DOI] [PubMed] [Google Scholar]
- [38].Takase M, Imamura T, Sampath TK, et al. Induction of SMAD6 mRNA by bone morphogenetic proteins. Biochem Biophys Res Commun 1998;244:26–9. [DOI] [PubMed] [Google Scholar]
- [39].Osawa H, Nakajima M, Kato H, et al. Prognostic value of the expression of SMAD6 and SMAD7, as inhibitory SMADs of the TGF-beta superfamily, in esophageal squamous cell carcinoma. Anticancer Res 2004;24:3703–9. [PubMed] [Google Scholar]
- [40].Kuwano H, Saeki H, Kawaguchi H, et al. Proliferative activity of cancer cells in front and center areas of carcinoma in situ and invasive sites of esophageal squamous-cell carcinoma. Int J Cancer 1998;78:149–52. [DOI] [PubMed] [Google Scholar]
- [41].Ngeow J, Yu W, Yehia L, et al. Exome sequencing reveals germline SMAD9 mutation that reduces phosphatase and tensin homolog expression and is associated with hamartomatous polyposis and gastrointestinal ganglioneuromas. Gastroenterology 2015;149: 886-9.e5. [DOI] [PubMed] [Google Scholar]


