Abstract
Lymph nodes (LN) metastasis differentiation from computed tomography (CT) images is a challenging problem. This study aims to investigate the association between radiomics image parameters and LN metastasis in colorectal mucinous adenocarcinoma (MAC).
Clinical records and CT images of 15 patients were included in this study. Among them, 1 patient was confirmed with all metastatic LNs, the other 14 were confirmed with all non-metastatic LNs. The regions of the LNs were manually labeled on each slice by experienced radiologists. A total of 1054 LN regions were obtained. Among them, 164 were from metastatic LNs. One hundred nine image parameters were computed and analyzed using 2-sample t test method and logistic regression classifier.
Based on 2 sample t test, image parameters between the metastatic group and the non-metastatic group were compared. A total of 73 parameters were found to be significant (P < .01). The selected shape parameters demonstrate that non-metastatic LNs tend to have smaller sizes and more circle-like shapes than metastatic LNs, which validates the common agreement of LN diagnosis using computational method. Besides, several high order parameters were selected as well, which indicates that the textures vary between non-metastatic LNs and metastatic LNs. The selected parameters of significance were further used to train logistic regression classifier with L1 penalty. Based on receiver operating characteristic (ROC) analysis, large area under curve (AUC) values were achieved over 5-fold cross validation (0.88 ± 0.06). Moreover, high accuracy, specificity, and sensitivity values were observed as well.
The results of the study demonstrate that some quantitative image parameters are of significance in differentiating LN metastasis. Logistic regression classifiers showed that the parameters are with predictive values in LN metastasis, which may be used to assist preoperative diagnosis.
Keywords: colorectal mucinous adenocarcinoma, dual-energy computed tomography, logistic regression, lymph nodes metastasis, radiomics image parameters, 2 sample t test
1. Introduction
Colorectal cancer (CRC) is one of the leading causes of cancer death in the world. Among all the histological variants of CRC, around 5% to 20% are diagnosed as mucinous adenocarcinoma (MAC), which is a malignant variant with bad clinical outcomes. MAC has higher metastasis rates and often found to be at more advanced tumor stage with multiple metastatic sites than classic colorectal adenocarcinoma.[1–4]
In clinical process, preoperative diagnosis of lymph nodes (LNs) metastasis is one of the main evidences of operation planning. Modern medical imaging methods, such as endoluminal sonography, computed tomography (CT), and magnetic resonance images (MRI), are widely used in preoperative evaluation of many diseases, due to that they are non-invasive methods. CT and MRI are the 2 main medical images used in the evaluation of CRC. Comparing to MRI, CT can provide quicker examination of tumor staging and LN differentiation in both the patient's chest and abdomen. Thus, it is often performed as a standard preoperative diagnosis of patients with CRC.[5,6]
In recent years, dual-energy computed tomography (DECT) has been widely adopted in clinical practice. In a few preliminary studies, improvement of diagnostic accuracy of LN metastasis in CRC using DECT has been reported, which involve the functional parameters of DECT and conventional image parameters, for example the short axis length.[7] These studies were with small cohorts and did not focus on the MAC variant of CRC.
In previous studies, medical images have been found to be promising in the assessment of cancer invasion and LN metastasis. Conventional image parameters such as the sizes of the LNs (e.g., short axis), and the morphologic criteria (e.g., contour and signal intensity heterogeneity) are often used to evaluate LNs. However, as metastatic and non-metastatic LNs have very similar imaging characteristics, and often present with malignant diseases, the diagnostic accuracy of LN varies largely. Previously reported diagnostic accuracy of LN metastasis varies from 54% to 80%.[5,8–12] Till now, preoperative LN diagnosis based on conventional image parameters is still a challenge in CRC, especially in MAC.
Recently, radiomics has drawn lots of attention in the area of medical research. With the help of computer-aided methods, hundreds of modern quantitative image parameters can be extracted from medical images. These parameters describe the spatial distribution and heterogeneity of the voxel intensities in medical images. Although modern image parameters have not been clearly explained from the biological aspect, their correlations with conventional image parameters, for example, the standardized uptake values and the metabolic volumes, have been reported in a previous study of positron emission tomography-CT.[13]
Modern image features have been studied in the diagnosis of CRC. A previous study showed that differences between primary CRC and liver metastasis in the skewness and the kurtosis parameters extracted from contrast-enhanced CT and on positron emission tomography/CT images were observed in patients with metastatic disease.[14] Radiomics parameters may be useful for classifying hyperplastic polyps from tubular or tubulovillous adenomas and adenocarcinomas. A preliminary study showed that the entropy and uniformity parameters extracted from CT images can be used for distinguishing CRC patients with or without metastatic liver diseases.[15] Radiomics parameters have been applied in the evaluation of LNs metastasis as well. Greater heterogeneity were observed in malignant LNs in patients with CRC based on a previous study of radiomics parameters extracted from conventional CT images.[16]
In this study, we assume that radiomics parameters may have predictive value in the evaluation of LN metastasis in patients with MAC. This study is a preliminary study that aims to investigate the potential association between radiomics image parameters and LN metastasis in MAC. Compare with the previous study, dual-source, DECT were collected, which consists of more information than conventional CT.
2. Methods
2.1. Patients and data acquisition
This study was a retrospective study with the waiver of patient consent, according to the Ethics Committee of our institution. Clinical records and 1-mm DECT images of 41 patients with colorectal tumor were retrieved from June-2018 to April-2019. Since this study aims to investigate the difference of the image parameters between metastatic LNs and non-metastatic LNs, patients who were confirmed to have both metastatic and non-metastatic LNs according to pathology diagnosis were excluded. The reason is that it is very hard to correlate the resected LNs with their locations in DECT images. Thus, only the patients whose LNs were confirmed to be either all metastatic or non-metastatic were included. Moreover, in order to study the LN metastasis of MAC, all the LNs of the selected MAC patients must be metastatic. Based on the selection criteria, a total of 15 patients were included in this study. Among them, 1 patient was confirmed with all metastatic LNs, the others were confirmed with all non-metastatic LNs. The flowchart of the patients’ selection is shown in Fig. 1. The characteristics of the selected patients’ clinical factors, tumor pathologic types, and node sizes are illustrated in Table 1.
Figure 1.
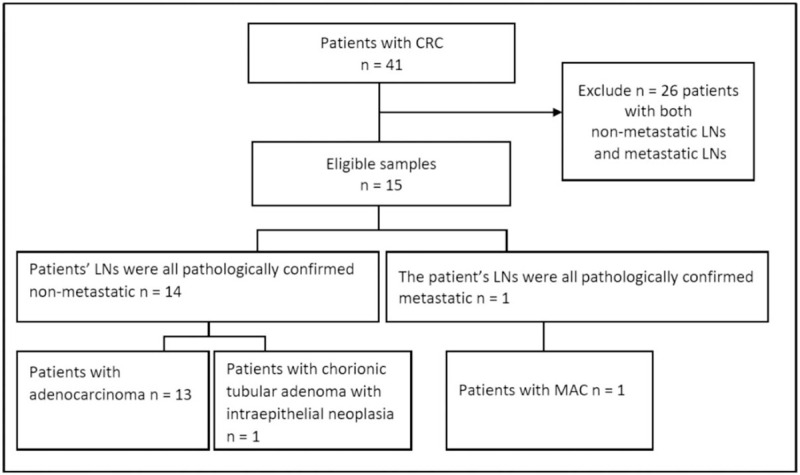
Flowchart of patients’ selection.
Table 1.
Characteristics of patients.

All patients’ scans were performed with a same DECT scanner (SOMATOM Force; Siemens Healthineers, Forchheim, Germany). Enema with 500 to 1000 mL of water was applied to all involved patients the night before DECT acquisition. Distension of the colon or rectum was not observed prior to CT examination. Per-colonic or rectal contrast was set up according to the locations of the tumors. Patients were asked to breathe as gently as possible to reduce the artifacts caused by respiratory motion during the perfusion computed tomography (PCT) examination. At first, a non-contrast scan from the lung base to the lower margin of the symphysis pubis of the entire abdominal cavity was performed, which was used to select the scan range of PCT. Each patient was injected with contrast through an antecubital vein, including 33 mL of a nonionic iodinated contrast agent (350 mgI/mL, Bonorex 350; Central Medical Service Seoul. South Korea) at a flow rate of 6.5 mL/s and a 33-mL saline flush. Followed by the contrast injection, PCT was started 5 seconds after. CT scans were performed for 40 seconds, when a total of 26 CT images were acquired with a cycle time of 1.5 seconds. The PCT covers 17.6 cm. The detector collimation was set up to be 48 × 1.2 mm. The gantry rotation time was 0.32 seconds. The tube current-time product of 60 mAs was set up to be at 80 kVp. After the CT examination, CT images were reconstructed with 5 mm thickness at 3 mm increments.
After PCT examination, all patients were injected with additional contrast of 1.2 mL per kilogram of body weight through an antecubital vein with a 3 mL/s flow rate, as well as a 25-mL saline flush with the same flow rate. After the contrast injection, DECT was performed 30 seconds later. The tube voltage was 100 and Sn150 kVps, and the respective ref. tube current time products were 180 and 90 mAs. The detector collimation was set up to be 128 × 0.6 mm. The gantry rotation time was set up to be 0.5 seconds. After scanning, DECT images were reconstructed with 1.5 mm thickness at 1 mm increments.
The regions of the LNs in each slice of the patients’ DECT images were manually labeled by experienced radiologists using an open source software toolkit named ITK snap.[17] Examples of the LN annotations are illustrated in Figs. 2 and 3. From the 15 patients, a total of 1054 LN regions were manually labeled. Among them, 164 were from the DECT scan of the colorectal MAC patient, whose LNs were all confirmed to be metastatic based on pathology diagnosis. All other LNs were labeled from patients whose LNs were confirmed to be all non-metastatic.
Figure 2.
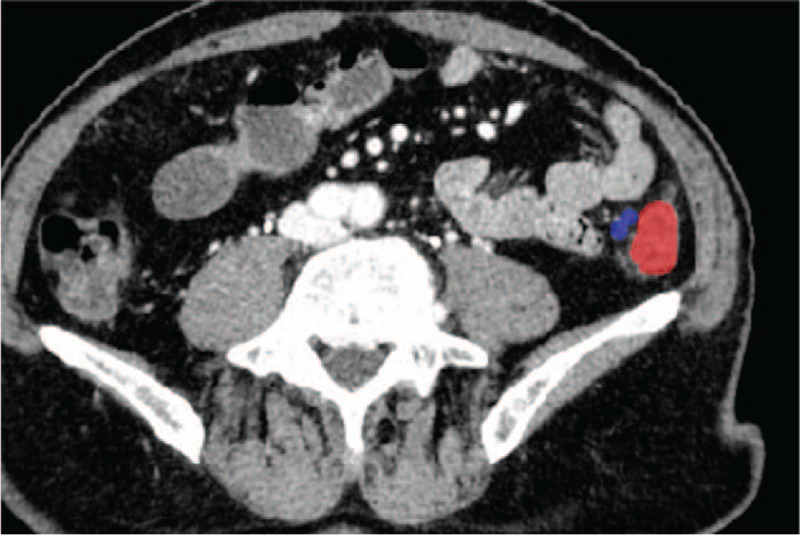
Example of labeled metastatic lymph node. The tumor region is labeled in red, and the lymph node region is labeled in blue.
Figure 3.
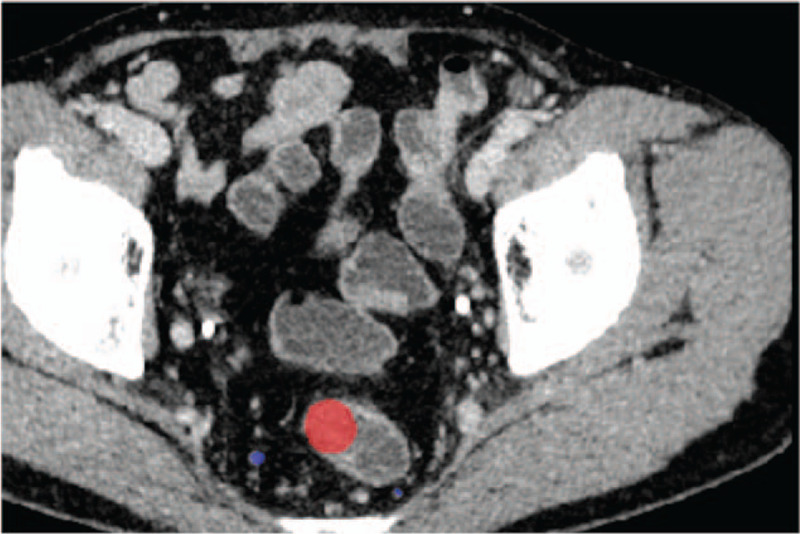
Example of labeled non-metastatic lymph node. The tumor region is labeled in red, and the lymph node region is labeled in blue.
Although it is known that LNs are heterogeneous, this study analyzed LN regions instead of LN based on some practical considerations. In clinical practice, a CT image is often examined by radiologists by browsing its slices, and diagnosis is made based on the analysis of the object regions in the involved slices. The diagnosis of a LN often requires labeling of all its regions, and 3-dimensional reconstruction for visualization purpose. Thus LN regions are more often used than LN in clinical practice. In this study, we assume that the analysis of LN regions with radiomics parameters may be used to assist radiologists in their daily diagnosis process by labeling some of the LN regions instead of all of them. With more patients collected in the future, both LN and LN regions will be studied to reduce the potential bias introduced by the heterogeneity of LN.
2.2. Image parameters
For each of the labeled LN regions, a total of 109 image parameters were computed from the original DECT images, which include 107 radiomics parameters and 2 conventional CT parameters (the mean and the standard deviation of CT value). The radiomics parameters were extracted using a Python toolkit named PyRadiomics.[18] The radiomics parameters are divided into 7 groups based on the statistical metrics used for computation: first order statistics parameters, shape parameters, gray level co-occurrence matrix (GLCM) parameters, gray level difference matrix (GLDM) parameters, gray level run length matrix (GLRLM) parameters, gray level size zone matrix (GLSZM) parameters, neighborhood gray tone difference matrix (NGTDM) parameters. These parameters describe the distribution of the intensities, shape, size, and high-order probability function of the labeled LN regions, which are of statistical meaning yet hardly to be explained intuitively.
2.3. Statistical analysis
The parameters were computed for each of the labeled LN region in the 2 groups, thus no missing values were involved in this study. This study applies a 2-step analysis method. Firstly, two sample t test method was applied to select the parameters of significance. Then a logistic regression model was used to build prediction model with the selected parameters. Both the methods were implemented using Python sklearn package.
The classical 2 sample t test method was applied to assess the differences between the parameters of metastatic LNs group and non-metastatic LNs group. By definition, the mean values of the parameters of each group were evaluated. The significance level was set up to be 0.01 in this study (P < .01). P indicates that we cannot reject the null hypothesis of that the 2 groups have identical mean values.
A logistic regression model with L1 penalty was used to train classifiers. Due to that our data is unbalanced with more samples in non-metastatic group (890) than metastatic group (164), the weights of different groups were adjusted with the group frequencies by using the “balanced” mode during model training. The model was trained using 5-fold cross validation. Each fold randomly splits the samples by preserving the group percentage. Receiver operating characteristic (ROC) analysis, accuracy, sensitivity, and specificity were used to evaluate the performance of the classifiers.
3. Results
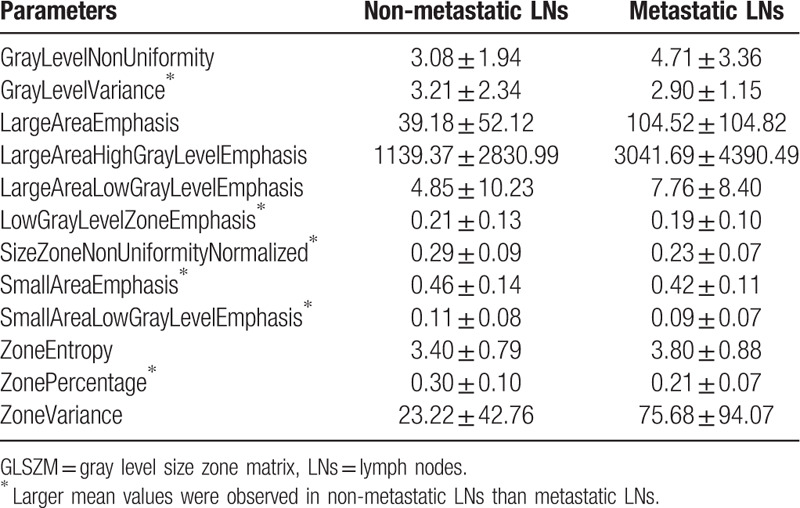
Based on the two sample t test, 73 parameters were found to be significant (P < .01). Both the 7 groups of radiomics parameters and the conventional CT parameters were selected, which include 12 shape parameters, 6 first order parameters, 13 GLCM parameters, 12 GLDM parameters, 13 GLRLM parameters, 12 GLSZM parameters, 4 NGTDM parameters, and the standard deviation of CT values. The selected parameters and their P values are illustrated in Tables 2–9. And the mean and standard deviation values of the selected parameters of the metastatic group and the non-metastatic group are shown in Tables 10–17.
Table 2.
The selected 12 shape parameters (P < .01)∗.
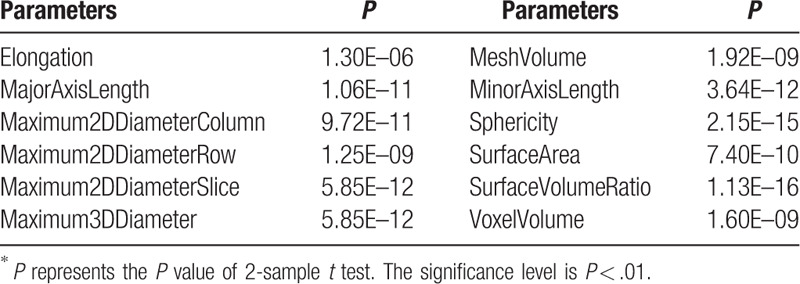
Table 9.
The selected 1 CT parameter (P < .01)∗.

Table 10.
The mean and standard deviation values of selected shape parameters of the non-metastatic group and the metastatic group.
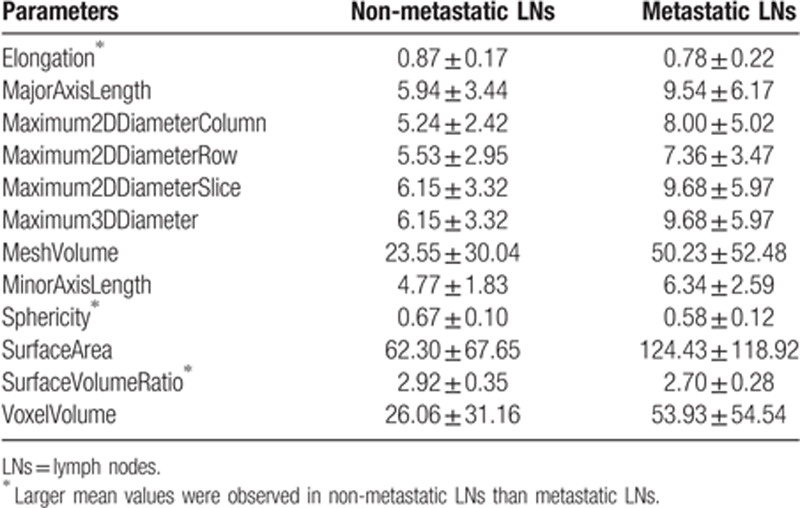
Table 17.
The mean and standard deviation values of selected CT value parameter of the non-metastatic group and the metastatic group.

Table 3.
The selected 6 first order parameters (P < .01)∗.

Table 4.
The selected 13 GLCM parameters (P < .01)∗.
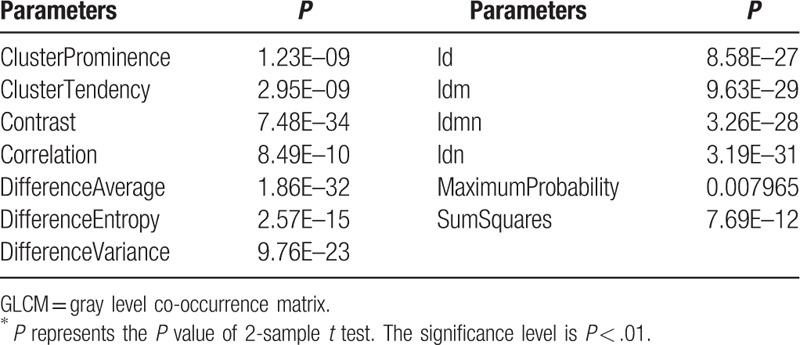
Table 5.
The selected 12 GLDM parameters (P < .01)∗.

Table 6.
The selected 13 GLRLM parameters (P < .01)∗.

Table 7.
The selected 12 GLSZM parameters (P < .01)∗.

Table 8.
The selected 4 NGTDM parameters (P < .01)∗.

Table 12.
The mean and standard deviation values of selected GLCM parameters of the non-metastatic group and the metastatic group.
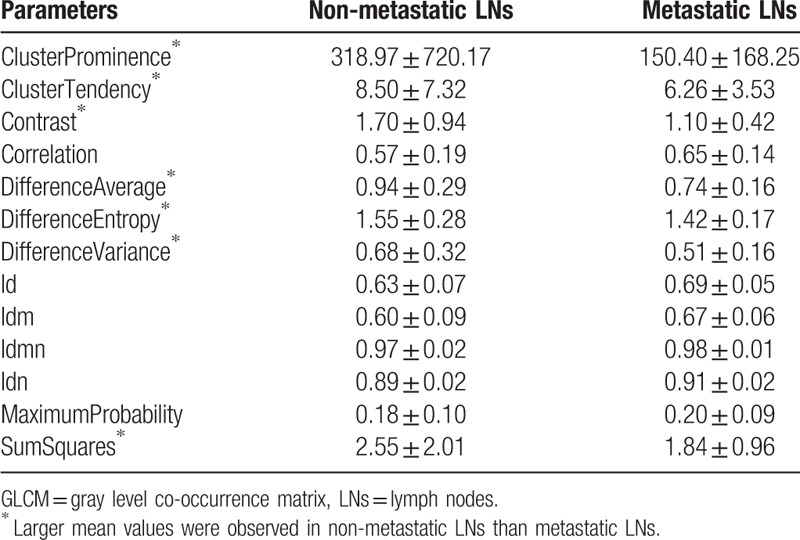
Table 13.
The mean and standard deviation values of selected GLDM parameters of the non-metastatic group and the metastatic group.
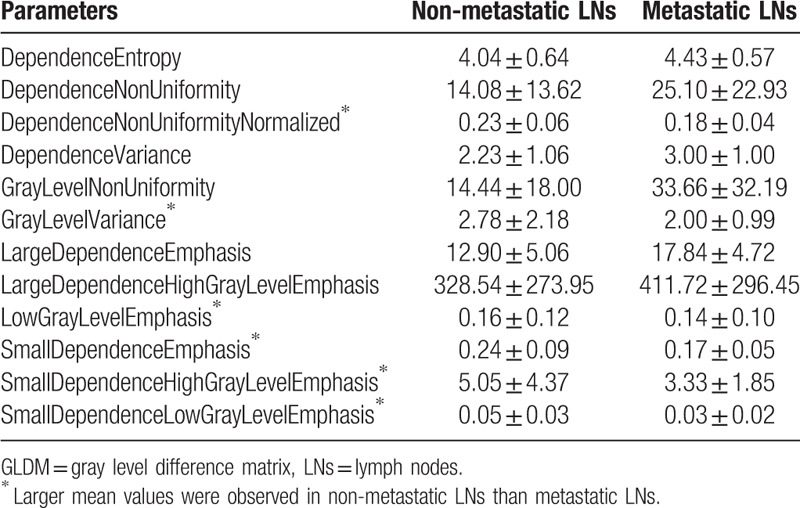
Table 14.
The mean and standard deviation values of selected GLRLM parameters of the non-metastatic group and the metastatic group.
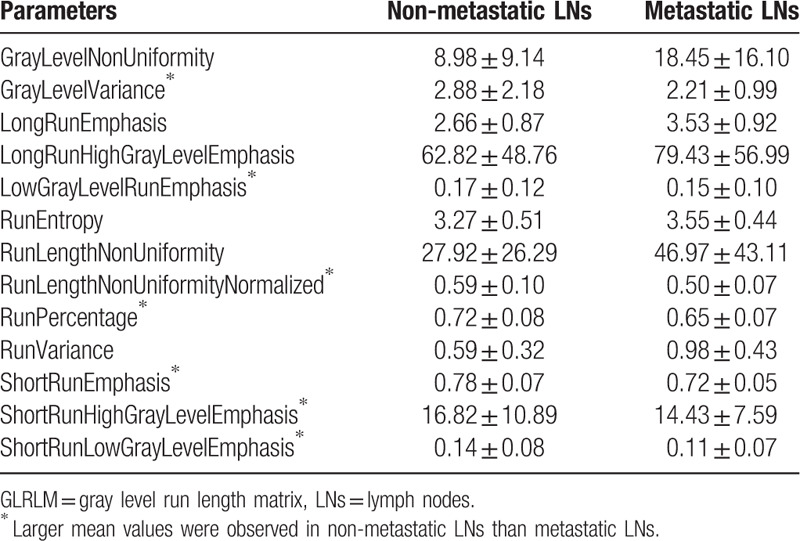
Table 15.
The mean and standard deviation values of selected GLSZM parameters of the non-metastatic group and the metastatic group.
With the selected parameters of significance, it can be seen from Fig. 4 that the logistic regression models achieve high AUC values (0.88 ± 0.06). The mean and standard deviation values of the accuracy, specificity, and sensitivity are reported in Table 18.
Figure 4.
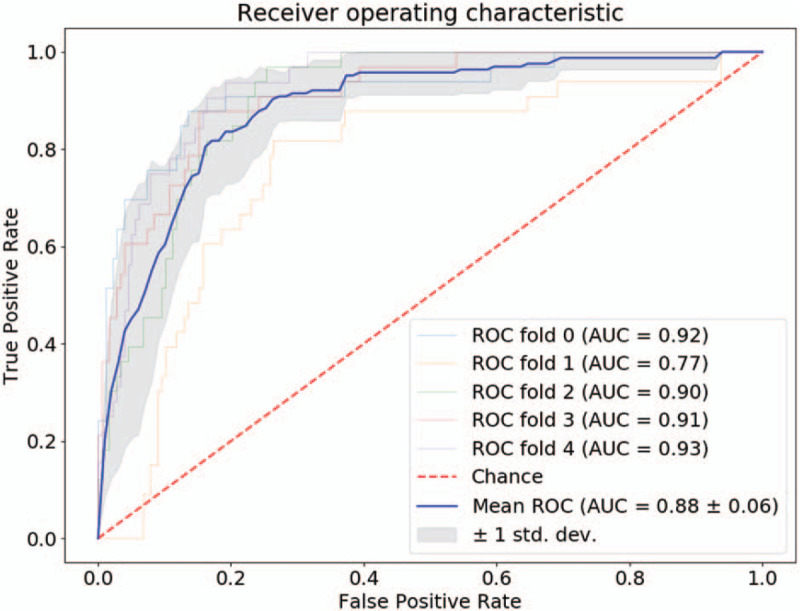
Receiver operating characteristic of logistic regression classifier.
Table 18.
The statistics of the logistic regression classifiers.

4. Discussion
The preoperative diagnosis of colorectal MAC, including LN diagnosis, is a challenging problem. This study aims to investigate the association between the radiomics image parameters and the LN characteristics. A total of 109 image parameters were computed based on manually labeled LN regions in DECT images, which consist of 107 radiomics parameters and 2 conventional CT parameters. Based on 2 sample t test analysis, 73 parameters were found to be significant (P < .01) in classifying metastatic LNs and non-metastatic LNs. Both the 7 groups of radiomics parameters and the conventional CT parameters were selected (Tables 2–9). The mean and standard deviation values of the selected parameters of the metastatic group and the non-metastatic group are shown in Tables 10–17.
It can be seen from Table 10 that the non-metastatic LN group has larger mean values on 3 of the 12 parameters, which are elongation, sphericity, and surface volume ratio. Based on the definition (18), elongation refers to the ratio between the 2 largest principal components in the region of the LN. A value 1 indicates a circle-like region. Sphericity describes the roundness of the shape of the LN relative to a circle. A value 1 indicates a perfect circle. Thus, based on the elongation and the sphericity values, it can be concluded that the non-metastatic LNs are more likely to have a circle-like shape than the metastatic LNs. On the other 9 parameters: MajorAxisLength, Maximum2DDiameterColumn, Maximum2DDiameterRow, Maximum2DDiameterSlice, Maximum3DDiameter, Maximum3DDiameter, MeshVolume, MinorAxisLength, SurfaceArea, VoxelVolume, the non-metastatic LNs have smaller mean values than the metastatic LNs. Larger values of these parameters refer to larger size of the labeled LNs. Thus, it can be concluded that the non-metastatic LNs may have smaller sizes than the metastatic LNs. In clinical practice, it has been commonly agreed that non-metastatic LNs tend to shape more round and smaller than metastatic LNs in general, which was concluded based on the diagnosis from naked eyes in conventional clinical practice. This study validates the common agreement based on computational method. Meanwhile, the consistency between the common agreement and the computational analysis demonstrate the significance of the selected parameters. Moreover, comparing to conventional diagnosis method, each slice of the LN was labeled and analyzed using computer-aided methods. Thus this study presents a more comprehensive investigation of the shape and size of the LNs by analyzing all slices of the LNs.
It can be seen from Tables 11–16 that differences of the mean values can be observed between the non-metastatic LNs and metastatic LNs. These parameters reveal the texture variance among different LN types, which may be used to evaluate LN metastasis with statistical models. However, these parameters have some drawbacks comparing to conventional shape and size parameters. The high order parameters, such as GLCM parameters, GLDM parameters, GLRLM parameters, GLSZM parameters, and NGTDM parameters, are computed based on statistical metrics, which cannot be interpreted directly by radiologists. This makes it difficult to be used in clinical practice.
Table 11.
The mean and standard deviation values of selected first-order parameters of the non-metastatic group and the metastatic group.
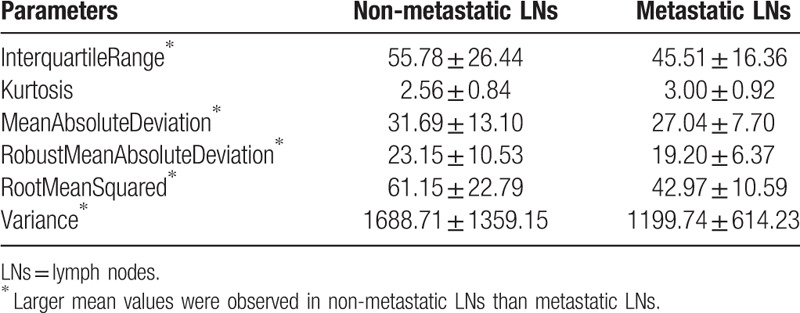
Table 16.
The mean and standard deviation values of selected NGTDM parameters of the non-metastatic group and the metastatic group.

It can be seen from Fig. 4 that the logistic regression classifiers achieve high AUC values. This indicates that the selected parameters are with predictive values in LN metastasis. The accuracies, specificities, and sensitivities are reported in Table 18. It can be observed that the values between the training set and the test set are very close. This showed that the models performed well on both training and test sets. Comparing to the values of the training set, the mean values of the test set drops and the standard deviation values increases. This is commonly observed in model training and test process.
With the development of computer technology, computer-aided analysis has drawn lots of attention in medical researches. In the field of radiological study, the potential value of medical images has been assessed or re-assessed with radiomics parameters. It is assumed that radiomics features may reveal subtle changes that cannot be observed by human with naked eyes. This work is a preliminary study that investigated the potential value of radiomics parameters on LN metastasis assessment. This work is limited due to the fact that the number of patients is limited. In clinical process, pathological diagnosis from operation is recognized as the “gold standard” of LN metastasis in patients with CRC. However, it is very difficult to match a LN in medical images with the resected one, thus only patients with all metastatic or non-metastatic LNs were included in this study. Moreover, in most cases, patients with MAC are diagnosed with both metastatic and non-metastatic LNs. Due to the above-mentioned reason, the number of patients in this study is limited. In this study, the patient case with all metastatic LNs is rarely seen in clinical process, thus it is of great value. As a preliminary study, this work showed the potential value of radiomics parameters in the assessment of LN metastasis. With more patients and intensive evaluation and validation using statistical analysis and modeling methods, radiomics parameters may be used to reduce the time and effort in the preoperative LN diagnosis, hence may assist medical expertise in the daily work and improve the diagnosis and treatment efficiency in clinical process in the future. Our future work will focus on collecting more patients and applying intensive statistical analysis and modeling methods to evaluate and validate the parameters.
5. Conclusion
Imaging methods are commonly used in the preoperative evaluation of primary tumors, by evaluating their imaging appearances. Comparing to CT, MRI has drawn more attention in the analysis of mucin due to that it can reveal the characteristics of soft tissues. However, CT is still widely performed, as it has quicker speed and lower price comparing to MRI. Therefore, it is of great value to investigate the characteristic of mucinous tumor from CT images. There is no study, we know, using radiomics parameters extracted from CT images to evaluate LN metastasis in patients with MAC. Comparing to previous studies, dual-source, DECT were used in this study.
It can be concluded that certain image parameters are significant in differentiating non-metastatic LNs from metastatic LNs (P < .01). Based on the analysis of the shape parameters, it can be concluded that non-metastatic LNs tend to be smaller than metastatic LNs. And non-metastatic LNs tend to have more roundness in the shape than metastatic LNs. Many other high-order parameters were also selected, which may be used to construct prediction models to assist the diagnosis of LN metastasis. Logistic regression classifiers showed high performance with the selected parameters, which indicates the predictive values of the parameters. Although this study focused on LN metastasis in CRC, it can be noticed that image parameters can be used to analyze many other diseases. Comparing to traditional parameters used by radiologists, radiomics parameters containing more quantitative information, which may be used to identify potential signatures. However, there's lots of difficulties in the generalization of radiomics parameters. One of the main reasons is that the parameters are associated with the image quality, which may be affected by the setups in the scanning process, the machine, the operator's habit, and the reconstruction method. This has been recognized as the main difficulty in the research of radiomics parameters, which holds back the development of radiomics parameters into clinical practice. One potential solution may rely on collecting data from multi-centers, which involves collaborations of many researchers and research centers.
Our study has some limitations. Firstly, the patients’ number is not large. In order to get the DECT images of pathological confirmed metastatic LNs, all the metastatic LNs have to be from patients whose LNs are pathologically confirmed to be all metastatic. Similarly, the non-metastatic LNs have to be collected from patients who were confirmed with all non-metastatic LNs based on pathological diagnosis. As most of the patients with CRC are diagnosed to have both metastatic LNs and non-metastatic LNs, it is hard to collect the data of the patients with either all metastatic LNs or all non-metastatic LNs. Thus collecting the required data in this study is very difficult. Secondly, it can be observed from the results of logistic regression models that the sensitivity values are not as good as the values of accuracy and specificity. Our further study will focus on collecting more patients’ data, validate, and improve the analysis and modeling methods.
Author contributions
Conceptualization: Lei Liu.
Data curation: Yafang Dou, Fang Lu.
Formal analysis: Yingying Liu.
Investigation: Yafang Dou, Fang Lu.
Methodology: Yingying Liu.
Project administration: Lei Liu.
Software: Yingying Liu.
Supervision: Fang Lu, Lei Liu.
Validation: Yafang Dou, Fang Lu.
Writing – original draft: Yingying Liu, Yafang Dou.
Writing – review & editing: Yingying Liu, Yafang Dou.
Footnotes
Abbreviations: AUC = area under curve, CRC = colorectal cancer, CT = computed tomography, DECT = dual-energy computed tomography, GLCM = gray level co-occurrence matrix, GLDM = gray level difference matrix, GLRLM = gray level run length matrix, GLSZM = gray level size zone matrix, LN = lymph node, MAC = colorectal mucinous adenocarcinoma, MRI = magnetic resonance images, NGTDM = neighborhood gray tone difference matrix, PCT = perfusion computed tomography, ROC = receiver operating characteristic.
How to cite this article: Liu Y, Dou Y, Lu F, Liu L. A study of radiomics parameters from dual-energy computed tomography images for lymph node metastasis evaluation in colorectal mucinous adenocarcinoma. Medicine. 2020;99:11(e19251).
YL and YD have contributed equally to this work.
The authors have no conflicts of interest to disclose.
References
- [1].Kang H, O’Connell JB, Maggard MA, et al. A 10-year outcomes evaluation of mucinous and signet-ring cell carcinoma of the colon and rectum. Dis Colon Rectum 2005;48:1161–8. [DOI] [PubMed] [Google Scholar]
- [2].Catalano V, Loupakis F, Graziano F, et al. Prognosis of mucinous histology for patients with radically resected stage II and III colon cancer. Ann Oncol 2012;23:135–41. [DOI] [PubMed] [Google Scholar]
- [3].Hyngstrom JR, Hu CY, Xing Y, et al. Clinicopathology and outcomes for mucinous and signet ring colorectal adenocarcinoma: analysis from the National Cancer Data Base. Ann Surg Oncol 2012;19:2814–21. [DOI] [PMC free article] [PubMed] [Google Scholar]
- [4].Wang MJ, Ping J, Li Y, et al. Prognostic significance and molecular features of colorectal mucinous adenocarcinomas: a strobe-compliant study. Medicine (Baltimore) 2015;94:1–8. [DOI] [PMC free article] [PubMed] [Google Scholar]
- [5].de Vries FE, da Costa DW, van der Mooren K, et al. The value of pre-operative computed tomography scanning for the assessment of lymph node status in patients with colon cancer. Eur J Surg Oncol 2014;40:1777–81. [DOI] [PubMed] [Google Scholar]
- [6].Huang YQ, Liang CH, He L, et al. Development and validation of a radiomics nomogram for pre- operative prediction of lymph node metastasis in colorectal cancer. J Clin Oncol 2016;34:2157–64. [DOI] [PubMed] [Google Scholar]
- [7].Yang Z, Zhang X, Fang M, et al. Preoperative diagnosis of regional lymph node metastasis of colorectal cancer with quantitative parameters from dual-energy CT. AJR AM J Roentgenol 2019;1–9. [DOI] [PubMed] [Google Scholar]
- [8].Dighe S, Purkayastha S, Swift I, et al. Diagnostic precision of CT in local staging of colon cancers: a meta-analysis. Clin Radiol 2010;65:708–19. [DOI] [PubMed] [Google Scholar]
- [9].Filippone A, Ambrosini R, Fuschi M, et al. Preoperative T and N staging of colorectal cancer: accuracy of contrast-enhanced multi-detector row CT colonograph--initial experience. Radiology 2004;231:83–90. [DOI] [PubMed] [Google Scholar]
- [10].Al-Sukhni E, Milot L, Fruitman M, et al. Diagnostic accuracy of MRI for assessment of T category, lymph node metastases, and circumferential resection margin involvement in patients with rectal cancer: a systematic review and meta-analysis. Ann Surg Oncol 2012;19:2212–23. [DOI] [PubMed] [Google Scholar]
- [11].Ye Y, Liu T, Lu L, et al. Pre-operative TNM staging of primary colorectal cancer by (18)F-FDG PET-CT or PET: a meta-analysis including 2283 patients. Int J Clin Exp Med 2015;8:21773–85. [PMC free article] [PubMed] [Google Scholar]
- [12].Lu YY, Chen JH, Ding HJ, et al. A systematic review and meta-analysis of pretherapeutic lymph node staging of colorectal cancer by 18F-FDG PET or PET/CT. Nucl Med Commun 2012;33:1127–33. [DOI] [PubMed] [Google Scholar]
- [13].Lovinfosse P, Koopmansch B, Lambert F, et al. (18)F-FDG PET/CT imaging in rectal cancer: relationship with the RAS mutational status. Br J Radiol 2016;89:1–0. [DOI] [PMC free article] [PubMed] [Google Scholar]
- [14].Wagner F, Hakami YA, Warnock G, et al. Comparison of contrast-enhanced CT and [18F]FDG PET/CT analysis using kurtosis and skewness in patients with primary colorectal cancer. Mol Imaging Biol 2017;19:795–803. [DOI] [PubMed] [Google Scholar]
- [15].Rao SX, Lambregts DM, Schnerr RS, et al. Whole-liver CT texture analysis in colorectal cancer: does the presence of liver metastases affect the texture of the remaining liver? United European Gastroenterol J 2014;2:530–8. [DOI] [PMC free article] [PubMed] [Google Scholar]
- [16].Cui C, Cai H, Liu L, et al. Quantitative analysis and prediction of regional lymph node status in rectal cancer based on computed tomography imaging. Eur Radiol 2011;21:2318–25. [DOI] [PubMed] [Google Scholar]
- [17].Yushkevich PA, Piven J, Hazlett HC, et al. User-guided 3D active contour segmentation of anatomical structures: Significantly improved efficiency and reliability. Neuroimage 2006;31:1116–28. [DOI] [PubMed] [Google Scholar]
- [18].Van Griethuysen JJM, Fedorov A, Parmar C, et al. Computational radiomics system to decode the radiographic phenotype. Cancer Res 2017;77:e104–7. [DOI] [PMC free article] [PubMed] [Google Scholar]


