

Supplemental Digital Content is available in the text
Keywords: clustering, population attributable risk, region difference, risk factor, stroke
Abstract
The greatest regional variation in stroke prevalence exists in China. However, whether there are differences in population attributable risk (PAR) and clustering of stroke risk factors among regions resulting in stroke geographic variation is unclear.
We conducted face-to-face surveys of residents of 14 provinces from September 2016 to May 2017 who participated in the Chinese Stroke Screening and Prevention Project. We compared the specific PAR values of eight risk factors and the different cluster rates and patterns in China.
A total of 84,751partipants were included. Eight factors accounted for 70% to 80% of the PAR of overall stroke in China. Not only did the PAR of the total risk factors differ among the 3 regions, but the PAR of the same risk factor also varied among different regions. The top 3 factors with the greatest PAR variations among the 3 regions were dyslipidemia, physical inactivity and family history of stroke. The clustering rates and patterns varied by regions. The overall proportion of participants with 0, 1, 2, 3, and ≥4 risk factors were 34.4%, 28.0%, 17.4%, 9.2%, and 10.3% in eastern China; 31.0%, 27.9%, 19.8%, 10.8%, and 9.9% in Central China and 28.2%, 29.5%, 19.9%, 10.8%, and 11.0% in western China, respectively. On basis of hypertension, the most common risk cluster patterns were overweight or smoking, dyslipidemia and physical inactivity, with other risk factors in the eastern, central and western regions, respectively.
The rates and patterns of clustering and the potential importance of stroke risk factors in different regions may together contribute to the geographical variation in stroke prevalence in China.
1. Introduction
It is well known that stroke is the leading cause of death and disability; stroke contributed to 6.17 million deaths and ranked as the third cause of years of life lost in the 2017 global population.[1] China has the highest stroke incidence and mortality in the world[2] and currently accounts for nearly 30% of the total number of stroke-related deaths worldwide.[3] Based on the Global Burden of Disease data in 2016, China has the highest lifetime risk of stroke, at 39.3%,[4] which means 118 million Chinese people will suffer from stroke by 2030.[5] Furthermore, stroke will have tremendous health-related and economic consequences, which will maintain growth trends in the future. It has been reported that total annual stroke-related costs are projected to increase to $240.67 billion by 2030.[6] This suggests that reducing stroke risk factors is a major priority to decrease the incidence and mortality of stroke- as well as stroke-related economic consequences.
Notably, the INTERSTROKE study results revealed that the management of risk factors can effectively prevent the majority of stroke occurrence.[7] Ten potentially modifiable risk factors were collectively associated with approximately 90% of the population attributable risk (PAR) of stroke incidence.[7]
Interestingly, there is great geographical variation in stroke epidemiology in China. The incidence and prevalence of stroke show a north-to-south gradient in China, and the central region has the greatest stroke burden.[3] This geographical variation can be only partially explained by the differences in risk factor distribution and socioeconomic status among regions.[8–10] In addition, other factors, such as trace elements in the environment[11] and racial,[12] dietary and lifestyle[13] differences among regions, were also associated with the geographical variation in stroke prevalence.
Individuals with multiple risk factors had a higher risk of stroke than individuals with only 1 risk factor.[14] Different clustering patterns of risk factors may also disproportionately increase the stroke risk.[15,16] Unfortunately, the cause of the variation in cluster patterns, whether consistent among different regions or not, is still unclear, and may contribute to stroke geographical differences.[17] Additionally, the INTERSTROKE[7] study found important regional variations in the relative importance of most individual risk factors for stroke, which could contribute to variations among countries and regions in the frequency and case-mix of stroke.
Therefore, we conducted a cross-sectional survey to define the PAR and to analyze the different clustering rates and patterns of eight stroke risk factors in different economic regions of China; the data were obtained from the Chinese Stroke Screening and Prevention Project (CSSPP) 2016. We aimed to find clustering patterns that have potential value to explain the regional variation in stroke epidemiology based on the exposure rate and relative importance of each risk factor.
2. Materials and methods
2.1. Study design and participants
The CSSPP was a national public welfare project supported by the Chinese government to screen for stroke risk factors in permanent community residents (with residency for at least 6 months) who were older than 40 years old. Detailed information on the project design and community sampling method is reported elsewhere.[18] The project collected residents’ information, such as social characteristics, dietary habits, the occurrence of eight stroke risk factors (hypertension, diabetes mellitus, dyslipidemia, heart disease, overweight, smoking, physical inactivity, and family history of stroke [FHS]), history of cerebrovascular disease (CVD) and hematological examination (blood glucose, lipids, HbA1c, and homocysteine) results, and divided the participants into different stroke risk groups to receive individualized interventions.
Our study was in accordance with the guidelines of Strengthening the Reporting of Observational studies in Epidemiology recommendations. The data were based on the clinical information of the residents who participated in the CSSPP 2016. A total of 47 community hospitals from 25 base hospitals in 14 provinces with good quality control and project completion participated in this study. We conducted a cross-sectional survey from September 10, 2016, to May 31, 2017. Residents who were lost to follow-up, died or were unable to provide required information were excluded.
According to China's economic regions, the residents of the 14 provinces were categorized into 4 regions: eastern (Tianjin, Hebei, Zhejiang, Hainan, Guangdong, Jiangsu), central (Jiangxi, Anhui, Hunan), western (Gansu, Sichuan, Shaanxi, Yunnan), and northeastern (Heilongjiang). Heilongjiang was the only included northeast province and had very few participants; therefore, we merged the northeastern regions with the eastern region. Socioeconomic status is difficult to define, and we used 4 measures, namely, disposable personal income, consumption expenditure, the proportion of consumption expenditure attributable to healthcare and gross domestic product, to describe the economic conditions of these regions. The economic data were collected from the China Statistical Yearbook 2016 (http://data.cnki.net/Yearbook/Single/N2017100312).
2.2. Measurement of risk factors
Hypertension was defined as systolic blood pressure ≥140 mm Hg or diastolic blood pressure ≥90 mm Hg or a history of diagnosis of hypertension. Diabetes was defined as a history of diagnosed diabetes, potentially with normal blood glucose or HbA1c due to hypoglycemic therapy, or a positive blood glucose test result plus any of the following conditions:
-
(1)
diabetes symptoms accompanied by fasting blood glucose ≥7.0 mmol/L or random blood glucose ≥11.0 mmol/L;
-
(2)
no typical symptoms of diabetes but fasting blood glucose at ≥7.0 mmol/L or random blood glucose at ≥11.0 mmol/L on at least 2 occasions; or
-
(3)
a 75-g oral glucose tolerance test with glucose ≥11.0 mmol/L at 2 hours after glucose administration.
The diagnosis of diabetes was based on the measurement of blood glucose in venous plasma.[19] Dyslipidemia was defined as a self-reported physician's diagnosis or as abnormal fasting (> 8 hours) levels of any of the following: serum total cholesterol ≥6.22 mmol/L (240 mg/dL), triglycerides ≥2.26 mmol/L (200 mg/dL), or high-density lipoprotein cholesterol <1.04 mmol/L (40 mg/dL). Heart disease included only atrial fibrillation, and other types of heart diseases, such as coronary heart disease, heart failure or valvular heart disease, were not included in our study. Atrial fibrillation was defined as a previous diagnosis in a level-2 or above public hospitals or according to electrocardiogram results. A cumulative smoking time of up to 6 months or passive smoking for at least 15 minutes more than 1 day a week were considered smoking. Body mass index was calculated as height divided by weight squared, and the unit was kilograms per square meter (kg/m2). In Asian people, a body mass index ≥26 kg/m2 is considered overweight or obese. The standard of physical exercise was as follows: moderate- or high-intensity exercise at least 3 times a week for at least 30 minutes each time. Those who did not meet these criteria were considered physically inactive. All stroke patients were diagnosed independently by 2 blinded professional neurologists based on their clinical symptoms (rapidly developing signs of neurological disturbance), imaging at onset, and medical record data. Intracerebral hemorrhage and ischemic stroke were both included.
All participating hospitals strictly followed the technical methods of the CSSPP 2016 to collect data and perform quality control, which ensured the homogeneity of data and quality in our study. Quality control processes included data entry self-checks, community administrator checks, automated website system (www.cnstroke.com) quality control, and superior monitoring conducted by the base hospital administrator.
According to the total numbers of residents exposed to the eight target factors, residents without stroke or transient ischemic attack history were classified as having a low, intermediate or high risk of stroke. Residents who had 3 or more risk factors were considered to have a high stroke risk. An intermediate stroke risk was defined as with hypertension, diabetes or atrial fibrillation but no more than 3 risk factors. Residents without a history of hypertension, diabetes or atrial fibrillation and with fewer than 3 risk factors had a low stroke risk.
2.3. The PAR of the eight risk factors
To obtain the PAR of each factor, the participants were divided into a stroke group and control group based on their diagnosis. Participants with transient ischemic attack were excluded. We performed multivariate logistic regression analyses to adjust for confounding factors (age, sex, and rural location) between the stroke group and control group. The calculation formula of PAR in the univariate analysis is as follows: PAR% = PE(OR-1)/[PE(OR-1)+1] × 100%; where PE represents the exposure ratio of risk factors in population. We obtained the proportions from a report of the national screening program in 2015.[20] The ratio of each risk factor was as follows: hypertension, 29.6%; diabetes mellitus, 11.6%; dyslipidemia, 18.6%; heart disease, 20.0%; smoking, 25.1%; overweight, 30.6%; physical inactivity, 11.9%; and FHS, 1.7%. In the multivariable analysis, we used the method described by Bruzzi to estimate the PAR of each risk factor.[21] Using this method, the addition of PARc% for individual risk factors usually exceeded 100%; however, the overall PAR% for the composite of these risk factors should be less than 100%.
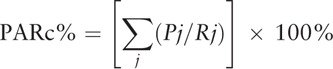 |
where PARC represents the PAR value after adjusting for other covariate factors in the multiple logistic regression;
j represents the stratification of each risk factor, such as 1, 2, 3 or more;
Pj represents the proportion of the ratio of the number of cases to the total number of cases; and
Rj represents the control group, defined as 1, or the stroke group, which was equal to the OR value.
2.4. The clustering pattern of stroke risk factors
To compare the clustering differences of risk factors between regions, we categorized participants into 5 groups based on their total numbers of stroke risk factors: 0, 1, 2, 3, and ≥4 risk factors. Moreover, to find the potential predictive clustering patterns among regions for the geographical variation in stroke, we compared ten patterns of 3 stroke risk factor clusters according to the 6 most common and important risk factors (hypertension, dyslipidemia, smoking, physical inactivity, overweight, and FHS). These 6 factors were selected based on our results of stroke risk factor distributions and PAR values in different regions. All clustering patterns were based on hypertension.
2.5. Statistical analysis
We calculated means and medians to describe continuous variables. If there were any questionable distributional assumptions, we compared means and medians with t tests or other appropriate nonparametric tests. Categorical data were analyzed by chi-square or Kruskal-Wallis tests. All statistical tests were 2-sided, and P < .05 was considered statistically significant. We used SPSS v22.0 (SPSS Inc., Chicago, IL) and GraphPad Prism 5.0 for Windows to conduct the statistical analyses and construct the graphs, respectively.
2.6. Ethical approval
All human-participant procedures in the above studies were performed in accordance with the ethical standards of the institutional and/or national research committee as well as with the 1964 Declaration of Helsinki and its later amendments or comparable ethical standards. This study was approved by the Ethics Committee of the West China Hospital, Sichuan University, and all participants signed informed consent forms.
3. Results
3.1. Participants
A total of 91,847 residents were invited to participate in this study; 761 residents who died (causes were stroke, 96; cardiovascular disease, 59; neoplasms, 134; respiratory system disease, 75; injury and poisoning, 11; other, 141; and undefined, 245) and 6335 (6.9%) residents who were lost to follow-up or had incomplete information were excluded. Finally, 84,751 participants were included. Among them, 39,510 (46.5%) were male, the mean age was 59.68 ± 11.45 years old, and 45,377 (53.0%) were from rural regions.
The proportions of participants in the eastern, central and western economic regions were 39.4%, 15.3% and 45.3%, respectively. The eastern region had the highest economic status, and the western region had the lowest economic status in each measurement; the details are shown in Table S1 and Fig S1 in the Supplementary Appendix.
The overall prevalence of stroke was 1.6% in 2016. The specific proportions were 2.0%, 2.7%, and 0.9% in the eastern, central and western regions, respectively.
3.2. The distribution of risk factors in the 3 regions
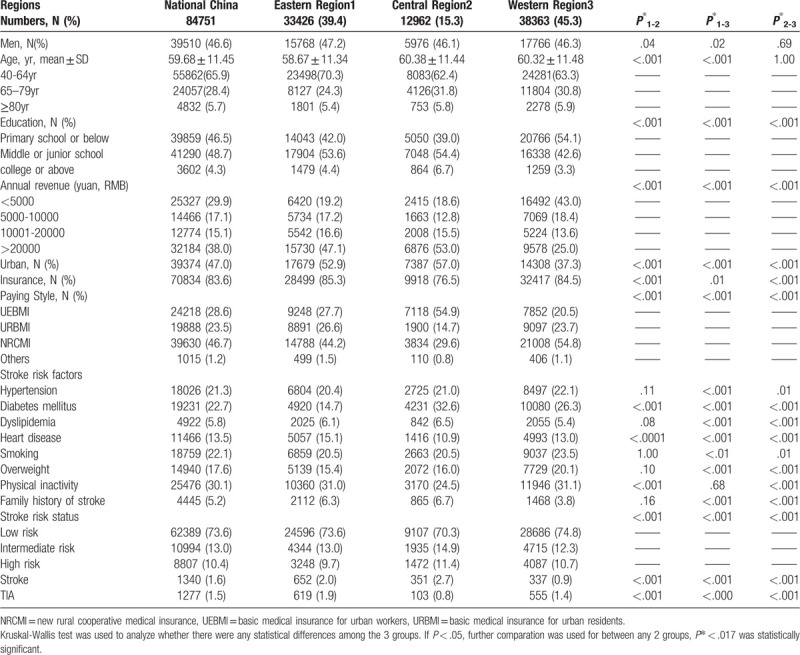
The exposure rate and ranking of each stroke risk factor varied among the different regions; the details are shown in Table 1. In the eastern region, the 4 most common prevalent risk factors were physical inactivity (31.1%), smoking (20.5%), hypertension (20.4%) and overweight (15.4%). In the central region, the top 4 factors were diabetes (32.6%), physical inactivity (24.5%), hypertension (21.0%) and smoking (20.5%). In the western region, the top 4 factors were physical inactivity (31.1%), diabetes (26.3%), smoking (23.5%) and hypertension (22.1%). Rural residents suffered greater exposure to the risk factors than urban residents in each region. With the improvement in annual revenue, the burden decreased (Table S2–S6 in the Supplementary Appendix). Although variation in stroke risk factor distribution was identified among the regions, the overall trend was similar, with the most common risk factors being hypertension, smoking, diabetes, overweight and physical inactivity in each region.
Table 1.
The characteristics and distribution of stroke risk factors in different economic regions in 2016.
3.3. PARs of individual risk factors in the 3 regions
Collectively, the 8 studied risk factors accounted for 85.3% of the PAR of overall stroke in China, and the proportion decreased from the eastern to western regions (90.5% in the eastern region, 81.1% in the central region, and 72.2% in the western region), as shown in Figure 1. After adjusting for sex, age, and rural status, the rates were 88.1%, 85.4%, and 70.8%, respectively (Fig. 2). The same individual risk factors accounted for different proportions of the PAR of stroke in different regions. The top 3 factors with the greatest variation between regions were dyslipidemia, physical inactivity and FHS. The PAR proportions of these factors in the eastern, central and western regions were 29.2% vs 75.7% vs 19.6% for dyslipidemia; 16.0% vs 42.6% vs 34.9% for physical inactivity; and 22.9% vs 14.8% vs 5.1% for FHS, respectively. In addition, the importance of each risk factor in the PAR of stroke was distinguished in each region. The 4 most important risk factors for PAR of stroke in the eastern region were hypertension (64.0%), dyslipidemia (29.2%), FHS (22.9%), and physical inactivity (16.0%). In the central region, these 4 factors were dyslipidemia (75.7%), hypertension (67.7%), physical inactivity (42.6%), and FHS (14.8%). In the western region, these 4 factors were hypertension (50.5%), physical inactivity (34.9%), dyslipidemia (19.6%), and smoking (8.2%). The details are shown in Figure 3. Generally, the most important risk factors associated with stroke were hypertension, dyslipidemia, physical inactivity and FHS in these 3 regions.
Figure 1.
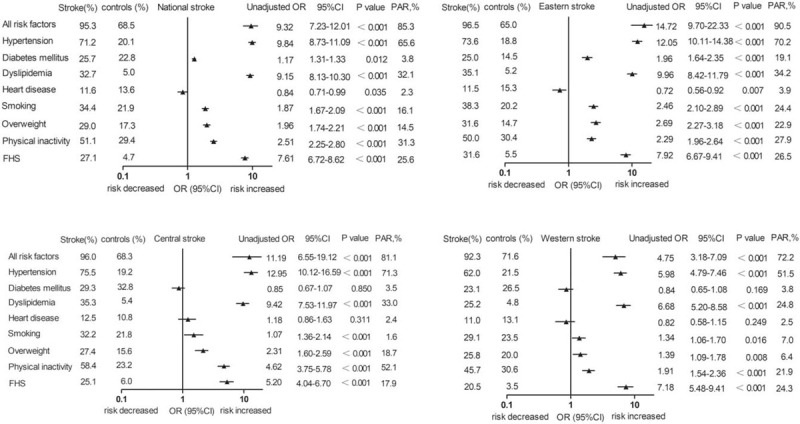
The PAR of individual stroke risk factor in different regions with univariate analysis.
Figure 2.
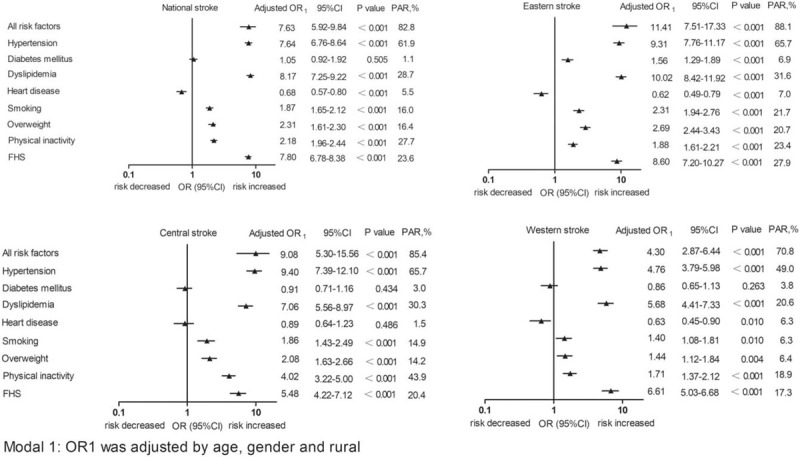
The PAR of individual stroke risk factor in different regions calculated by model 1.
Figure 3.
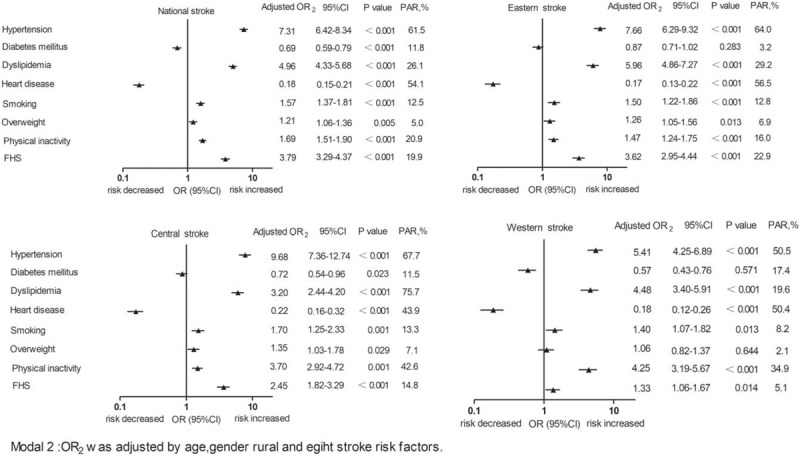
The PAR of individual stroke risk factor in different regions calculated by model 2.
3.4. Clustering of stroke risk factors in the 3 regions
The clustering of stroke risk factors varied by region (P <.001). The details are shown in Table 2. The proportions of participants with 0 risk factors were 34.4% vs 31.0% vs 28.2% in the eastern, central, and western regions, respectively. For patients with 1 risk factor, the proportions were 28.0% vs 27.9% vs 29.5%, respectively. For patients with 2 risk factors, the proportions were 17.4% vs 19.8% vs 19.9%, respectively. Among patients with 3 risk factors, the proportions were 9.2% vs 10.8% vs 10.8%, and for patients with ≥4 risk factors, the proportions were 10.3% vs 9.9% vs 11.0%, respectively
Table 2.
Comparation of 8 risk factors clustering in different regions.
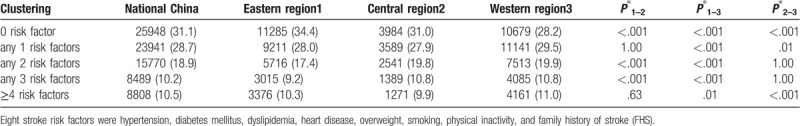
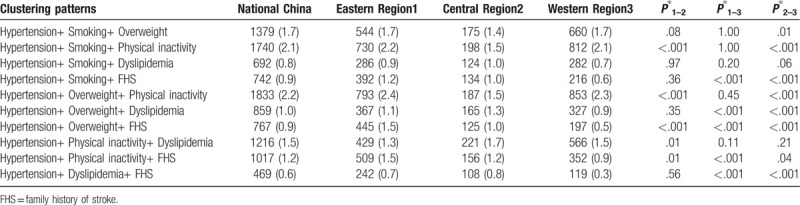
Table 3 shows 10 clustering patterns of the 6 most common and important stroke risk factors in the 3 regions based on hypertension. The results in Table 3 show that the combinations of hypertension and overweight or smoking were the most common patterns in the eastern region. Hypertension and dyslipidemia was the most prevalent pattern in the central region. In the western region, hypertension plus physical inactivity was the most common pattern, while hypertension and FHS was the least common clustering pattern.
Table 3.
Comparation of different clustering patterns of most common and important stroke risk factors in different regions.
4. Discussion
In our study, we found important regional variations in the relative importance of individual risk factors for stroke and different clustering patterns of stroke risk factors among 3 economic regions of China. Moreover, we observed different clustering patterns in different regions. These differences may explain the possible mechanisms underlying the geographical variation in stroke prevalence.
4.1. The regional variations in the PARs of individual risk factors for stroke
First, our study revealed that important regional variations existed in the relative importance of 8 risk factors for stroke. The highest PAR of stroke was in the eastern region, followed by the central region and the western region, with an increasing tendency associated with increasing socioeconomic status. This phenomenon suggested that differences in the economic situations of regions were possible factors contributing to regional variations in PAR.
The major factors affecting the risk of stroke can be divided into conventional cardiovascular factors and nonconventional cardiovascular factors. In addition to conventional risk factors,[10] socioeconomic status can affect stroke, as it impacts dietary habits, lifestyle,[13] education, living environment, early life influences, quality of healthcare provision, and other aspects.[8,22] Residents with good socioeconomic status generally have good living environments, medical access and access to healthy food. Therefore, socioeconomic status could reduce the impact of nonconventional factors on stroke, resulting in a relative increased PAR of conventional stroke factors. However, socioeconomic status can also affect the exposure rate,[9] knowledge of stroke[23] and ability to control conventional risk factors.[24] Previous reviews reported that the highest prevalence of conventional risk factors occurred in the lowest socioeconomic status groups.[9,24] A cross-sectional study showed that the high-income population had a relatively low proportion of insufficient knowledge of stroke.[23] Thus, from this perspective, the PAR should be decreased in regions with good socioeconomic status. In short, the effect of economic status on stroke risk is complicated, and the potential importance of risk factors in different regions may be related to socioeconomic status. Another possible reason is the clustering pattern variation among different regions.
Second, we found that the same individual risk factor accounted for different proportions of the PAR of stroke in different regions. We presumed that the variation in severity and inadequate treatment of each risk factor were the leading causes.[25] The risk of stroke was not only associated with exposure to hypertension but also with the hypertension duration, blood pressure level and related complications.[26,27] The coefficients of ethnicity,[12] lifestyle and living environment[11] in each region may lead to different PARs of individual stroke.
Overall, 8 risk factors were collectively associated with approximately 70% to 80% of the PAR of stroke in China. Traditional risk factors are still the leading cause of stroke in China. Risk factor control remains a challenge. With the development of China's economy, smoking,[28] overweight[29] and physical inactivity[30] have become the 3 risk factors with the most obvious growth trends. Screening and managing these factors are necessary strategies to prevent stroke in the future. In addition, stroke prevention measures should not only focus on the risk factors with a high exposure rate but also the management of important contributing risk factors for stroke.[31] Moreover, we should pay additional attention to the leading risk factor for stroke in each region.
4.2. Regional differences in clustering of risk factors
The clustering of risk factors was observed in every region of China, and the proportions of participants with 0, 1, 2, 3 or ≥4 risk factors were different in the 3 regions. Risk factor clustering can increase the risk of cerebrovascular diseases, and the mechanism may be due to aortic stiffness, which has been demonstrated as an independent predictor of cardiovascular disease, including stroke.[32] However, according to the results in Table 2, the differences in the proportions of clusters among different regions were small, although the differences between regions were statistically significant. It is difficult to say whether such small differences can lead to regional differences in stroke epidemiology.
We found that the distribution trends of stroke risk factors and the most relevant risk factors for stroke in each region were similar. Among the 3 regions, hypertension was the most important leading cause of stroke, followed by dyslipidemia, physical inactivity and FHS. Our results were consistent with a previous meta-analysis[31] and a prospective cohort study in Inner Mongolia, China. Within the clustering groups, people with elevated blood pressure had the largest carotid intima-media thickness.[33] Hypertension is the most important cardiovascular risk factor, which is the primary cause of stroke worldwide[7] and has great predictive value for stroke. The combination of hypertension with other risk factors may increase the risk of stroke. In addition, a previous study showed that the combination of 3 or more risk factors was significantly associated with an increased risk of stroke.[16,34] Therefore, we used hypertension to analyze the different clustering models with 3 risk factor combinations.
In our study, we observed that clustering patterns varied among different regions; these patterns could contribute to different stroke risks. We found that hypertension combined with dyslipidemia and other risk factors was the most common pattern in the central region, where the highest stroke prevalence occurred. Different clustering components in the relative risk of stroke incidence varied.[14] Peters’ study showed that people with elevated blood pressure and smoking had the highest risk of stroke among those with cardiovascular disease and 2 risk factors in Asia.[15] The effect of clustering patterns on stroke risk was critical to elucidate the geographical variation in stroke prevalence. However, we did not evaluate the predictive value of each clustering pattern. The differences in the proportions of risk factor clusters between regions were small, although they were statistically significant. Race, sex and education level in different regions were also associated with clustering patterns.[12,17] Whether regional differences in the risk factor clustering patterns are the cause of the geographic variation in stroke prevalence must be further explored. It is equally important to further explore the most dangerous clustering patterns to effectively identify those with the highest risk of stroke and to explain regional differences in stroke epidemiology.[17,20]
4.3. Limitations
Our study has some limitations. First, only 1 province from the northeast was combined with the eastern region; therefore, our results cannot fully reflect the situation in northeast China. Second, the diagnosis of diseases was mainly based on the self-reports of patients. The results of PAR need to be carefully interpreted and validated in rigorously designed studies. Third, in this study, the calculation of PAR was based on the prevalent stroke cases instead of current new cases. The alterable individual risk factors may change after stroke or with time, which may affect the value of PAR. However, the control groups in our study were from the same location and period, and they were exposed to the same changeable risk factors. Therefore, our PAR results likely represent the proportion of each risk factor in the overall risk in different regions. Fourth, we did not include heart diseases other than atrial fibrillation, such as coronary heart disease, heart failure or valvular heart disease, in our analysis, which may have underestimated the effect of heart disease on stroke risk. Finally, we did not analyze the duration and severity of each stroke risk factor, and these may be potential factors that contribute to stroke risk.
5. Conclusion
Our results suggested that the differences in the relative importance of stroke risk factors among different regions and the rates and patterns of stroke factor clustering may be potential contributors leading to regional differences in stroke epidemiology.
Acknowledgments
The authors appreciate IT professionals Xiaodong Niu and Juntao Duan for the data processing and statistical professors Cairong Zhu and Qiang Yao for statistical methods consultation. In addition, we would like to acknowledge all participants of the CSSPP.
Author contributions
SJ contributed to the conception of the study and wrote the first draft of the manuscript; JH revised the manuscript and polished the language; YB organized the database; and MM and YH performed the statistical analysis and data collection. LH conceived of and designed the study. All authors contributed to manuscript revision and read and approved the submitted version.
Supplementary Material
Supplementary Material
Footnotes
Abbreviations: CSSPP = Chinese stroke screening and prevention project, FHS = family history of stroke, PAR = population attributable risk.
How to cite this article: Dong S, Fang J, Li Y, Ma M, Hong Y, He L. The population attributable risk and clustering of stroke risk factors in different economical regions of China. Medicine. 2020;99:16(e19689).
SD and JF contributed equally to the manuscript as first authors.
The research was supported by the National Key R and D Program of China (2018YFC1311400 and 2018YFC1311401), the CSSPP (GN-2016F003) and the National Natural Science Foundation of China (NSFC-81772435).
All data generated or analyzed during this study are included in this published article and supplementary information files. The data that support the findings of this study are available from a third party “Stroke prevention and Treatment Engineering Committee of national health and Health Commission,” but restrictions apply to the availability of these data, which were used under license for the current study, and so are not publicly available. Data are available from the authors upon reasonable request and with permission of the third party.
The authors have no conflicts of interest to disclose.
Supplemental Digital Content is available for this article.
References
- [1].Roth GAAD, Abate KH, Abay SM, et al. Global, regional, and national age-sex-specific mortality for 282 causes of death in 195 countries and territories, 1980-2017: a systematic analysis for the global burden of disease study 2017. Lancet (London, England) 2018;392:1736–88. [DOI] [PMC free article] [PubMed] [Google Scholar]
- [2].Feigin VL, Forouzanfar MH, Krishnamurthi R, et al. Global and regional burden of stroke during 1990-2010: Findings from the global burden of disease study 2010. Lancet (London, England) 2014;383:245–54. [DOI] [PMC free article] [PubMed] [Google Scholar]
- [3].Wang W, Jiang B, Sun H, et al. Prevalence, incidence, and mortality of stroke in china: Results from a nationwide population-based survey of 480 687 adults. Circulation 2017;135:759–71. [DOI] [PubMed] [Google Scholar]
- [4].Feigin VLNG, Cercy K, Johnson CO, et al. Global, regional, and country-specific lifetime risks of stroke, 1990 and 2016. N Engl J Med 2018;379:2429–37. [DOI] [PMC free article] [PubMed] [Google Scholar]
- [5].Stevens W, Peneva D, Li JZ, et al. Estimating the future burden of cardiovascular disease and the value of lipid and blood pressure control therapies in china. BMC Health Serv Res 2016;16:175. [DOI] [PMC free article] [PubMed] [Google Scholar]
- [6].Ovbiagele B, Goldstein LB, Higashida RT, et al. Forecasting the future of stroke in the united states: a policy statement from the american heart association and american stroke association. Stroke 2013;44:2361–75. [DOI] [PubMed] [Google Scholar]
- [7].O’Donnell MJ, Chin SL, Rangarajan S, et al. Global and regional effects of potentially modifiable risk factors associated with acute stroke in 32 countries (interstroke): a case-control study. Lancet (London, England) 2016;388:761–75. [DOI] [PubMed] [Google Scholar]
- [8].Marshall IJ, Wang Y, Crichton S, et al. The effects of socioeconomic status on stroke risk and outcomes. Lancet Neurol 2015;14:1206–18. [DOI] [PubMed] [Google Scholar]
- [9].Addo J, Ayerbe L, Mohan KM, et al. Socioeconomic status and stroke: an updated review. Stroke 2012;43:1186–91. [DOI] [PubMed] [Google Scholar]
- [10].Engstrom G, Jerntorp I, Pessah-Rasmussen H, et al. Geographic distribution of stroke incidence within an urban population: relations to socioeconomic circumstances and prevalence of cardiovascular risk factors. Stroke 2001;32:1098–103. [DOI] [PubMed] [Google Scholar]
- [11].Merrill PD, Ampah SB, He K, et al. Association between trace elements in the environment and stroke risk: the reasons for geographic and racial differences in stroke (regards) study. J Trace Elem Med Biol 2017;42:45–9. [DOI] [PMC free article] [PubMed] [Google Scholar]
- [12].Wu J, Cheng X, Qiu L, et al. Prevalence and clustering of major cardiovascular risk factors in china: a recent cross-sectional survey. Medicine 2016;95:e2712. [DOI] [PMC free article] [PubMed] [Google Scholar]
- [13].Psaltopoulou T, Hatzis G, Papageorgiou N, et al. Socioeconomic status and risk factors for cardiovascular disease: impact of dietary mediators. Hellenic J Cardiol 2017;58:32–42. [DOI] [PubMed] [Google Scholar]
- [14].Yusuf HR, Giles WH, Croft JB, et al. Impact of multiple risk factor profiles on determining cardiovascular disease risk. Prev Med 1998;27:1–9. [DOI] [PubMed] [Google Scholar]
- [15].Peters SAE, Wang X, Lam TH, et al. Clustering of risk factors and the risk of incident cardiovascular disease in asian and caucasian populations: results from the asia pacific cohort studies collaboration. BMJ open 2018;8:e019335. [DOI] [PMC free article] [PubMed] [Google Scholar]
- [16].Zhou Y, Tian Y, Zhong C, et al. Clustering of cardiovascular risk factors and stroke: a prospective cohort study in inner mongolia. Neurol Res 2016;38:988–93. [DOI] [PubMed] [Google Scholar]
- [17].Wang X, Bots ML, Yang F, et al. A comparison of the prevalence and clustering of major cardiovascular risk factors in the netherlands and china. Eur J Prev Cardiol 2016;23:1766–73. [DOI] [PubMed] [Google Scholar]
- [18].Xia X, Yue W, Chao B, et al. Prevalence and risk factors of stroke in the elderly in northern china: data from the national stroke screening survey. J Neurol 2019;266:1449–58. [DOI] [PMC free article] [PubMed] [Google Scholar]
- [19].Society CD. Guidelines for the prevention and treatment of type 2 diabetes in china (2017). Chinese Journal of Practical Internal Medicine 2018;38:292–344. [Google Scholar]
- [20].Wang Y, Wang J, Cheng J, et al. Is the population detected by screening in china truly at high risk of stroke? J Stroke Cerebrovasc Dis 2018;27:2118–23. [DOI] [PubMed] [Google Scholar]
- [21].Bruzzi P, Green SB, Byar DP, et al. Estimating the population attributable risk for multiple risk factors using case-control data. Am J Epidemiol 1985;122:904–14. [DOI] [PubMed] [Google Scholar]
- [22].Slomka A, Switonska M, Sinkiewicz W, et al. Haemostatic factors do not account for worse outcomes from ischaemic stroke in patients with higher c-reactive protein concentrations. Ann Clin Biochem 2017;54:378–85. [DOI] [PubMed] [Google Scholar]
- [23].Ramirez-Moreno JM, Alonso-Gonzalez R, Peral Pacheco D, et al. Effect of socioeconomic level on knowledge of stroke in the general population: a social inequality gradient. Neurologia (Barcelona, Spain) 2016;31:24–32. [DOI] [PubMed] [Google Scholar]
- [24].Bowry AD, Lewey J, Dugani SB, et al. The burden of cardiovascular disease in low- and middle-income countries: epidemiology and management. Can J Cardiol 2015;31:1151–9. [DOI] [PubMed] [Google Scholar]
- [25].Han TS, Wang HH, Wei L, et al. Impacts of undetected and inadequately treated hypertension on incident stroke in china. BMJ open 2017;7:e016581. [DOI] [PMC free article] [PubMed] [Google Scholar]
- [26].Kim TH, Yang PS, Yu HT, et al. Effect of hypertension duration and blood pressure level on ischaemic stroke risk in atrial fibrillation: Nationwide data covering the entire korean population. Eur Heart J 2019;40:809–19. [DOI] [PubMed] [Google Scholar]
- [27].Satoh M, Ohkubo T, Asayama K, et al. Lifetime risk of stroke and coronary heart disease deaths according to blood pressure level: epoch-japan (evidence for cardiovascular prevention from observational cohorts in japan). Hypertension (Dallas, Tex : 1979) 2019;73:52–9. [DOI] [PubMed] [Google Scholar]
- [28].Wang M, Luo X, Xu S, et al. Trends in smoking prevalence and implication for chronic diseases in china: Serial national cross-sectional surveys from 2003 to 2013. Lancet Respir Med 2019;7:35–45. [DOI] [PubMed] [Google Scholar]
- [29].Mariachiara Di Cesare JB. Gretchen A Stevens Trends in adult body-mass index in 200 countries from 1975 to 2014: a pooled analysis of 1698 population-based measurement studies with 19.2 million participants. Lancet (London, England) 2016;387:1377–96. [DOI] [PMC free article] [PubMed] [Google Scholar]
- [30].Guthold R, Stevens GA, Riley LM, et al. Worldwide trends in insufficient physical activity from 2001 to 2016: a pooled analysis of 358 population-based surveys with 1.9 million participants. Lancet Glob Health 2018;6:e1077–86. [DOI] [PubMed] [Google Scholar]
- [31].Wang J, Wen X, Li W, et al. Risk factors for stroke in the chinese population: a systematic review and meta-analysis. J Stroke Cerebrovasc Dis 2017;26:509–17. [DOI] [PubMed] [Google Scholar]
- [32].Kubozono T, Ohishi M. Prognostic significance of regional arterial stiffness for stroke in hypertension. Pulse (Basel, Switzerland) 2015;3:98–105. [DOI] [PMC free article] [PubMed] [Google Scholar]
- [33].Wang X, Dalmeijer GW, den Ruijter HM, et al. Clustering of cardiovascular risk factors and carotid intima-media thickness: the use-imt study. PloS One 2017;12:e0173393. [DOI] [PMC free article] [PubMed] [Google Scholar]
- [34].Kaukua J, Turpeinen A, Uusitupa M, et al. Clustering of cardiovascular risk factors in type 2 diabetes mellitus: prognostic significance and tracking. Diabetes Obes Metab 2001;3:17–23. [DOI] [PubMed] [Google Scholar]
Associated Data
This section collects any data citations, data availability statements, or supplementary materials included in this article.