Supplemental Digital Content is available in the text
Keywords: breast neoplasms, estrogen receptor-positive breast cancer, magnetic resonance imaging, radiogenomics, recurrence prognosis
Abstract
To examine the correlation of qualitative and quantitative dynamic contrast-enhanced magnetic resonance imaging (DCE-MRI) results with 95-gene classifier or CurebestTM 95-gene classifier Breast (95GC) results for recurrence prediction in estrogen receptor-positive breast cancer (ERPBC).
This retrospective study included 78 ERPBC patients (age range, 24–74 years) classified into high- (n = 33) and low- (n = 45) risk groups for recurrence based on 95GC and who underwent DCE-MRI between July 2006 and November 2012. For qualitative evaluation, mass shape, margin, and internal enhancement based on BI-RADS MRI lexicon and multiplicity were determined by consensus interpretation by 2 breast radiologists. For quantitative evaluation, mass size, volume ratios of the DCE-MRI kinetics, and both the kurtosis and the skewness of the intensity histogram for the whole mass in the initial and delayed phases were determined. Differences between the 2 risk-groups were analyzed using univariate logistic regression analyses and multiple logistic regression analyses. Receiver-operating characteristic curve cut-off values were used to define the groups.
As for the qualitative findings, the difference between the 2 groups was not significant. For the quantitative data, the volume ratio of “medium” in the initial phase differed significantly between the 2 groups (P = .049). The volume ratio of “medium” (P = .006) and of “slow-persistent” (P = .005), and the delayed phase kurtosis (P = .012) in the univariate logistic regression analyses, and in the multiple logistic regression, volume ratio of “medium” >38.9% and delayed phase kurtosis >3.31 were identified as significant high-risk indicators (odds ratio, 5.83 and 3.55; 95% confidence interval, 1.58 to 21.42 and 1.24 to 10.15; P = .008 and P = .018, respectively).
A high volume ratio of “medium” in the initial phase and/or high kurtosis in the delayed phase for quantitative evaluation could predict high ERPBC recurrence risk based on 95GC.
1. Introduction
Estrogen receptor (ER) positive early-stage breast cancer patients can be treated with hormonal therapy alone after surgery, which would limit toxicity from unnecessary chemotherapy.[1,2] Recent breast cancer-related studies have shown that the results of a multi gene expression profiling assay are associated with the prognosis and response to chemotherapies of these cancers.[3–6] Some multi-gene classifiers (GCs), including Oncotype DX (ODX, Genomic Health, Redwood City, CA), yield a so-called recurrence score (RS), which has been shown to be prognostic in early-stage ER-positive/human epidermal growth factor receptor 2 negative invasive breast cancer. This assay is available in the clinical setting for prediction of recurrence after breast cancer surgery.[3,4]
Dynamic contrast-enhanced magnetic resonance imaging (DCE-MRI) has excellent sensitivity and moderate specificity for assessment of breast cancer and is widely used,[7–15] and some investigators have compared the DCE-MRI enhancement characteristics with the predicted breast cancer recurrence risk based on a multi-GC.[16–25] Saha et al conducted a study to evaluate imaging features from DCE-MRI in breast cancer patients to predict the distant recurrence risk using ODX scores, and found a moderate association between imaging features and ODX scores.[23]
For predicting recurrence of ER-positive and node-negative breast cancer, CurebestTM 95-GC or CurebestTM 95-GC Breast (95GC, Sysmex Corporation Co., Ltd, Kobe, Japan) was developed, using the Affymetrix DNA microarray on breast cancer specimens.[5] 95GC can divide ER-positive and node-negative breast cancer patients into low- and high- recurrence risk groups. It is speculated that the patients classified into the low- risk group with this classifier could safely avoid undergoing adjuvant chemotherapy,[5] and the high-risk patients show a higher sensitivity to chemotherapy and thus, are likely to benefit more from adjuvant chemotherapy.[5,25] It has reported that the pathological complete response rate after neoadjuvant chemotherapy (NAC) for high-risk patients divided by 95 GC was significantly higher than for low-risk patients.[26] 95GC may be advantageous over ODX because it permits physicians to determine appropriate adjuvant therapy for patients falling in the gray zone by ODX, that is, intermediate-risk patients, in a clinical setting.[27–29] To date, there have been no reports on the relationship between the data from DCE-MRI and recurrence risk prediction based on 95GC.
We hypothesized that DCE-MRI data might show an association with recurrence risk as defined by the 95GC results and that integration of DCE-MRI and genomic risk information would offer enhanced predictive power. To this end, we retrospectively examined the correlation of qualitative and quantitative DCE-MRI data with 95GC results for prognostic prediction in ER-positive breast cancer (ERPBC). Although it is different from the original target of 95GC, a more advanced cohort of NAC cases was used to better capture the mass characteristics extracted by MRI.
2. Materials and methods
2.1. Study population
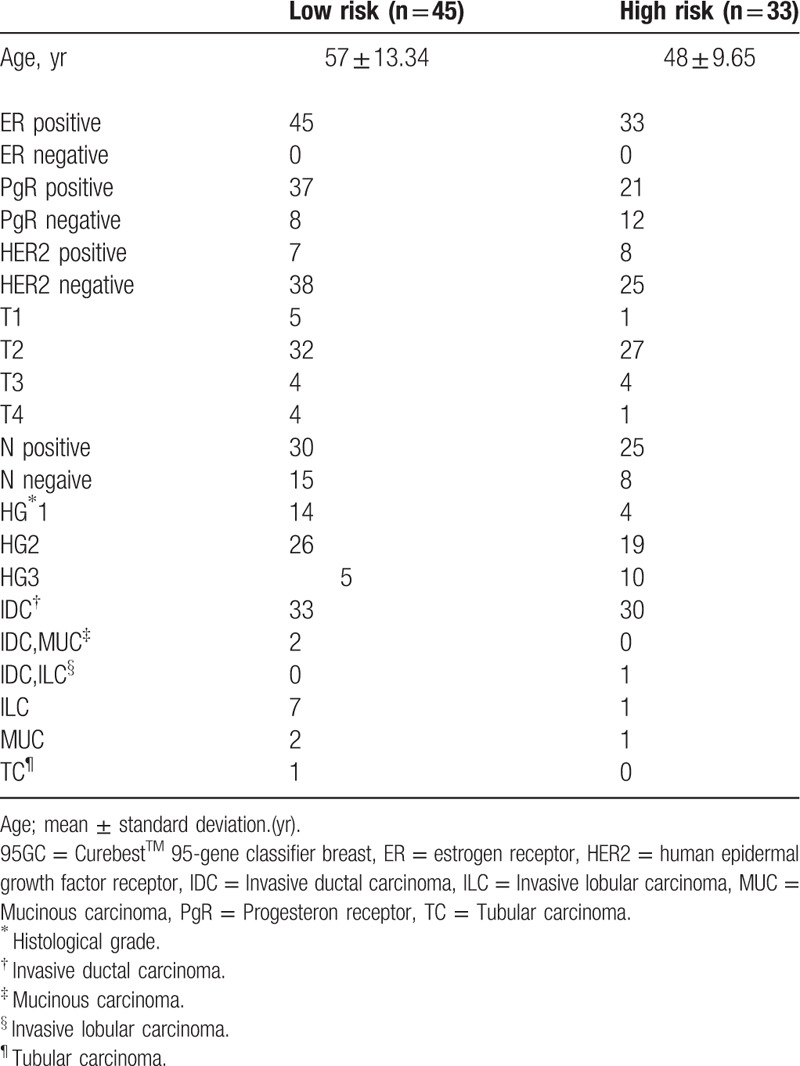
The study was approved by the institutional review board, and the requirement for obtaining informed consent was waived. For our analysis, we identified 124 consecutive female ERPBC patients who were divided into high- and low-recurrence risk as predicted by 95GC, and who underwent NAC. Among them, 81 patients underwent breast MRI examination, and 3 cases were excluded due to the absence of contrast-enhanced dynamic sequences. Thus, the final study data set included 78 patients (age range, 24–74 years), who were divided into high- and low-recurrence risk groups as predicted by 95GC and underwent DCE-MRI at our hospital between July 2006 and November 2012 (Fig. 1); they all underwent breast conserving surgery or mastectomy after NAC. Before NAC, the histopathological examination and gene expression analysis was conducted from biopsy specimens with a vacuum-assisted core-biopsy instrument (Mammotome 8G HH: Ethicon Endosurgery Inc., Cincinnati, OH) under ultrasonographic guidance. Tumor samples for histopathologic examination were fixed in 10% buffered formaldehyde, and tumor samples for gene expression analysis were snap frozen in liquid nitrogen and stored at -80°C until use. The histopathological diagnoses in our institutional database were confirmed as shown in Table 1.
Figure 1.
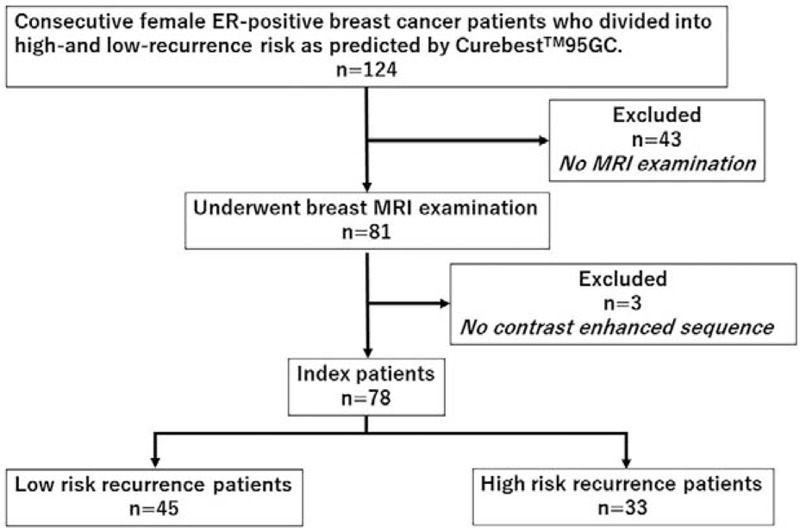
Schematic diagram illustrating patient selection. One hundred twenty-four consecutive female ERPBC patients who were divided into high- and low-recurrence risk groups as predicted by 95GC, recruited. Among them, 81 patients underwent breast MRI examination, and 3 cases were excluded due to the absence of contrast-enhanced dynamic sequences. Thus, the final study data set included 78 patients (45 low-risk and 33 high-risk patients). 95GC = CurebestTM 95-gene classifier breast; ERPBC = estrogen receptor-positive breast cancer, MRI = magnetic resonance imaging.
Table 1.
Distribution of cases in the database in each Curebest 95 GC risk group.
2.2. MR protocols
All images were acquired by using a 1.5-T unit (Signa EXCITE HD EchoSpeed Plus; GE Medical Systems, Milwaukee, WI) using a 4-channel breast-array coil. Dynamic sequences were performed, including 1 precontrast- and 4 postcontrast-enhanced volume imaging series at intervals of 94 s/phase. Thereafter, gadopentetate dimeglumine (Magnevist; Bayer, Osaka, Japan) was administered intravenously by means of power injection at a dose of 0.1 mmol per kg of body weight at a flow rate of 2 mL/s followed by 20 mL saline. K-space was the mean of the sequential view order (linear view order) scan time.
Dynamic images were acquired with the volume imaged breast assessment T1-weighted fat-saturated gradient-echo sequences were acquired using the following parameters for the sagittal bilateral protocol: repetition time, < 6.3 ms; TE, <3.1 ms. In-phase resolution ranged from 0.78 to 1.25 mm, with 0-mm spacing between sections (gapless); flip angle was 10°, with a 2-mm or smaller spatial resolution in the slice direction. Other parameters were: field of view, 20 to 22 cm; acquisition matrix, 256 × 160.
2.3. Qualitative evaluation
When the tumor was a single mass in the affected breast, it was determined as the indexed mass. When the tumors had a multifocal or multicentric mass distribution, the largest mass, histopathologically diagnosed as breast cancer and classified by 95GC, was determined as the indexed mass. The indexed masses were recognized consistently by 2 breast radiologists (YT and KM) with 16 and 14 years of experience, respectively. When the independent interpretations made by the radiologists based on BI-RADS MRI2nd[30] were not same, the findings were determined by consensus without knowledge of any clinical, pathological, and genetic information.
2.4. Quantitative evaluation
The maximal length of the index mass was measured by using the ruler in the size measurement tool of SYNAPSE (FUJIFILM Medical Co, Ltd., Tokyo, Japan) independently by the 2 breast radiologists without knowledge of any clinical, pathological, and genetic information, and the average was used in the analysis.
The volume of the index mass was extracted manually by a breast radiologist (YT) without knowledge of any clinical, pathological, and genetic information, using SYNAPSE VINCENT version 4.4 (FUJIFILM Medical Co, Ltd.), a commercially available 3D imaging diagnosis workstation, followed by volume measurement of the indexed mass and calculation of the skewness and kurtosis of the 3D volume mass intensity histogram in both initial and delayed phases, which were performed automatically following the method reported by Sutton et al.[31]
Kinetic curve assessment was conducted using DynaCAD, version 2.1.8 (Invivo, Pewaukee, WI), a commercially available computer-aided evaluation system, which allows automatic analysis of 3-phase series into kinetic data. The volume ratio of each combination of the initial phase (slow, medium, and fast) and the delayed phase (persistent, plateau, and washout) was automatically calculated after segmenting the index tumor in 3D voxels by a breast radiologist (YT) based on the specifications of DynaCAD for quantitative analysis.
2.5. Recurrence risk groups with multigene assays
95GC was developed and is commercially available in Japan and Korea. It is specified in the Japanese Breast Cancer Medical Care Guideline 2015[32] and involves the expression of 95 genes of the primary tumors. It can be used to distinguish 2 breast cancer recurrence risk groups: low-risk and high-risk groups. RNA was extracted from the biopsy samples and was subjected to gene expression analysis using a DNA microarray. Gene analysis was conducted to divide the biopsy samples to high- and low- recurrence risk groups, as has been reported previously.[5]
2.6. Statistical analysis
Differences in the quantitative DCE-MRI data between the high- and low-risk groups of 95GC were analyzed using the Mann-Whitney test. For each quantitative parameter, the cutoff value that yielded the maximum difference between the high- and low-risk groups of 95GC was determined using the Youden index of receiver operating characteristic method. The value of qualitative and quantitative parameters for examining associations with risk was analyzed using univariate logistic regression analyses (ULR). Parameters showing significance in the ULR were included in the multiple logistic regression (MLR) analysis. These analyses were conducted using MedCalc (Med Calc statistical software, ver. 16, Mariakerke, Belgium). A P value of .05 was used as the significance level.
3. Results
3.1. Difference in qualitative parameters between the high-risk and low-risk groups
The qualitative parameters such as mass shape, margin, and internal enhancement based on BI-RADS MRI2nd were not significant between the high-risk and low-risk groups (P = .98, .98, and .37, respectively).
3.2. Difference in mass size between the high-risk and low-risk groups
The maximal length of the mass (mean ± SD: high-risk group, 33 mm ± 10.9: low-risk group, 31 mm ± 13.2) was not significantly different between the high-risk and low-risk groups (P = 0.224).
3.3. Difference in kinetic volume ratio between the high-risk and low-risk groups
There were significant differences in the volume ratio of “medium” in the initial phase between the high- and low-risk groups (P = .049) (Table 2). ULR analysis revealed that a high “medium” volume ratio in the initial phase was associated with the high-risk group (P = .005; odds ratio, 5.85; 95% confidence interval, 1.68–20.40) and the volume ratio of “slow-persistent” was associated with the low-risk group (P = .041; odds ratio, 4.06; 95% confidence interval, 1.05–15.68). MLR analysis revealed that the “medium” volume ratio >38.9% was a significant indicator of high-recurrence risk based on 95GC (P = .008; odds ratio, 5.82; 95% confidence interval, 1.58–21.42) (Table 3) (Figs. 2 and 3). The other volume ratios were not significant.
Table 2.
Difference in kinetic volume ratio between high-risk group and low-risk group.
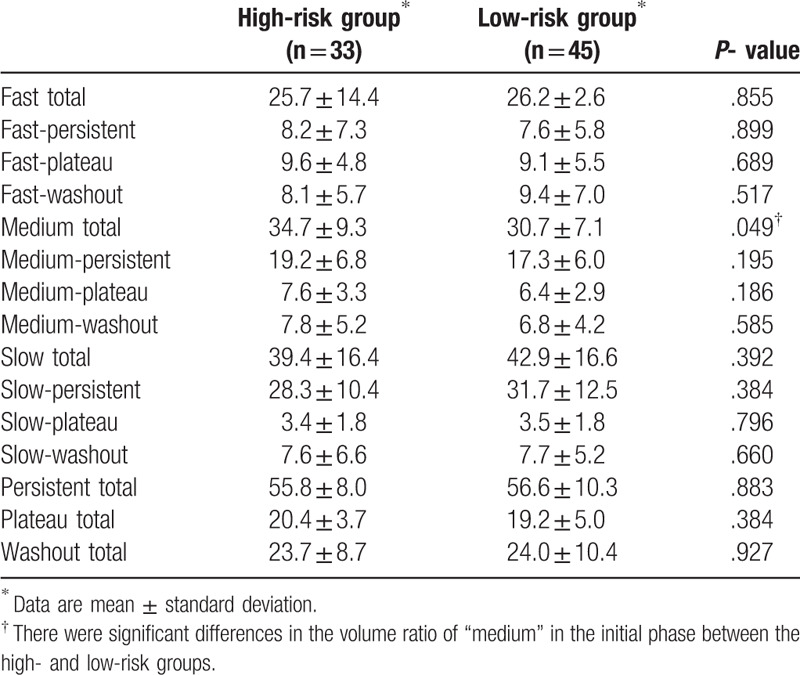
Table 3.
Difference of logistic regression analysis in kinetic volume ratio between high risk group and low risk group.
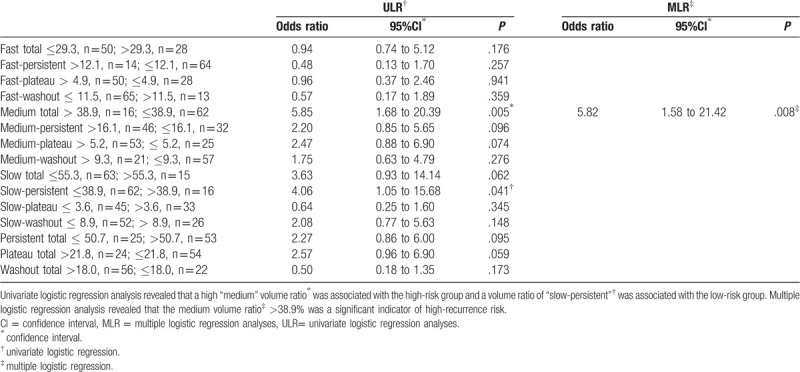
Figure 2.
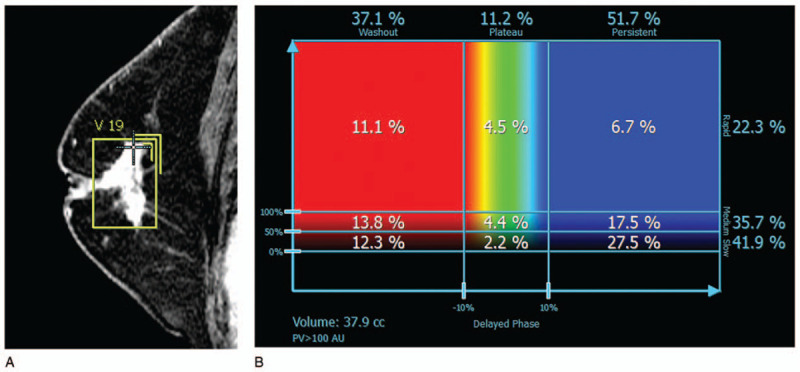
A case in the low-risk group of recurrence as predicted by 95GC. (A) Sagittal magnetic resonance image shows an irregularly shaped and spiculated mass on dynamic contrast-enhanced magnetic resonance imaging and the 3D voxel extracted manually. Kurtosis in the delayed phase was 2.602 (< cut off value, 3.312). (B) DynaCAD shows that the “medium” rate to the whole tumor was 35.7% (< cut-off value, 38.9%). 95GC = CurebestTM 95-gene classifier breast.
Figure 3.
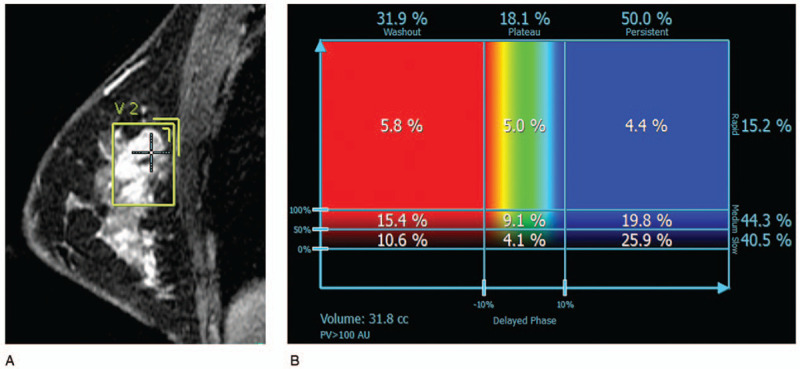
A case in the high-risk group for recurrence as predicted by 95GC. (A) Sagittal magnetic resonance image shows a round mass with irregular margins on dynamic contrast-enhanced magnetic resonance imaging and the voxel extracted manually. Kurtosis in the delayed phase was 3.345 (> cut-off value, 3.312). (B) DynaCAD shows that the “medium” rate to the whole tumor was 44.3% (> cut-off value, 38.9%). 95GC = CurebestTM 95-gene classifier breast.
3.4. Difference in skewness and kurtosis between the high-risk and low-risk groups
Kurtosis in the delayed phase was found to be a significant indicator of high recurrence risk (P = .0116; odds ratio, 3.5714; 95% confidence interval, 1.33–9.60) in the ULR analysis. MLR analysis revealed that a kurtosis value >3.31 in the delayed phase was a significant indicator of the high recurrence risk based on 95GC (P = .018; odds ratio, 3.55; 95% confidence interval, 1.24–10.15) (Table 4) (Figs. 2 and 3).
Table 4.
Difference in skewness and kurtosis between high-risk and low-risk groups.

4. Discussion
In the present study, we investigated the correlation of qualitative and quantitative DCE-MRI data with a low or high risk of recurrence of ERPBC as determined by 95GC. Multivariate analysis revealed that a “medium” volume ratio >38.9% was a significant indicator of high risk of recurrence based on 95GC (P = .008; OR5.82; 95%CI1.58–21.42) and that a kurtosis value >3.31 in the delayed phase was a significant indicator of high risk of recurrence based 95GC (P = .018; OR3.55; 95%CI 1.24–10.15) despite no significant between-group difference in the qualitative data.
There have been several correlational studies of breast imaging and molecular subtypes, risk factors for a worse prognosis, prediction of the pathologic complete response after NAC, and treatment outcome.[33–39] Correlation of the radiogenomics of breast cancer, that is, radiomics research with genomic information, with ODX might be a representative topic. Several research groups have identified MRI features that might be associated with ODX RS.[21–24,37] However, even if there is a correlation with imaging, decision-making regarding the treatment plan may still not be possible because there is an intermediate risk in ODX. However, 95GC can divide patients with ER-positive and node-negative breast cancer into groups at low and high risk of recurrence, so may have an advantage over ODX in that it allows physicians to determine appropriate adjuvant therapy for patients who fall in the gray zone by ODX, that is, patients at intermediate risk, in a clinical setting.[27–29] If MRI features can predict the results of 95GC, the decision as to whether or not chemotherapy should be used is more straightforward because patients can be categorized according to risk of recurrence. The accuracy of 95GC was reported by Naoi et al.[5,25,26] In their study, they divided 459 patients with ER-positive and node-negative breast cancer who were treated with adjuvant hormonal therapy into a high-risk group (n = 174) and a low-risk group(n = 285) and found that the recurrence-free survival rate was significantly better in the low-risk group than in the high-risk group (P = 5.5e-10).[25]
First, we found a significant correlation in the volume ratio of “medium” in the initial phase of the whole mass between the 2 groups. Based on BI-RADS MRI 2ndedition, all masses in this study were divided to “washout” kinetics; 97% (76/78) of masses showed a “fast-washout” kinetics. Several researchers have studied the relationships between DCE-MRI features including kinetic curve, enhancement texture, and enhancement variances. Li et al[20] investigated the relationships between computer-extracted breast MRI phenotypes and the results of clinically available multigene assays for predicting the breast cancer recurrence risk. They found that high risk of recurrence according to the ODX correlated with the size, kinetic maximum enhancement, and enhancement texture of tumors, and reported that maximum contrast enhancement correlated with a high risk of recurrence according to the ODX. Ashraf et al[40] also analyzed curve-based kinetic features to investigate their association and showed their correlation with ODX. In this study, we used the volume ratio of kinetic assessment and tumor 3D volumetric histogram as quantitative data, and found that the “medium” volume ratio of the whole mass in the initial phase was an important factor in dividing patients into high-risk and low-risk groups for the prediction of recurrence of ERPBC based on the results of 95GC, rather than the presence of “washout” or “fast-washout” pattern in the mass. A high “medium” volume ratio in the whole mass in the initial phase correlated with high recurrence risk prediction. Similar to our study that investigated the volume ratio of signal enhancement, Saha et al. identified features that best predicted the RS (high versus intermediate and low RS) as follows: signal enhancement ratio-based washout tumor volume, mean and variance of the wash-in slope of tumor voxels, the proportion of maximally enhanced tumor voxels, and that enhanced at a particular intensity level.[23] The volume ratio of enhanced tumor voxels was an MRI feature that could be of value for predicting the recurrence risk determined by multigene assays. Our results showed that the value for predicting the recurrence risk determined by the multigene assay could not correlated with only vascularity in the maximally enhanced area of the mass.
Second, in the present study, there was a significant difference in kurtosis of the whole tumor 3D volumetric histogram in the delayed phase between the 2 groups. High kurtosis in the delayed phase significantly correlated with the high-risk group as defined by 95GC. In the delayed phase, masses could show varying intensity, including both decreasing intensity due to voxels with a “washout” kinetics and increasing intensity due to voxels with a “persistent” or “plateau” kinetics. The higher kurtosis in the delayed phase could indicate that tumors include more voxels of similar intensities around the average value within the mass in the delayed phase, and tumors from the high-risk group are more likely to include such voxels than those from the low-risk group. Similarly, Sutton et al[31] investigated the correlations of computer-extracted DCE MRI morphologic, histogram-based, first-order texture features with the ODX RS. Their results showed that kurtosis in the first and third postcontrast images significantly correlated with the ODX RS. Li et al[20] also found that tumors with a high risk of recurrence, based on ODX results, correlated with the enhancement texture, according to the maximum enhancing voxels within a lesion. Mazurowski et al[41] investigated the association of distant recurrence-free survival with MRI characteristics in breast cancer, and found the strongest associations with distant recurrence-free survival were signal enhancement ratio partial tumor volume, kurtosis of the signal enhancement ratio map within tumor and the other quantitative data. Assessment of heterogeneity, including skewness and kurtosis, may be important for deciding treatment options for breast cancer patients and for predicting recurrence prognosis. However, this should be verified in further studies with larger sample sizes.
Radiogenomic studies using a high number of features and a machine learning approach have recently been reported.[23,24] Our results are similar to those of Nam et al, who revealed that quantitative parameters using intratumoral texture analysis were significant between a low-risk group and non-low risk group; they built prediction models for both ODX RS and clinicopathologic factors that achieved an area under the curve of 0.9, although there were no significant differences in qualitative parameters based on the second edition of the BI-RADS between the 2 groups.[24] Recently, RS of 95GC that correlated well with recurrence rate was developed, and it was made available for formalin-fixed paraffin-embedded tissue, besides fresh-frozen tissue. That would make 95GC enhance clinical use.[6] This study provides preliminary results for the correlation of DCE-MRI with 95GC for prediction of recurrence in patients with ERPBC. We are now planning a study in a larger sample of patients with ER-positive and node-negative breast cancer that includes a validation set and patient outcomes. In the future, it is expected that a diagnostic algorithm that predicts recurrence prognosis using a combination of a multigene classifier, clinicopathological data, and MRI, with texture analysis and using artificial intelligence will be developed.
This study had some limitations. First, only a small number of cases were included in this retrospective study. Second, there was bias in patient selection among ERPBC patients. Because our objective was to discover a qualitative and a quantitative mass characteristics extracted by MRI, more advanced cohort of NAC cases were used. 95GC is a commercially available multigene classifier model for recurrence prognosis prediction of ER-positive and node-negative breast cancer patients with high accuracy. On the other hand, it has been demonstrated that high-risk patients for recurrence based on 95GC show a higher sensitivity to chemotherapy for ERPBC, including node-positive patients treated by NAC.[25] Third, an investigation of the correlation with patient outcome was not conducted with this data set according to risk-stratification by 95GC because all patients in this study had undergone NAC for advanced cancer, although the recurrence prognosis correlation to stratification by 95GC has been confirmed in a previous study.[25–26] Fourth, no validation set was evaluated because of the small number of cases.
In conclusion, a high volume ratio of “medium” in the initial phase and/or high kurtosis in the delayed phase for quantitative evaluation could predict high ERPBC recurrence risk based on 95GC.
Figure S1.
Author contributions
Conception: Yukiko Tokuda.
Data acquisition: Yasuto Naoi, Masahiro Yanagawa, Yukiko Tokuda.
Interpretation: Kaori Minamitani, Yukiko Tokuda.
Analysis: Masahiro Yanagawa, Yukiko Tokuda.
Drafting the work: Yukiko Tokuda.
Revising: Masahiro Yanagawa, Kaori Minamitani, Yasuto Naoi, Shinzaburo Noguchi, Noriyuki Tomiyama.
Supervision: Noriyuki Tomiyama, Shinzaburo Noguchi.
Yukiko Tokuda orcid: 0000-0001-7520-3310.
Supplementary Material
Footnotes
Abbreviations: 95GC = 95-gene classifier or CurebestTM 95-gene classifier breast, DCE-MRI = dynamic contrast-enhanced magnetic resonance imaging, ER = estrogen receptor, ERPBC = estrogen receptor-positive breast cancer, GC = gene classifier, MLR = multiple logistic regression analyses, NAC = neoadjuvant chemotherapy, ODX = Oncotype DX, RS = recurrence score, ULR = univariate logistic regression analyses.
How to cite this article: Tokuda Y, Yanagawa M, Minamitani K, Naoi Y, Noguchi S, Tomiyama N. Radiogenomics of magnetic resonance imaging and a new multi-gene classifier for predicting recurrence prognosis in estrogen receptor-positive breast cancer: a preliminary study. Medicine. 2020;99:16(e19664).
All data generated or analyzed during this study are included in this published article [and its supplementary information files].
SN has been an advisor for AstraZeneca, Novartis, and Taiho; received research funding for other studies from Sysmex, AstraZeneca, Novartis, Chugai, DS, Takeda, Pfizer, Ono, Taiho, Eisai, and Nippon Kayaku and honoraria from AstraZeneca, Novartis, Chugai, Takeda, and Nippon Kayaku; and holds the joint patent on CurebestTM 95GC with Sysmex. YN has received research funding for other studies from Sysmex and AstraZeneca and holds the joint patent on CurebestTM 95GC with Sysmex.
This research did not receive any specific grant from funding agencies in the public, commercial, or not-for-profit sectors.
The authors have no conflicts of interest to disclose.
Supplemental Digital Content is available for this article.
References
- [1].Sparano JA, Paik S. Development of the 21-gene assay and its application in clinical practice and clinical trials. J Clin Oncol 2008;26:721–8. [DOI] [PubMed] [Google Scholar]
- [2].Basavanhally A, Feldman M, Shih N, et al. Multi-field-of-view strategy for image-based outcome prediction of multi-parametric estrogen receptor-positive breast cancer histopathology: comparison to Oncotype DX. J Pathol Inform 2011;2:S1. [DOI] [PMC free article] [PubMed] [Google Scholar]
- [3].Paik S, Shak S, Tang G, et al. A multigene assay to predict recurrence of tamoxifen-treated, node-negative breast cancer. N Engl J Med 2004;351:2817–26. [DOI] [PubMed] [Google Scholar]
- [4].Paik S, Tang G, Shak S, et al. Gene expression and benefit of chemotherapy in women with node-negative, estrogen receptor-positive breast cancer. J Clin Oncol 2006;24:3726–34. [DOI] [PubMed] [Google Scholar]
- [5].Naoi Y, Kishi K, Tanei T, et al. Development of 95-gene classifier as a powerful predictor of recurrences in node negative and ER-positive breast cancer patients. Breast Cancer Res Treat 2011;128:633–41. [DOI] [PubMed] [Google Scholar]
- [6].Naoi Y, Saito Y, Kishi K, et al. Development of recurrence risk score using 95-gene classifier and its application to formalin-fixed paraffin-embedded tissues in ER-positive, HER2-negative and node-negative breast cancer. Oncol Rep 2019;42:2680–5. [DOI] [PubMed] [Google Scholar]
- [7].Orel SG, Schnail MD. MR imaging of the breast for the detection, diagnosis, and staging of breast cancer. Radiology 2001;220:13–30. [DOI] [PubMed] [Google Scholar]
- [8].Orel SG, Schnall MD, LiVolsi VA, et al. Suspicious breast lesions: MR imaging with radiologic-pathologic correlation. Radiology 1994;190:485–93. [DOI] [PubMed] [Google Scholar]
- [9].Davis PL, McCarty KS., Jr Sensitivity of enhanced MRI for the detection of breast cancer: new, multicentric, residual, and recurrent. Eur Radiol 1997;7:S289–98. [DOI] [PubMed] [Google Scholar]
- [10].Sardanelli F, Rescinito G, Giordano GD, et al. MR dynamic enhancement of breast lesions: high temporal resolution during the first-minute versus eight-minute study. J Comput Assist Tomogr 2000;24:724–31. [DOI] [PubMed] [Google Scholar]
- [11].Kuhl CK, Mielcarek P, Klaschik S, et al. Dynamic breast MR imaging: are signal time course data useful for differential diagnosis of enhancing lesions in dynamic breast MR imaging? Radiology 1999;211:101–10. [DOI] [PubMed] [Google Scholar]
- [12].Peters NH, Borel Rinkes IH, Zuithoff NP, et al. Meta-analysis of MR imaging in the diagnosis of breast lesions. Radiology 2008;246:116–24. [DOI] [PubMed] [Google Scholar]
- [13].Raikhlin A, Curpen B, Warner E, et al. Breast MRI as an adjunct to mammography for breast cancer screening in high-risk patients: retrospective review. AJR Am J Roentgenol 2015;204:889–97. [DOI] [PubMed] [Google Scholar]
- [14].Scheel JR, Kim E, Partridge SC, et al. MRI, Clinical examination, and mammography for preoperative assessment of residual disease and pathologic complete response after neoadjuvant chemotherapy for breast cancer: ACRIN 6657 Trial. AJR Am J Roentgenol 2018;210:1376–85. [DOI] [PMC free article] [PubMed] [Google Scholar]
- [15].Ashraf AB, Daye D, Gavenonis S, et al. Identification of intrinsic imaging phenotypes for breast cancer tumors: preliminary associations with gene expression profiles. Radiology 2014;272:374–84. [DOI] [PMC free article] [PubMed] [Google Scholar]
- [16].Nielsen TO, Parker JS, Leung S, et al. A comparison of PAM50 intrinsic subtyping with immunohistochemistry and clinical prognostic factors in tamoxifen-treated estrogen receptor-positive breast cancer. Clin Cancer Res 2010;16:5222–32. [DOI] [PMC free article] [PubMed] [Google Scholar]
- [17].Nie K, Chen JH, Yu HJ, et al. Quantitative analysis of lesion morphology and texture features for diagnostic prediction in breast MRI. Acad Radiol 2008;15:1513–25. [DOI] [PMC free article] [PubMed] [Google Scholar]
- [18].Wan T, Bloch BN, Plecha D, et al. A radio-genomics approach for identifying high risk estrogen receptor-positive breast cancers on DCE-MRI: preliminary results in predicting Oncotype DX risk scores. Sci Rep 2016;18:21394. [DOI] [PMC free article] [PubMed] [Google Scholar]
- [19].Yamamoto S, Maki DD, Korn RL, et al. Radiogenomic analysis of breast cancer using MRI: a preliminary study to define the landscape. AJR Am J Roentgenol 2012;199:654–63. [DOI] [PubMed] [Google Scholar]
- [20].Li H, Zhu Y, Burnside ES, et al. MR Imaging radiomics signatures for predicting the risk of breast cancer recurrence as given by research versions of MammaPrint, Oncotype DX, and PAM50 Gene Assays. Radiology 2016;281:382–91. [DOI] [PMC free article] [PubMed] [Google Scholar]
- [21].Woodard GA, Ray KM, Joe BN, et al. Qualitative radiogenomics: association between Oncotype DX test recurrence score and BI-RADS mammographic and breast MR imaging features. Radiology 2018;286:60–70. [DOI] [PubMed] [Google Scholar]
- [22].Dialani V, Gaur S, Mehta TS, et al. Prediction of low versus high recurrence scores in estrogen receptor-positive, lymph node-negative invasive breast cancer on the basis of radiologic-pathologic features: comparison with Oncotype DX test recurrence scores. Radiology 2016;280:370–8. [DOI] [PubMed] [Google Scholar]
- [23].Saha A, Harowicz MR, Wang W, et al. A study of association of Oncotype DX recurrence score with DCE-MRI characteristics using multivariate machine learning models. J Cancer Res Clin Oncol 2018;144:799–807. [DOI] [PMC free article] [PubMed] [Google Scholar]
- [24].Nam KJ, Park H, Ko ES, et al. Radiomics signature on 3T dynamic contrast-enhanced magnetic resonance imaging for estrogen receptor-positive invasive breast cancers: preliminary results for correlation with Oncotype DX recurrence scores. Medicine (Baltimore) 2019;98:e15871. [DOI] [PMC free article] [PubMed] [Google Scholar]
- [25].Naoi Y, Kishi K, Tsunashima R, et al. Comparison of efficacy of 95-gene and 21-gene classifier (Oncotype DX) for prediction of recurrence in ER-positive and nodenegative breast cancer patients. Breast Cancer Res Treat 2013;140:299–306. [DOI] [PubMed] [Google Scholar]
- [26].Tsunashima R, Naoi Y, Kishi K, et al. Estrogen receptor positive breast cancer identified by 95-gene classifier as at high risk for relapse shows better response to neoadjuvant chemotherapy. Cancer Lett 2012;324:42–7. [DOI] [PubMed] [Google Scholar]
- [27].Sparano JA. TAILORx: trial assigning individualized options for treatment (Rx). Clin Breast Cancer 2006;7:347–50. [DOI] [PubMed] [Google Scholar]
- [28].Ingoldsby H, Webber M, Wall D, et al. Prediction of Oncotype DX and TAILORx risk categories using histopathological and immunohistochemical markers by classification and regression tree (CART) analysis. Breast 2013;22:879–86. [DOI] [PubMed] [Google Scholar]
- [29].Stemmer SM, Steiner M, Rizel S, et al. Clinical outcomes in patients with node-negative breast cancer treated based on the recurrence score results: evidence from a large prospectively designed registry. NPJ Breast Cancer 2017;3:33. [DOI] [PMC free article] [PubMed] [Google Scholar]
- [30].D’Orsi C, Sickles EA, Mendelson EB, et al. Breast imaging reporting and data system, ACR BI-RADS breast imaging atlas. fifth ed. 2013;Virginia, PA: American College of Radiology, 124–76. [Google Scholar]
- [31].Sutton EJ, Oh JH, Dashevsky BZ, et al. Breast cancer subtype intertumor heterogeneity: MRI-based features predict results of a genomic assay. J Magn Reson Imaging 2015;42:1398–406. [DOI] [PMC free article] [PubMed] [Google Scholar]
- [32].Aihara T, Yoyama T, Takahashi M, et al. The Japanese Breast Cancer Society Clinical Practice Guideline for systemic treatment of breast cancer, 2015 edition. Breast cancer 2016;23:329–42. [DOI] [PubMed] [Google Scholar]
- [33].Holli-Helenius K, Salminen A, Rinta-Kiikka I, et al. MRI texture analysis in differentiating luminal A and luminal B breast cancer molecular subtypes – a feasibility study. BMC Med Imaging 2017;17:69. [DOI] [PMC free article] [PubMed] [Google Scholar]
- [34].Flanagan FL, Dehdashti F, Siegel BA. PET in breast cancer. Semin Nucl Med 1998;28:290–302. [DOI] [PubMed] [Google Scholar]
- [35].Fan M, Cheng H, Zhang P, et al. DCE-MRI texture analysis with tumor subregion partitioning for predicting Ki-67 status of estrogen receptor-positive breast cancers. J Mag Reason Imaging 2018;48:237–47. [DOI] [PubMed] [Google Scholar]
- [36].Shin GW, Zhang Y, Kim MJ, et al. Role of dynamic contrast-enhanced MRI in evaluating the association between contralateral parenchymal enhancement and survival outcome in ER-positive, HER2-negative, node-negative invasive breast cancer. J Magn Reason Imaging 2018;48:1678–89. [DOI] [PMC free article] [PubMed] [Google Scholar]
- [37].Wu J, Cao G, Sun X, et al. Intratumoral spatial heterogeneity at perfusion MR imaging predicts recurrence-free survival in locally advanced breast cancer treated with neoadjuvant chemotherapy. Radiology 2018;288:26–35. [DOI] [PMC free article] [PubMed] [Google Scholar]
- [38].Sener SF, Sagent RE, Lee C, et al. MRI does not predict pathologic complete response after neoadjuvant chemotherapy for breast cancer. J Surg Oncol 2019;120:903–10. [DOI] [PMC free article] [PubMed] [Google Scholar]
- [39].Saha A, Harowicz MR, Grimm LJ, et al. A machine learning approach to radiogenomics of breast cancer: a study of 922 subjects and 529 DCE-MRI features. Br J Cancer 2018;119:508–16. [DOI] [PMC free article] [PubMed] [Google Scholar]
- [40].Ashraf AB, Dave D, Gavenonis S, et al. Identification of intrinsic imaging phenotypes for breast cancer tumors: Preliminary associations with gene expression profiles. Radiology 2014;272:374–84. [DOI] [PMC free article] [PubMed] [Google Scholar]
- [41].Mazurowski MA, Saha A, Harowicz MR, et al. Association of distant recurrence-free survival with algorithmically extracted MRI characteristics in breast cancer. K Magn Reson Imaging 2019;49:e231–40. [DOI] [PMC free article] [PubMed] [Google Scholar]
Associated Data
This section collects any data citations, data availability statements, or supplementary materials included in this article.


