Abstract
Anthracyclines are a highly effective component of curative breast cancer chemotherapy, but are associated with significant morbidity1,2. Since anthracyclines work in part via inhibition of topoisomerase-II (TOP2) on accessible DNA3,4, we hypothesized that chromatin regulatory genes (CRGs) that mediate DNA accessibility might predict anthracycline response. We elucidate the role of CRGs in anthracycline sensitivity in breast cancer through integrative analysis of patient and cell line data. We identify a consensus set of 38 CRGs associated with anthracycline response across ten cell line datasets. Evaluating the interaction between expression and treatment in predicting survival in a metacohort of 1006 early-stage breast cancer patients, we identify 54 CRGs whose expression levels dictate anthracycline benefit across the clinical subgroups, 12 of which overlapped with those identified in vitro. CRGs that promote DNA accessibility, including Trithorax complex members, were associated with anthracycline sensitivity when highly expressed, whereas CRGs that reduce accessibility such as Polycomb complex proteins, were associated with decreased anthracycline sensitivity. We show that KDM4B modulates TOP2 accessibility to chromatin, elucidating a mechanism of TOP2 inhibitor sensitivity. These findings indicate that CRGs mediate anthracycline benefit by modulating DNA accessibility with implications for breast cancer patient stratification and treatment decision making.
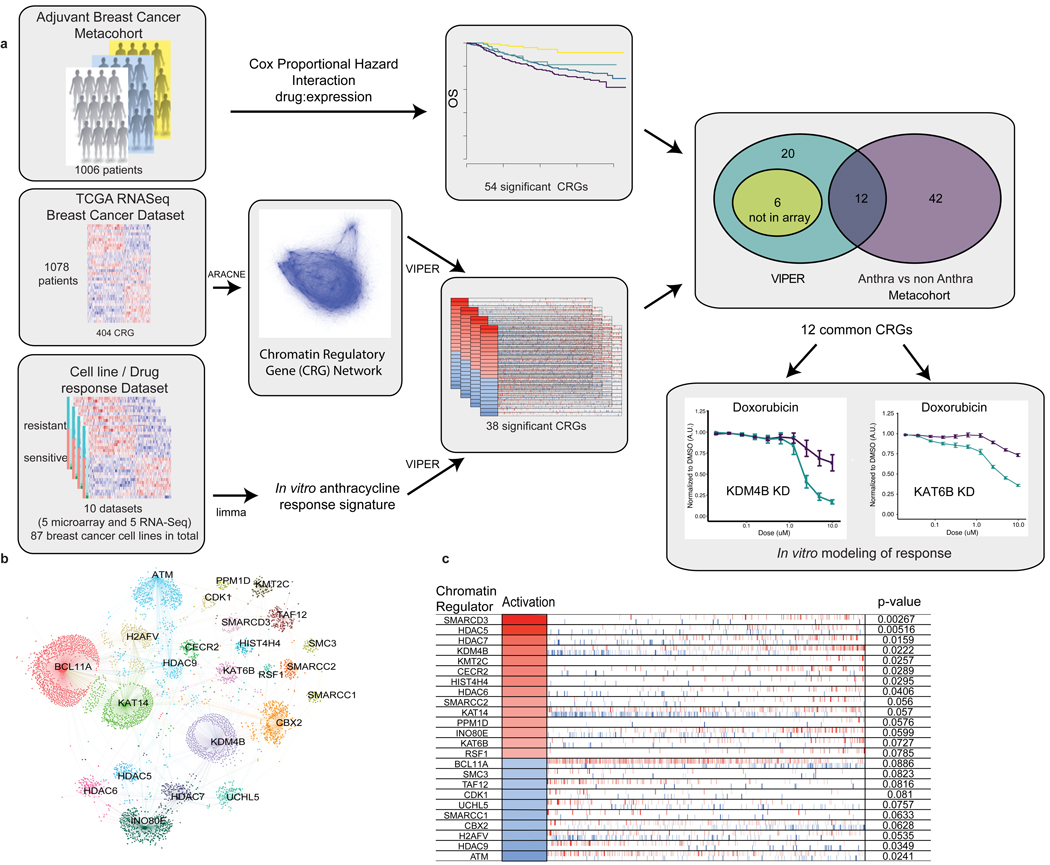
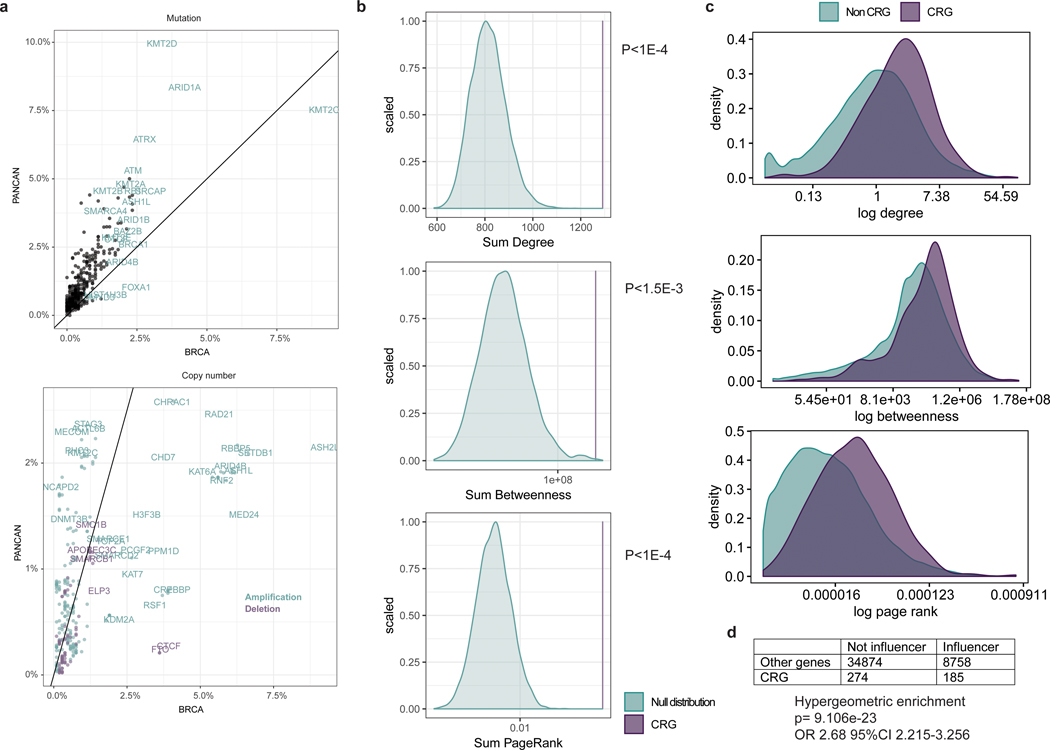
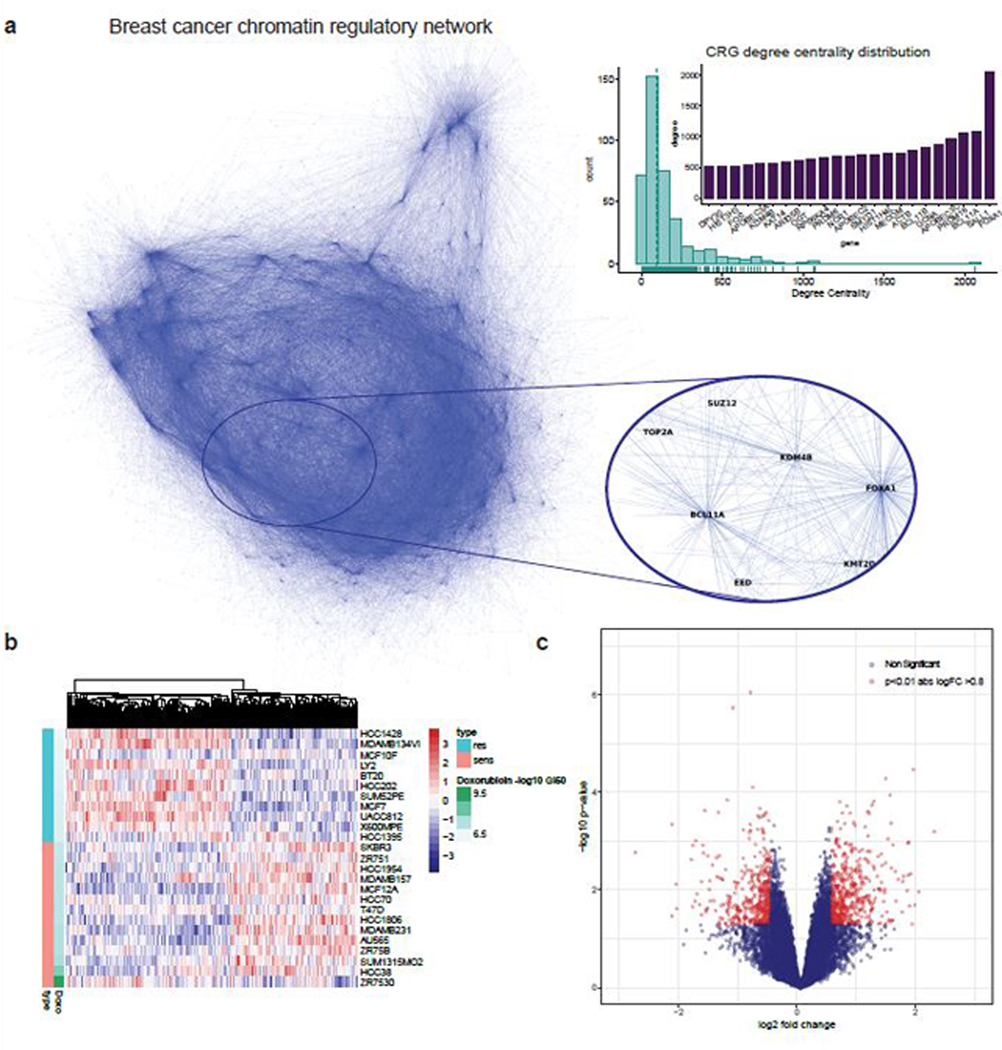
We compiled a list of 404 CRGs from literature review and gene ontology annotation (Supplementary Table 1, Methods). In order to evaluate the association between the mRNA expression of these CRGs and anthracycline response in human breast cancers, we combined data from multiple sources, including the TCGA breast cancer cohort5, breast cancer cell line expression and drug response data6–13, and a clinically annotated collection of expression profiles for 1006 early-stage breast cancer patients (Figure 1a, Methods). We focused on CRG mRNA expression because CRGs are infrequently mutated in breast cancer, but often copy number altered, presumably effecting expression changes (Extended Data Figure 1a)14,15. We evaluated whether CRGs have a central regulatory role in breast cancer using graph theoretical approaches. First, we generated a transcriptional regulatory network from TCGA breast tumor RNA-seq data (N=1079 patients) using the Algorithm for the Reconstruction of Accurate Cellular Networks (ARACNE)16, assuming each gene is a regulatory element. The set of CRGs exhibited high network centrality 17 as measured by degree (3.26±4.37 in CRGs versus 2.04±3.7 non CRGs) and this was significantly greater (p<1E-4) than for a null distribution with similar results for betweeness and page-rank (Extended Data Figure 1b,c, Methods). CRGs were also significantly enriched for influencers18 (Fisher Exact one-tailed test p<9E-23, OR 2.68) (Extended Data Figure 1d). In order to identify the sets of target genes directly regulated by each CRG, we used ARACNE to generate a breast cancer chromatin regulatory network, where CRGs correspond to hubs and target genes are terminal nodes (Figure 1a, Extended Data Figure 2a).
Figure 1. Schematic overview of study design, analytical and experimental framework and derivation of an anthracycline response signature.
Panel A. An adjuvant breast cancer metacohort of 1006 clinically annotated early stage breast cancer patients with gene expression data was used to identify genes for which the interaction between expression levels and treatment with anthracyclines was significantly associated with outcome, resulting in 54 CRGs. RNA-sequencing data from the TCGA breast cancer cohort was used to infer a breast cancer chromatin regulatory gene (CRG) network using the ARACNE algorithm. A panel of 87 breast cancer cell lines from 10 datasets with accompanying gene expression data and dose/response curve metrics (GI50 or AUC) data was used to build a genome-wide signature of anthracycline response (Methods). Based on the dose/response curve, cells were classified as sensitive or resistant (upper and lower 1/3 dose/response values, respectively). The VIPER algorithm was then applied to each dataset to identify chromatin regulatory genes (CRGs) from the ARACNE network whose targets were significantly enriched in the anthracycline response signature, yielding a consensus list of 38 CRGs. The intersection of genes significant in both the in vitro and in vivo analyses, yielded 12 CRGs from which KDM4B and KAT6B were selected for functional evaluation. Panel B. CRGs enriched in the in vitro doxorubicin signature based on VIPER are shown for the Heiser microarray dataset (N=46 biologically independent cell lines). CRGs are labeled within the network and the corresponding target genes whose expression they modify are indicated as individual dots. Panel C. For each CRG associated with anthracycline response in vitro, the inferred activation status is indicated (red – positive, blue – negative association with anthracycline sensitivity), as is the change in expression of its target genes, as indicated by individual bars along the horizontal (red – upregulated, blue – downregulated), and the significance of the association (p-value based on comparison of enrichment score with a null distribution generated from 1000 random signatures, non adjusted). The order of target genes is defined by the strength of association with doxorubicin response
We then defined a genome-wide signature of anthracycline response by analyzing ten breast cancer cell line datasets with expression data (RNASeq or microarray) and dose/response metrics (GI50 and AUC) 6–13 (Figure 1a), where the F-statistic (per gene) was used as a measure of treatment response. For each dataset, we identified a signature of anthracycline response by performing differential expression analysis between cell lines that were resistant or sensitive to doxorubicin (Extended Data Figure 2b,c, Supplementary Table 2, Methods). We next used Virtual Inference of Protein-activity by Enriched Regulon analysis (VIPER)19 to identify genes from the breast cancer chromatin regulatory network whose putative targets were significantly enriched in the anthracycline response signature. This yielded a consensus list of 38 CRGs associated (Fisher combined p<0.05) with anthracycline response across multiple in vitro datasets (Figure 1b,c).
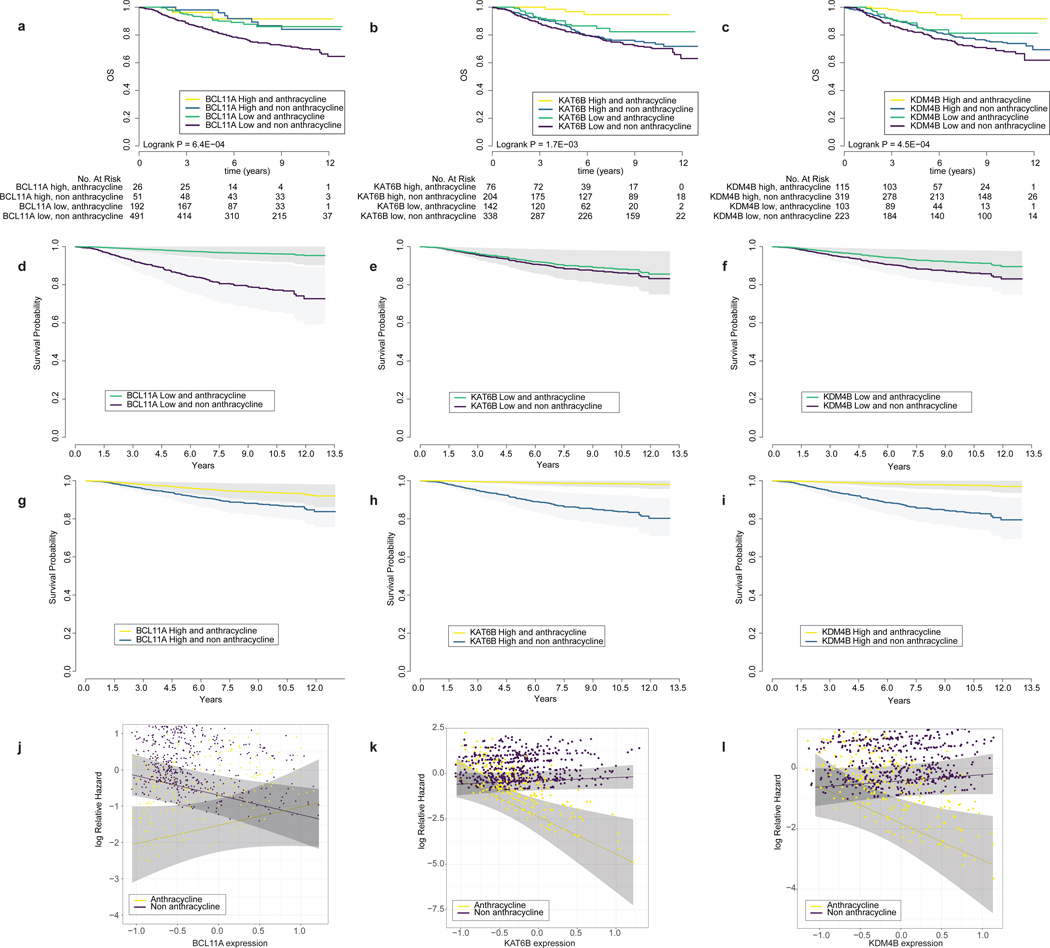
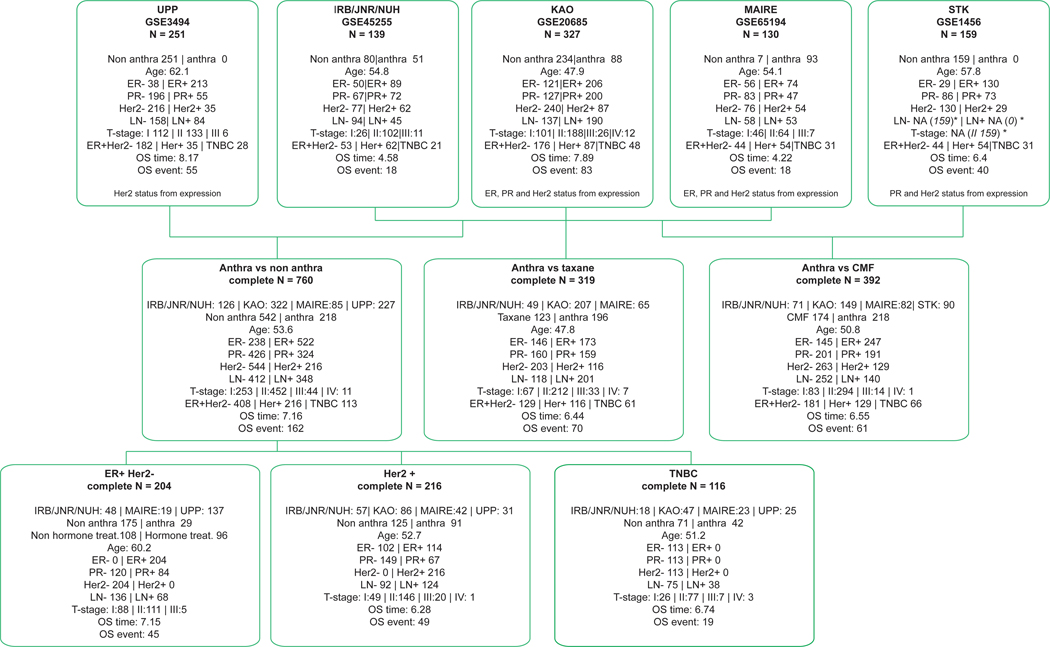
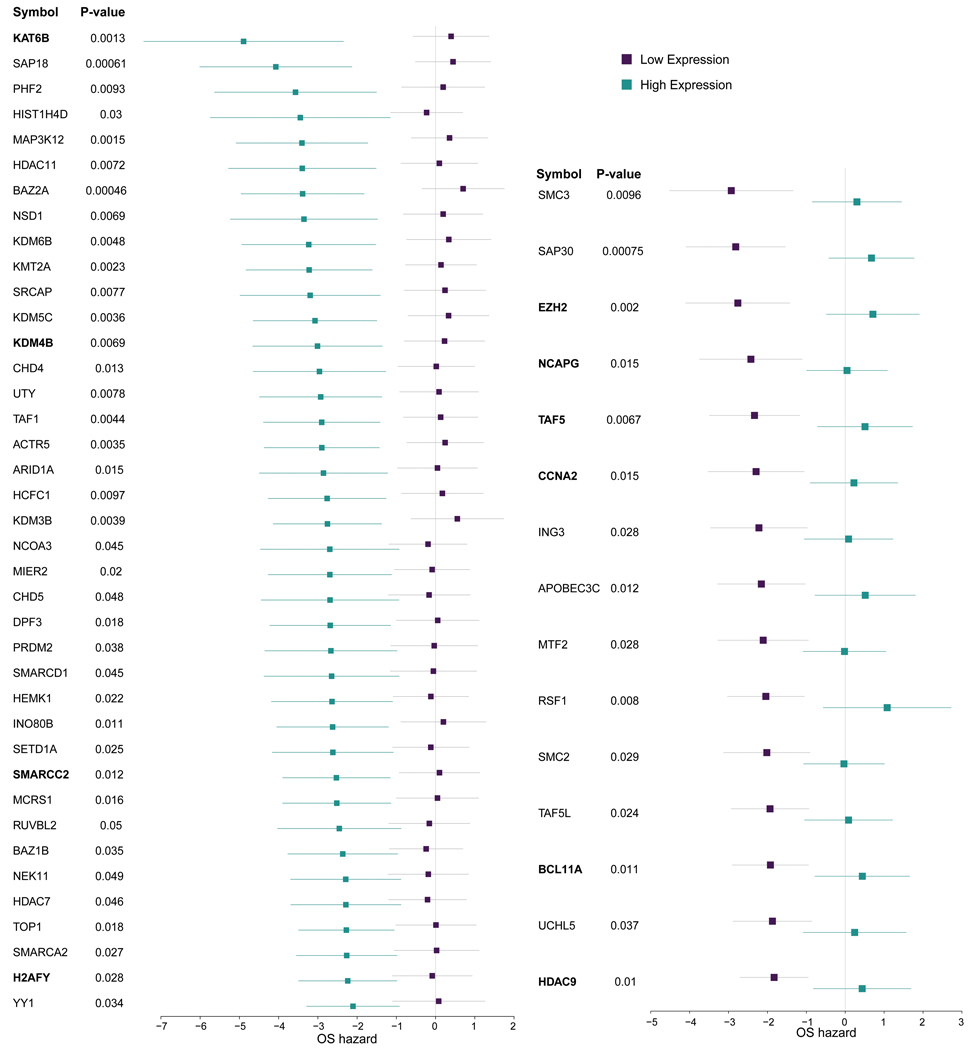
We next evaluated the association between the 404 CRGs and anthracycline benefit in a metacohort of 1006 early-stage breast cancer patients for whom tumor characteristics, overall survival, treatment, and gene expression data were available 20–25 (Figure 1, Extended Data Figure 3, Supplementary Table 3, Methods). We used a Cox Proportional Hazard model to study the interaction between gene expression and treatment and their association with overall survival 26. The model was adjusted by clinical covariates known to be associated with breast cancer outcome – including estrogen receptor (ER), progesterone receptor (PR), HER2 status, tumor size (t-stage), MKI67 expression, and lymph node status – as well as by cohort. We first compared patients treated with anthracyclines (N=218) to those who were not (including those treated with other chemotherapies, endocrine therapy alone, or who received no treatment) (N=542) 26. We found 54 CRGs with an interaction (p<0.05) between expression and treatment (anthracycline versus no anthracycline) associated with overall survival (Extended Data Figure 4, Supplementary Table 4). There was a positive enrichment of gene/drug interactions associated (p<0.05 from the Cox Proportional Hazards model) with outcome among CRGs (Fisher Exact one-tailed test P = 0.00062, OR:1.54, Extended Data Figure 5). Notably, a subset of CRGs were associated with reduced anthracycline benefit when their expression levels were below the median and many of these genes promote open chromatin. This list includes Trithorax-group proteins, including the BAF complex subunits ARID1A, SMARCD3, SMARCD1, and SMARCA2, COMPASS complex subunits such as KMT2A, as well as the histone lysine actyltransferase KAT6B, and histone demethlyases KDM6B and KDM4B. Conversely, a separate subset of CRGs were associated with greater anthracycline benefit when their expression levels were below the median. This includes the Polycomb gene EZH2, as well the histone deactylase HDAC9, the histone chaperone RSF1, and BCL11A, whose role in chromatin accessibility is less clear, where examples of both patterns are provided in Figure 2. Collectively, these findings incidate that CRGs predict anthracycline benefit in early-stage breast cancer patients.
Figure 2. The expression levels of key chromatin regulatory genes are associated with anthracycline response.
Panels A, B, C: Kaplan-Meier plot of anthracycline treated and non-treated patients (N=760 patients) stratified by high versus low expression of key CRGs (BCL11A, KAT6B, KDM4B). P-value from a two-sided logrank test Panels D, E, F: Cox Proportional Hazards model of the probability of overall survival (adjusted by hormone receptor status, Her2 status, lymph node status, tumor size, MKI67 expression and cohort) for low expression (median expression less one standard deviation). Grey shading corresponds to 95% confidence intervals. Panels G, H, I: Same as above, but for high expression (measured as median expression plus one standard deviation) of CRGs. Panels J, K, L: Hazard plot illustrating the Cox Proportional log relative Hazard by CRG expression levels in treated versus untreated samples. Importantly, this corresponds to a threshold-free representation of the hazards. Grey shading corresponds to 95% confidence intervals.
The observation that lower expression of BAF complex subunits or higher expression of Polycomb subunits, are associated with anthracycline response fits with previous models3. TOP2 proteins function as dimers of approximately 340kD (nearly twice the size of a nucleosome) that require accessible chromatin to bind DNA. A functional BAF complex is necessary for TOP2 to associate with DNA at about 60% of its sites in the genome. Loss of TOP2 function in a cell with a dysfunctional BAF complex renders cells less sensitive to TOP2 inhibitors3. Conversely, the Polycomb complex antagonizes the BAF complex27,28 conferring TOP2 inhibitor resistance.
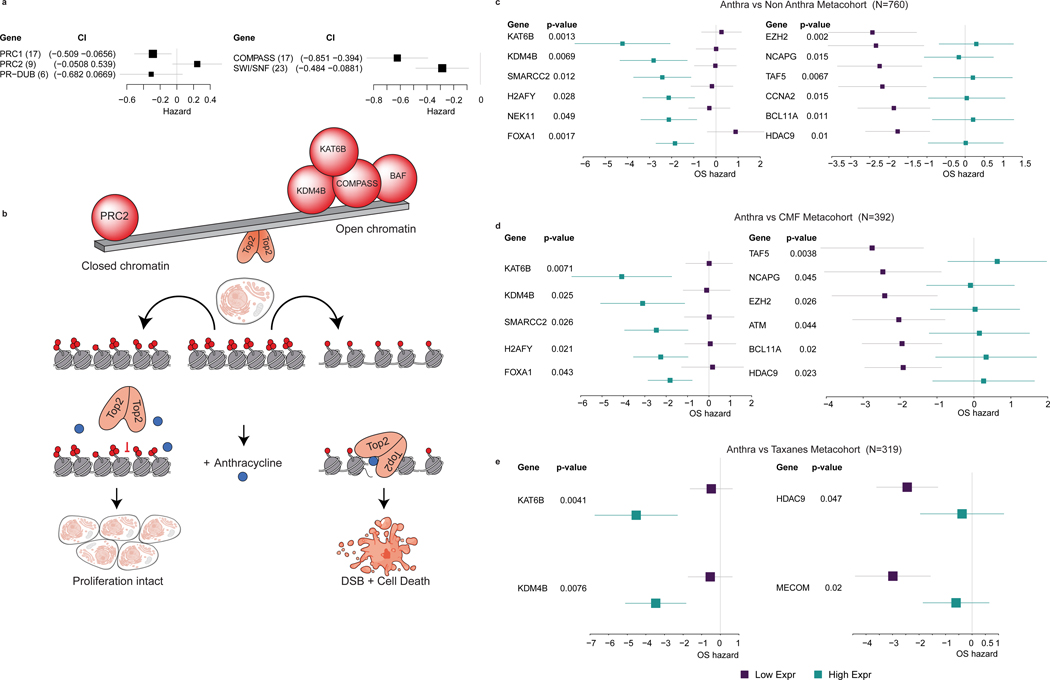
Because the BAF complex, a member of the trithorax group, influences TOP2 recruitment and accessibility, and opposes polycomb group complexes29, we evaluated the roles of these two complexes in mediating anthracycline benefit. Summarizing the hazard ratios for all genes in each complex across the breast cancer metacohort, we found that higher expression of PRC2 genes was generally associated with a higher hazard ratio, whereas higher expression of both BAF and COMPASS, members of trithorax class of genes, was generally associated with lower hazard ratios in the presence of anthracyclines (Figure 3a, Extended Data Figure 6). Recent studies show that changes in PRC1 levels do not lead to concomitant changes in accessibility, consistent with the lack of a change in hazard ratio for PRC1 or PR-DUB genes 30,31. Thus, those CRGs for which high expression was associated with greater anthracycline benefit were generally associated with increased DNA accessibility, while those for which high expression was associated with lesser anthracycline benefit were associated with decreased DNA accessibility. The Trithorax proteins, including BAF and COMPASS complexes, KDM4B, KAT6B, and others open the DNA fiber for TOP2 binding, thereby increasing anthracycline sensitivity. Conversely, an opposing set of CRGs including Polycomb group proteins (PRC2 complex) and others close the DNA fiber to TOP2 binding, thereby decreasing anthracycline sensitivity (Figure 3b). These data are consistent with a model wherin the expression levels of Trithorax and Polycomb genes act in opposing directions to mediate anthracycline benefit.
Figure 3. Chromatin state mediates anthracycline response.
Panel A: High expression levels of trithorax complexes (compass and SWI/SNF) are associated with better outcome in anthracycline treated patients (N=760 patients), whereas high expression of PRC2 complex is associated with worse outcome, where the hazard ratio plots summarizes the results for genes in each complex across the metacohort. The number of genes in each complex is indicated in brackets. Panel B. Schematic illustration of a model wherein the trithorax and PRC2 genes exhibit opposing roles in mediating anthracycline response. In this scenario, BAF and COMPASS complex subunits, KDM4B, KAT6B and others – open the DNA fiber to TOP2 binding, thereby increasing anthracycline sensitivity, while an opposing set of CRGs – including Polycomb proteins (PRC2), BCL11A, HDAC9 and others – close the DNA fiber to TOP2 binding, thereby decreasing anthracycline sensitivity. Panels C, D, E: Forest plot depicting the hazards of overall survival based on the expression of chromatin regulatory genes (CRGs) that were also associated with anthracycline response in vitro (from VIPER). P-values are based on the Cox Proportional Hazards model of the interaction between drug and gene expression, adjusted by hormone receptor status, Her2 status, tumor size, lymph node status, MKI67 expression from the expression array data and cohort (Methods). The forest plots contrast treated versus non-treated patients in two settings, namely high CRG expression (cyan) and low CRG expression (purple). The left panel illustrates representative genes for which high expression is associated with better outcome (negative hazards) in patients treated with anthracyclines, whereas the right panel includes representative genes for which low expression is associated with better survival in patients treated with anthracyclines. Varied chemotherapy regimes are compared, namely anthracylines versus non-anthracycline (CMF, taxanes, hormonal therapy, or no treatment) based treatment (N=760 patients) or subsets (anthracycline vs CMF, N=392 patients and anthracycline vs taxanes, N=319 patients). The forest plots show the log-2 hazard ratio (box) and error bars represent 95% confidence intervals.
To assess whether the CRGs associated with anthracycline benefit were also more generally implicated in benefit to other chemotherapies, we performed several additional comparisons. First, we repeated these analyses comparing patients treated with anthracyclines (N=218) and patients treated with the chemotherapy regimen CMF (cyclophosphamide / methotrexate / 5-fluorouracil) that does not contain an anthracycline (N=174). Here, we identified 44 CRGs with a significant (p<0.05) interaction between expression and treatment in predicting overall survival (Supplementary Table 5). Second, we repeated these analyses comparing patients treated with anthracyclines and no taxanes (N=196) to patients treated with taxanes and no anthracyclines (N=123). Here, we identified 50 CRGs with a significant (p<0.05) interaction between their expression and treatment in predicting overall survival (Supplementary Table 6).
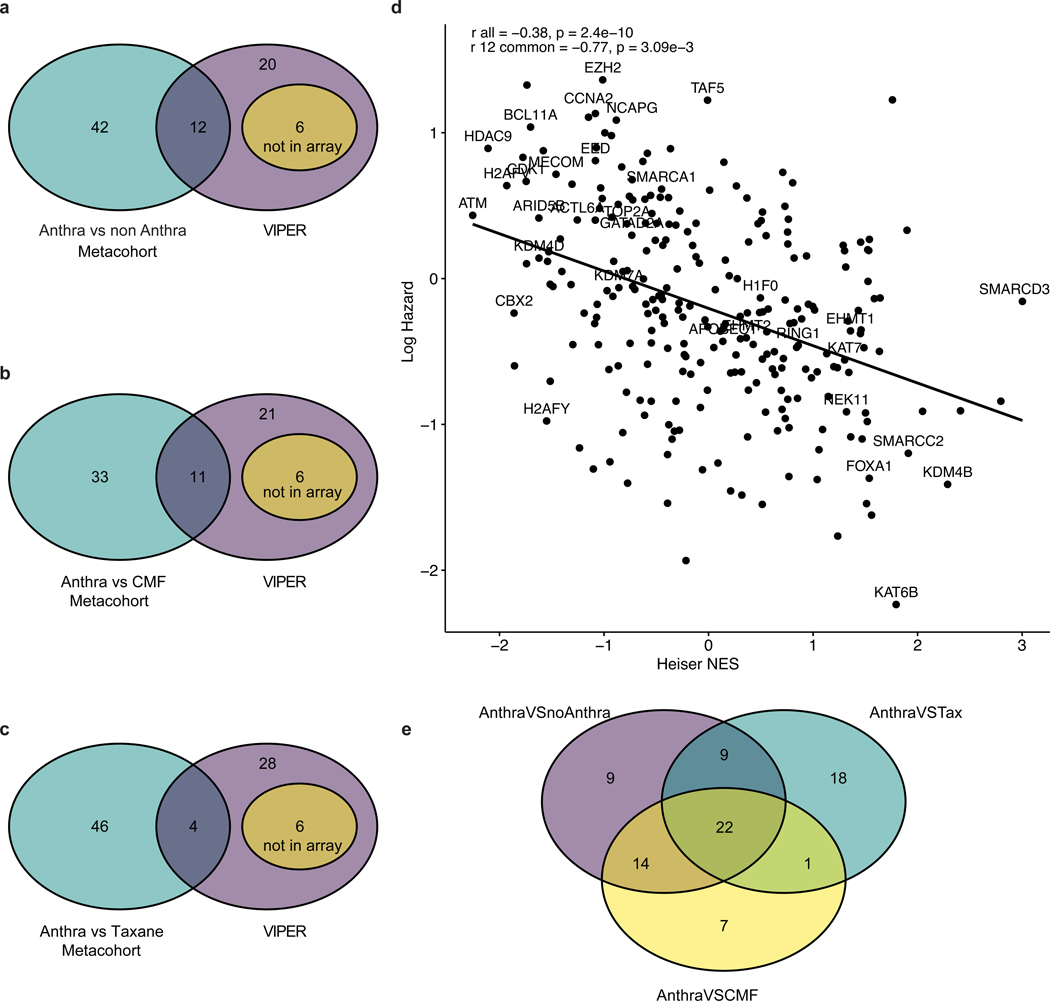
Of the 38 CRGs implicated in anthracycline response in vitro, 32 had available expression data in the metacohort and of these, 12 exhibited a significant interaction between expression and anthracycline usage in predicting overall survival when comparing anthracycline-treated versus non-anthracycline-treated patients (Figure 3c, Extended Data Figure 7a). As expected, the VIPER enrichment factors for CRGs were negatively correlated (Pearson R=−0.77, p=3.09E-3) with the hazard ratio in the metacohort (Extended Data Figure 7d). Amongst the 44 CRGs that were significant when comparing anthracycline-treated versus CMF-treated patients, 11 genes were also significant in the in vitro analysis (Figure 3d, Extended Data Figure 7b). Of the 50 genes from the anthracycline-treated versus taxane-treated comparison, four were significant in the in vitro analysis (Figure 3f, Extended Data Figure 7c). Amongst the 22 CRGs shared across the three treatment comparisons in the patient metacohort (Extended Data Figure 7e), three (KDM4B, KAT6B, and HDAC9) were also significant in vitro. We further assessed anthracycline specificity by comparing enrichment of the 12 genes common across the in vitro and in vivo analyses with the VIPER enrichment for other breast cancer chemotherapies (Supplementary Figure 1). Doxorubibicin was generally the most enriched, but docetaxel exhibited modest enrichment, albeit at a lower level. Collectively, these results suggest that the CRGs identified through these analyses are implicated in anthracycline sensitivity, rather than general chemosensitivity.
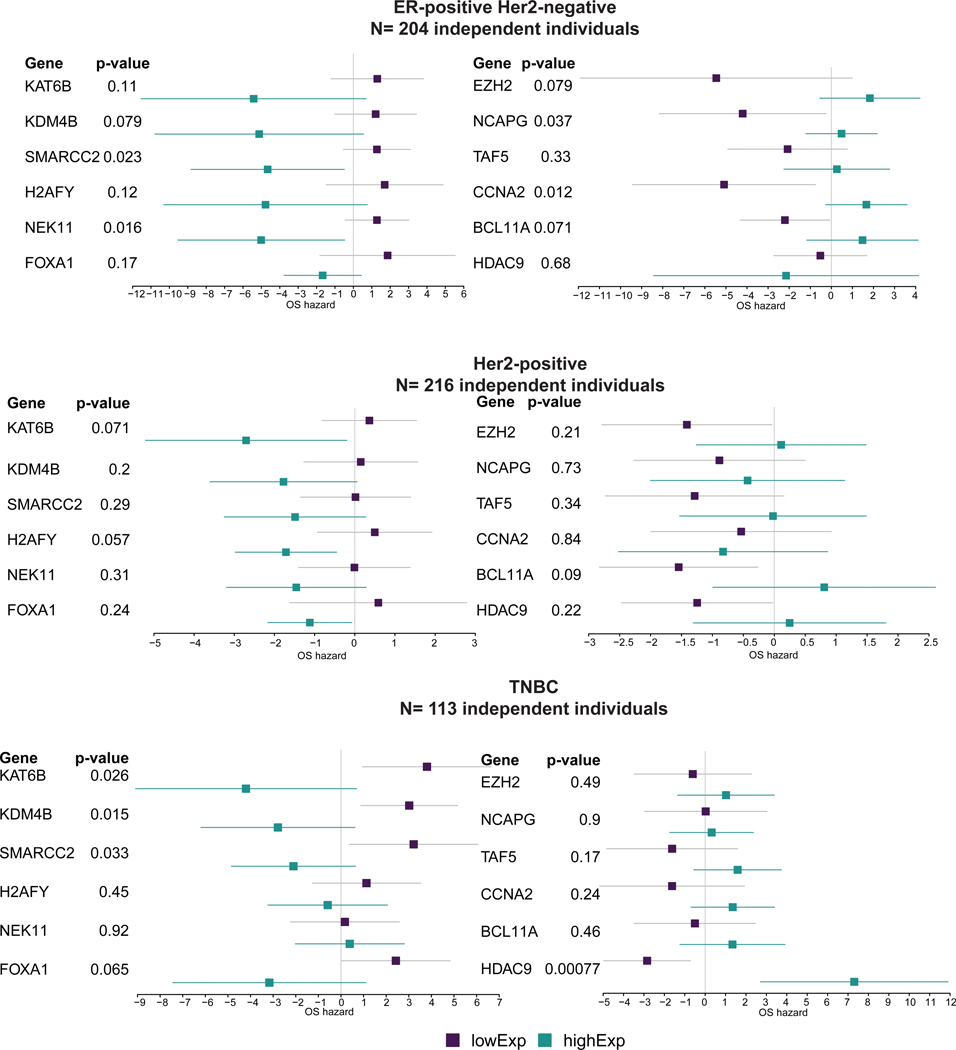
While our initial analyses adjusted for ER, PR, and HER2-status, we further sought to determine whether the associations remained significant within each of the clinical subgroups rather than being driven by one subtype. We therefore stratified the metacohort into the three clinical subtypes: ER-positive/HER2-negative (N=204, Supplementary Table 7), HER2-positive (N=216, Supplementary Table 8), and triple-negative (TNBC) (N=113, Supplementary Table 9). For the ER-positive/HER2-negative group we included hormone therapy as a covariate. Notably, across these three patient subgroups, the directionality of the hazard ratios for most of the 54 CRGs that were significant in the full cohort remained the same, despite the reduction in sample size in these subset analyses (Extended Data Figure 8, Methods). Examination of CRG expression by subtype revealed higher expression of KDM4B and KAT6B and lower expression of BCL11A in ER-positive versus ER-negative tumors (Supplementary Figure 2). Although ESR1 signaling was correlated with CRG expression in both subgroups, substituting this for ER status in the model did not change the results. Collectively, these findings indicate that CRG expression is associated with anthracycline benefit across the breast cancer clinical subgroups.
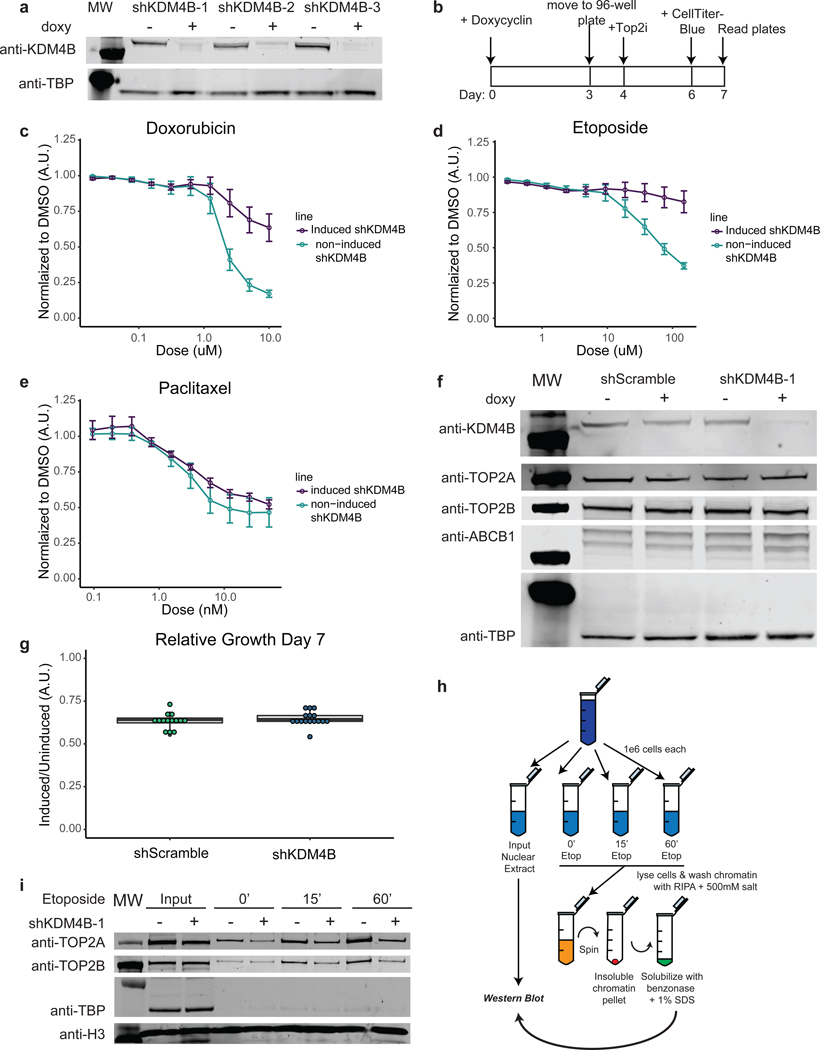
In both the cell line and patient data, reduced KDM4B expression was strongly associated with anthracycline resistance. In vitro KDM4B is a weak histone demethylase that recognizes H3K9me2/3 and converts the histone tail to H3K9me1, effectively changing the histone mark to one that is associated with a more accessible, transcriptionally active chromatin state. To functionally evaluate the role of KDM4B in anthracycline response, we searched for a cell line that could serve as a model to recapitulate the phenomenom seen in patients and found the breast cancer cell line HCC1954 to be suitable (other cell lines that failed to recapitulate the patient data can be found in Supplementary Figure 3. Levels of KDM4B protein were lowered using three inducible shRNA knockdown constructs in HCC1954 cells (Figure 4a). Following KDM4B knock down for four days, cells were treated with doxorubicin, etoposide (a non-anthracycline TOP2 inhibitor), or paclitaxel (a taxane that functions via tubulin inhibition) for three days, after which cell viability was measured (Figure 4b). Consistent with the patient data, where CRG expression levels predicted response to anthracycline but not taxane treatment, KDM4B knockdown induced resistance to doxorubicin (Figure 4c) and etoposide (Figure 4d), but remained sensitive to paclitaxel (Figure 4e). An inducible scrambled shRNA did not result in significant changes in sensitivity to drug treatment (Extended Data Figure 9a-c). We confirmed that knockdown-induced anthracycline resistance, was not due to decreases in cell proliferation, loss of the drug target (TOP2A or TOP2B), or upregulation of the ABCB1 multi-drug exporter protein (Figure 4f-g). In the patient metacohort, there was also minimal (R < ±0.2) correlation between KDM4B and TOP2A, TOP2B, or ABCB1 expression (Extended Data Figure 9e). Knockdown of KAT6B similarly resulted in anthracycline resistance in HCC1954 cells, consistent with the patient data and the coordinate role of multiple CRGs in anthracycline response (Extended Data Figure 10).
Figure 4. KDM4B mediates TOP2 inhibitor response in breast cancer cells by modulating TOP2 accessibility to chromatin.
Panel A: Western blots on nuclear extracts showing inducible shRNA knockdown of KDM4B with 3 unique shRNA sequences in the HCC1954 breast cancer cell line. See Source Data 1. Experiments we repeated independently 3 times with similar results. Panel B: Schematic overview of drug response assays. Panel C: Doxorubicin dose response curves for KDM4B induced shRNAs (shRNA 1, 2, 3) in HCC1954 cells and non-induced HCC1954 cells normalized to DMSO vehicle. n=9; 3 independent experiments of 3 independent shRNAs each. Center value is mean +/− s.e.m.. Panel D: Etoposide dose response curve for KDM4B induced shRNAs (shRNA 1, 2, 3) in HCC1954 cells and non-induced HCC1954 cells normalized to DMSO vehicle. n=9; 3 independent experiments of 3 independent shRNAs each. Center value is mean +/− s.e.m.. Panel E: Paclitaxel dose response curve for KDM4B induced shRNAs (shRNA 1, 2) in HCC1954 cells and non-induced HCC1954 cells normalized to DMSO vehicle. n=3; 3 independent experiments from 2 independent shRNAs. Center value is mean +/− s.e.m.. Panel F: Western blot on whole cell extract showing knockdown with a scramble shRNA or knockdown of KDM4B (shRNA-1) with no concomitant loss of drug targets TOP2A and TOP2B or a gain in the drug efflux pump ABCB1. See Source Data 2: Subfigure is a combination of multiple blots. Experiments we repeated independently 3 times with similar results. Panel G: Relative cell number of HCC1954 cells with induced shRNAs to non-induced cells (shRNAs to KDM4B 1, 2, 3 and shRNA Scramble) at day 7 (induced/DMSO vehicle). n=14: Scramble and n=16: KDM4B from independent experiments. Center line of box is the median data point with upper bound of box the 3rd quartile and lower bound of box the 1st quartile. Whiskers represent 1.5x the IQR. Panel H: Schematic of Etoposide fixed, high salt wash TOP2 DNA accessibility experiments shown in I and S13D. Panel I: Western blot of Input samples and resolubilized chromatin pellet after wash with 500mM NaCl from HCC1954 cells treated with etoposide for given time, +/− induction of shRNAs shows a reduction of chromatin bound TOP2 proteins in the absence of KDM4B. Histone H3 is shown as a loading control and TBP shows removal of transiently bound proteins by 500mM salt wash. See Source Data 3. Experiments were repeated independently three times with similar results.
Next, we evaluated whether KDM4B modulated TOP2 binding to chromatin and therefore sensitivity to anthracyclines and other TOP2 inhibitors. Since etoposide treatment leads to a covalent cross-link between TOP2 proteins and DNA that can only occur where TOP2 proteins have access to DNA, this provides a powerful way to determine TOP2 accessibility to chromatin 3,4 (Figure 4h). KDM4B knockdown in HCC1954 cells, followed by etoposide treatment for 15 or 60 minutes and a 500mM salt wash to remove transiently bound proteins, resulted in less TOP2A and TOP2B bound to the insoluble chromatin fraction (Figure 4i), but not in the shScramble control (Extended Data Figure 9d). Thus, we demonstrate that resistance to TOP2 inhibitors after knock-down of KDM4B is due to a direct loss of TOP2 accessibility to chromatin, highlighting the specificity of CRGs in anthracyline response.
In summary, we identified a network of chromatin regulatory genes (CRGs) and showed that naturally occurring variation in their expression levels dictates chromatin accessibility and sensitivity to anthracycline therapy across clinically defined breast cancer subtypes. We found that CRGs that tend to increase DNA accessibility were generally associated with greater anthracycline benefit when expressed at high levels, whereas CRGs associated with decreased DNA accessibility tended to be associated with anthracycline resistance when expressed at high levels. These results are consistent with a model in which CRGs, including the BAF and COMPASS complexes, KDM4B, and others – make DNA available for TOP2 binding, thereby increasing anthracycline sensitivity, while an opposing set of CRGs – including Polycomb proteins (PRC2) – reduce DNA availablity to TOP2 binding, thereby decreasing anthracycline sensitivity.
Our results have several implications. There is an urgent need to understand the biology that determines anthracycline response especially in early-stage breast cancer, where the modestly more efficacious anthracycline-containing regimens32 are associated with clinically important risks of cardiac toxicity and secondary malignancy1,2. While commercially available gene expression tests can be used to help determine if a patient with early-stage breast cancer is likely to benefit from chemotherapy33–36, there are presently no biomarkers that guide the use of anthracycline versus non-anthracycline containing regimens. Importantly, we show that chromatin state is associated with anthracycline benefit in ER-negative as well as ER-positive, and in node-negative as well as node-positive, breast cancer. Therefore, a signature based on the expression levels of the CRGs defined here could be used to distinguish early-stage breast cancer patients who will benefit from an anthracycline-containing regimen from those who will not. Further evaluation of such a predictive signature is warranted prior to its implementation as a diagnostic assay. Such an approach has the potential to inform patient stratification, resulting in improved outcomes while mitigating toxicity. The chromatin accessibility biology elucidated here may also guide approaches to modify CRG function to improve anthracycline sensitivity in patients who truly need it, such as with histone deacetylase inhibitors and other epigenetically targeted therapies.
Methods
Breast cancer cell line and patient datasets
The TCGA breast cancer RNA-seq dataset (N=1079 patients) was downloaded from gdc.cancer.gov (0½018). RPKM count data was normalized using variance stabilizing transformation (VST) from the package DESeq237 within R Bioconductor. The breast cancer cell line drug response datasets, including gene expression RNASeq and microarray data and drug response information, was downloaded from (Heiser6 RNASeq, microarray and drug response), GRAY8 (drug response) and using the PharmagoGX package38 (gCSI RNASeq and drug response, GDSC1000 microarray and drug response, CCLE RNASeq and microarray and FIMM and CTRPv2 response data). We used data from a total of 87 breast cancer cell lines, which exhibited sensitivity or resistance to doxorubicin or other breast cancer chemotherapies. Drug response information was recorded for the Heiser dataset as –log10(GI50), where GI50 was the concentration that inhibited cell growth by 50% after 72 hours of treatment and AUC for rest of datasets (area under the dose-response curve). Briefly, for each dataset we divided the total number of cell lines into those that were sensitive (top tertile of –log10(GI50) or AUC for the drug) or resistant (bottom tertile of –log10(GI50) or AUC for the drug). We used limma39 with weighted samples (arrayWeight function) for microarray datasets and voom normalized for the RNA-seq datasets to obtain both a signature of response to anthracycline or other drugs and a null model for each signature by permuting the sample labels 1000 times. P-values and t-statistics were based on limma (moderated t-statistic).
Compilation of an adjuvant breast cancer patient metacohort
Raw CEL files were downloaded from the Gene Expression Omnibus (GEO) Database for the datasets KAO22 (GSE20685), IRB/JNR/ NUH21 (GSE45255), MAIRE25 (GSE65194), UPS23 (GSE3494) and STK24 (GSE1456). These datasets were each profiled on the Affymetrix platform (hgu133plus2, hgu133a and hgu133b) and were reprocessed using the rma function from the affy package40 and quantile normalized. COMBAT41 was used to remove batch effects. Patients who received an anthracycline (doxorubicin or epirubicin) as a component of their treatment regimen were classified as “anthracycline-treated”, while patients who received a chemotherapy regimen that did not contain anthracyclines, who received endocrine therapy alone, or who received no therapy were classified as “not anthracycline-treated”. ER, PR and Her2 status were inferred using a gaussian mixture model of the probes 205225_at, 208305_at and 216836_s_t, respectively. MKI67 values was obtained from probe 212023_s_at. Lymph node positivity is a binary feature obtained from: Number of nodes >0, or N-stage ≥1. T-stage was a factor obtained from either the actual T-stage, as reported (n=327 cases), or as inferred from the reported size of the tumor (T1 < 2cm, T2 ≤ 5cm, T3 > 5cm) (n=520 cases). For the STK cohort, information on tumor size (T-stage), lymph node status or N-stage was not available, however the authors reported that the mean tumor size in the cohort was 22mm and 62% of samples have size <21mm where 38% samples are lymph node positive. We inferred t-stage 2 and negative lymph node status for all samples in this cohort. The ESR1 signature was calculated using the list of genes from42 and the function sig.score from the genefu package43.
Defining a set of chromatin regulators
We generated a list of chromatin regulators N= 404 (Supplementary Table 1) based on a defined set of Gene Ontology functions, including: a) Histone lysine methyltransferase activity (GO:0018024), b) histone demethylation (GO:0032452), c) histone deacetylation (GO:0004407), d) histone acetyltransferase activity (GO:0004402), e) histone phosphorylation (GO:0016572), f) PRC1 complex (GO:0035102), g) PRC2 complex (GO:0035098), h) SWI/SNF complex (GO:0016514 plus other members not included in this GO category), i) ISWI complex members (NURF, ACG, CHRAC, WICH, NORC, RSF and CERF complex members44,45, j) Chromodomain and NURD-Mi-2 complex46, k) INO80 complex (GO:0031011), l) SWR1 complex47 m) PR-DUB complex48, n) CAF1 complex (GO:0033186), o) Cohesins49, p) Condensins50, q) Topoisomerases (GO:0003916), r) DNA methyltransferases (GO:0006306), DNA demethylases (GO:0080111), Histone proteins51 and chromatin pioneer factors52
Network inference
From VST-normalized gene expression data, we used the ARACNE-AP algorithm53 to generate the genome-wide breast cancer transcriptional network (24919 × 24919 expression values) and the chromatin regulatory gene (CRG) network (404 × 24919 expression values). ARACNE-AP was run with the recommended parameters (p<1E-8). Significant networks were calculated from 10 bootstrap iterations for the genome-wide network and from 100 bootstraps for the CRG network. Network edges with adjusted p-values > 0.05 were removed. The regulon is composed of 396 CRGs (8 had no nodes directly connected and hence were excluded) and the median number of targets per CRG was 94. We calculated the degree, betweenness and page rank centrality for each gene (node) in the genome-wide network using the igraph package (http://igraph.org/r). To compute a null distribution, we randomly selected 10,000 combinations of 404 genes (out of 24,919) and obtained centrality measures by aggregating the values across all 404 genes. We then compared the centrality scores for the CRGs relative to the null distribution to determine those that were significant (> 5% of the tail of the distribution). Influencers of the network were calculated using the collective influence algorithm available online (http://github.com/ronammar/collective_influence, accessed June 2019) 18. Enrichment for CRGs and influencers was calculated using a Fisher Exact one-tailed test.
Anthracycline signature and breast cancer CRG network enrichment
While VIPER19 was originally designed to identify protein activity associated with a specific transcriptional regulatory program or phenotype, here we adapted this approach to evaluate the enrichment of the CRG network and the doxorubicin (or other chemotherapeutic agents) signature (t-statistics for each gene) in order to identify CRGs implicated in drug resistance or sensitivity in breast cancer cell lines. To account for the correlation structure in the expression network, we included the null distribution from 1000 resampling labels obtained from the drug differential expression analysis in the VIPER model as a parameter. By evaluating the enrichment of mRNAs that were up- or down-regulated in the anthracycline response signature amongst genes in the chromatin regulatory network, we identified a consensus list of 38 CRGs: For each CRG, we compute the compined p-value of all datasets by using the function combine.test (Fisher method from package survcomp) 54. In order to test for enrichment of the 12 hits in common from the in vitro and clinical analyses, for each dataset and drug, we computed the VIPER enrichment p-value for each CRG and drug signature and evaluate the enrichment of -log10 pvalues and the 12 genes using GSEA analysis from the fgsea package 55.
Outcome association analyses
We used a Cox Proportional Hazard model to study the interaction between the expression of each CRG in the breast tumor and the patient’s outcome (overall survival) under a specified drug condition in the adjuvant-treated breast cancer metacohort. We compared the association between CRG expression with patient outcome under the following sets of drug conditions: (1) anthracycline-treated vs non anthracycline-treated (including patients who received non-anthracycline chemotherapy, only endocrine therapy, or no therapy), (2) anthracycline-treated vs CMF-treated (cyclophosphamide, methotrexate, and 5-fluorouracil), and (3) anthracycline-treated vs taxane-treated (alone or in combination with other non-anthracycline agents). The model was adjusted for age, tumor size (T-stage), lymph node status (positive or negative), cohort, MKI67 expression and ER, PR and Her2 status (with the exception of the stratified clinical analysis, where ER, PR or Her2 were removed accordingly). Hormone therapy was included for ER-positive samples. In HER2-positive tumors, trastuzumab treatment was not included as a covariate since it was not reported. We used the maxstat algorithm56 from survminer (https://cran.r-project.org/web/packages/survminer/index.html) package to obtain the optimal threshold to divide high and low expression profiles for visualization in the Kaplan-Meier plots. For comparing the contrast and Cox Proportional Hazard probability plots, we defined “high” as one standard deviation above the median and “low” as one standard deviation below the median. The rms (https://cran.r-project.org/web/packages/rms/index.html) and survival (https://cran.r-project.org/web/packages/survival/index.html) packages were used for outcome analysis. The survcomp 54 package (https://bioconductor.org/packages/release/bioc/html/survcomp.html) was used for Kaplan-Meier visualization and summary statistics.
In addition to analyzing the full cohort (adjusted for ER, PR, and HER2-status), we performed a number of subset analysis in each of the three clinical subtypes: ER-positive/HER2-negative, HER2-positive and triple-negative (TNBC) tumors. Although the subset analysis stratified by ER/HER2 status was not significant (p<0.05), likely due to the small sample size and lack of treatment information in the HER2-positive cohort, the trends were consistent with the finding that CRGs are predictive of anthracycline benefit irrespective of subgroup. Indeed, for most genes the directionality of the association was the same with the exception that one gene changed direction in ER-positive/HER2-negative tumors (HDAC9), two genes changed in HER2-positive tumors (NCAPG and CCNA2), and two genes changed in TNBC (NEK11 and NCAPG).
Cell culture
HCC1954 cell line was obtained from American Type Culture Collection (ATCC) and maintained as recommended in RPMI media + 10% FBS at 37°C in 5% CO2. Cells were limited to under 20 passages for all experiments. HCC1954 is ER-/HER2+ but not TOP2A amplified, has a doubling time of ~40 hours and is readily transduced with lentiviral particles. Additionally, it is doxorubicin-sensitive and paclitaxel-sensitive, which is important for showing that KDM4B modulation specifically leads to changes in anthracycline response and not generally to small molecule inhibitors. These observations indicated that it might be a useful model for studying the relationship between response to therapeutics and CRGs.
Lentiviral preparation and infection
Lentiviruses were produced LentiX-HEK293T cells via spinfection with polyethylenimine transfection. HEK293T cells were cultured using standard conditions in DMEM media containing 10% FBS. HEK293T cells were transfected with PEI with TRIPz lentiviral vectors described below, co-transfected with packaging vectors psPAX2 and pMD2.G as previously described 57. Viral supernatant was collected ultracentrifuged and used for spin-fection.
TRIPz shRNA plasmids
shRNAs in the pTRIPZ backbone were obtained from Dharmacon. Clone numbers are shKDM4B-1: V3THS_316478; shKDM4B-2: V3THS_316479; shKDM4B-3: V3THS_316481; shSCRAM: Cat RHS4743; shKAT6B-88: V3THS_349688; shKAT6B-92: V3THS_349692. Cells were selected in 2ug/ml of Puromycin 48 hours after transduction and kept under selection for experiments.
In vitro drug response assays
Cells were grown for 3 days in the presence or absence of doxycycline (1.5ug/ml) to induce shRNA expression. Cells were then trypsinized, counted, and plated in 96-well plates at 3000–4000 cells per well with or without doxycyclin. Cells were allowed to attach to the well for 24 hours and then the media was replaced and appropriate concentrations of doxorubicin (AK Scientific 69518), etoposide (Sigma Aldrich, E1383), or paclitaxel (Fisher Scientific P3456), or DMSO vehicle control were added. Cells were grown with inhibitors for 48 hours when CellTiter-Blue was added to all wells at 5% v/v. Plates developed at 37°C and 5% CO2 overnight. Media/Supernatant was then transferred to 386-well clear bottom black plates and read on a Flex Station 3 (Molecular Devices) with excitation of 540nm and emission of 595nm. CellTiter-Blue emission readings for each treatment well was normalized to DMSO control and the data plotted in R-studio. At the end of the inhibitor resistance assays, DMSO control wells were used to calculate growth rate changes upon induction of shRNAs, as a ratio of induced/non-induced for both shRNAs to KDM4B and the non-specific scrambled shRNA. Detailed protocol is published at dx.doi.org/10.17504/protocols.io.k5zcy76.
Western blots and antibodies
Nuclear or Whole Cell Extracts were prepared, and protein concentrations were measured. 15ug of protein was run on a Bis-Tris gel, transferred at 200mA for 2 hours and blocked in 5% non-fat milk for 1 hour. Blots were incubated with primary antibodies overnight and then washed 3x in TBST. Blots were then incubated with secondary antibodies with conjugated −680nm and −800nm fluorophores (Licor, 1:25,000) for 45 minutes at room temperature, washed 3x, and then developed on an Odyssey® CLx Imaging System (Licor, Lincoln, NE United States). KDM4B/JMJD2B (Bethyl Laboratories A301–478A, 1:1000), TOP2A (Santa Cruz Biotech sc-3659, clone F-12, 1:1000), TOP2B (Santa Cruz Biotech H-286, sc-13059, 1:1000), MDR1/ABCB1 (Cell Signalling Technologies, 12683S, 1:1000), RNF2 (Cell Signalling Technologies, 5694S, 1:1000), H3 (Epicypher, SKU: 13–0001, 1:5000) We were unable to validate any of the available KAT6B antibodies. Licor software (Image Studio version 5.2.5) was used for the following: Image adjustment was limited to exposure (brightness and contrast; all lanes done equally and simultaneously) followed by cropping and exporting in .png format. No additional image manipulation was performed.
TOP2 cross-linking
Cells were treated with doxycycline for 4 days to induce shRNA expression as described. Cells were trypsinized and counted and 1e6 cells were resuspended in complete media. 1e6 cells for input were saved on ice and then processed in RIPA Buffer A and RIPA buffer with 150mM NaCal along side the etoposide treated samples. Cells were then treated with etoposide (100uM) for 0’, 15’ or 60’ with rocking at room temperature. Cells were washed 2x with PBS and resuspended in Buffer A for 10 minutes. Nuclei were spun down and resuspended in RIPA buffer with 500mM NaCl for 15 minutes on ice. Suspension was spun down and and the supernatant was removed. The insoluable chromatin pellet was then soluablized with RIPA containing 1% SDS and Benzonase (1:200) for 10’ at RT followed by 20’ on ice. Equal volumes of chromatin fractions were run on Western Blots as described above. The detailed protocol is available at dx.doi.org/10.17504/protocols.io.2rngd5e.
RT-qPCR
RNA was extracted from cells using Trisure (Bioline) and cDNA was synthesized from 1ug RNA using the SensiFAST SYBR Lo-Rox (Bioline). Samples were run on a QuantStudio 6 Flex system (Life Technologies). 2-ΔΔCT was calculated as described by Livak and Schmittgen 58 where:
–ΔΔCT = (CTGOI – CTGAPDH)shKAT6B-induced – (CTGOI –CTGAPDH)shKAT6B non-induced.
Primers for qPCR are as follows:
KAT6B-BF: AGTGGACACCCATCCTGTTTG
KAT6B-BR: CCACATCCCTTTTGGCATTCT
KAT6B-CF: AGGATGTCGTTACTGAAGAGGA
KAT6B-CR: CCCCACTCTCACACTCTATTTTC
GAPDH-F: GCCAGCCGAGCCACAT
GAPDH-R: CTTTACCAGAGTTAAAAGCAGCCC
Extended Data
Extended Data Fig. 1: Somatic mutation and copy number distribution pan-cancer vs breast and centrality distribution of CRGs.
Panel A: Comparison of somatic alterations in chromatin regulatory genes (CRGs) in breast cancer versus pan-cancer. Top panel: Frequency of mutations in CRGs in breast cancer (BRCA, x-axis) versus pancancer (pancan; 32 cancer types excluding breast) based on non-synonymous mutations in whole exome sequencing data from TCGA. Bottom panel: Frequency of copy number amplification and deletion events in CRGs in breast versus pancancer based on TCGA SNP array data. Panel B: Centrality of CRGs. Genome-wide breast cancer network generated from the TCGA breast cancer RNA-seq dataset using ARACNE. Centrality measures were computed for each gene. A null distribution of centrality scores was generated using 10,000 combinations of 404 genes by summing their degree, betweenness and page rank values (non CRG) compared with the sum of degree, betweenness and page rank of the chromatin regulator genes (CRG). The comparison between the null distribution and CRG centrality scores highlights the central role of CRGs in the breast cancer network. Panel C: Density distribution of centrality measures among CRGs and non CRGs. Panel D: CRGs are significantly enriched for influencers.
Extended Data Fig. 2: Breast cancer chromatin regulatory network and doxorubicin response signature.
Panel A: Derivation of a breast cancer chromatin regulatory network: A breast cancer chromatin regulatory network was derived from TCGA RNA-seq data using the ARACNE algorithm (Methods). The inset panel shows a region mapping to chromatin regulatory genes (CRGs) with high degree centrality. Each hub of the network is a CRG, while the terminal nodes correspond to their target genes. The histogram and barplot show the degree centrality for all CRGs, where two of the largest network hubs correspond to FOXA1, KDM4B and BCL11A. Panel B: Doxorubicin signature in breast cancer cell lines from Heiser microarray dataset (N=46 independent cell lines). Heatmap of gene expression profiles among resistant (1/3) and sensitive (1/3) breast cancer cell lines where cell lines are sorted by GI50. Panel C: Volcano plot of genes differentially expressed (moderate T-statistic from limma) between sensitive versus resistant cell lines.
Extended Data Fig. 3: Summary of adjuvant breast cancer metacohort (N=1006).
Top panels describe the 5 individual cohorts used to build the metacohort: UPP (GSE3494), IRB/JNR/NUH (GSE45255), KAO (GSE20685), MAIRE (GSE65194) and STK (GSE1456). All cohorts were profiled on Affymetrix gene expression arrays. Center panels describe the metacohort comparing anthracycline versus non-anthracycline (no therapy, hormone therapy or other chemotherapy), anthracycline versus taxane or anthracycline versus CMF. Bottom panels illustrate results stratified by the breast cancer clinical subgroups, namely ER+/Her2-, Her2+ and ER-/HER2- (triple negative). In the ER+/Her2- subgroup, hormonal therapy was included a covariate. *STK cohort does not publish size, t-stage, n-stage or lymph node status, but in the original paper (PMC1410752) the reported mean size is 22 and 62% samples have size<21, so we have inferred t-stage=2 for all samples. Similarly, 38% samples have lymph node positive has been reported, so we inferred LN- for all samples
Extended Data Fig. 4: CRGs associated with anthracycline response in the metacohort (anthracycline vs non anthracycline, N=760 individuals).
Genes denoted in bold are also significant in the in vitro network analysis. The forest plots show the log-2 hazard ratios (boxes) and error bars represent 95% confidence intervals. P-values (unadjusted for multiple hypothesis testing) are based on the Cox Proportional Hazards model of the interaction between drug and gene expression, adjusted by hormone receptor status, Her2 status, tumor size, lymph node status, MKI67 expression from the expression array data and cohort.
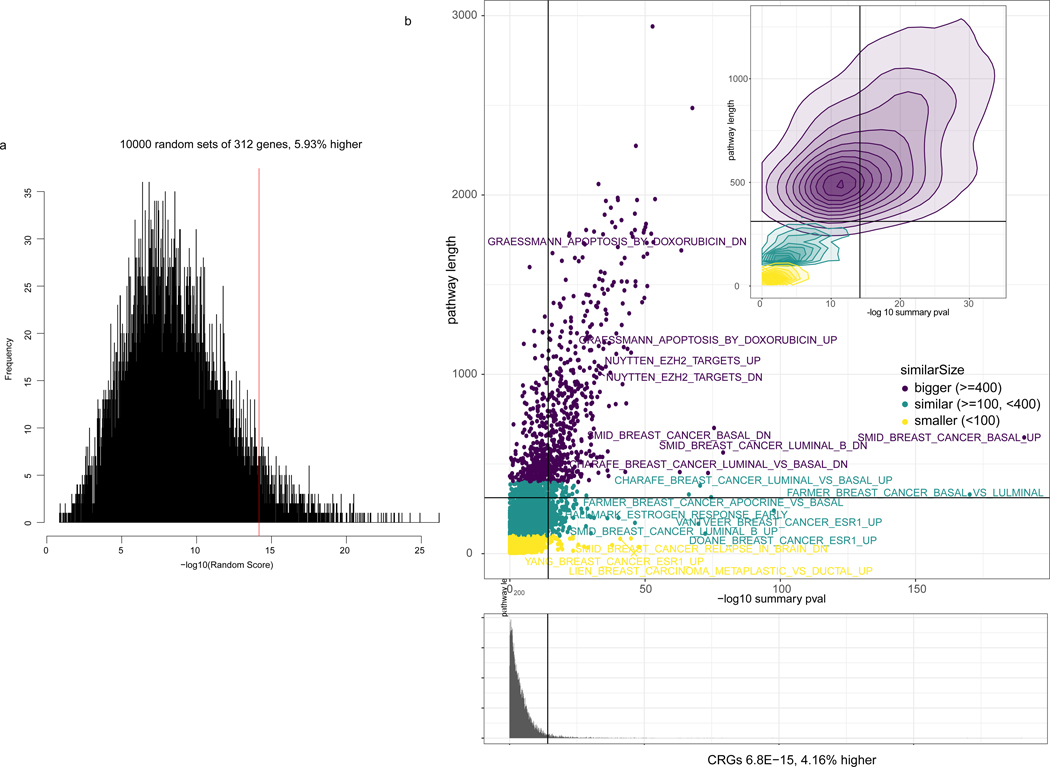
Extended Data Fig. 5: Enrichment of CRGs with response.
Enrichment of CRGs (summary p-value 6.8E-15, z-transform from survcomp package) with genes associated with anthracycline response. Panel A: 10,000 random signatures of size 312 association with outcome. CRGs are among the 6% (5.93%) highest associated. Panel B: MSigDB signatures associated with outcome. CRGs are among the 4.16% highest associatied. Colors represents the size of the signature. Summary p-values from the anthracycline vs non anthracycline cohort (N=760 individuals) Cox Proportional Hazards model of the interaction between drug and gene expression adjusted by clinical covariates as defined in Methods.
Extended Data Fig. 6: Complexes association with doxorubicin response.
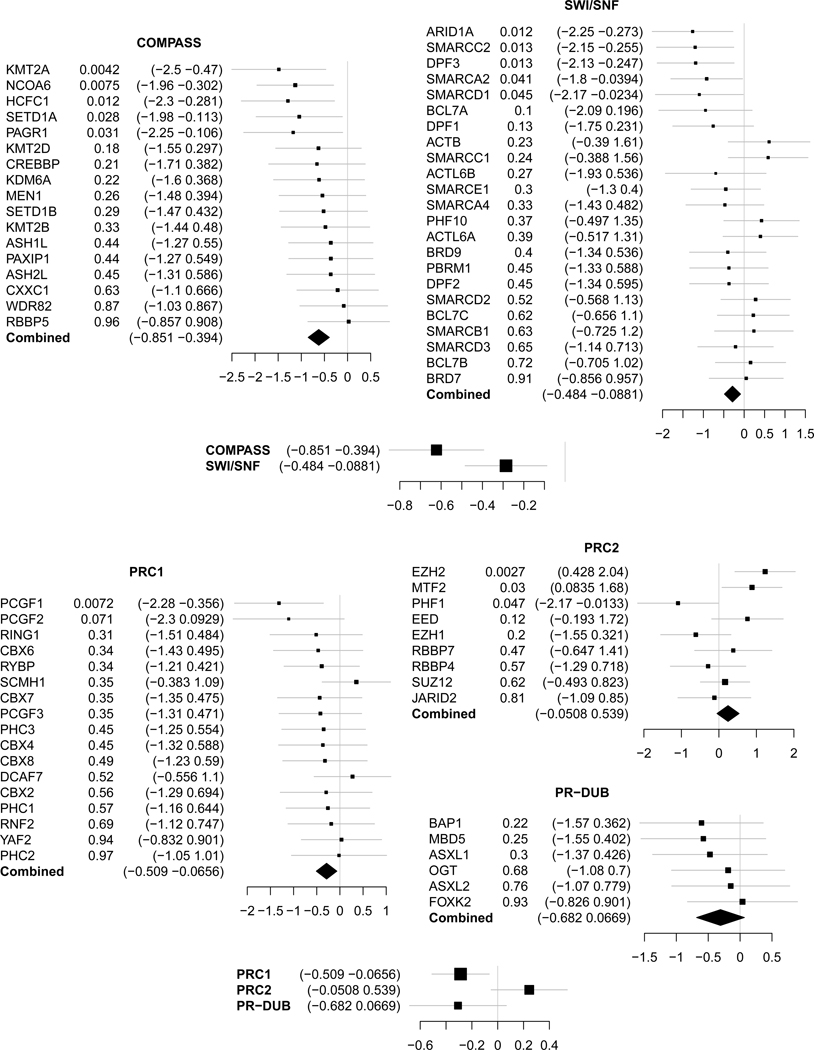
Hazard ratio of each of the members of thrytorax (Compass and SWI/SNF) and prc (PRC1, PRC2 and PR-DUB) complexes, and the summary statistic (summary p-value from the Cox Proportional Hazard of the interaction between drug and gene expression) for each of the complexes in the anthracycline vs non anthracycline cohort (N=760 individuals). The forest plots show the log-2 hazard ratios (boxes) and error bars represent 95% confidence intervals.
Extended Data Fig. 7: Correlation between clinical and in silico analysis.
Panels A, B, C: Venn diagrams illustrating the overlap between CRGs associated with anthracycline response in vitro based on VIPER (38 genes) and in vivo based on the Cox Proportional Hazard model in the breast cancer patient metacohort for different treatment regimens, as indicated. Panel D: Correlation between Heiser microarray dataset Normalized Enriched Score (NES) for each CRG from VIPER and the log hazard ratio for overall survival from the anthra vs non-anthra metacohort (N=760 individual samples). Labels represents the CRGs significant in VIPER. Here, r all represents the Pearson correlation across all CRGs and r 12 represents the Pearson correlation across the 12 common CRGs across clinical and VIPER analysis. Panel E: Significant CRGs across different treatment regimens. Significant CRGs across the anthracycline versus non-anthracycline, anthracycline versus CMF, and anthracycline versus taxanes comparisons are indicated. A total of 22 genes were significant across the 3 cohorts.
Extended Data Fig. 8: Anthracycline versus non-anthracycline comparisons by clinical subgroups.
Forest plots illustrate the difference in hazards of death (overall survival) among patients treated with anthracyclines versus those who were not treated with anthracyclines from the metacohort across the three clinical subgroups, namely ER+/Her2-, Her2+ and ER-/Her2- (triple-negative, TNBC) patients. P-values indicate the Cox Proportional Hazard interaction model among the two conditions and the expression of the gene, adjusted by age, size, lymph node positive, ER, PR and Her2 status (excluding ER and PR in ER+, Her2 in Her2+ and ER, PR and Her2 in TNBC). The forest plots show the log-2 hazard ratios (boxes) and error bars represent 95% confidence intervals.
Extended Data Fig. 9: Drug response, accessibility in controls, and transcription correlation in meta-cohort.
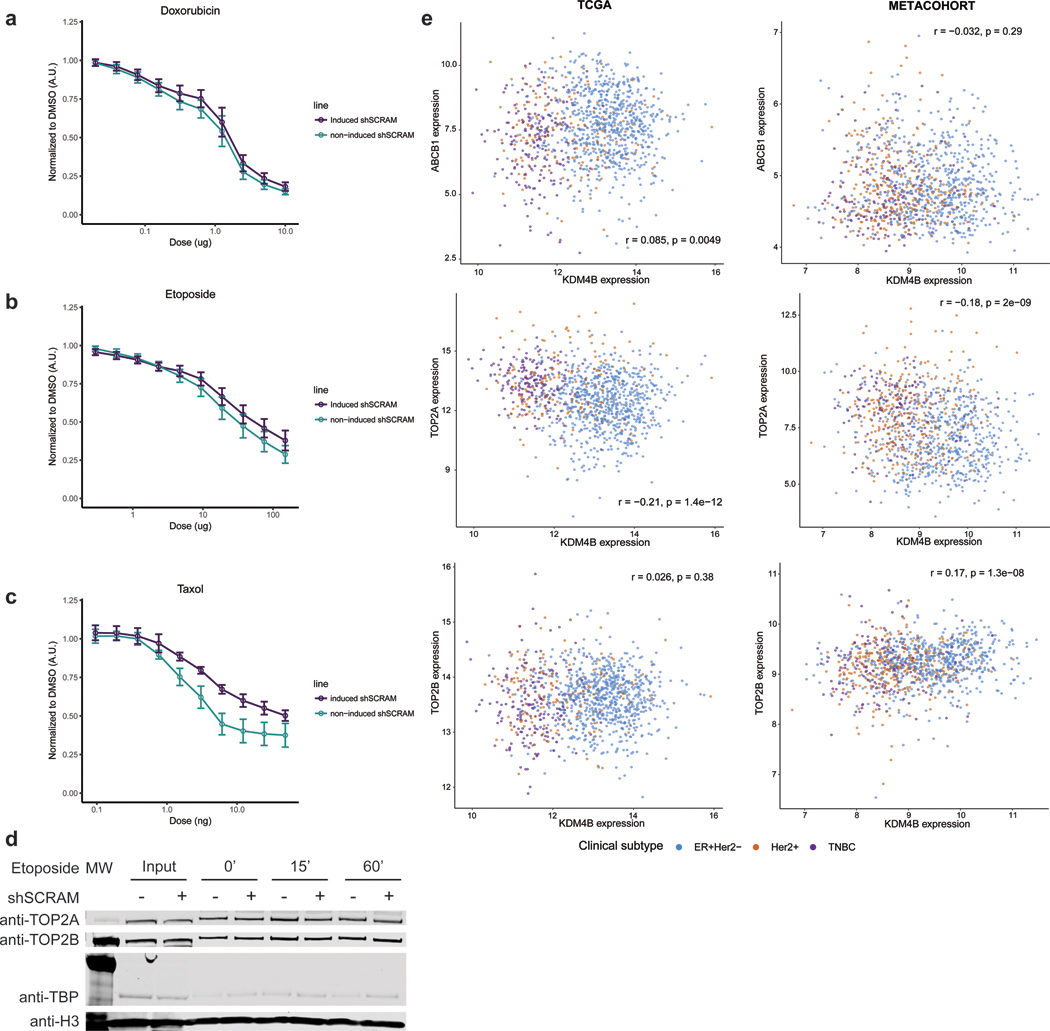
Panel A: Doxorubicin dose response in scrambled shRNA HCC1954 cells and non-induced HCC1954 cells normalized to DMSO vehicle. n=3 independent experiments. Center equals mean +/− s.e.m. Panel B: Etoposide dose response in scrambled shRNA HCC1954 cells and non-induced HCC1954 cells normalized to DMSO vehicle. n=3 independent experiments. Center equals mean +/− s.e.m. Panel C: Paclitaxel dose response in scrambled shRNA HCC1954 cells and non-induced HCC1954 cells normalized to DMSO vehicle. n=3 independent experiments. Center equals mean +/− s.e.m. Panel D: Western blot of Input Samples and resolubilized chromatin pellet after wash with 500mM NaCl from HCC1954 cells treated with etoposide for given time, +/− induction of shScramble control. Histone H3 is shown as a loading control. Experiments were repeated independently three times with similar results. See Source Data 2. Panel E: KDM4B expression correlations by subtype. Pearson correlation between expression of KDM4B and ABCB1 (top panels), TOP2A (center panel) and TOP2B (bottom panels) in the TCGA breast cancer cohort (left, N=1078 individuals) and the adjuvant breast cancer metacohort (right, N=760 individuals) reveals no significant trend.
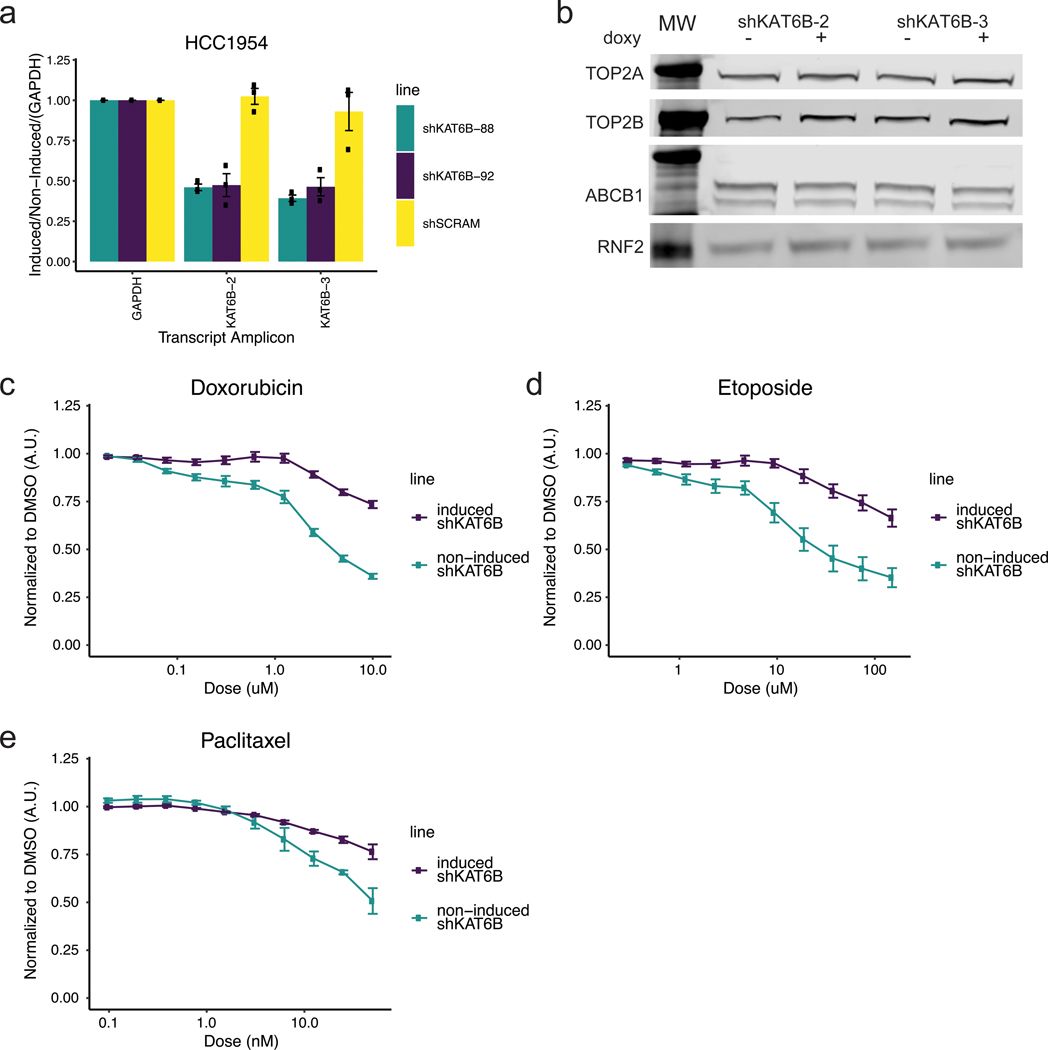
Extended Data Fig. 10: Functional evaluation of KAT6B as a mediator of anthracycline response in breast cancer cells.
Panel A: RT-qPCR on cDNA showing inducible shRNA knockdown of KAT6B with 2 unique shRNA sequences in the HCC1954 breast cancer cell line. n=3 independent experiments. Center value equals mean +/− s.e.m. Panel B: Western blot on whole cell extract showing non-induced or induced knockdown shRNA KAT6B with no concomitant loss of drug targets TOP2A and TOP2B or gain in the drug efflux pump ABCB1; RNF2 as a loading control. Experiments were repeated independently three times with similar results. See Source Data 3. Panel C: Doxorubicin dose response curves for KAT6B induced shRNAs (shRNA 2, 3) in HCC1954 cells and non-induced HCC1954 cells normalized to DMSO vehicle. Panel D: Etoposide dose response curve for KAT6B induced shRNAs (shRNA 2, 3) in HCC1954 cells and non-induced HCC1954 cells normalized to DMSO vehicle. Panel E: Paclitaxel dose response curve for KAT6B induced shRNAs (shRNA 2, 3) in HCC1954 cells and non-induced HCC1954 cells normalized to DMSO vehicle. n=4; 2 independent experiments of 2 independent shRNAs each for panels c-e. Center value is mean +/− s.e.m.
Supplementary Material
Acknowledgments
We thank breast cancer research advocates S. Brain, D. Heditsian and V. Lee for helpful discussions. We thank E. Chory for illustrating Figure 3a. The results shown here are in part based upon data generated by the TCGA Research Network: http://cancergenome.nih.gov/.
This work was supported in part by a Stanford Cancer Institute-Translational Research Award, Department of Defense grant (W81XWH-16–1-0084), and V Foundation for Cancer Research grant to CC and GRC. CC is also supported by by the NCI (U01CA217851) and the Breast Cancer Research Foundation. GRC is also supported by the HHMI. JS is supported by a Susan G. Komen Postdoctoral Fellowship PDF16377256. JGK is supported by PHS Grant Number T32 CA09151, awarded by the National Cancer Institute, DHHS. JLC is supported by an ASCO Young Investigator Award from the Conquer Cancer Foundation and a Damon Runyon Physician-Scientist Training Award.
Footnotes
Competing interests
G.R.C. is Founder and stockholder of Foghorn Therapeutics. C.C. is a scientific advisor to GRAIL and reports stock options, as well as consulting for GRAIL and Genentech. J.A.S., J.G.K., J.L.C.-J. declare no competing interests.
Data Availability
All data used in this study are available publicly. Clinical cohorts are available under the following GEO identifiers: GSE20685, GSE45255, GSE65194, GSE3494 and GSE1456. Cell line molecular and dose/response data is available from Costello et al. 6 and the PharmacoGX 38 package.
Code Availability
The code use for the analysis in this study was implemented using R v3.5.3 and is publicly available from the following repository: https://github.com/cancersysbio/chromatinAnthra.
References
- 1.Early Breast Cancer Trialists’ Collaborative, G., et al. Comparisons between different polychemotherapy regimens for early breast cancer: meta-analyses of long-term outcome among 100,000 women in 123 randomised trials. Lancet 379, 432–444 (2012). [DOI] [PMC free article] [PubMed] [Google Scholar]
- 2.Praga C, et al. Risk of acute myeloid leukemia and myelodysplastic syndrome in trials of adjuvant epirubicin for early breast cancer: correlation with doses of epirubicin and cyclophosphamide. J Clin Oncol 23, 4179–4191 (2005). [DOI] [PubMed] [Google Scholar]
- 3.Dykhuizen EC, et al. BAF complexes facilitate decatenation of DNA by topoisomerase IIalpha. Nature 497, 624–627 (2013). [DOI] [PMC free article] [PubMed] [Google Scholar]
- 4.Miller EL, et al. TOP2 synergizes with BAF chromatin remodeling for both resolution and formation of facultative heterochromatin. Nat Struct Mol Biol 24, 344–352 (2017). [DOI] [PMC free article] [PubMed] [Google Scholar]
- 5.Cancer Genome Atlas N Comprehensive molecular portraits of human breast tumours. Nature 490, 61–70 (2012). [DOI] [PMC free article] [PubMed] [Google Scholar]
- 6.Costello JC, et al. A community effort to assess and improve drug sensitivity prediction algorithms. Nat Biotechnol 32, 1202–1212 (2014). [DOI] [PMC free article] [PubMed] [Google Scholar]
- 7.Heiser LM, et al. Subtype and pathway specific responses to anticancer compounds in breast cancer. Proc Natl Acad Sci U S A 109, 2724–2729 (2012). [DOI] [PMC free article] [PubMed] [Google Scholar]
- 8.Hafner M, et al. Quantification of sensitivity and resistance of breast cancer cell lines to anti-cancer drugs using GR metrics. Sci Data 4, 170166 (2017). [DOI] [PMC free article] [PubMed] [Google Scholar]
- 9.Haverty PM, et al. Reproducible pharmacogenomic profiling of cancer cell line panels. Nature 533, 333–337 (2016). [DOI] [PubMed] [Google Scholar]
- 10.Barretina J, et al. The Cancer Cell Line Encyclopedia enables predictive modelling of anticancer drug sensitivity. Nature 483, 603–607 (2012). [DOI] [PMC free article] [PubMed] [Google Scholar]
- 11.Seashore-Ludlow B, et al. Harnessing Connectivity in a Large-Scale Small-Molecule Sensitivity Dataset. Cancer Discov 5, 1210–1223 (2015). [DOI] [PMC free article] [PubMed] [Google Scholar]
- 12.Iorio F, et al. A Landscape of Pharmacogenomic Interactions in Cancer. Cell 166, 740–754 (2016). [DOI] [PMC free article] [PubMed] [Google Scholar]
- 13.Mpindi JP, et al. Consistency in drug response profiling. Nature 540, E5–E6 (2016). [DOI] [PubMed] [Google Scholar]
- 14.Curtis C, et al. The genomic and transcriptomic architecture of 2,000 breast tumours reveals novel subgroups. Nature 486, 346–352 (2012). [DOI] [PMC free article] [PubMed] [Google Scholar]
- 15.Ciriello G, et al. Emerging landscape of oncogenic signatures across human cancers. Nat Genet 45, 1127–1133 (2013). [DOI] [PMC free article] [PubMed] [Google Scholar]
- 16.Margolin AA, et al. ARACNE: an algorithm for the reconstruction of gene regulatory networks in a mammalian cellular context. BMC Bioinformatics 7 Suppl 1, S7 (2006). [DOI] [PMC free article] [PubMed] [Google Scholar]
- 17.Aittokallio T & Schwikowski B Graph-based methods for analysing networks in cell biology. Brief Bioinform 7, 243–255 (2006). [DOI] [PubMed] [Google Scholar]
- 18.Morone F & Makse HA Influence maximization in complex networks through optimal percolation. Nature 524, 65–68 (2015). [DOI] [PubMed] [Google Scholar]
- 19.Alvarez MJ, et al. Functional characterization of somatic mutations in cancer using network-based inference of protein activity. Nat Genet 48, 838–847 (2016). [DOI] [PMC free article] [PubMed] [Google Scholar]
- 20.Li Y, et al. Amplification of LAPTM4B and YWHAZ contributes to chemotherapy resistance and recurrence of breast cancer. Nat Med 16, 214–218 (2010). [DOI] [PMC free article] [PubMed] [Google Scholar]
- 21.Nagalla S, et al. Interactions between immunity, proliferation and molecular subtype in breast cancer prognosis. Genome Biol 14, R34 (2013). [DOI] [PMC free article] [PubMed] [Google Scholar]
- 22.Kao KJ, Chang KM, Hsu HC & Huang AT Correlation of microarray-based breast cancer molecular subtypes and clinical outcomes: implications for treatment optimization. BMC Cancer 11, 143 (2011). [DOI] [PMC free article] [PubMed] [Google Scholar]
- 23.Miller LD, et al. An expression signature for p53 status in human breast cancer predicts mutation status, transcriptional effects, and patient survival. Proc Natl Acad Sci U S A 102, 13550–13555 (2005). [DOI] [PMC free article] [PubMed] [Google Scholar]
- 24.Pawitan Y, et al. Gene expression profiling spares early breast cancer patients from adjuvant therapy: derived and validated in two population-based cohorts. Breast Cancer Res 7, R953–964 (2005). [DOI] [PMC free article] [PubMed] [Google Scholar]
- 25.Maire V, et al. Polo-like kinase 1: a potential therapeutic option in combination with conventional chemotherapy for the management of patients with triple-negative breast cancer. Cancer Res 73, 813–823 (2013). [DOI] [PubMed] [Google Scholar]
- 26.Rothwell PM Treating individuals 2. Subgroup analysis in randomised controlled trials: importance, indications, and interpretation. Lancet 365, 176–186 (2005). [DOI] [PubMed] [Google Scholar]
- 27.Fillmore CM, et al. EZH2 inhibition sensitizes BRG1 and EGFR mutant lung tumours to TopoII inhibitors. Nature 520, 239–242 (2015). [DOI] [PMC free article] [PubMed] [Google Scholar]
- 28.Wilson BG, et al. Epigenetic antagonism between polycomb and SWI/SNF complexes during oncogenic transformation. Cancer Cell 18, 316–328 (2010). [DOI] [PMC free article] [PubMed] [Google Scholar]
- 29.Schuettengruber B, Bourbon HM, Di Croce L & Cavalli G Genome Regulation by Polycomb and Trithorax: 70 Years and Counting. Cell 171, 34–57 (2017). [DOI] [PubMed] [Google Scholar]
- 30.Hodges HC, et al. Dominant-negative SMARCA4 mutants alter the accessibility landscape of tissue-unrestricted enhancers. Nat Struct Mol Biol 25, 61–72 (2018). [DOI] [PMC free article] [PubMed] [Google Scholar]
- 31.King HW, Fursova NA, Blackledge NP & Klose RJ Polycomb repressive complex 1 shapes the nucleosome landscape but not accessibility at target genes. Genome Res (2018). [DOI] [PMC free article] [PubMed] [Google Scholar]
- 32.Blum JL, et al. Anthracyclines in Early Breast Cancer: The ABC Trials-USOR 06–090, NSABP B-46-I/USOR 07132, and NSABP B-49 (NRG Oncology). J Clin Oncol 35, 2647–2655 (2017). [DOI] [PMC free article] [PubMed] [Google Scholar]
- 33.Sparano JA, et al. Adjuvant Chemotherapy Guided by a 21-Gene Expression Assay in Breast Cancer. N Engl J Med 379, 111–121 (2018). [DOI] [PMC free article] [PubMed] [Google Scholar]
- 34.Sparano JA, et al. Prospective Validation of a 21-Gene Expression Assay in Breast Cancer. N Engl J Med 373, 2005–2014 (2015). [DOI] [PMC free article] [PubMed] [Google Scholar]
- 35.Paik S, et al. Gene expression and benefit of chemotherapy in women with node-negative, estrogen receptor-positive breast cancer. J Clin Oncol 24, 3726–3734 (2006). [DOI] [PubMed] [Google Scholar]
- 36.Cardoso F, et al. 70-Gene Signature as an Aid to Treatment Decisions in Early-Stage Breast Cancer. N Engl J Med 375, 717–729 (2016). [DOI] [PubMed] [Google Scholar]
References from Methods
- 37.Love MI, Huber W & Anders S Moderated estimation of fold change and dispersion for RNA-seq data with DESeq2. Genome Biol 15, 550 (2014). [DOI] [PMC free article] [PubMed] [Google Scholar]
- 38.Smirnov P, et al. PharmacoGx: an R package for analysis of large pharmacogenomic datasets. Bioinformatics 32, 1244–1246 (2016). [DOI] [PubMed] [Google Scholar]
- 39.Ritchie ME, et al. limma powers differential expression analyses for RNA-sequencing and microarray studies. Nucleic Acids Res 43, e47 (2015). [DOI] [PMC free article] [PubMed] [Google Scholar]
- 40.Gautier L, Cope L, Bolstad BM & Irizarry RA affy--analysis of Affymetrix GeneChip data at the probe level. Bioinformatics 20, 307–315 (2004). [DOI] [PubMed] [Google Scholar]
- 41.Johnson WE, Li C & Rabinovic A Adjusting batch effects in microarray expression data using empirical Bayes methods. Biostatistics 8, 118–127 (2007). [DOI] [PubMed] [Google Scholar]
- 42.Desmedt C, et al. Biological processes associated with breast cancer clinical outcome depend on the molecular subtypes. Clin Cancer Res 14, 5158–5165 (2008). [DOI] [PubMed] [Google Scholar]
- 43.Haibe-Kains B, et al. A three-gene model to robustly identify breast cancer molecular subtypes. J Natl Cancer Inst 104, 311–325 (2012). [DOI] [PMC free article] [PubMed] [Google Scholar]
- 44.Aydin OZ, Vermeulen W & Lans H ISWI chromatin remodeling complexes in the DNA damage response. Cell Cycle 13, 3016–3025 (2014). [DOI] [PMC free article] [PubMed] [Google Scholar]
- 45.Oppikofer M, et al. Expansion of the ISWI chromatin remodeler family with new active complexes. EMBO Rep 18, 1697–1706 (2017). [DOI] [PMC free article] [PubMed] [Google Scholar]
- 46.Lai AY & Wade PA Cancer biology and NuRD: a multifaceted chromatin remodelling complex. Nat Rev Cancer 11, 588–596 (2011). [DOI] [PMC free article] [PubMed] [Google Scholar]
- 47.Morrison AJ & Shen X Chromatin remodelling beyond transcription: the INO80 and SWR1 complexes. Nat Rev Mol Cell Biol 10, 373–384 (2009). [DOI] [PMC free article] [PubMed] [Google Scholar]
- 48.Hauri S, et al. A High-Density Map for Navigating the Human Polycomb Complexome. Cell Rep 17, 583–595 (2016). [DOI] [PubMed] [Google Scholar]
- 49.Losada A Cohesin in cancer: chromosome segregation and beyond. Nat Rev Cancer 14, 389–393 (2014). [DOI] [PubMed] [Google Scholar]
- 50.Hirano T Condensins: universal organizers of chromosomes with diverse functions. Genes Dev 26, 1659–1678 (2012). [DOI] [PMC free article] [PubMed] [Google Scholar]
- 51.Talbert PB, et al. A unified phylogeny-based nomenclature for histone variants. Epigenetics Chromatin 5, 7 (2012). [DOI] [PMC free article] [PubMed] [Google Scholar]
- 52.Cirillo LA, et al. Opening of compacted chromatin by early developmental transcription factors HNF3 (FoxA) and GATA-4. Mol Cell 9, 279–289 (2002). [DOI] [PubMed] [Google Scholar]
- 53.Lachmann A, Giorgi FM, Lopez G & Califano A ARACNe-AP: gene network reverse engineering through adaptive partitioning inference of mutual information. Bioinformatics 32, 2233–2235 (2016). [DOI] [PMC free article] [PubMed] [Google Scholar]
- 54.Haibe-Kains B, Desmedt C, Sotiriou C & Bontempi G A comparative study of survival models for breast cancer prognostication based on microarray data: does a single gene beat them all? Bioinformatics 24, 2200–2208 (2008). [DOI] [PMC free article] [PubMed] [Google Scholar]
- 55.Sergushichev AA An algorithm for fast preranked gene set enrichment analysis using cumulative statistic calculation. bioRxiv (2016). [Google Scholar]
- 56.Hothorn T & Zeileis A Generalized maximally selected statistics. Biometrics 64, 1263–1269 (2008). [DOI] [PubMed] [Google Scholar]
- 57.Tiscornia G, Singer O & Verma IM Design and cloning of lentiviral vectors expressing small interfering RNAs. Nat Protoc 1, 234–240 (2006). [DOI] [PubMed] [Google Scholar]
- 58.Schmittgen TD & Livak KJ Analyzing real-time PCR data by the comparative C(T) method. Nat Protoc 3, 1101–1108 (2008). [DOI] [PubMed] [Google Scholar]
Associated Data
This section collects any data citations, data availability statements, or supplementary materials included in this article.


