

Abstract
Medicinal herbs comprise of heavy microbial contaminations. This study aimed to assess microbial hazards including foodborne pathogens in 20 commercial medicinal herbs, Cnidii Rhizoma (C1–C10) and Alismatis Rhizoma (T1–T10) as well as to evaluate irradiation effects of E-beam on microbial load and detection chracteristics. Four samples (C5, C10, T1, T8) from both herbs with higher microbial load were selected for evaluating the irradiation effect of E-beam (up to 10 kGy) on microbial load and radiation-induced changes in detection markers by standard methods (Codex, Korean Food Code), such as direct epifluorescent filter technique/aerobic plate count (DEFT/APC), photostimulated luminescence (PSL), thermoluminescence (TL), and electron spin resonance (ESR). DEFT/APC revealed non-evidence of pre-sterilization of all samples. PSL differentiated irradiated samples (1, 5, and 10 kGy) of both herbs from non-irradiated (control: 0 kGy). Both TL and ESR methods validated PSL screening results by detecting radiation-induced markers from E-beam irradiated medicinal herbs.
Keywords: Medicinal herb, Microbial load, DEFT/APC, Luminescence, ESR
Introduction
The use of herbs as natural remedies as part of human cultures has been reported since ancient times. Secondary metabolites or active ingredients in herbal plants usually exhibit significant therapeutic potential which can be utilized to cure disease in human and animals as alternative of conventional medicines. Herb-based medicine formulation is a multibillion-dollar industry which has grown rapidly in recent years owing to increased interest on global scale regarding the use of herbal and organic medicines from natural products (MFDS, 2017; Pan et al., 2014). Moreover, purified extracts of various plants have been reported to exhibit significant antimicrobial activities against pathogenic microbes and as natural remedy to fight lifestyle-related disordes, such as obesity, cancer, diabetes, dementia and hypertension (Ernst, 2002). Traditional herbs are usually processed through various preparatory techniques like concoction to treat wide range of ailments, such as cough, neonatal fistula, diarrhea, skin diseases and improvement of immune system. Mostly these herbal preparations are presented in form of concoctions (drinks or soups manufactured from plant ingredients by boiling) or infusions (plants are usually immersed in water to prepare aqueous extracts followed by drying to get extracts of high quality) (Pan et al., 2014; Zhang et al., 2016). During agronomic operations, microorganisms may get introduced into shoots, roots and leaves of plant materials and further post-harvest processing may also cause additional microbial contamination as only washing is the vastly employed decontamination technique which is mostly inadequate to reduce microbial loads on herbal plant materials (Pan et al., 2014). Cnidii Rhizoma (CR) (a form of dried root from Cnidium officinale) and Alismatis Rhizoma (AR) (obtained in the form of dried root from Alisma orientale) are examples of medicinal herbs that are generally sprayed with different pesticides to prevent infestation by insects and microbial contamination (Choi et al., 2011). Other examples of notable herbal medicinal therapies include Artemisinin (Artemisia annua) as an effective remedy against malaria, Stevia (Stevia rebaudiana Bertoni) as natural alternative of sucrose and artificial sweeteners to combat obesity and cancer (Ameer et al., 2017), Jiang Tang Xiao Ke (JTXK) granule as an antidiabetic (Zhang et al., 2016) and Ginseng (Panax ginseng) as most famous traditional medicinal herb with proven health benefits along with Ginkgo (Ginkgo biloba), St. John’s Wort (Hypericum perforatum), Echinacea (Echinacea purpurea), Saw Palmetto (Serenoa repens) and Kava (Piper methysticum) (Ernst, 2002). CR is medicinal herb used extensively in the world for sinusitis, irregular menstruation, and gynecological conditions because it has antioxidant activity and anti-inflammatory activity (Jeong et al., 2009; Or et al., 2011). AR is also a medicinal herb that has anti-inflammatory, anticancer, and antidiabetic effects (Han et al., 2013).
Food irradiation as non-thermal technology is being currently practiced in approximately 60 countries to treat various food commodities for multiple purposes, such as enhancement of shelf-life, delay in ripening, microbial decontamination, and sprout inhibition (Akram et al., 2012; Jo et al., 2018a). Availability of adequate scientific knowledge by ensuring appropriate labeling of irradiated food commodities may facilitate enhancement of consumer confidence (Jo et al., 2018b). Rapid screening of irradiated foods is usually done by screening methods, however, it is mandatory to further validate the irradiation status of screened foods by employing approved validation methods (Akram et al., 2012). Direct epifluorescent filter technique/aerobic plate count (DEFT/APC) and photostimulated luminescence (PSL) are usually performed for screening irradiated food commodities (EN 13751, 2002; EN 13783, 2001). Electron spin resonance (ESR) spectroscopy and thermoluminescence (TL) analysis have been utilized as the European standard methods for performing validations. ESR spectroscopy has become widely popular worldwide as a non-destructive technique for identifying irradiated foodstuffs on basis of free radical and paramagnetic ion detection in food matrices. Free radicals are assayed by ESR spectroscopy which are produced as a result of transition or paramagnetic ions in the main group elements (Akram et al., 2012). TL is regarded as the most reliable validation method for foods comprising of silicate minerals and therefore, chief advantage is provision of higher sensitivity and good signals stability during extended storage. Normalization step usually provides valid history of irradiation status and makes TL a reliable method with improved sensitivity even at minerals deposition at very low concentrations. Post-irradiation time extension may lead to signal diminishing and dependence on mineral dust are two of main disadvantages of TL technique (Chauhan et al., 2009). On the other hand, ESR spectroscopy is most favorable method for bone-based low-moisture and powdered products and therefore, it has prime relevance a qualitative estimation and validation technique and serves as the most reliable alternative to chemoluminescence method. High moisture levels may lead to degradation of ESR signal sensitty or may render it ineffective (Akram et al., 2012; Chauhan et al., 2009).
In this study, 20 commercial medicinal herb samples (10 of CR; 10 of AR) were used for assessing their microbial contamination level including pathogenic microorganisms. Selected herb samples with higher microbial loads were subjected to further investigation of E-beam irradiation effect on microbial reduction and radiation-induced changes in detection markers for irradiated samples by employing European standard methods: DEFT/APC and PSL for screening irradiation status and TL and ESR for a confirmatory identification of the corresponding screening results.
Materials and methods
Sample preparation and irradiation treatment
Medicinal herbs (CR and AR) were purchased from Kyungdong and Yangnyeong markets of Daegu, Korea. These medicinal herbs were originally packed in polyethylene bags (600 g/pack unit). The products were coded as C1-C10 (CR) and T1-T10 (AR). All 20 commercial samples were subjected to microbial analysis, and some herb samples with the highest microbial load and contaminated with Staphylococcus aureus (S. aureus) were selected for subsequent E-beam irradiation treatment. E-beam irradiation was carried out using a high-energy linear accelerator (LINAC ELV-4, 10 MeV, 10 kW, EB Tech., Daejeon, Korea) at doses of 0, 1, 5, and 10 kGy. The irradiated samples were subjected to freeze-storage at − 18 °C until further use for experiments. Absorbed doses were calibrated using alanine dosimeter reader (diameter, 5 mm; Bruker BioSpin GmbH, Bremen, Germany). Determination of free radicals was performed using EPR analyzer (EMS 104, Bruker Biospin, Rheinstetten, Germany).
Microbial quality analysis of medicinal herbs
Microbial quality was evaluated according to the standard methods of APHA (1978). Homogenization of 10 g of each sample was performed for 2 min in a sterile stomacher bag using a stomacher (Bagmixer® 400, Interscience Co., Saint Nom, France). Serial decimal dilutions were prepared using the same diluent and culture media; for total aerobic bacteria (TAB), yeasts and molds (Y&M), and coliforms, plate count agar (Merck KGaA, Darmstadt, Germany), potato dextrose agar (Merck), and xylose lysine deoxycholate agar (Merck), respectively. For the culture, the TAB and coliform plates were incubated at 32 °C for 24 h and 48 h, respectively, whereas those of Y&M were incubated at 25 °C for 7 days. The colony-forming units (CFU) were counted for both medicinal herbs at a CFU range of 30–300 on the plates; furthermore, CFU/g of medicinal herbs were calculated.
Escherichia coli, Salmonella spp., and Pseudomonas aeruginosa were analyzed according to the Korean Pharmacopoeia (KP, MFDS, 2013). Suspected colonies isolated from each selective medium were submitted for biochemical identification, as described in KP, and confirmed using the API kit (bioMerieux Ind., Marcy I’Etoile, France). Enumeration of S. aureus was carried out using Petrifilm Staph Express Count Plates (3 M, Minnesota, USA) according to manufacturer’s instructions.
DEFT/APC analysis
DEFT takes into account the cumulative number of contaminating microbes when viable microbes are excluded in the analyzed samples. On the other hand, APC is an indicative count of viable microbes and is presented as CFU/g. 10 g of each sample was suspended in flasks containing 90 mL of peptone saline; the sample mixture was shaken vigorously for 30 s. This suspension was diluted by logarithmic dilution series (101–107 times). For DEFT analysis, a polycarbonate filter (0.6 μm) (Whatman; GE Healthcare, Pittsburgh, PA, USA), equipped with a prefilter (10 μm: Sterlitech Corp., Kent, WA, USA), was employed for filtering each diluted solution through a manifold tower. After filtration, staining and rinsing was carried out. Plates were incubated at 32 °C for 72 h; subsequently, APC counts were enumerated and expressed as log10 CFU/g. The DEFT count (X) per gram of medicinal herbs was calculated by using the mean number of DEFT units per microscope field (N/n), the dilution factor (DF) of the sample, and the microscopic factor (MF) of the sample as shown in Eq. (1).
| 1 |
Logarithmic values of DEFT counts were recorded. Eventually, the difference between the DEFT and APC counts was obtained by subtracting logarithmic values of both APC and DEFT counts.
PSL analysis
EN 13751 guidelines were utilized for conducting PSL analysis of medicinal herbs. Petri dishes (diameter, 50 mm) (Bibby Sterilin type 122, Glasgow, UK) were utilized for dispensing samples. According to EN 13751 guidelines, PSL photon counts (PCs) were measured under subdued light conditions. False-positive results were prevented by running empty chamber tests in a periodic manner. The photon counts were recorded as follows: negative; T1 < 700 PCs/60 s, intermediate [between 700 and 5000 PCs/60 s] or T2 [positive; > 5000 PCs/60 s] as per EN 13751 guidelines.
TL analysis
According to the EN 1788 standard, TL is a reliable technique for detecting irradiated foodstuffs. The standard TL method requires physical separation of minerals from the food matrix by application of high-density sodium polytungstate solution. In our experiments, isolation of silicate minerals from CR and AR samples was carried out by means of a density gradient technique. TL measurements were performed using a 4500 TL Reader (Harshaw, Germany) as per EN 1788 guidelines.
Electron spin resonance (ESR) analysis
ESR quartz tubes were utilized and each sample amount of approximately 0.1 g was collected in quartz tubes in the pulverized form (< 1 mm). The protocol EN 1788 was followed while performing ESR spectroscopy using a X-band ESR spectrometer (JES-TE 300, Jeol Co., Tokyo, Japan) at an ambient room temperature. The operational conditions were as follows: power, 0.4 mW; sweep width of 8 mT; modulation amplitude, 0.4 mT; sweep time, 30 s; time constant, 0.03 s.
Statistical analysis
All experiments were conducted in triplicate, and data was analyzed using Origin 8.6 (Microcal Software Inc., Northampton, MA, USA), Microsoft Excel (version 2013) and SAS (version 9.4, SAS Institute, Cary, NC, USA) softwares using one-way analysis of variance (ANOVA). The experimental data were presented as mean ± standard deviation (S.D.). In case of PSL measurements, all samples including control were subjected to five replications (n = 5). All measurements were recorded as mean ± S.D. for 5 repetitions. Whereas, measurements from all other experiments were recorded in triplicate manner (n = 3). The difference between the means was compared by applying Duncan’s multiple range test (p < 0.05).
Results and discussion
Microbial qualities of medicinal herbs and E-beam irradiation effect thereof
Both medicinal herb samples showed variability in levels of microbial contamination including those of pathogenic microbes (Table 1). The levels of TAB, Y&M, and coliforms in CR were 2.98–7.33, 2.39–4.98, and 0–3.97 log CFU/g and those in AR were 2.70–3.95, 2.90–3.94 and 0–2.18 log CFU/g, respectively. C4, C10, T1, and T8 samples of medicinal herbs exhibited the highest levels of microbial contamination. Among them, C4 and T8 were irradiated with E-beam to confirm that microorganisms were reduced. The probable reason of highest microbial load (7.33 log CFU/g) might result due to direct effect of production and primary processing on microbial quality of herbal medicines. Also, the microbial contamination of herbs and/or products may result from improper handling during production and packaging. The most likely sources of contamination are microbes from the ground and processing facilities (contaminated air, microbes of human origin) (Duraisankar and Ravindran, 2013). Moreover, it cannot be excluded that extraneous matter and filthy material originating from rodents, insects, inorganic source, human excrement, animal manure, faeces used as fertilizers may adhere to plants materials or cause microbial contamination in herbal preparations. The microbial load depends relatively upon temperature, humidity, handling and storage practices of both the crude and processed medicinal plant materials (Duraisankar and Ravindran, 2013). Overall, the population of general microorganisms were higher in CR than in AR, which was effectively reduced by E-beam irradiation (3–4 log reduction at 5 kGy); such irradiation resulted in acceptable levels of TAB and Y&M at < 3.0 log CFU/g and complete elimination of coliforms (Witkowaska et al., 2011). On the other hand, the results that the presence of E. coli, Salmonella spp., and P. aeruginosa were negative but that of S. aureus was positive in few samples of both the herbs. Among all 20 samples, samples C4, C7, T3, T7, T8, and T10 showed positive contamination with S. aureus (1.48–2.48 log CFU/g), which was reduced by E-beam irradiation (0, 1, 5, and 10 kGy); C4 sample showed a reduction to a non-detectable level at 1 kGy, and T8 sample showed reduction to a non-detectable level at 5 kGy. E-beam irradiation at ≤ 5 kGy effectively reduced the levels of the foodborne pathogen S. aureus, as shown in Fig. 1. Jaczynski and Park (2003) reported that E-beam treatment at 2 kGy resulted in a 6.1-log reduction and complete elimination of S. aureus was observed at 4 kGy.
Table 1.
Microbial qualities of commercial Cnidii Rhizoma (CR) and Alismatis Rhizoma (AR)
| Sample no. | |||||||||||
|---|---|---|---|---|---|---|---|---|---|---|---|
| C1 | C2 | C3 | C4 | C5 | C6 | C7 | C8 | C9 | C10 | ||
| CR | Total aerobic bacteria | 3.33a ± 0.01b | 4.00 ± 0.00 | 4.53 ± 0.00 | 6.16 ± 0.00 | 3.59 ± 0.00 | 4.55 ± 0.00 | 2.98 ± 0.00 | 4.36 ± 0.00 | 5.42 ± 0.01 | 7.33 ± 0.01 |
| Yeasts & molds | 2.39 ± 0.00 | 4.41 ± 0.00 | 3.02 ± 0.01 | 4.02 ± 0.00 | 3.67 ± 0.00 | 4.98 ± 0.01 | 4.42 ± 0.00 | 3.13 ± 0.00 | 4.55 ± 0.00 | 3.00 ± 0.01 | |
| Coliforms | 2.39 ± 0.01 | 0 ± 0.00 | 2.14 ± 0.00 | 3.97 ± 0.00 | 1.97 ± 0.00 | 2.03 ± 0.00 | 0 ± 0.00 | 1.70 ± 0.00 | 1.99 ± 0.00 | 3.06 ± 0.01 | |
| E. coli | −c | − | − | − | − | − | − | − | − | − | |
| Salmonella spp. | − | − | − | − | − | − | − | − | − | − | |
| P. aeruginosa | − | − | − | − | − | − | − | − | − | − | |
| S. aureus | 0 ± 0.00 | 0 ± 0.00 | 0 ± 0.00 | 2.48 ± 0.01 | 0 ± 0.00 | 0 ± 0.00 | 1.70 ± 0.00 | 0 ± 0.00 | 0 ± 0.00 | 0 ± 0.00 | |
| T1 | T2 | T3 | T4 | T5 | T6 | T7 | T8 | T9 | T10 | ||
|---|---|---|---|---|---|---|---|---|---|---|---|
| AR | Total aerobic bacteria | 3.95 ± 0.00 | 2.70 ± 0.00 | 3.48 ± 0.00 | 3.71 ± 0.00 | 3.04 ± 0.00 | 3.04 ± 0.00 | 3.08 ± 0.00 | 3.30 ± 0.00 | 2.70 ± 0.00 | 3.30 ± 0.00 |
| Yeasts & molds | 3.32 ± 0.01 | 3.00 ± 0.00 | 3.70 ± 0.01 | 3.94 ± 0.01 | 2.90 ± 0.00 | 2.90 ± 0.00 | 3.30 ± 0.01 | 3.26 ± 0.00 | 2.30 ± 0.00 | 3.04 ± 0.00 | |
| Coliforms | 2.18 ± 0.00 | 0 ± 0.00 | 0 ± 0.00 | 0 ± 0.00 | 1.30 ± 0.00 | 1.70 ± 0.01 | 1.95 ± 0.00 | 1.60 ± 0.01 | 1.90 ± 0.01 | 1.30 ± 0.00 | |
| E. coli | − | − | − | − | − | − | − | − | − | − | |
| Salmonella spp. | − | − | − | − | − | − | − | − | − | − | |
| P. aeruginosa | − | − | − | − | − | − | − | − | − | − | |
| S. aureus | 0 ± 0.00 | 0 ± 0.00 | 1.48 ± 0.00 | 0 ± 0.00 | 0 ± 0.00 | 0 ± 0.00 | 1.70 ± 0.00 | 1.70 ± 0.00 | 0 ± 0.00 | 1.90 ± 0.00 | |
aLog CFU/g
bValues are expressed as mean ± standard deviation (n = 3)
c+: Positive; −: Negative
Fig. 1.
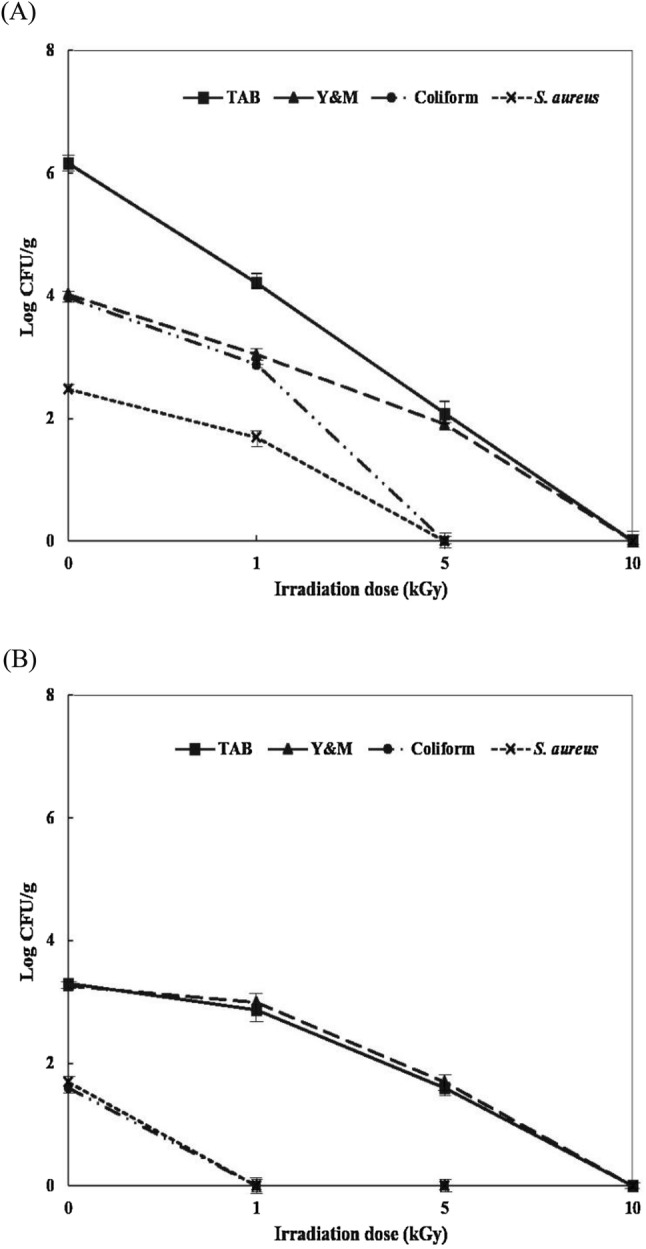
Reductions of TAB, Y&M, Coliform, and S. aureus counts in E-beam irradiated CR (A C4 sample) and AR (B T8 sample)
Pre-sterilization screening by DEFT/APC enumeration
The logarithmic DEFT/APC (D/A) ratios for both CR and AR samples were found to be in the range of 0.48–2.67 and 1.37–1.99, respectively (Table 2). D/A ratios for all samples of both medicinal herbs were < 4 log CFU/g, which confirmed the lack of application of any type of pre-sterilization or irradiation treatments in case of both samples. DEFT/APC screening is not solely limited to the specificity of irradiation treatment, and according to Ahn et al. (2013), this is one of the prominent limitations of DEFT/APC method for screening purposes. In a broad perspective, DEFT/APC method has potential to be applied for screening of foodstuffs that may have been subjected to irradiation as pre-sterilization treatment, and a logarithmic difference of D/A ratio of 2.0 may possibly serve as an indication for sample irradiation, as reported by Araújo et al. (2009). In this regard, various published articles have reported that this difference ranges from 2.0 to 3.0 for mixed food commodities (fresh paprika, red pepper powder, black pepper, and cinnamon) (Ahn et al., 2013) and irradiated vegetables (Araújo et al., 2009).
Table 2.
DEFT/APC results of commercial Cnidii Rhizoma (CR) and Alismatis Rhizoma (AR)
| Sample no. | |||||||||||
|---|---|---|---|---|---|---|---|---|---|---|---|
| C1 | C2 | C3 | C4 | C5 | C6 | C7 | C8 | C9 | C10 | ||
| CR | DEFT | 6.00a ± 0.03b | 5.12 ± 0.01 | 5.89 ± 0.03 | 7.26 ± 0.00 | 6.25 ± 0.00 | 5.03 ± 0.03 | 5.00 ± 0.06 | 4.88 ± 0.02 | 6.70 ± 0.00 | 8.70 ± 0.01 |
| APC | 3.33 ± 0.01 | 4.00 ± 0.00 | 4.53 ± 0.00 | 6.16 ± 0.00 | 3.59 ± 0.00 | 4.55 ± 0.00 | 2.98 ± 0.00 | 4.36 ± 0.00 | 5.42 ± 0.01 | 7.33 ± 0.01 | |
| D/A ratio | 2.67 ± 0.03 | 1.13 ± 0.02 | 1.37 ± 0.02 | 1.10 ± 0.00 | 2.66 ± 0.00 | 0.48 ± 0.03 | 2.02 ± 0.07 | 0.53 ± 0.01 | 1.29 ± 0.00 | 1.38 ± 0.01 | |
| T1 | T2 | T3 | T4 | T5 | T6 | T7 | T8 | T9 | T10 | ||
|---|---|---|---|---|---|---|---|---|---|---|---|
| AR | DEFT | 5.84 ± 0.02 | 4.21 ± 0.04 | 5.26 ± 0.03 | 5.37 ± 0.00 | 4.68 ± 0.00 | 4.41 ± 0.01 | 4.72 ± 0.01 | 4.96 ± 0.02 | 4.69 ± 0.03 | 4.89 ± 0.00 |
| APC | 3.95 ± 0.00 | 2.70 ± 0.00 | 3.48 ± 0.00 | 3.71 ± 0.00 | 3.04 ± 0.00 | 3.04 ± 0.00 | 3.08 ± 0.00 | 3.30 ± 0.00 | 2.70 ± 0.00 | 3.30 ± 0.00 | |
| D/A ratio | 1.88 ± 0.01 | 1.51 ± 0.03 | 1.78 ± 0.03 | 1.67 ± 0.00 | 1.64 ± 0.00 | 1.37 ± 0.01 | 1.64 ± 0.01 | 1.65 ± 0.02 | 1.99 ± 0.02 | 1.58 ± 0.00 | |
aLog CFU/g
bThe values are expressed as mean ± standard deviation (n = 3)
PSL screening characteristics for irradiated medicinal herbs
European Committee for Standardization (CEN) adopted PSL as the standard screening protocol for irradiated food commodities, such as seasoning, shellfish, herbs, and spices as defined by EN 13751 standard. Mineral debris found in food matrices usually comprises silicate minerals and inorganic particulate matter (quartz, calcite, and feldspar) which store energy upon exposure to irradiation treatment. This stored energy is released upon photo-excitation at particular wavelengths (Jo et al., 2018b). The results of PSL screening characteristics are given in Table 3, where PSL responses for the characterization of irradiated samples of both medicinal herbs were recorded on basis of changes in PSL after exposure to E-beam irradiation at different applied doses (EN 13751, 2002). Control (0 kGy) samples of both CR and AR showed negative status (< 700 PCs/60 s), whereas the irradiated samples (1, 5, and 10 kGy) of both medicinal herbs were found to be positive for PCs (> 5000/60 s); furthermore, even the PCs were considerably higher in samples of both medicinal herbs exposed to the lowest dose of 1 kGy in comparison compared with the control samples. PCs are indicators of PSL signal intensity and PCs in irradiated samples increased with corresponding increases in applied irradiation dose from 1 to 10 kGy. By complying with the guidelines of EN 13751 (2002), PSL ratios of all samples were calculated. Non-irradiated (control) samples of both medicinal herbs showed PSL ratios of > 10; hence, they were successfully screened and determined to be non-irradiated, whereas the irradiated samples exhibited PSL ratios of < 10 and were identified as irradiated. PSL signals arise as a result of photostimulation of mineral dust present in dispensed samples; hence, PSL signal intensity serves as a clear indicator of irradiation status. Furthermore, PSL sensitivity is also dependent on an inherent composition of mineral dust found in samples. PSL signal intensity does not always have a linear relationship with applied doses, which can be attributed to variations in inorganic mineral debris distribution on sample surfaces. Hence, the quality and quantity of minerals may serve as determinants for PSL sensitivity. Jo et al. (2016) and Jeong et al. (2014) studied irradiated fruits and cinnamon powder, respectively, and reported findings similar to our results. The results of the present study clearly demonstrated that all control and E-beam irradiated CR and AR samples possessed sufficient contaminating mineral debris for generating PSL signals, which in turn facilitate the rapid screening of irradiation status in both medicinal herbs. However, as per the guidelines of CEN, further validation by confirmatory methods, such as TL and ESR, is warranted to validate the reliability of screening results.
Table 3.
Photostimulated luminescence (PSL) counts and PSL ratios of E-beam irradiated medicinal herbs (Unit: photon counts/60 s)
| Sample | Irradiation dose (kGy) | PSL1 | PSL2 | PSL ratio (PSL2/PSL1)a |
|---|---|---|---|---|
| Cnidii Rhizoma | 0 | 658 ± 36b (−)c | 850,067 ± 162,167 (+) | 1294.20 ± 259 (N) |
| 1 | 822,687 ± 16,683 (+) | 1157,451 ± 21,819 (+) | 1.41 ± 0.04 (I) | |
| 5 | 1074,822 ± 31,775 (+) | 1265,096 ± 36,183 (+) | 1.18 ± 0.05 (I) | |
| 10 | 3227,228 ± 87,806 (+) | 5478,056 ± 58,133 (+) | 1.70 ± 0.05 (I) | |
| Alismatis Rhizoma | 0 | 339 ± 30 (−) | 320,250 ± 5012 (+) | 950.74 ± 86 (N) |
| 1 | 56,840 ± 1829 (+) | 279,049 ± 15,476 (+) | 4.91 ± 0.26 (I) | |
| 5 | 74,199 ± 7293 (+) | 327,863 ± 17,088 (+) | 4.45 ± 0.47 (I) | |
| 10 | 209,663 ± 19,835 (+) | 659,032 ± 19,044 (+) | 3.17 ± 0.34 (I) |
aPSL Ratio ≤ 10: irradiated (I), ratio > 10: non-irradiated (N)
bThe values are expressed as mean ± standard deviation (n = 5)
cThreshold value: T1 = 700, T2 = 5000, (−) < T1, T1 < (M) < T2, (+) > T2
TL detection characteristics of irradiated medicinal herbs
According to the EN 1788 (2001) guidelines, TL detection characteristics, including PSL, are also strongly dependent and influenced by the amount and type of minerals found as contaminant mineral debris on sample surfaces. TL detection characteristics of both medicinal herbs were elucidated by obtaining TL glow curves of the isolated minerals from E-beam irradiated CR and AR in Fig. 2A, B. TL analysis showed that non-irradiated (control: 0 kGy) samples of both medicinal herbs exhibited negligible TL glow curves within the temperature ranges of 140–300 °C (CR) (Fig. 2A) and 150–250 °C (AR) (Fig. 2B). The non-irradiated samples did not demonstrate any TL peaks in those ranges, and the absence of any specific TL peaks gives a clear indication of lack of any irradiation history for both medicinal herbs. This also confirmed the non-application of any type of irradiation treatment for control samples. On contrary, TL glow curves from irradiated samples were considerably distinct and well-defined with intense peaks at temperature ranges of 140–350 °C and 150–350 °C for CR and AR, respectively. Peak intensities of TL glow curves for both medicinal herbs showed gradual increase with a corresponding increase in applied irradiation dose; however, dose-dependent increases in peak intensities were more evident in the glow curves of AR (Fig. 2B). TL curves of extracted minerals from non-irradiated samples exhibited maximum peaks at ≥ 300 °C, whereas maximum peaks were recorded at 220 °C for irradiated samples of both medicinal herbs. After irradiation, different minerals showed variable TL intensities; therefore, after obtaining the first TL glow curve (TL1), normalization of TL responses was performed by the normalization step in accordance with the EN 1788 (2001) guidelines. Normalization was performed by re-irradiating the same isolated minerals from all samples at a normalization dose of 1 kGy. After normalization, measurement of the second TL glow curve (TL2) was performed and TL ratios (TL1/TL2) were determined to confirm reliability of TL analysis. The results of TL measurements and TL ratios are shown in Table 4. As per the specifications of CEN standard EN 1788 (2001), a TL ratio of ≤ 0.1 indicated non-irradiated status, whereas samples with TL ratios of > 0.1 were identified as irradiated. As shown in Table 4, all non-irradiated (control) samples of both medicinal herbs exhibited TL ratios of ≤ 0.1; consequently, their non-irradiated status was confirmed. On the other hand, TL ratios for irradiated samples were found to be in the range of 0.91–5.08, which was in agreement with EN 1788 (2001) specifications. TL ratios showed an increasing trend with a corresponding increase in applied irradiation doses. Consistent with these results, other researchers have reported similar findings for irradiated cinnamon powder (Jeong et al., 2014), spices (Sanyal et al., 2014) and onions (Ahn et al., 2012) as well as concluded that feldspar and quartz were the main silicate minerals that contributed to radiation-specific TL detection characteristics of irradiated samples. Conclusively, the TL method established itself as a confirmatory technique to distinguish irradiated samples from their non-irradiated counterparts. Further validation was achieved by employing ESR spectroscopy.
Fig. 2.

TL glow curves of minerals separated from E-beam irradiated CR (A) and AR (B) and ESR spectra of E-beam irradiated CR (C) and AR (D)
Table 4.
TL ratios (TL1/TL2) of minerals separated from E-beam irradiated medicinal herbs
| Sample | Dose rate (kGy) | TL1 (μC)1 | TL2 (μC)2 | TL ratio3 |
|---|---|---|---|---|
| Cnidii Rhizoma | 0 | 0.17 ± 0.064a5 | 11.06 ± 2.11a | 0.02 ± 0.01a |
| 1 | 13.66 ± 0.55b | 15.15 ± 1.13a | 0.91 ± 0.10a | |
| 5 | 24.69 ± 0.61c | 10.31 ± 1.25a | 2.41 ± 0.23b | |
| 10 | 29.46 ± 2.98d | 10.56 ± 2.72a | 2.85 ± 0.45c | |
| Alismatis Rhizoma | 0 | 0.03 ± 0.00a | 1.94 ± 0.07a | 0.02 ± 0.00a |
| 1 | 1.40 ± 0.09b | 1.30 ± 0.08b | 1.09 ± 0.14ba | |
| 5 | 1.91 ± 0.66b | 0.86 ± 0.28b | 2.21 ± 0.05ba | |
| 10 | 3.90 ± 0.18c | 0.83 ± 0.29b | 5.08 ± 2.01b |
1Integrated TL1 intensity at 150 ~ 250 °C
2Integrated TL2 intensity at 150 ~ 250 °C
3TL Ratio ≤ 0.1: non-irradiated, ratio > 0.1: irradiated
4The values are expressed as mean ± standard deviation (n = 3)
5) Means with different superscripts (a-d) in same column are significantly different at p < 0.05 by Duncan’s multiple range test
ESR spectral characteristics of irradiated medicinal herbs
The results of ESR spectra for control and irradiated samples of both medicinal herbs are shown in Fig. 2C, D. The ESR spectra for the control samples of both medicinal herbs exhibited wide singlet peaks (g = 2.0050); a characteristic cellulose-dominated resonance was observed in the central signal of ESR spectra which is commonly found in plant-based foods, and its presence could be attributed to the inherent organic radicals in plant foods, regardless of the irradiation history (Akram et al., 2012). The emergence of the characteristic central ESR signal can also be induced naturally owing to the presence of semiquinone radicals produced from polyphenolic compounds by means of oxidation occurring in plant matrices (Sanyal et al., 2014). For all the irradiated samples of both medicinal herbs, a wide spectrum of ESR signals showed a gradual increase in the intensity with corresponding increase in applied doses along with the emergence of two side peaks, which can be usually ascribed to radiation-specific cellulose radicals. ESR spectroscopy showed specificity for radiation-induced ESR signals even for low-dose irradiated (1 kGy) samples of both medicinal herbs which were clearly discernable as opposed to non-irradiated (control) samples. Although, distinct ESR signals induced by radiation were identified, the irradiated samples exhibited multiple overlapping component spectra; furthermore, 1 and 5 kGy-irradiated samples exhibited slightly overlapped signals. Similar findings have been reported by other researchers regarding ESR-based detection of irradiated vegetables, herbs, nuts, spices, and fruits (Akram et al., 2012; Jo and Kwon 2006; Sanyal et al., 2014). All these studies have reported dose-dependent increases in ESR signal intensities and the emergence of ESR spectra from multiple radicals, whereas signal intensities were reported to be influenced by various factors, such as storage period, geographical origin, type of irradiation, and applied dose.
In conclusion, most of the medicinal herbs have inherent characteristics of microbial contamination. E-beam irradiation, which is known as an alternative to the conventional methods of food microbial decontamination (Jaczynski and Park, 2003), was demonstrated to be effective for microbial reduction in two medicinal herb samples. In general, rapid, non-destructive, widely applicable, and economically viable screening and validations techniques are required worldwide in food control laboratories. The results of CR and AR sample screening, regardless of their pre-sterilization status, by employing the European standard DEFT/APC method (EN 13783:2002) revealed that all the commercial herb samples were not subjected to any pretreatments for microbial load reduction. Measurements of PSL photon counts and PSL ratios facilitated successful distinction of the irradiated samples (1, 5, and 10 kGy) of both medicinal herbs from the non-irradiated (control: 0 kGy) ones. TL analysis with both glow curve positions (140–300 °C, CR; 150–250 °C, AR) and TL ratios (TL1/TL2) confirmed PSL screening results, which were also validated by radiation-induced ESR signals with two side peaks as being ascribed to radiation-specific cellulose radicals. The overall results indicate that E-beam irradiation had the potential to be applied for controlling microbial growth in medicinal herbs and that the irradiation status of these herbs can be easily detected by standard detection methods recommended by Codex and Korean Food Code (CAC, 2003; EN 13751, 2002; EN 1788, 2000, 2001; MFDS, 2014).
Acknowledgement
There is no funding received for this research.
Compliance with ethical standards
Conflict of interest
The authors declare that they have no conflict of interest.
Footnotes
Publisher's Note
Springer Nature remains neutral with regard to jurisdictional claims in published maps and institutional affiliations.
Contributor Information
Mi-eun Baek, Email: 100-eun@hanmail.net.
Kashif Ameer, Email: kashifameer89@gmail.com.
Yunhee Jo, Email: maybreeze75@naver.com.
Namhyeok Chung, Email: invertsugar@naver.com.
Minji Choi, Email: cmj5188@naver.com.
Jung-ok Kim, Email: kjo1226@nikom.or.kr.
Jaehee Won, Email: won10042@nikom.or.kr.
Sang-Han Lee, Email: sang@knu.ac.kr.
Joong-Ho Kwon, Email: jhkwon@knu.ac.kr.
References
- Ahn JJ, Kim GR, Akram K, Kim KS, Kwon JH. Luminescence characteristics of minerals separated from irradiated onions during storage under different light conditions. Radiat. Phys. Chem. 2012;81(8):1215–1219. doi: 10.1016/j.radphyschem.2012.02.002. [DOI] [Google Scholar]
- Ahn JJ, Akram K, Kwak JY, Jeong MS, Kwon JH. Reliable screening of various foodstuffs with respect to their irradiation status: a comparative study of different analytical techniques. Radiat. Phys. Chem. 2013;91:186–192. doi: 10.1016/j.radphyschem.2013.05.020. [DOI] [Google Scholar]
- Akram K, Ahn JJ, Kwon JH. Analytical methods for the identification of irradiated foods. In: Ionizing radiation: applications, sources and biological. BE (ed). pp. 1-36 (2012)
- Ameer K, Bae SW, Jo Y, Lee HG, Ameer A, Kwon JH. Optimization of microwave-assisted extraction of total extract, stevioside and rebaudioside-A from Stevia rebaudiana (Bertoni) leaves, using response surface methodology (RSM) and artificial neural network (ANN) modelling. Food Chem. 2017;229:198–207. doi: 10.1016/j.foodchem.2017.01.121. [DOI] [PubMed] [Google Scholar]
- American Public Health Association and Association of Official Agricultural Chemists . Standard methods for the examination of dairy products. Washington D. C: American Public Health Association; 1978. [Google Scholar]
- Araújo MM, Duarte RC, Silva PV, Marchioni E, Villavicencio ALCH. Application of the microbiological method DEFT/APC to detect minimally processed vegetables treated with gamma radiation. Radiat. Phys. Chem. 2009;78:691–693. doi: 10.1016/j.radphyschem.2009.04.015. [DOI] [Google Scholar]
- CAC. Revised Codex General Standard for Irradiated Foods. CODEX STAN 2003: 106–1983, Rev. 1–2003. Codex Alimentarius Commission (2003)
- Chauhan SK, Kumar R, Nadanasabapathy S, Bawa AS. Detection methods for irradiated foods. Compr. Rev. Food Sci. Food Saf. 2009;8:4–16. doi: 10.1111/j.1541-4337.2008.00063.x. [DOI] [Google Scholar]
- Choi YH, Park SK, Kim OH, Seoung HJ, Han SH, Lee YJ, Jeong HJ, Kim YH, Jo HB, Yu IS, Han KY, Chae YZ. Pesticide residues monitoring of medicinal herbs in Seoul. Korean J. Pestic. Sci. 2011;15:335–349. [Google Scholar]
- Duraisankar M, Ravindran AD. Microbial quality of herbal medicine in production unit. Int. J. Pharm. Life Sci. 2013;4:2775–2779. [Google Scholar]
- EN 13751. Foodstuffs—detection of irradiated food using photostimulated luminescence (2002)
- EN 13783. Foodstuffs—Detection of irradiated food using direct epifluorescent filter tAkramechnique/aerobic plate count (DEFT/APC—screening method. Brussels, Belgium (2001)
- EN 1788. Foodstuffs—detection of irradiated food containing cellulose by ESR spectroscopy. Brussels, Belgium (2000)
- EN 1788. Foodstuffs—thermoluminescence detection of irradiated food from which silicate minerals can be isolated. Brussels, Belgium (2001)
- Ernst E. The risk-benefit profile of commonly used herbal therapies: Ginkgo, St. John’s Wort, Ginseng, Echinacea, Saw Palmetto, and Kava. Ann. Intern. Med. 2002;136:42–53. doi: 10.7326/0003-4819-136-1-200201010-00010. [DOI] [PubMed] [Google Scholar]
- Han CW, Kwun MJ, Kim KH, Choi JY, Oh SR, Ahn KS, Joo MS. Ethanol extract of Alismatis Rhizoma reduces acute lung inflammation by suppressing NF-κB and activating Nrf2. J. Ethnopharmacol. 2013;146:402–410. doi: 10.1016/j.jep.2013.01.010. [DOI] [PubMed] [Google Scholar]
- Jaczynski J, Park JW. Microbial inactivation and electron penetration in surimi seafood during electron beam processing. J. Food Sci. 2003;68:1788–1792. doi: 10.1111/j.1365-2621.2003.tb12330.x. [DOI] [Google Scholar]
- Jeong JB, Ju SY, Park JH, Lee JR, Yun KW, Kwon ST, Lim JH, Chung GY, Jeong HJ. Antioxidant activity in essential oils of Cnidium officinale makino and Ligusticum chuanxing Hort. and their inhibitory effects on DNA damage and apoptosis induced by ultraviolet B in mammalian cell. Cancer Epidemiol. 2009;33:41–45. doi: 10.1016/j.canep.2009.04.010. [DOI] [PubMed] [Google Scholar]
- Jeong MS, Akram K, Ahn JJ, Kwon JH. Applicability of irradiation detection techniques and quality characterization of cinnamon powders available in the Korean market. Int. J. Food Prop. 2014;17:2192–2206. doi: 10.1080/10942912.2013.790051. [DOI] [Google Scholar]
- Jo DJ, Kwon JH. Detection of radiation-induced markers from parts of irradiated kiwifruits. Food Control. 2006;17:617–621. doi: 10.1016/j.foodcont.2005.03.008. [DOI] [Google Scholar]
- Jo YH, Kyung HK, Park HJ, Kwon JH. Irradiated fruits can be identified by detecting radiation-induced markers with luminescence and ESR analyses for different trading fruits. Appl. Biol. Chem. 2016;59:59–65. doi: 10.1007/s13765-015-0132-9. [DOI] [Google Scholar]
- Jo YH, Ameer K, Ramakrishnan SR, Kwon JH. Synergistic applications of ionizing radiation, radiation-induced changes in pre-packaged foods and electronic sensing-based discrimination of irradiated foods. In: Reeve T, editor. Ionizing radiation: advances in research and applications. New York: Nova Science Publishers, Inc.; 2018. pp. 73–110. [Google Scholar]
- Jo YH, Ameer K, Kang YH, Ahn DU, Kwon JH. Calibrated photo-stimulated luminescence and E-sensing analyses discriminate Korean citrus fruits treated with electron beam. Food Anal. Methods. 2018;11:3190–3200. doi: 10.1007/s12161-018-1291-1. [DOI] [Google Scholar]
- MFDS. Food and drug industry trend statistics. Ministry of Food and Drug Safety. Cheongju-si, Chungcheongbuk-do, Korea. pp. 50-52 (2017)
- MFDS. Korean Pharmacopoeia. 10th ed. Ministry of Food and Drug Safety, Cheongju-si, Chungcheongbuk-do, Korea. pp. 1627-1637 (2013)
- MFDS. Korean Food Standards Codex. Ministry of Food and Drug Safety, Cheongju-si, Chungcheongbuk-do, Korea. pp. 9–8–42, 9–8–43, 9–8–47 (2014)
- Or TC, Yang CL, Law AH, Li JC, Lau AS. Isolation and identification of anti-inflammatory constituets from Ligusticum chuanxing and their underlying mechanisms of action on microglia. Neuropharmacology. 2011;60:823–831. doi: 10.1016/j.neuropharm.2010.12.002. [DOI] [PubMed] [Google Scholar]
- Pan SY, Litscher G, Chan K, Yu ZL, Chen HQ, Ko KM. Traditional medicines in the world: where to go next. J. Evidence-Based Complementary Altern. Med. 2014;2014:1–4. doi: 10.1155/2014/739895. [DOI] [PMC free article] [PubMed] [Google Scholar]
- Sanyal B, Ahn JJ, Maeng JH, Kyung HK, Lim HK, Sharma A, Kwon JH. An improved approach to identify irradiated spices using electronic nose, FTIR, and EPR spectroscopy. J. Food Sci. 2014;79:C1656–C1664. doi: 10.1111/1750-3841.12571. [DOI] [PubMed] [Google Scholar]
- Witkowaska AM, Hickey DK, Alonso-Gomez M, Wilkinson MG. The microbiological quality of commercial herb and spice preparations used in the formulation of a chicken supreme ready meal and microbial survival following a simulated industrial heating process. Food Control. 2011;22:616–625. doi: 10.1016/j.foodcont.2010.10.014. [DOI] [Google Scholar]
- Zhang Y, An H, Pan SY, Zhao DD, Zuo JC, Li XK, Gao Y, Mu QQ, Yu N, Ma Y, Mo FF, Gao SH. Jiang Tang Xiao Ke granule, a classic Chinese herbal formula, Improves the effect of metformin on lipid and glucose metabolism in diabetic mice. J. Evidence-Based Complementary Altern. Med. 2016;2016:1–11. doi: 10.1155/2016/1592731. [DOI] [PMC free article] [PubMed] [Google Scholar]