Abstract
In this study, we examined differences between the microbiota of the ruminal fluid (DR) and feces (DF) from five lactating dairy cows over three consecutive days using 16S rRNA gene sequence‐based analysis. Results showed significant differences between the microbial communities of the DR and DF. In particular, the relative abundance of the phyla Firmicutes and Actinobacteria was significantly lower (q < 0.001) in DR compared with DF, while the relative abundance of Bacteroidetes was significantly higher in DF than that of DR (q < 0.001). A significantly higher relative abundance of the genera Bifidobacterium, 5‐7N15, Clostridium, Epulopiscium, SMB53, Turicibacter, Dorea, Roseburia, and Akkermansia was observed in the DF, while a higher relative abundance of the genera Prevotella, Butyrivibrio, CF231, RFN20, and Succiniclasticum was observed in the DR. A further analysis using the functional prediction program PICRUSt showed that sequences belonging to the 5‐7N15, Akkermansia, Bifidobacterium, Clostridium, Dorea, Epulopiscium, Roseburia, and Turicibacter were significantly and positively correlated with glycan biosynthesis and metabolism, while CF231, Prevotella, RFN20, and Succiniclasticum were significantly and positively correlated with amino acid, lipid, carbohydrate, other amino acid, cofactors, and vitamins metabolism. No significant differences were observed across the three consecutive days in either the DR or DF ecosystems, with no significant differences in the diversity or abundance at the phylum and genus levels suggested that there is a limited day‐to‐day variability in the gut microbiota.
Keywords: bacterial community, dairy cow, feces, rumen fluid
This study compared differences between the rumen fluid and fecal microbiota of dairy cows and further sought to determine whether differences exist between individual samples collected over three consecutive days. A significant difference was found between the rumen and fecal microbiota suggesting that dairy cows have different microbial communities between ruminal fluid and feces. Notably, no differences were observed over the three days sampling, indicating that the gut microbial community of dairy cows may be likely stable on a day‐to‐day basis.
1. INTRODUCTION
Gastrointestinal bacterial communities perform vital functions in the mammalian gut. In ruminants, ruminal bacteria ferment plant fibers to produce volatile fatty acids and bacterial proteins, which are subsequently absorbed and metabolized to produce meat or milk (Mackie, 2002). Fermentation of feed material also occurs in the hindgut (Vanhatalo & Ketoja, 1995), producing various metabolites and providing important vitamins for the host (Godoy‐Vitorino et al., 2012). Although a sizable body of literature is available on the role of rumen fermentation in ruminants, relatively less is known about the hindgut fermentation process in dairy cows.
Because feed presented to the rumen and hindgut may differ, the microbiota in the rumen and feces are likely also distinct. Mao, Zhang, Liu, and Zhu (2015) analyzed the bacterial communities along the gastrointestinal tract in six lactating dairy cows and found significant differences in microbial community composition, including species diversity and abundance. In a different study, Liu, Zhang, Zhang, Zhu, and Mao (2016) reported decreased species diversity in fecal microbiota compared with rumen microbiota. Similarly, de Oliveira et al. (2013) found overt differences in microbial communities between the rumen and feces of Brazilian Nelore steers. The microbial composition of the ruminal fluid and feces can be further affected by other factors such as diet (McCann, Wickersham, & Loor, 2014). Thus, dissimilarities among diets and sampling sites may hinder analyses of these bacterial communities.
In addition, while some studies have examined representative microbiota samples from ruminal fluid or feces collected at a single time point, many other studies have used samples collected over three consecutive days (Shabat et al., 2016; Zhou et al., 2018). Based on 16S rRNA sequencing techniques, Skarlupka, Kamenetsky, Jewell, and Suen (2019) found a limited day‐to‐day variability in the rumen microbiota from three consecutive days. However, the work carried out by Skarlupka et al. (2019) was mainly focused on the rumen microbiota and did not explore the difference in the fecal microbiota on a day‐to‐day basis. Thus, we characterized the microbial communities of ruminal fluid and feces from five lactating dairy cows over three consecutive days to examine differences in bacterial communities among sampling days.
2. MATERIALS AND METHODS
2.1. Animals and sample collection
Five five‐year‐old lactating Holstein dairy cows were housed in a free barn at a commercial dairy farm (Beijing, China) and were cared for according to the practices outlined in the Guide for the Care and Use of Agricultural Animals in Agricultural Research and Teaching (FASS, 2010). Cows were fed a total mixed ration ad libitum, formulated to meet or exceed the energy requirements of lactating dairy cows (NRC, 2001) (Table A1). The cows were adapted to the diet and barn for at least 40 days prior to sample collection. The cows had free access to fresh water. During this period, none of the cows experienced disease and did not receive any antibiotic treatment.
DR was collected via the mouth prior to morning feeding on three consecutive days using a stomach tube with a rumen vacuum sampler (A1141K, Ancitech, Winnipeg, CA). DR samples were filtered through a four‐layer cheesecloth. Fecal samples were obtained from the rectum prior to morning feeding on three consecutive days using sterile gloves. All samples were immediately frozen in liquid nitrogen and stored at −80°C until further analysis.
2.2. DNA extraction, PCR amplification, and Illumina MiSeq sequencing
Total DNA was extracted from the DR and DF samples using a Qiagen DNA Extraction Kit (Qiagen, Hilden, Germany). DNA samples were quantified using a NanoDrop ND‐1000 Spectrophotometer (NanoDrop Technologies, Wilmington, DE, USA) and then stored at −80°C until being used as a template for the PCR assays. Barcoded primers 343F (5ʹ‐GATCCTACGGGAGGCAGCA‐3ʹ) and 534R (5ʹ‐GCTTACCGCGGCTGCTGGC‐3ʹ) were used to amplify the V3‐V4 region of the 16S rRNA gene (Ji et al., 2017). PCR reactions for each sample were carried out on a Mastercycler Gradient (Eppendorf, Germany) using 25 μl reaction volumes containing 2 μL template DNA, 5 μM of each forward and reverse primers, 12.5 μL 2 × Taq PCR MasterMix (KAPA Biosystems, Wilmington, USA), 3 μL BSA(2ng/μl), and 5.5 μL ddH2O. PCR assays consist of an initial denaturing step at 95°C for 5 min followed by 32 cycles of 95°C for 45 s, 55°C for 50 s, and 72°C for 45 s with a final extension at 72°C for 10 min. Samples were run on a 2% agarose gel using electrophoresis, and those samples with a band appearing between 200 and 210 bp were extracted and purified using a QIAquick Gel Extraction Kit (QIAGEN, Germany).
Following qualification and quantification, purified amplicons were pooled at equal molarity and sequenced on an Illumina MiSeq platform using a MiSeq Reagent Kit V3 (600‐cycle, Illumina, San Diego, CA, USA) according to standard protocols (Caporaso et al., 2012).
2.3. Taxonomic classification and diversity analysis
Shorter reads (lower than 200 bp), low‐quality sequences (scores lower than 20), ambiguous bases, and chimeras were removed by USEARCH in the QIIME1 pipeline (version 1.5.0) (Caporaso et al., 2011). Clean, paired‐end sequence reads were merged using FLASH (version 1.2.7) (Magoc & Salzberg, 2011), and 16S rRNA sequences were classified using UCLUST (version 1.2.22) against the SILVA bacterial database (SILVA version 119, released in July, 2014) (Pruesse et al., 2007). Operational taxonomic units (OTUs) determined at 97% similarity was carried out using UCLUST (Edgar, 2010). All singletons and doubletons were removed using UCLUST to generate a representative OTU table. To ensure even sequencing depth across samples, the number of tags per sample was randomly subsampled to 15,900 for bacterial community analysis.
2.4. Statistical analysis
Alpha diversity analysis was performed using QIIME including Chao 1 index calculation, determination of the number of OTUs, phylogenetic diversity whole tree analysis, and Shannon's diversity index were calculated from the OTU table. Beta diversity indices were measured based on unweighted UniFrac distances and displayed using principal coordinate analysis (PCoA) (Lozupone & Knight, 2005). Analysis of similarities (ANOSIM) was performed to determine the overall difference in microbial communities by sampling sites using the Vegan package (Oksanen et al., 2015) in R (version 3.1.2). Functional classification was predicted using Phylogenetic Investigation of Communities by Reconstruction of Unobserved States (PICRUSt, https://huttenhower.sph.harvard.edu/galaxy) from 16S rRNA sequencing, and Kyoto Encyclopedia of Gene and Genomes (KEGG) functional composition profiles were generated (Langille et al., 2013). Spearman's rank correlation analysis was used to analyze the correlation between predicted functional profiles and the genus (relative abundance of more than 1%).
Specific bacterial taxa were tested using the Kruskal–Wallis analysis to assess differences in relative abundance on different sampling days within the same community, while the Wilcoxon rank‐sum test was used to determine differences in relative abundance at the phylum and genus levels between communities. Statistical analysis was performed in R (version 3.1.2), with statistical significance accepted at p < .05. All P‐values from the multiple comparison analyses were adjusted based on the false discovery rate (Benjamini & Hochberg, 1995), with statistical significance accepted at adjusted q‐values < 0.05.
3. RESULTS
3.1. Differences in bacterial community diversity and composition between sampling sites and over different days
Our 16S rRNA gene sequencing produced an average of 22,332 ± 4,411 high‐quality sequences for each of the 30 samples in our study. Based on a sequence similarity cutoff of 97%, a total of 1,679 OTUs were detected across all samples. Rarefaction analysis was conducted to assess OTU coverage, producing a Good's coverage value > 0.97 (Figure A1) for each sample, implying that the sequence coverage was sufficient. Chao 1, number of OTUs, phylogenetic diversity whole tree analysis, and Shannon diversity index values for DR were significantly higher than those obtained for DF (q < 0.001). Importantly, no differences in these values were observed for either community across different sampling days (q > 0.05) (Table 1).
Table 1.
Alpha diversity indices for the DR and DF bacterial communities
| Items | Fecesa | Rumenb | SEM | q value | ||||
|---|---|---|---|---|---|---|---|---|
| DF1 | DF2 | DF3 | DR1 | DR2 | DR3 | |||
| Chao1 | 515.08c | 488.26c | 495.16c | 951.24d | 929.33d | 960.30d | 44.20 | <0.0001 |
| Shannon | 4.88c | 4.51c | 4.57c | 7.13d | 7.04d | 7.16d | 0.26 | <0.0001 |
| Number of OTUs | 381.20c | 361.40c | 372.80c | 789.60d | 770.60d | 791.60d | 41.31 | <0.0001 |
| PD_whole_tree | 34.62c | 33.03c | 33.58c | 62.39d | 60.23d | 61.82d | 2.74 | <0.0001 |
Feces: DF1, feces samples from day 1; DF2, feces samples from day 2; DF3, feces samples from day 3.
Rumen: DR1, rumen samples from day 1; DR2, rumen samples from day 2; DR3, rumen samples from day 3.
Different letters within a row indicate a significant difference between values (q < 0.05).
We then used a PCoA to examine difference in microbial community structure. While there was an obvious separation of the DR and DF bacterial communities, samples from the same community collected over the three consecutive days clustered together (Figure 1). Our ANOSIM analysis produced R‐values of < 0 and p‐values > 0.05, implying that there were no significant differences between sampling days for either the DR (R = −0.167, p = .972) (Figure 2a) or DF (R = −0.195, p = .996) microbiota (Figure 2b). In comparison, statistically significant differences between the DR and DF (q = 0.001, Figure 2c) were obtained by ANOSIM analysis.
Figure 1.
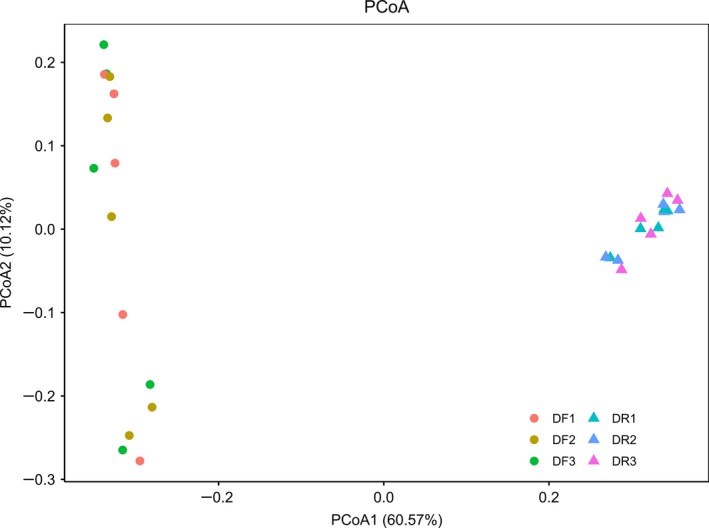
PCoA plot for comparing bacterial communities from the different gut sections and different days based on unweighted UniFrac distance matrices
Figure 2.
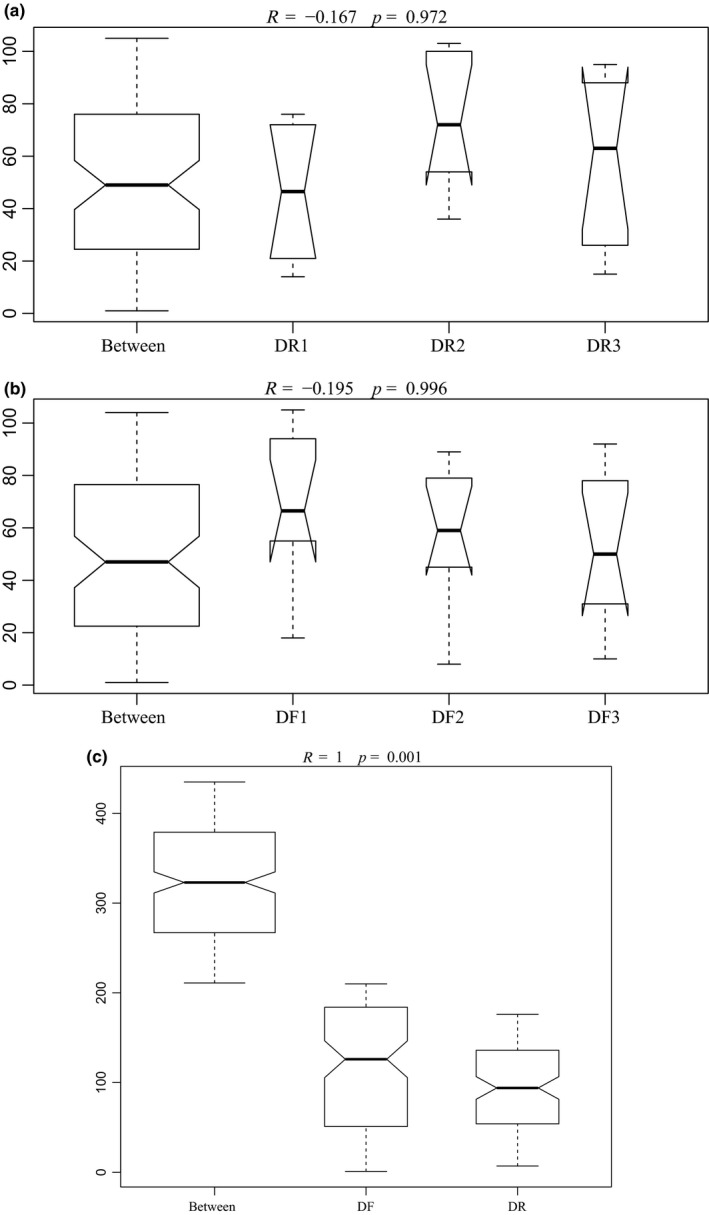
ANOSIM analysis of the different samples. ANOSIM results are presented as a box plot, where bacterial communities are grouped by sampling time in ruminal fluid (a) and feces (b) and by gut location (c). The analysis was conducted using a Bray–Curtis metric based on operational taxonomic units. DF indicates fecal microbiota samples; DR indicates ruminal fluid microbiota samples
3.2. Bacterial community composition
Only 497 of the 1,679 identified OTUs were shared between the DF and DR bacterial communities (Figure A2). Overall, 883 OTUs were specific to the DR samples and 386 OTUs were specific to the DF samples (Figure A2).
A total of 17 phyla were identified across all samples. The bacterial communities from all samples were dominated by the genera Firmicutes and Bacteroidetes (Figure 3a). In the DF bacterial community, Firmicutes was the predominant phylum, with a relative abundance of up to 80.79%, followed by Actinobacteria (11.97%) and Bacteroidetes (5.51%) (Figure 3a). The predominant phylum in the DR microbiota was Bacteroidetes (58.82%), followed by Firmicutes (37.60%) and Actinobacteria (5.51%) (Figure 3a).
Figure 3.
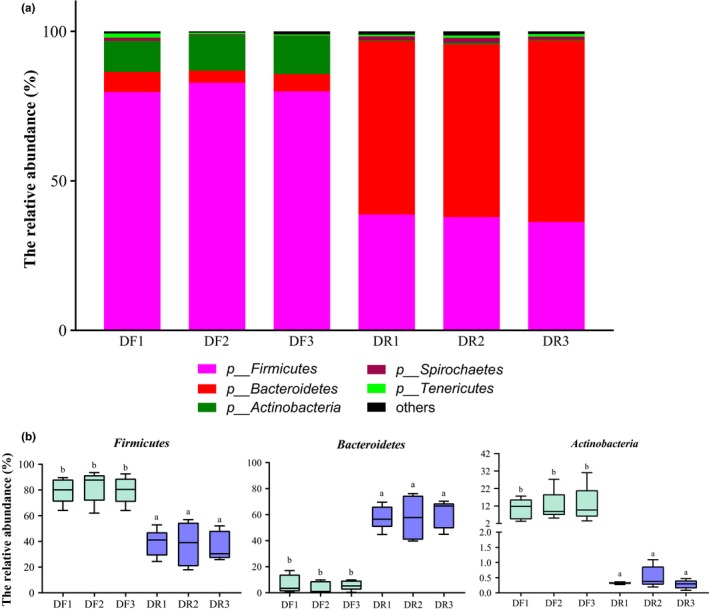
Distribution of predominant phyla (a) and the abundance of significantly different phyla (b). abDifferent letters within a row indicate a significant difference (q < 0.05)
At the genus level, a total of 78 bacterial genera were identified. Prevotella, Ruminococcus, and Butyrivibrio were the three most abundant genera in DR of all identified genus (Figure 4a). Bifidobacterium, Clostridium, Turicibacter, and Ruminococcus were predominant in DF, accounting for 91.21% of reads (Figure 4a).
Figure 4.
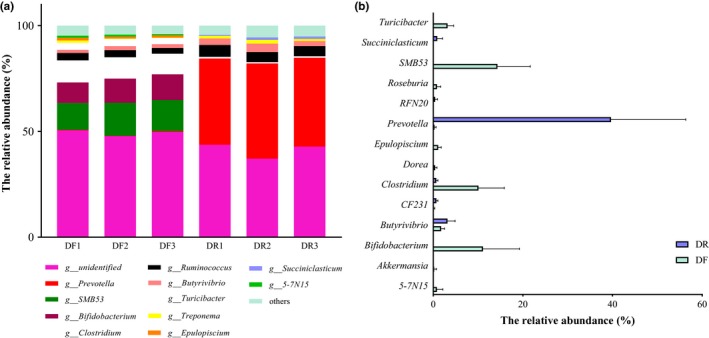
(a) Relative abundance of genus by representation at ≥ 0.001% of total sequences. (b) Relative abundance of bacterial genera between DR and DF samples (relative abundance > 1%). All data are the means of 15 samples. *q < 0.05, **q < 0.01, and ***q < 0.001
3.3. Differences in community composition between the DF and DR samples
The relative abundance of Firmicutes and Actinobacteria was significantly increased in the DF (q < 0.05) (Figure 3b and Table A2), while the DR microbiota contained a higher relative abundance of Bacteroidetes (q < 0.001). At the phylum level, no differences were observed in either the DR or DF communities over the three consecutive sampling days except for in the relative abundance of Bacteroidetes, Firmicutes, and Actinobacteria (q < 0.001). At the phylum level, no differences were observed over three consecutive sampling days in DR bacterial communities and in DF bacterial communities (q > 0.05).
At the genus level, the relative abundance of Bifidobacterium, 5‐7N15, Clostridium, Epulopiscium, SMB53, Turicibacter, Dorea, Roseburia, and Akkermansia was significantly higher (q < 0.01) in the DF community compared with the DR community, while the relative abundance of Prevotella, CF231, Butyrivibrio, RFN20, and Succiniclasticum was significantly lower (q < 0.05) in DF community than DR community (Figure 4b and Table A3). There were no changes in the relative abundance of genera among different sampling days for the DR and DF microbial communities.
3.4. Divergence of predicted microbial functions in the DR and DF Groups
We then performed a PICRUSt analysis and found 22 KEGG pathways (level 2), 18 of which were significantly different between the DR and DF samples. Lipid metabolism (10.63%), biosynthesis of other secondary metabolites (7.40%), xenobiotics biodegradation and metabolism (4.84%), amino acid metabolism (3.74%), and signaling molecules and interaction (3.59%) were identified as the top 5 predicted functions for the DR microbiota, which were also the top predicted function for DF microbiota. Cell communication, cell growth and death, and glycan biosynthesis and metabolism were significantly higher in DF compared to the DR group (q < 0.05), whereas lipid metabolism, amino acid metabolism, carbohydrate metabolism, enzyme families, metabolism of cofactors and vitamins, and metabolism of other amino acids were significantly higher in DR compared to the DR group (q < 0.05, Figure 5a).
Figure 5.
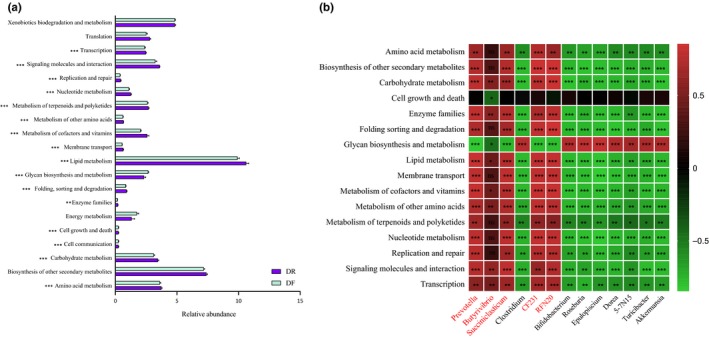
(a) Comparisons of the predicted KEGG pathways of the ruminal and fecal bacterial microbiota of dairy cows. (b) The Spearman correlation between the genus level relative abundance more than 1% and the selected predicted KEGG pathways. *0.01 < q < 0.05, **0.01 < q < 0.001, ***0.001 < q < 0.0001, ****0.0001 < q < 0.00001. The reads color genus name means the higher relative abundance in DR than those of DF
3.5. Relationship between bacterial community and predicted function
To examine the relationship between DR and DF communities, Spearman's rank correlation was used to identify linkages between predicted function and taxonomy (Figure 5b). We found that the relative abundance of Prevotella, Succiniclasticum, CF231, and RFN20 spp. was positively correlated with amino acid metabolism, biosynthesis of other secondary metabolites, carbohydrate metabolism, digestive system, enzyme families, folding sorting and degradation, lipid metabolism, membrane transport, metabolism of cofactors and vitamins, metabolism of other amino acids, metabolism of terpenoids and polyketides, nucleotide metabolism, replication and repair, signaling molecules, and interaction and transcription. We also found that the relative abundance of 5‐7N15, Akkermansia, Bifidobacterium, Clostridium, Dorea, Epulopiscum, Roseburia, and Turicibacter was negatively correlated with those predicted function (q < 0.05, Figure 5b). Butyrivibrio was positively correlated with carbohydrate, lipid, cofactors and vitamins, other amino acids, enzyme families, signaling molecules, and interaction and transcription. Cell growth and death and glycan biosynthesis and metabolism were negatively correlated with Butyrivibrio. Glycan biosynthesis and metabolism were positively correlated with the genera abundance in the DF community (Figure 5b).
4. DISCUSSION
The gastrointestinal tract of ruminant animals harbors a large number of symbiotic microbes that allow the host to acquire nutrients from its feed (Henderson et al., 2015; Roesch et al., 2007) and prevent the colonization of pathogens (Lettat et al., 2012). Ruminal fluid and fecal samples are frequently used to assess the rumen (Henderson et al., 2013; Jami, Israel, Kotser, & Mizrahi, 2013) and gut (Behr et al., 2018; Sun et al., 2018; Yang et al., 2017) microbiota of animals, respectively. In animals, intramicrobiota variation is important for health assessment, while intermicrobiota variation can be used to identify differences among the microbiota populations in the different gastrointestinal tract sections between individuals (de Oliveira et al., 2013). Here, we examined differences in the microbiota of different sites in the gut (rumen fluid and feces) and on different sampling days (three consecutive sampling days) from five lactating dairy cows using high‐throughput sequencing technology.
The bacterial microbiota in the dairy cow’ rumen were far more diverse and abundant than that of feces as reported previously (Holman & Gzyl, 2019) (Figure 1 and Table 1). In line with previous study (Mao et al., 2015; de Oliveira et al., 2013), the relative abundance of Bacteroidetes was higher in DR (p < .001, Table A2) in our study, while DF contains a greater abundance of Firmicutes (p < .001, Table A2). Similar to the study of Li et al. (2016), a greater abundance of Clostridium, Turicibacter, and Akkermansia and lower abundance of Prevotella were enriched in feces in this study.
Some studies have suggested that the large intestine provides an active site of fermentation similar to the reticulum–rumen. Some bacteria in the fecal microbiota are associated with cellulose and hemicellulose degradation, including Ruminococcus, 5‐7N15 (Bacteroidaceae family) (Khan, Saddler, Patel, Colvin, & Martin, 1980), SMB53 (Clostridiaceae family, Wust, Horn, & Drake, 2011), and Clostridium (Ozutsumi, Hayasm, Sakamoto, Itabashi, & Benn, 2005). As a butyrate producer (Pryde, Duncan, Hold, Stewart, & Flint, 2002), Zhang et al. (2018) found that Roseburia was positively associated with fecal butyrate content. Epulopiscium bacteria are abundant in the guts of herbivorous surgeonfishes (Miyake, Ngugi, & Stingl, 2015, 2016) and ants (Russell et al., 2009). In the present study, the high relative abundance of Epulopiscium in the fecal microbiota might be attributed to the plant‐based diet of dairy cows.
Previous studies have reported that intestinal bacteria significantly affect the growth and health of cattle (Cui et al., 2015; Ellis et al., 2013). The genus Bifidobacterium (phylum Firmicutes) represents the primary health‐promoting functions of piglets, with preventative and protective effects against diarrhea and intestinal infections (Hu et al., 2015). Similarly, Akkermansia spp. have attracted growing interest in its various functions related to mucosa health, energy metabolism, and inflammation markers (Guo et al., 2017; Schneeberger et al., 2015). Akkermansia and Bifidobacterium were found to be dominant genera in the present study, which is in agreement with other studies (Li, Meng, Zhou, & Zhou, 2017; Song, Malmuthuge, Steele, & Guan, 2018; Zhang et al., 2018), and might be beneficial to bovine gastrointestinal tract health. The genus Turicibacter has been reported to be more highly abundant in the feces of cattle (Callaway et al., 2010; Mao, Huo, & Zhu, 2013) and is thought to be associated with dermatitis in cattle and contagious dermatitis in sheep (Evans, Brown, Hartley, Smith, & Carter, 2012; Sadet, Martin, Meunier, & Morgavi, 2007).
Thirteen genera (relative abundance of each sample > 1%) were differentially abundant between the DR and DF (Table A3). A significantly higher relative abundance of Prevotella was observed in the rumen fluid of dairy cows. This is in line with the known function of members of this genus, as they possess enzymes that can degrade hemicelluloses as well as starch to the short‐chain fatty acids (SCFAs) such as acetate, propionate, butyrate, and succinate (Flint & Bayer, 2008; Dodd, Mackie, & Cann, 2011). Butyrate and propionate are the most important SCFAs in dairy cattle. Members of the genus Butyrivibrio are butyrate producers (Mohammed et al., 2014), and Succiniclasticum spp. can produce propionate from succinate (van Gylswyk, 1995). This may partly explain the significantly higher abundance of Butyrivibrio and Succiniclasticum in the DR community (Figure 4b and Table A3). Two unclassified bacteria were also identified in the present and the other studies (Jewell, McCormick, Odt, Weimer, & Suen, 2015; Zhu et al., 2018), including CF231 and RFN20, which were significantly abundant in the DR community.
In addition, in the present study, the predicted function of the lipid, carbohydrate, and amino acid metabolism by PICRUSt were positive and significantly correlated with Prevotella, CF231, RFN20, and Succiniclasticum (Figure 5a,b). Butyrivibrio has strongly correlated with predicted lipid, carbohydrate, cofactors and vitamins, and other amino acid and metabolism (Figure 5b). The SCFAs producer bacteria and metabolism function were both enriched in the DR community suggested rumen bacteria was related to the diet and rumen function of plant digestion and VFAs production.
Another important finding of this study was the lack of significant variation among samples collected over three consecutive days from each of the gut communities, indicating that dairy cows have two relatively independent and stable microbial communities in the gut when clinically healthy. This is consistent with the results of Skarlupka et al. (2019); they compared the rumen liquid and solid community from three consecutive days and found that the rumen community is limited day‐to‐day variability in the rumen microbiota. But in our study, we found that feces bacterial community were also like stable on a day‐to‐day basis, indicating that the gut microbial community is likely stable on a day‐to‐day basis.
5. CONCLUSIONS
Our results demonstrate striking differences in the composition of bacterial communities from the DR and DF of lactating dairy cattle, indicating that two relatively independent and stable microbial communities were existing in the gut of dairy cows. Furthermore, no significant differences in the microbiota among samples collected over three consecutive days from either the DR or DF indicated that the gut microbial community is likely stable on a day‐to‐day basis.
CONFLICT OF INTERESTS
None declared.
AUTHOR CONTRIBUTIONS
Shuai Huang: Conceptualization‐Equal, Formal analysis‐Lead, Software‐Lead, Visualization‐Lead, Writing‐original draft‐Lead, Writing‐review & editing‐Lead. Shoukun Ji: Conceptualization‐Equal, Formal analysis‐Supporting, Writing‐review & editing‐Supporting. Hui Yan: Software‐Supporting, Writing‐review & editing‐Supporting. Yangyi Hao: Writing‐review & editing‐Supporting. Jun Zhang: Writing‐review & editing‐Supporting. Yajing Wang: Writing‐review & editing‐Equal. Zhijun Cao: Writing‐review & editing‐Supporting. Lisheng Li: Funding acquisition‐Lead.
ETHICS STATEMENT
The experimental protocol was reviewed and approved by the Ethical Committee of the College of Animal Science and Technology of China Agricultural University.
ACKNOWLEDGMENTS
This research was supported by the National Natural Science Foundation of China (fund project number 31772628), the State Key Laboratory of Animal Nutrition (2016‐2020), and the National Dairy Industry and Technology System (fund project number CARS‐36). Part of this work was assisted by Zhongdi Dairy Farm (Beijing, China).
Appendix 1.
Table A1.
Ingredients and chemical composition of the diets (as dry matter basis)
| Items | Content |
|---|---|
| Ingredients, kg | |
| Domestic alfalfa hay | 15.99 |
| Imported alfalfa hay | 4.13 |
| Corn silage | 21.15 |
| Ground corn | 1.95 |
| Corn‐steam flaked | 20.73 |
| Extruded soybean meal | 2.15 |
| Soybean meal | 11.62 |
| Soybean hulls | 11.66 |
| Whole cottonseed | 4.00 |
| Premix | 6.62 |
| Chemical composition, % | |
| DM as feed | 56.4 |
| Crude protein | 15.42 |
| Fat | 4.85 |
| NDF | 31.02 |
| ADF | 20.11 |
| Ash | 7.63 |
| Ca | 0.92 |
| P | 0.41 |
Abbreviations: ADF, acid detergent fiber; Ca, calcium; NDF, neutral detergent fiber; P phosphorus.
Table A2.
The relative abundance of major bacterial phyla (>1%) between rumen fluid and feces
| Phylum | Day 1 | Day 2 | Day 3 | q‐value for day | q‐value (DF versus DR) | |
|---|---|---|---|---|---|---|
| Bacteroidetes | DR | 58.07 | 57.74 | 60.05 | ns | *** |
| DF | 6.72 | 4.02 | 5.79 | ns | ||
| q‐value | *** | *** | *** | |||
| Firmicutes | DR | 38.69 | 37.87 | 36.24 | ns | *** |
| DF | 79.68 | 82.8 | 79.91 | ns | ||
| q‐value | *** | *** | *** | |||
| Spirochaetes | DR | 1.22 | 1.67 | 1.02 | ns | ** |
| DF | 1.09 | 0.22 | 0.15 | ns | ||
| q‐value | ns | * | ns | |||
| Actinobacteria | DR | 0.33 | 0.53 | 0.28 | ns | ** |
| DF | 10.39 | 11.97 | 12.70 | ns | ||
| q‐value | * | *** | *** | |||
| Proteobacteria | DR | 0.27 | 0.43 | 0.28 | ns | * |
| DF | 0.26 | 0.17 | 0.11 | ns | ||
| q‐value | ns | ns | ns | |||
Day 1: sample from the first sampling day; day 2: sample from the second sampling day; day 3: sample from the third sampling day.
Abbreviations: DF, feces samples; DR, rumen fluid samples.
*q value < 0.05, **q value < 0.01, ***q value < 0.001, ns means q > 0.05.
Table A3.
Dominant genera (>1%) calculated from collected samples of ruminal fluid and feces
| Phyla | Genera | Day 1 | Day 2 | Day 3 | q‐value for day | q‐value (DF versus DR) | |
|---|---|---|---|---|---|---|---|
| Actinobacteria | Bifidobacterium | DF | 9.73 | 11.40 | 12.14 | ns | *** |
| DR | 0.02 | 0.03 | 0.02 | ns | |||
| q‐value | ns | * | * | ||||
| Bacteroidetes | Prevotella | DF | 0.30 | 0.17 | 0.38 | ns | *** |
| DR | 32.34 | 40.49 | 46.15 | ns | |||
| q‐value | ns | * | * | ||||
| Bacteroidetes | 5‐7N15 | DF | 1.00 | 0.90 | 0.54 | ns | ** |
| DR | 0 | 0 | 0.001 | ns | |||
| q‐value | ns | * | ns | ||||
| Bacteroidetes | CF231 | DF | 0.29 | 0.08 | 0.14 | ns | ** |
| DR | 0.55 | 0.71 | 0.87 | ns | |||
| q‐value | ns | * | * | ||||
| Firmicutes | Butyrivibrio | DF | 1.51 | 1.93 | 1.82 | ns | * |
| DR | 2.95 | 4.26 | 2.33 | ns | |||
| q‐value | ns | ns | ns | ||||
| Firmicutes | Clostridium | DF | 10.46 | 10.10 | 9.76 | ns | *** |
| DR | 0.72 | 0.66 | 0.68 | ns | |||
| q‐value | ns | * | * | ||||
| Firmicutes | Epulopiscium | DF | 1.26 | 0.93 | 1.11 | ns | *** |
| DR | 0 | 0.001 | 0.001 | ns | |||
| q‐value | ns | * | * | ||||
| Firmicutes | Ruminococcus | DF | 3.47 | 3.33 | 2.67 | ns | ns |
| DR | 4.43 | 6.31 | 4.20 | ns | |||
| q‐value | ns | ns | ns | ||||
| Firmicutes | SMB53 | DF | 12.64 | 15.63 | 14.72 | ns | *** |
| DR | 0.01 | 0.01 | 0.01 | ns | |||
| q‐value | ns | * | * | ||||
| Firmicutes | Turicibacter | DF | 3.33 | 3.37 | 2.92 | ns | *** |
| DR | 0.002 | 0.005 | 0.003 | ns | |||
| q‐value | ns | * | * | ||||
| Firmicutes | Dorea | DF | 0.49 | 0.52 | 0.27 | ns | *** |
| DR | 0 | 0.001 | 0 | ns | |||
| q‐value | ns | * | * | ||||
| Firmicutes | Mogibacterium | DF | 0.52 | 0.60 | 0.61 | ns | ns |
| DR | 0.25 | 0.47 | 0.22 | ns | |||
| q‐value | ns | ns | ns | ||||
| Firmicutes | Oscillospira | DF | 0.85 | 0.83 | 0.87 | ns | ns |
| DR | 0.76 | 0.55 | 0.59 | ns | |||
| q‐value | ns | ns | ns | ||||
| Firmicutes | RFN20 | DF | 0.001 | 0 | 0 | ns | ** |
| DR | 0.34 | 0.38 | 0.56 | ns | |||
| q‐value | ns | * | * | ||||
| Firmicutes | Roseburia | DF | 0.96 | 0.94 | 0.65 | ns | ** |
| DR | 0.01 | 0.01 | 0.01 | ns | |||
| q‐value | ns | * | * | ||||
| Firmicutes | Succiniclasticum | DF | 0.001 | 0.002 | 0.003 | ns | *** |
| DR | 0.40 | 1.19 | 1.11 | ns | |||
| q‐value | ns | ns | * | ||||
| Spirochaetes | Treponema | DF | 1.09 | 0.22 | 0.15 | ns | ns |
| DR | 0.98 | 1.28 | 1.44 | ns | |||
| q‐value | ns | ns | * | ||||
| Verrucomicrobia | Akkermansia | DF | 0.06 | 0.05 | 0.48 | ns | *** |
| DR | 0 | 0 | 0 | NA | |||
| q‐value | ns | * | * | ||||
Day 1: sample from the first sampling day; day 2: sample from the second sampling day; day 3: sample from the third sampling day.
Abbreviations: DF, feces samples; DR, rumen fluid samples.
*q value < 0.05, **q value < 0.01, ***q value < 0.001, ns means q > 0.05.
Figure A1.
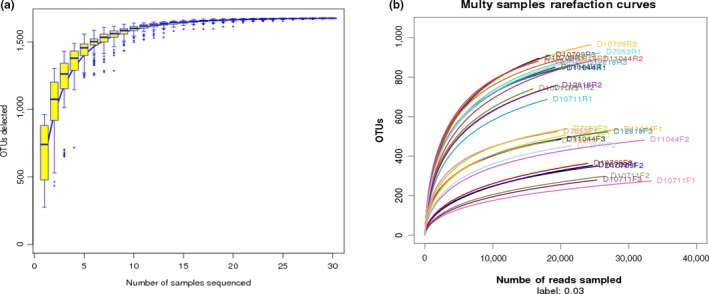
Rarefaction analysis for assessing OTU coverage. (a) Sample‐based rarefaction curve showing the increase in OTU numbers as a function of the number of individuals sampled. Each added sample adds OTUs to the plot, which has not yet been seen in previous samples. The curve becomes asymptotic as the OTU number saturates, and each sample adds an increasingly smaller number of new OTUs, indicating adequate coverage for the environment being tested. (b) Individual rarefaction curves for each rumen sample taken.
Figure A2.
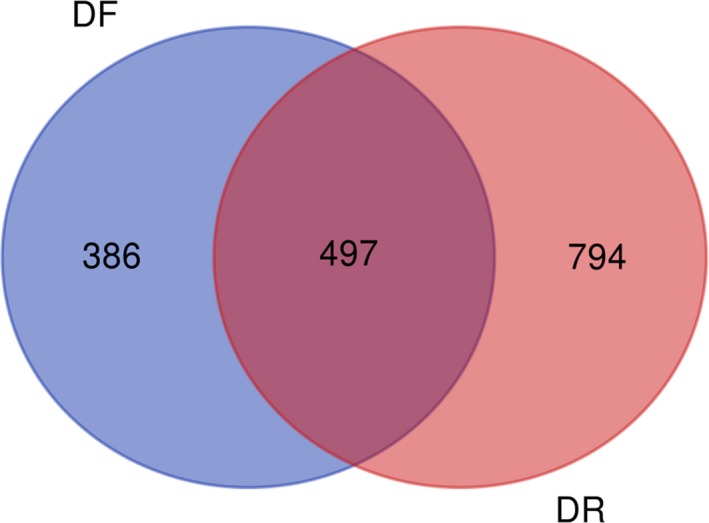
Venn plot for shared OTUs.
Huang S, Ji S, Yan H, et al. The day‐to‐day stability of the ruminal and fecal microbiota in lactating dairy cows. MicrobiologyOpen. 2020;9:e990 10.1002/mbo3.990
DATA AVAILABILITY STATEMENT
All 16S rRNA sequences generated in this study were submitted to the NCBI Sequence Read Archive and are accessible under BioProject number PRJNA540088: https://www.ncbi.nlm.nih.gov/bioproject/PRJNA540088
REFERENCES
- Behr, C. , Sperber, S. , Jiang, X. , Strauss, V. , Kamp, H. , Walk, T. , … van Ravenzwaay, B. (2018). Microbiome‐related metabolite changes in gut tissue, cecum content and feces of rats treated with antibiotics. Toxicology and Applied Pharmacology, 355, 198–210. 10.1016/j.taap.2018.06.028 [DOI] [PubMed] [Google Scholar]
- Benjamini, Y. , & Hochberg, Y. (1995). Controlling the false discovery rate: A practical and powerful approach to multiple testing. Journal of the Royal Statistical Society, 57, 289–300. 10.2307/2346101 [DOI] [Google Scholar]
- Callaway, T. R. , Dowd, S. , Edrington, T. S. , Anderson, R. C. , Krueger, N. , Bauer, N. , … Nisbet, D. J. (2010). Evaluation of bacterial diversity in the rumen and feces of cattle fed different levels of dried distillers grains plus solubles using bacterial tag‐encoded FLX amplicon pyrosequencing. Journal of Animal Science, 88, 3977–3983. 10.2527/jas.2010-2900 [DOI] [PubMed] [Google Scholar]
- Caporaso, J. G. , Lauber, C. L. , Walters, W. A. , Berg‐Lyons, D. , Huntley, J. , Fierer, N. , … Knight, R. (2012). Ultra‐high‐throughput microbial community analysis on the Illumina HiSeq and MiSeq platforms. ISME Journal, 6, 1621–1624. 10.1038/ismej.2012.8 [DOI] [PMC free article] [PubMed] [Google Scholar]
- Caporaso, J. G. , Lauber, C. L. , Walters, W. A. , Berg‐Lyons, D. , Lozupone, C. A. , Turnbaugh, P. J. , … Knight, R. (2011). Global patterns of 16S rRNA diversity at a depth of millions of sequences per sample. Proceedings of the National Academy of Sciences of the United States, 108, 4516–4522. 10.1073/pnas.1000080107 [DOI] [PMC free article] [PubMed] [Google Scholar]
- Cui, Z. L. , Meng, Q. X. , Ma, W. , Zhang, X. Z. , Zhou, Z. M. , & Ren, L. P. (2015). Diversity of the intestinal bacteria of cattle fed on diets with different doses of gelatinized starchurea. Indian Journal of Microbiology, 55, 269–277. 10.1007/s12088-015-0526-8 [DOI] [PMC free article] [PubMed] [Google Scholar]
- de Oliveira, M. N. , Jewell, K. A. , Freitas, F. S. , Benjamin, L. A. , Totola, M. R. , Borges, A. C. , … Suen, G. (2013). Characterizing the microbiota across the gastrointestinal tract of a Brazilian Nelore steer. Veterinary Microbiology, 164, 307–314. 10.1016/j.vetmic.2013.02.013 [DOI] [PubMed] [Google Scholar]
- Dodd, D. , Mackie, R. I. , & Cann, I. K. O. (2011). Xylan degradation, a metabolic property shared by rumen and human colonic Bacteroidetes. Molecular Microbiology, 79, 292–304. 10.1111/j.1365-2958.2010.07473.x [DOI] [PMC free article] [PubMed] [Google Scholar]
- Edgar, R. C. (2010). Search and clustering orders of magnitude faster than BLAST. Bioinformatics, 26, 2460–2461. 10.1093/bioinformatics/btq461 [DOI] [PubMed] [Google Scholar]
- Ellis, R. J. , Bruce, K. D. , Jenkins, C. , Stothard, J. R. , Ajarova, L. , Mugisha, L. , & Viney, M. E. (2013). Comparison of the distal gut Microbiota from People and animals in Africa. PLoS ONE, 8, e54783 10.1371/journal.pone.0054783 [DOI] [PMC free article] [PubMed] [Google Scholar]
- Evans, N. J. , Brown, J. M. , Hartley, C. , Smith, R. F. , & Carter, S. D. (2012). Antimicrobial susceptibility testing of bovine digital dermatitis treponemes identifies macrolides for in vivo efficacy testing. Veterinary Microbiology, 160, 496–500. 10.1016/j.vetmic.2012.06.001 [DOI] [PubMed] [Google Scholar]
- FASS (2010). Guide for Care and Use of Agricultural Animals in Research and Teaching, 3rd ed. Champaign, IL: Federation of Animal Science Societies. [Google Scholar]
- Flint, H. J. , & Bayer, E. A. (2008). Plant cell wall breakdown by anaerobic microorganisms from the mammalian digestive tract. Annals of the New York Academy of Sciences, 1125, 280–288. 10.1196/annals.1419.022 [DOI] [PubMed] [Google Scholar]
- Godoy‐Vitorino, F. , Goldfarb, K. C. , Karaoz, U. , Leal, S. , Garcia‐Amado, M. A. , Hugenholtz, P. , … Dominguez‐Bello, M. G. (2012). Comparative analyses of foregut and hindgut bacterial communities in hoatzins and cows. ISME Journal, 6, 531–541. 10.1038/ismej.2011.131 [DOI] [PMC free article] [PubMed] [Google Scholar]
- Guo, X. F. , Li, S. H. , Zhang, J. C. , Wu, F. F. , Li, X. C. , Wu, D. , … Peng, Y. Z. (2017). Genome sequencing of 39 Akkermansia muciniphila isolates reveals its population structure, genomic and functional diversity, and global distribution in mammalian gut microbiotas. BMC Genomics, 18, 800 10.1186/s12864-017-4195-3 [DOI] [PMC free article] [PubMed] [Google Scholar]
- Henderson, G. , Cox, F. , Ganesh, S. , Jonker, A. , Young, W. , Collaborators, G. R. C. , & Janssen, P. H. (2015). Rumen microbial community composition varies with diet and host, but a core microbiome is found across a wide geographical range. Scientific Reports, 5, 14567 10.1038/srep14567 [DOI] [PMC free article] [PubMed] [Google Scholar]
- Henderson, G. , Cox, F. , Kittelmann, S. , Miri, V. H. , Zethof, M. , Noel, S. J. , … Janssen, P. H. (2013). Effect of DNA extraction methods and sampling techniques on the apparent structure of cow and sheep rumen microbial communities. PLoS ONE, 8, e74787 10.1371/journal.pone.0074787 [DOI] [PMC free article] [PubMed] [Google Scholar]
- Holman, D. B. , & Gzyl, K. E. (2019). A meta‐analysis of the bovine gastrointestinal tract microbiota. FEMS Microbiology Ecology, 95, fiz072 10.1093/femsec/fiz072 [DOI] [PubMed] [Google Scholar]
- Hu, Y. , Dun, Y. , Li, S. , Zhang, D. , Peng, N. , Zhao, S. , & Liang, Y. (2015). Dietary Enterococcus faecalis LAB31 improves growth performance, reduces diarrhea, and increases fecal Lactobacillus number of weaned piglets. PLoS ONE, 10, e0116635 10.1371/journal.pone.0116635 [DOI] [PMC free article] [PubMed] [Google Scholar]
- Jami, E. , Israel, A. , Kotser, A. , & Mizrahi, I. (2013). Exploring the bovine rumen bacterial community from birth to adulthood. ISME Journal, 7, 1069–1079. 10.1038/ismej.2013.2 [DOI] [PMC free article] [PubMed] [Google Scholar]
- Jewell, K. A. , McCormick, C. A. , Odt, C. L. , Weimer, P. J. , & Suen, G. (2015). Ruminal bacterial community composition in dairy cows is dynamic over the course of two lactations and correlates with feed efficiency. Applied Environmental Microbiology, 81, 4697–4710. 10.1128/AEM.00720-15 [DOI] [PMC free article] [PubMed] [Google Scholar]
- Ji, S. K. , Zhang, H. T. , Yan, H. , Azarfar, A. , Shi, H. T. , Alugongo, G. , … Wang, Y. J. (2017). Comparison of rumen bacteria distribution in original rumen digesta, rumen liquid and solid fractions in lactating Holstein cows. Journal of Animal Science and Biotechnology, 8, 16 10.1186/s40104-017-0142-z [DOI] [PMC free article] [PubMed] [Google Scholar]
- Khan, A. W. , Saddler, J. N. , Patel, G. B. , Colvin, J. R. , & Martin, S. M. (1980). Degradation of cellulose by a newly isolated mesophilic anaerobe, Bacteroidaceae family. FEMS Microbiology Letters, 7, 47–50. 10.1016/S0378-1097(80)80058-9 [DOI] [Google Scholar]
- Langille, M. G. I. , Zaneveld, J. , Caporaso, J. G. , Mcdonald, D. , Knights, D. , Reyes, J. A. , … Huttenhower, C. (2013). Predictive functional profiling of microbial communities using 16S rRNA marker gene sequences. Nature Biotechnology, 31, 814–821. 10.1038/nbt.2676 [DOI] [PMC free article] [PubMed] [Google Scholar]
- Lettat, A. , Noziere, P. , Silberberg, M. , Morgavi, D. P. , Berger, C. , & Martin, C. (2012). Rumen microbial and fermentation characteristics are affected differently by bacterial probiotic supplementation during induced lactic and subacute acidosis in sheep. BMC Microbiology, 12, 142 10.1186/1471-2180-12-142 [DOI] [PMC free article] [PubMed] [Google Scholar]
- Li, Y. , Meng, Q. X. , Zhou, B. , & Zhou, Z. M. (2017). Effect of ensiled mulberry leaves and sun‐dried mulberry fruit pomace on the fecal bacterial community composition in finishing steers. BMC Microbiology, 17, 97 10.1186/s12866-017-1011-9 [DOI] [PMC free article] [PubMed] [Google Scholar]
- Liu, J. H. , Zhang, M. L. , Zhang, R. Y. , Zhu, W. Y. , & Mao, S. Y. (2016). Comparative studies of the composition of bacterial microbiota associated with the ruminal content, ruminal epithelium and in the faeces of lactating dairy cows. Microbiology Biotechnology, 9, 257–268. 10.1111/1751-7915.12345 [DOI] [PMC free article] [PubMed] [Google Scholar]
- Lozupone, C. , & Knight, R. (2005). UniFrac: A new phylogenetic method for comparing microbial communities. Applied Environmental Microbiology, 71, 8228–8235. 10.1128/AEM.71.12.8228-8235.2005 [DOI] [PMC free article] [PubMed] [Google Scholar]
- Mackie, R. I. (2002). Mutualistic fermentative digestion in the gastrointestinal tract diversity and evolution. Integrative and Comparative Biology, 42, 319–326. 10.1093/icb/42.2.319 [DOI] [PubMed] [Google Scholar]
- Magoc, T. , & Salzberg, S. L. (2011). FLASH: Fast length adjustment of short reads to improve genome assemblies. Bioinformatics, 27, 2957–2963. 10.1093/bioinformatics/btr507 [DOI] [PMC free article] [PubMed] [Google Scholar]
- Mao, S. Y. , Huo, W. J. , & Zhu, W. Y. (2013). Use of pyrosequencing to characterize the microbiota in the ileum of goats fed with increasing proportion of dietary grain. Current Microbiology, 67, 341–350. 10.1007/s00284-013-0371-0 [DOI] [PubMed] [Google Scholar]
- Mao, S. Y. , Zhang, M. L. , Liu, J. H. , & Zhu, W. Y. (2015). Characterising the bacterial microbiota across the gastrointestinal tracts of dairy cattle: Membership and potential function. Scientific Reports, 5, 16116 10.1038/srep16116 http://dx.doi.org/ [DOI] [PMC free article] [PubMed] [Google Scholar]
- McCann, J. C. , Wickersham, T. A. , & Loor, J. J. (2014). High‐throughput methods redefine the rumen microbiome and its relationship with nutrition and metabolism. Bioinformatics and Biology Insights, 8, 109–125. 10.4137/BBI.S15389 [DOI] [PMC free article] [PubMed] [Google Scholar]
- Miyake, S. , Ngugi, D. K. , & Stingl, U. (2015). Diet strongly influences the gut microbiota of surgeonfishes. Molecular Ecology, 24, 656–672. 10.1111/mec.13050 [DOI] [PubMed] [Google Scholar]
- Miyake, S. , Ngugi, D. K. , & Stingl, U. (2016). Phylogenetic diversity, distribution, and cophylogeny of giant bacteria (Epulopiscium) with their surgeonfish hosts in the red sea. Frontiers in Microbiology, 7, 285 10.3389/fmicb.2016.00285 [DOI] [PMC free article] [PubMed] [Google Scholar]
- Mohammed, R. , Brink, G. E. , Stevenson, D. M. , Neumann, A. P. , Beauchemin, K. A. , Suen, G. , & Weimer, P. J. (2014). Bacterial communities in the rumen of Holstein heifers differ when fed orchardgrass as pasture vs. hay. Frontiers in Microbiology, 5, 689 10.3389/fmicb.2014.00689 [DOI] [PMC free article] [PubMed] [Google Scholar]
- NRC (2001). Nutrient Requirements of Dairy Cattle, 7th ed. Washington DC: National Academies Press. [PubMed] [Google Scholar]
- Oksanen, J. , Blanchet, F. G. , Kindt, R. , Legendre, P. , Minchin, P. R. , O’Hara, R. B. , … Stevens, M. H. H. (2015). vegan: Community ecology package (p. 2.2‐1.). https://CRAN.R-project.org/package=vegan [Google Scholar]
- Ozutsumi, Y. H. , Hayasm, H. , Sakamoto, M. , Itabashi, H. , & Benn, Y. (2005). Culture‐Independent Analysis of Fecal Microbiota in Cattle. Bioscience, Biotechnology, and Biochemistry, 69, 1793–1797. 10.1271/bbb.69.1793 [DOI] [PubMed] [Google Scholar]
- Pruesse, E. , Quast, C. , Knittel, K. , Fuchs, B. M. , Ludwig, W. , Peplies, J. , & Glpckner, F. O. (2007). SILVA: A comprehensive online resource for quality checked and aligned ribosomal RNA sequence data compatible with ARB. Nucleic Acids Research, 35, 7188–7196. 10.1093/nar/gkm864 [DOI] [PMC free article] [PubMed] [Google Scholar]
- Pryde, S. E. , Duncan, S. H. , Hold, G. L. , Stewart, C. S. , & Flint, H. J. (2002). The microbiology of butyrate formation in the human colon. FEMS Microbiology Letter, 217, 133–139. 10.1111/j.1574-6968.2002.tb11467.x [DOI] [PubMed] [Google Scholar]
- Roesch, L. F. , Fulthorpe, R. R. , Riva, A. , Casella, G. , Hadwin, A. K. , Kent, A. D. , … Triplett, E. W. (2007). Pyrosequencing enumerates and contrasts soil microbial diversity. ISME Journal, 1, 283–290. 10.1038/ismej.2007.53 [DOI] [PMC free article] [PubMed] [Google Scholar]
- Russell, J. A. , Moreau, C. S. , Goldman‐Huertas, B. , Fujiwaraa, M. , Lohmana, D. J. , & Pierce, N. E. (2009). Bacterial gut symbionts are tightly linked with the evolution of herbivory in ants. Proceedings of the National Academy of Sciences of the United States, 106, 21236–21241. 10.1073/pnas.0907926106 [DOI] [PMC free article] [PubMed] [Google Scholar]
- Sadet, S. , Martin, C. , Meunier, B. , & Morgavi, D. P. (2007). PCR‐DGGE analysis reveals a distinct diversity in the bacterial population attached to the rumen epithelium. Animal, 1, 939–944. 10.1017/S1751731107000304 [DOI] [PubMed] [Google Scholar]
- Schneeberger, M. , Everard, A. , Gómez‐Valadés, A. G. , Matamoros, S. , Ramírez, S. , Delzenne, N. M. , … Cani, P. D. (2015). Akkermansia muciniphila inversely correlates with the onset of inflammation, altered adipose tissue metabolism and metabolic disorders during obesity in mice. Scientific Reports, 5, 16643 10.1038/srep16643 [DOI] [PMC free article] [PubMed] [Google Scholar]
- Shabat, S. K. , Sasson, G. , Doron‐Faigenboim, A. , Durman, T. , Yaacoby, S. , Berg Miller, M. E. , … Mizrahi, I. (2016). Specific microbiome‐dependent mechanisms underlie the energy harvest efficiency of ruminants. ISME Journal, 10, 2958–2972. 10.1038/ismej.2016.62 [DOI] [PMC free article] [PubMed] [Google Scholar]
- Skarlupka, J. H. , Kamenetsky, M. E. , Jewell, K. A. , & Suen, G. (2019). The ruminal bacterial community in lactating dairy cows has limited variation on a day‐to‐day basis. Journal of Animal Science and Biotechnology, 10, 66 10.1186/s40104-019-0375-0 [DOI] [PMC free article] [PubMed] [Google Scholar]
- Song, Y. , Malmuthuge, N. , Steele, M. A. , & Guan, L. L. (2018). Shift of hindgut microbiota and microbial short chain fatty acids profiles in dairy calves from birth to pre‐weaning. FEMS Microbiology Ecology, 94, 1–15. 10.1093/femsec/fix179 [DOI] [PubMed] [Google Scholar]
- Sun, L. , Xie, C. , Wang, G. , Wu, Y. , Wu, Q. , Wang, X. , … Jiang, C. (2018). Gut microbiota and intestinal FXR mediate the clinical benefits of metformin. Nature Medicine, 24, 1919–1929. 10.1038/s41591-018-0222-4 [DOI] [PMC free article] [PubMed] [Google Scholar]
- van Gylswyk, N. O. (1995). Succiniclasticum ruminis gen. nov., sp. nov., a ruminal bacterium converting succinate to propionate as the sole energy yielding mechanism. International Journal of Systematic Bacteriology, 45, 297–300. 10.1099/00207713-45-2-297 [DOI] [PubMed] [Google Scholar]
- Vanhatalo, A. , & Ketoja, E. (1995). The role of the large intestine in post‐ruminal digestion of feeds as measured by the mobilebag method in cattle. British Journal of Nutrition, 73, 491–505. 10.1079/BJN19950054 [DOI] [PubMed] [Google Scholar]
- Wust, P. K. , Horn, M. A. , & Drake, H. L. (2011). Clostridiaceae and Enterobacteriaceae as active fermenters in earthworm gut content. ISME Journal, 5, 92–106. 10.1038/ismej.2010.99 [DOI] [PMC free article] [PubMed] [Google Scholar]
- Yang, H. , Huang, X. , Fang, S. , He, M. , Zhao, Y. , Wu, Z. , … Huang, L. (2017). Unraveling the Fecal Microbiota and Metagenomic Functional Capacity Associated with Feed Efficiency in Pigs. Frontiers in Microbiology, 8, 1555 10.3389/fmicb.2017.01555 [DOI] [PMC free article] [PubMed] [Google Scholar]
- Zhang, J. , Shi, H. T. , Wang, Y. J. , Cao, Z. J. , Yang, H. J. , & Li, S. L. (2018). Effect of Limit‐Fed Diets With Different Forage to Concentrate Ratios on Fecal Bacterial and Archaeal Community Composition in Holstein Heifers. Frontiers in Microbiology, 9, 976 10.3389/fmicb.2018.00976 [DOI] [PMC free article] [PubMed] [Google Scholar]
- Zhou, M. , Peng, Y. J. , Chen, Y. , Klinger, C. M. , Oba, M. , Liu, J. X. , & Guan, L. L. (2018). Assessment of microbiome changes after rumen transfaunation: Implications on improving feed efficiency in beef cattle. Microbiome, 6, 62 10.1186/s40168-018-0447-y [DOI] [PMC free article] [PubMed] [Google Scholar]
- Zhu, Z. , Kristensen, L. , Difford, G. F. , Poulsen, M. , Noel, S. J. , Abu Al‐Soud, W. , … Hojberg, O. (2018). Changes in rumen bacterial and archaeal communities over the transition period in primiparous Holstein dairy cows. Journal of Dairy Science, 101, 9847–9862. 10.3168/jds.2017-14366 [DOI] [PubMed] [Google Scholar]
Associated Data
This section collects any data citations, data availability statements, or supplementary materials included in this article.
Data Availability Statement
All 16S rRNA sequences generated in this study were submitted to the NCBI Sequence Read Archive and are accessible under BioProject number PRJNA540088: https://www.ncbi.nlm.nih.gov/bioproject/PRJNA540088


