Figure 3.

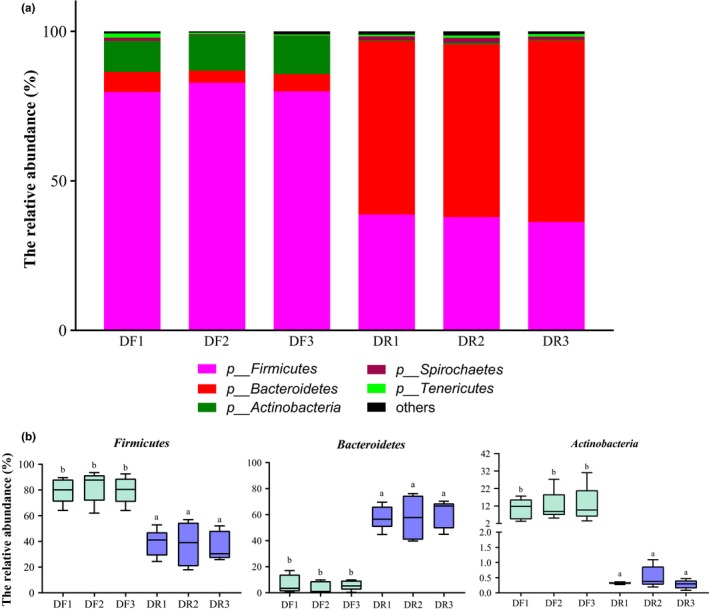
Distribution of predominant phyla (a) and the abundance of significantly different phyla (b). abDifferent letters within a row indicate a significant difference (q < 0.05)

Distribution of predominant phyla (a) and the abundance of significantly different phyla (b). abDifferent letters within a row indicate a significant difference (q < 0.05)