

Abstract
Objective
To explore the biological function and molecular mechanism of Sp2 in hepatocellular carcinoma (HCC).
Methods
Tissue microarray immunohistochemistry and western blot were used to study the expression of Sp2 in hepatocellular tissue and adjacent non‐neoplastic tissues (ANT). In HCC cell lines, the role of Sp2 was determined by in vitro experiments such as CCK8, clone formation test, Transwell assay, wound‐healing assay, and flow cytometry apoptotic analysis, and its possible mechanism was analyzed.
Results
Compared with ANT, Sp2 expression in HCC tissues was significantly up‐regulated, which was strongly associated with stage of tumor and poor prognosis of patients. TCGA database were further confirmed these results. Besides, functional studies had shown that Sp2 knockdown not only leads to a decrease in cell proliferation and an increase in cell apoptosis but also inhibits the cells' abilities of migration and invasion. Sp2 silencing could inhibit the expression of TRIB3 protein and down‐regulate the endoplasmic reticulum stress (ERS) level of HCC.
Conclusion
Sp2 may play a part in promoting cancer by regulating TRIB3 protein, which may be a factor of prognostic and a potential new therapeutic target for HCC.
Keywords: endoplasmic reticulum stress, hepatocellular carcinoma, prognosis, Sp2, TRIB3
We found that Sp2 expression was significantly up‐regulated in HCC tissues, which was closely related to tumor staging and poor prognosis of patients. Functional studies had shown that Sp2 knockdown not only leads to a decrease in cell proliferation and an increase in cell apoptosis, but also inhibits migration and invasion of hepatoma cells. Sp2 may play a role in promoting cancer by regulating TRIB3 protein, which may be a prognostic factor and a potential new therapeutic target for HCC.

1. BACKGROUND
Primary hepatocellular carcinoma (HCC) is one of the most common malignant tumors in the clinic. Its incidence rate ranks sixth among all malignant tumors and its mortality rate ranks second.1, 2 Therefore, it is of vital importance to deeply explore the molecular basis behind the invasion and metastasis of HCC. Previous data show that endoplasmic reticulum stress (ERS) stress in human body is activated continuously, which has a close relationship to the occurrence and development of cancer,3, 4 which can not only repair damaged proteins or degrade misfolded proteins,5 protect tumor cells from body damage,6 but also regulate the growth and apoptosis of tumor cells, promote tumor invasion and metastasis7, 8 through various ways, and mediate chemotherapy resistance.4 In the endoplasmic reticulum stress environment, TRIB3 is up‐regulated as a sensor of cell stress, which is related to poor prognosis and involved in the progress of tumors.9
Transcription factor Sp2 is a member of the SP protein family, which is involved in the regulation of cell proliferation, differentiation, apoptosis and other functions.10 Recent studies have shown that Sp2 may overexpress and play a crucial part in many kinds of cancers.11, 12 However, the role of Sp2 in HCC has not been studied. The aim of this research was to clarify the relationship between Sp2 expression in HCC and clinicopathological features by detecting the expression of Sp2, TRIB3, and ERS marker protein GRP78 in HCC and adjacent non‐neoplastic tissues (ANT), further study the biological function of Sp2 in hepatoma cells by small interfering RNA (siRNA) transfection technology so as to clarify its influence on proliferation, apoptosis, and invasion of HCC cells, as well as explore its possible molecular mechanism.
2. METHODS
2.1. Clinical samples
The clinical samples of 95 pairs of patients with HCC and corresponding ANT from the First Affiliated Hospital of Anhui Medical University from 2004 to 2010 were collected. The specific data of the studied patients including the age, gender, size of tumor, histological grade, Lymphatic metastasis, and clinical stage were recorded for further study. Tumor clinical stage was classified on the basis of TNM stage of the International Union Against Cancer (UICC). In addition, we also obtained matched four pairs HCC/ ANT liver tissue samples from surgical patients to carry out the western blot. Our scientific research program follows the relevant moral standards officially issued in the Declaration of Helsinki, and is reviewed and finally approved by the ethical standards committee of our hospital. All patients involved in the study have signed the informed consent in written form.
2.2. Immunohistochemistry (IHC)
Ninety‐five pairs of tissue microarrays of HCC/ANT samples were constructed. Rabbit polyclonal anti‐human Sp2 antibody (1:100, Biorbyt), TRIB3 antibody (1:400, Bioss), GRP78 antibody (1:500, Arigo) was immunohistochemically detected by two‐step method. Positive signal intensity scores were as follows: 1 point is negative (not stained); 2 point is weak (light yellow); 3 point is medium (yellow brown); 4 point is strong (brown). The positive degree was scored according to the actual proportion of positive cells: 0 point corresponds to <5%; 1 point corresponds to 5%‐25%; 2 points correspond to 26%‐50%; 3 points correspond to 51%‐75%; 4 points correspond to more than 75%. The staining index (SI) was taken as the total score obtain a range of 0‐16. In addition, the median SI was equal to 8 as the cutoff value. For the samples with SI <8 and SI ≥8, they correspond to the samples of low and high expression group, respectively.
2.3. Cell culture
The human HepG2, Huh7, and Hep3B cell line used in this study were all from the Chinese Academy of Sciences and were identified by Wuhan Procell Co., Ltd. The HepG2 cells and Hep3B cells were cultured in DMEM medium (Gibco) containing streptomycin (100 μg/mL, Gibco), penicillin (100 U/mL, Gibco), and 10% fetal bovine serum (HyClone, FBS). The Hub7 cells were cultured in RPMI‐1640 medium (Hyclone) containing the same substances as mentioned above. Cells were cultured in 37℃ incubator containing 5% carbon dioxide.
2.4. Small interfering RNA (siRNA) and small hairpin RNA (shRNA) transfection
HCC cells were plated and grown in six‐well plates before transfection at approximately 50% confluence. The transfection process completely in accordance with the instructions of the manufacturer. Lipofectamine TM 2000 (Invitrogen) was used to finish this process. Small interfering RNA for the Sp2 (si‐Sp2) were obtained from the GenePharma Co.,Ltd. Small hairpin RNA plasmids for the TRIB3 gene (shTRIB3) were obtained from the Genechem Co.,Ltd. The target sequences for SP2 were 5′‐ GGAGCAUCAUCAGCCUGAATT −3′ (sense) and 5′‐ UUCAGGCUGAUGAUGCUCCTT −3′ (antisense). The primer sequences for TRIB3 were 5′‐ TGGATGACAACTTAGATACCG −3′ (sense) and 5′‐ CGGTATCTAAGTTGTCATCCA −3′ (antisense). A non‐silencing siRNA (si‐NC) sequence (target sequence 5′‐ UUCUCCGAACGUGUCACGUTT −3′(sense) and 5′‐ ACGUGACACGUUCGGAGAATT −3′ (antisense)) and a non‐silencing shRNA (shCtrl) sequence (target sequence 5′‐ TTCTCCGAACGTGTCACGT −3′) sequence were used as the negative control.
2.5. Cell viability analysis
Cells were seeded into 96‐well plates with a seeding volume of 100 μL (density 3 × 10⁴ cells/mL) per well, incubation temperature was 37℃, and the CO2 concentration was 5%. After 12 hours, 24 hours, 48 hours, and 72 hours of culture. Add CCK‐8 detection reagent (BestBio) (10 μL/well), and measure the absorbance at 450 nm.
2.6. Annexin V‐FITC/PI apoptosis detection
Forty‐eight hours after transfection, use the Annexin V‐FITC/PI staining method to accurately analyze apoptosis in each group. Cells were collected in the reaction tube and prepared into single cell suspension. PBS which has been precooled in advance was used to wash the above samples. After adding 5 μL of annexin V‐FITC and PI (eBiosciences) and avoided light for 15 minutes, apoptosis was detected using the Beckman CytoFLEX LX flow cytometry system (Beckman Coulter).
2.7. Transwell assay
A 24‐well Transwell chamber (Corning) with gelatin‐coated polycarbonate membrane filter and Matrigel were used. Cells were collected and suspended in the medium without serum to a cell density of 5 × 10⁴/mL. Volume of 100 μL was added to the upper cavity of the transfer well. The lower rooms added 600 μL of medium contained 20% serum (HyClone, FBS). Twenty‐four hours later, the cells were dyed with crystal violet (0.1%) for 15 minutes, and then washed with PBS twice. The cells were observed and counted using ImageJ. Cells were observed by light microscope, and then randomly selected different areas (5 for each) to count.
2.8. Wound‐healing assay
The cells were collected efficiently and then inoculated into a six‐well plate(5 × 10⁵/well). Cells were incubated and cultured to the level of 90%. The HCC cells were scraped using 200 μL tips and incubated in the serum‐free medium. The typical images have been collected under microscope at 0 hour, 12 hours, and 24 hours after scratch creation.
2.9. Western blot assay
Total protein was extracted and then quantified. SDS‐PAGE was used to separate protein and transfer them to PVDF membranes (Millipore). Incubate in skim milk (5%) at room temperature for 2 hours. And then, primary antibody was incubated at 4°C, including anti‐Sp2 (1:100 dilution, Biorbyt), anti‐TRIB3 (1:1000 dilution, Abclonal), anti‐GRP78 (1:500 dilution, Arigo), anti‐ATF6 (1:500 dilution, Bioworld), anti‐PERK (1:1000 dilution, Bioworld). Incubate with the corresponding secondary antibody (with dilution of 1:10 000) for a total of 120 minutes at 37°C. Finally, the protein band signal was observed with an enhanced chemiluminescence reagent (ThermoFisher).
2.10. Statistical methods
In this study, the mean ± standard deviation is used to represent the experimental data effectively. Statistical tests for data analysis included Log‐rank test, Fisher's exact test, chi‐squared test, Kaplan‐Meier analysis and paired/unpaired t test. Images were plotted using Graph Prism 8.0 software. SPSS software (version 20.0) was selected for statistical analysis of data. P < .05 means statistically significant.
3. RESULTS
3.1. Sp2 Overexpression is closely related to progression and adverse prognosis of HCC
Evaluate the express of Sp2 in 95 cases of HCC/ANT samples by IHC method (Figure 1A). Sp2 was highly expressed in 54.7% (52/95) HCC tissues, but prominently lower in ANT liver tissues (Figure 1B). After detailed clinicopathological analysis, it was found that the expression of Sp2 was positively correlated with tumor size (P = .041), lymph node metastasis (P = .032), clinical stage (P = .011), but did not relate to the histological grade, gender and age of patients (Figure 1C; Table 1). Survival analysis showed low Sp2 expression means better survival benefit than high expression (Figure 1D). Western blot was used to detect the expression of Sp2 in 4 pairs of fresh HCC and its surrounding tissues, so as to verify the Sp2 expression pattern in HCC. The results showed that there is a significant overexpression of SP2 in HCC tissues compared with the surrounding corresponding tissues (Figure 1E,F). Analysis of paired HCC/ ANT liver tissue data set in The Cancer Genome Atlas (TCGA) showed that Sp2 expression in tumor tissues was obviously higher than normal liver tissues in patients with HCC (Figure 1G). TCGA data also provide a Kaplan‐Meier survival analysis showed there was a significant positive correlation between the high expression of Sp2 and the relatively short overall survival (Figure 1H). Based on these results, we can conclude that the overexpression of SP2 may be associated with the occurrence and evolution of HCC. In addition, for HCC, it may also be a new prognostic and diagnostic indicator.
Figure 1.

Sp2 overexpression is closely related to hepatocellular carcinoma (HCC) progression and poor prognosis. A, The expression of Sp2 in the microarray of HCC. The HCC tissue is brown, strong nuclear staining, and surrounding non‐cancerous liver tissue clearly showed that Sp2 staining was weak positive or negative under the microscopic. B, The staining index (SI) of Sp2 in tumor tissues of HCC patients was higher than ANT liver tissues. C, Sp2 protein levels in HCC tissues were related to TNM stage. D, Kaplan‐Meier survival curve with low and high Sp2 expression levels of HCC patients (P = .013, n = 44). E, F, Western blot was used to confirmed SP2 expression in fresh matched (4 pairs) adjacent non tumor tissues and corresponding HCC tissues. G, H, TCGA data proved that Sp2 was the low expression and high expression in normal tissues and liver hepatocellular carcinoma (LIHC) tissues, respectively (G). Kaplan‐Meier survival curve of LIHC measured at different Sp2 expression levels (corresponding to high and low expression) (n = 365; P = .015) (H). *P < .05 **P < .01
Table 1.
Sp2 expression in 95 hepatocellular carcinoma samples
| Variable | n | Sp2 expression | χ2 value | P value | |
|---|---|---|---|---|---|
| high | low | ||||
| Age(years) | |||||
| <60 | 56 | 32 | 24 | 0.319 | .572 |
| ≥60 | 39 | 20 | 19 | ||
| Gender | |||||
| Male | 69 | 37 | 32 | 0.126 | .722 |
| Female | 26 | 15 | 11 | ||
| Tumor size(cm) | |||||
| ≤5 | 40 | 17 | 23 | 4.176 | .041 |
| >5 | 55 | 35 | 20 | ||
| Histological grade | |||||
| Low‐intermediate | 62 | 35 | 27 | 0.354 | .552 |
| High | 33 | 17 | 16 | ||
| Lymph node metastasis | |||||
| Negative | 80 | 40 | 40 | 4.589 | .032 |
| Positive | 15 | 12 | 3 | ||
| TNM stage | |||||
| I‐II | 75 | 36 | 39 | 6.526 | .011 |
| III‐IV | 20 | 16 | 4 | ||
3.2. Knockdown of Sp2 inhibits the growth of HCC cells
Western blot was selected to accurately detect the expression of Sp2 in HCC cell lines (Hep3B, Huh7, HepG2), so as to evaluate its biological function in vitro. Finally, HepG2 cell lines with high expression level were selected for subsequent studies (Figure 2A,B). The Sp2‐targeted siRNA interfering fragments were transiently transfected into HepG2 cells, Sp2 expression was significantly inhibited at the protein level (Figure 2C,D), which means that the construction of the model has been completed. To evaluate the cell proliferation, we used the colony‐forming assay and CCK8. Flow cytometry was used to explore the apoptosis of Sp2 silenced HepG2 cells. It was found that Sp2 deletion inhibited cell proliferation (Figure 2E) and colony formation (Figure 2F,G). In addition, inhibition of Sp2 also significantly increased apoptosis (Figure 2H,I). For purpose of further verify whether there was a certain degree of cell specificity in the biological function of Sp2, we additionally detected the hepatoma Huh7 cell line in vitro. Similarly, in Sp2‐silenced Huh7 cells (Figure 3A,B), cell proliferation was decreased (Figure 3C,D), colony formation was inhibited (Figure 3E), and apoptosis was increased (Figure 3F,G). These results indicated that Sp2 knockdown has the ability to inhibit the growth of cells and significantly promote cell apoptotic in the in vitro hepatoma cell line.
Figure 2.

Effect of Sp2 knockdown on cell proliferation, colony formation, and apoptosis in HepG2 cells. A, B, Western blot was used to evaluate the Sp2 protein level of three common HCC cell lines. C, D, In HepG2 cells, siRNA interference fragments (targeted Sp2) were transiently transfected (C). Western blot was used to evaluate the silencing effect (D). E, Cell Viability images over three days in control HepG2 cells, si‐NC and si‐Sp2 HepG2 cells. F, G, After Sp2 knockdown treatment, use the colony formation to evaluate the growth of HepG2 cells effectively. H, I, The apoptosis rate was evaluated in si‐NC and si‐Sp2 HepG2 cells by flow cytometry. *P < .05 **P < .01
Figure 3.

Effect of Sp2 knockdown on cell proliferation, colony formation and apoptosis in Huh7 cells. A,B, The Sp2‐targeted siRNA interfering fragments were transiently transfected into Huh7 cells, and the silencing efficacy has been evaluated via western blot. C, Cell Viability images over three days in control Huh7 cells, si‐NC and si‐Sp2 Huh7 cells. D,E, Assessment the growth of Huh7 cells, which have been treated with SP2 knockdown, has been performed through colony‐forming techniques. F,G, The apoptosis rate of si‐NC Huh7 cells and si‐Sp2 Huh7 cells. **P < .01
3.3. Knockdown of Sp2 inhibits invasion and migration of HCC cells in vitro
Our clinical results showed Sp2 overexpression was positively correlated not only with tumor stage but also with lymph node metastasis. Accordingly, it can be considered that SP2 should have a certain impact on tumor migration and invasion. Wound‐Healing test indicated that the healing rate of HepG2 and Huh7 cells after Sp2 knockout was significantly slowed down after scratch creation (Figure 4A,B). At the same time, the Transwell assay showed a significant decrease in cell migration and invasive ability after Sp2 knockout in both cell lines (Figure 4C,D). It also indicated that Sp2 was an important factor to promote invasion and migration of HCC cells in vitro.
Figure 4.

Effect of Sp2 knockdown on migration and invasion in HCC cells. A, The cell migration potential was evaluated by the wound healing test strictly referring to the time point (si‐NC and si‐SP2 cells) (original magnification, ×100). B, The migration areas of Sp2 silenced cells and cells from the control group were determined scientifically. C, Measure the cell migration and invasive ability by transwell assay (original magnification, ×100). D, Quantification of migration and invasion of si‐NC and si‐Sp2 cells. **P < .01
3.4. Knockdown of Sp2 down‐regulates ERS
Previous studies had investigated the changes of super‐enhancers in HCC cell lines before and after ERS by Chromatin immunoprecipitation and high‐throughput sequencing (ChIP‐seq). The target genes of specific super‐enhancers were analyzed in combination with the sequencing results of HCC cells transcriptome. The results showed that some genes were differentially expressed under ERS and might be regulated by super‐enhancers. Transcription factor Sp2 might play a regulation role by combining with these ERS specific super‐enhancers. In order to further clarify the function of Sp2 in HCC and its relationship with ERS, IHC was used to detect the expression of ERS marker protein GRP78 in 95 cases of primary HCC and ANT liver tissues (Figure 5A), while WB method was used to detect 4 pairs of fresh HCC/ANT (Figure 5D). We found that the expression of Sp2 in HCC was similar to that of GRP78. Compared with the corresponding paracancerous tissue specimens, Grp78 was significantly overexpressed in HCC tissue specimens, and Sp2 had a higher expression trend in the high ERS HCC tissues (Figure 5B,C). In vitro experimental results indicated that GRP78 has been dramatically down‐regulated in the Sp2 knockout HCC cells, especially in ATF6. But the PERK and IRE1 were not down‐regulated (Figure 5E,F). Based on this, it could be concluded that Sp2 may greatly influence both the occurrence and development of HCC by enhancing the level of ERS.
Figure 5.

GRP78 expression in HCC and its relationship with Sp2. A, Compared with the surrounding normal tissues, the expression of GRP78 had a higher staining index (SI). B,C, Sp2 had a higher expression trend in the high ERS HCC tissues. D, The expression of GRP78 in primary HCC tissues and matched normal tissues (4 pairs in total) from the same patient was verified by western blot. E,F, Sp2 knockdown was significantly down‐regulated GRP78 in HCC cells, especially in the ATF6 pathway. *P < .05 **P < .01
3.5. Sp2 acts on ERS by regulating positive feedback of TRIB3
TRIB3 gene is differentially expressed under ERS and non‐stress conditions. For purpose of further explore the molecular mechanism of Sp2 action, we used IHC to detect the expression of TRIB3 in 95 cases of HCC and ANT tissues (Figure 6A,B). The analysis showed TRIB3 had a higher express trend in the high Sp2 expression (Figure 6C) and ERS HCC tissues (Figure 6D). Use western blot to evaluate the expression of TRIB3 gene after Sp2 knockout. It was found that Sp2 silencing could down‐regulate the TRIB3 expression in HCC cells (Figure 6E,F). Cell migration and invasion assays were performed after knock‐out of TRIB3 in HepG2 and Huh7 cell lines. Transwell assay suggested that cell migration and invasion were inhibited both in the two cell lines after knock‐down of TRIB3 (Figure 6G). Therefore, we speculated that TRIB3 was regulated by ESR, Sp2 may act on TRIB3 protein and enhance its expression, and further heighten ERS by positive feedback, thus playing a major part in proliferation, invasion, and metastasis of HCC.
Figure 6.
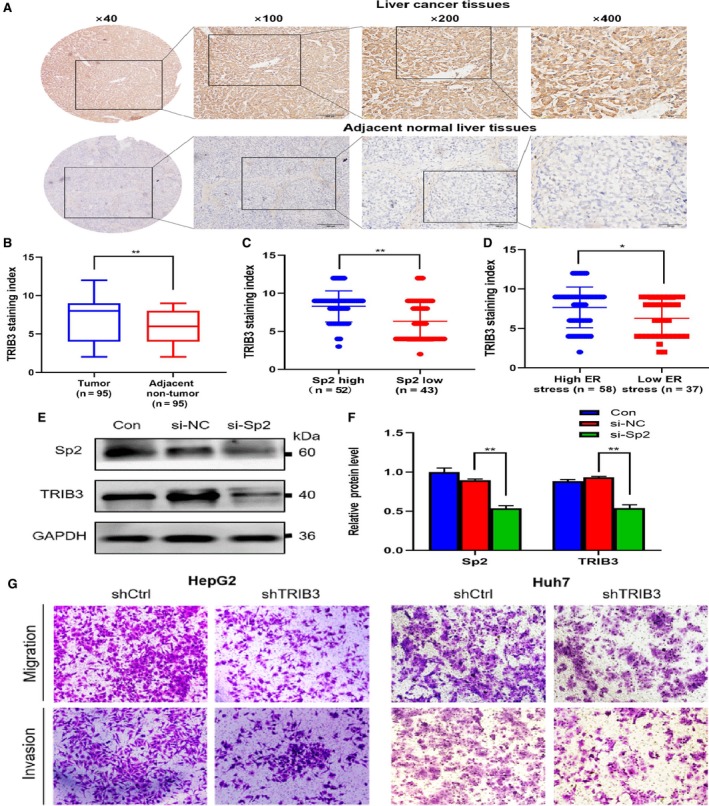
TRIB3 overexpression in HCC and may be targeted by Sp2. A,B, TRIB3 expression in HCC tissue microarrays (A). Compared with the normal samples in the surrounding area, the expression of TRIB3 had a much higher staining index (SI). (B). C, TRIB3 had a higher expression trend in the Sp2‐high expression HCC tissues. D, TRIB3 had a higher expression trend in the high ERS HCC tissues. E,F, Sp2 knockdown was significantly down‐regulated TRIB3 in HCC cells. G, Transwell assay suggested that cell migration and invasion were inhibited both in HepG2 and Huh7 cell lines after knock‐down of TRIB3 (Figure 6G).*P < .05 **P < .01
4. DISCUSSION
This study confirmed the role of Sp2 in the carcinogenesis and development of HCC and explored its possible mechanism. The results of WB and IHC study confirmed that SP2 expression was conspicuously up‐regulated in tumor tissues of HCC, which was strongly linked with the progression and poor prognosis of HCC patients. In vitro studies show that Sp2 knockout can significantly inhibit the proliferation and colony formation of HCC cells, induce apoptosis, inhibit migration and invasion. Further experiments show that Sp2 silencing can down‐regulate the expression of TRIB3 and the level of ERS. These findings emphasize that Sp2, as a transcription factor, may combine with enhancers to act on TRIB3 protein, further regulate endoplasmic reticulum stress of HCC, and promote the occurrence and progression of HCC.
Sp2 is one of the transcription factors of the SP family. Previous results show that SP may play a key role in the emergence, evolution, and metastasis of tumors.13 Most research mainly explores the effects of Sp1 in human cancer. Sp1 is a crucial transcription factor that regulates the growth of cancer cells. Its abnormal expression regulates the proliferation and metastasis of tumors through complex mechanisms.14, 15 Researches showed Sp1 is highly expressed in gastric cancer,16 HCC,17 ovarian cancer,18, 19 pancreatic cancer 20 and other tumor cells. At the same time, it shows that Sp1 may further promote tumorigenesis and development by regulating VEGF expression.16, 19 However, there are few reports on the relationship between Sp2 and cancer. Our results have found that the high expression of SP2 is positively related to a series of factors in HCC, which include poor prognosis, clinical stage, lymph node metastasis, and tumor size. The TCGA data further demonstrates the above results. In addition, Zhao and his collaborators 12 have also carried out research on this, and the results confirm that there is an up‐regulation of SP2 expression in human gastric cancer tissue, miR‐638 may induce G1 phase cell cycle arrest by down‐regulating the expression of Sp2. Phan D explored the relationship between Sp2 and prostate cancer.10 They found that for prostate cancer suppressor gene CEACAM1, the main reason for its down‐regulation is the strong expression of SP2. These findings are consistent with our findings. Therefore, we believe that Sp2 may be a potential biomarker of high invasiveness and poor prognosis in HCC. It is further found that the down‐regulation of Sp2 not only decreases the proliferation rate of HCC cells but also significantly inhibits the invasion and migration ability of cells, as well as promoted the apoptosis of tumor cells.
Previous studies have found that differentially expressed genes under endoplasmic reticulum stress may be regulated, and TRIB3 protein is among them. TRIB3 belongs to a member of the mammalian pseudokinase tribbles family, which plays a crucial part in unfolded protein response (UPR).21 It is closely related to various biological processes as an important stress‐related gene.22 As early as 2005, Ohoka has reported that TRIB3 is a novel endoplasmic reticulum stress‐inducing gene.9 During the growth of tumors, a series of endoplasmic reticulum stress inducements, such as glucose deficiency and hypoxia, thus up‐regulating the TRIB3 expression. And TRIB3 could further regulate the downstream biological process of endoplasmic reticulum stress, alleviate cell stress and promote cell survival. We speculate that Sp2 may play a role in promoting cancer by regulating the expression of TRIB3 protein. The experiment discovered that the expression of TRIB3 and GRP78 in Sp2 silenced hepatoma cells decreased significantly. IHC and correlation analysis confirmed that the expression trend of TRIB3 and GRP78 is consistent with Sp2 in HCC tissues; TRIB3 levels were positively correlated with Sp2, which tally with our speculation.
Many kinds of research indicate that TRIB3 promotes the emergence and gradual growth of various types of cancers, such as gastric cancer,23 renal cancer,24 lung cancer,25 oral cancer,26 and is closely related to poor prognosis. Dong et al23 reported that TRIB3 is overexpressing in human gastric cancer, which was associated with the tumor angiogenesis and poor prognosis. Hong et al24 found that TRIB3 plays a vital role in the biological processes of migration and invasion of renal cancer cells by regulating the MAPK pathway. And the high expression of TRIB3 is associated with tumor stage and poor prognosis. Zhou et al25 reported that knocked out TRIB3 in invasive lung cancer cell lines could inhibit malignant behavior in vitro significantly, such as cell invasion and proliferation, and inhibit the metastasis and growth of tumors in vivo. These findings are consistent with our research, suggesting that TRIB3 seems a key player in promoting the proliferation, migration and invasion of cancer cells. However, some studies have found inconsistent findings. Qu et al27 point out that TRIB3 has a higher expression in human endometrial cancer than in benign endometrial tissue and normal tissues. Still, biological experiments showed TRIB3 has a tumor suppressing effect in endometrial cancer, which can promote tumor cell apoptosis and reduce tumor cell proliferation and migration. A study by Wennemers reported that although most of the data make clear elevated TRIB3 mRNA level was associated with poor prognosis, but it was associated with a good prognosis in human breast cancer patients.28 The specific causes and mechanisms of these differences remain unclear, which may be related to the mechanism of TRIB3 participating in endoplasmic reticulum stress‐induced tumor cell apoptosis through CHOP/ATF4 pathway at the same time.29, 30 In addition, we found that knockout of SP2 significantly reduced the protein level of ATF6 but not PERK and IRE1. Under endoplasmic reticulum stress, three pathways of unfolded protein response were activated by three transmembrane proteins that include IRE1, PERK, and ATF6.6 The role of ERS mediated by PERK and IRE1 in the pro‐survival or pro‐apoptotic regulatory mechanism is still controversial, which is believed to be the result of multiple factors including micro‐environment, cell types, and stress conditions.31, 32 Compared with PERK and IRE1, ATF6 is considered to more involved in cell survival mechanism under endoplasmic reticulum stress.33 Moreover Numerous studies suggest that the activated ATF6 signaling pathway is correlated with a low overall survival, tumor growth, relapse, and metastasis as well as resistance to chemotherapy in different cancer types.34 In combination with the experimental results, it can be speculated that the feedback of SP2 and TRIB3 to endoplasmic reticulum stress after their binding is embodied in their regulation on ATF6 signaling pathway which promotes the survival of cancer cells via cellular protection mechanism. In this study, the role of Sp2 in promoting cancer may be related to the feedback effect of TRIB3 in ERS. The transcription factor Sp2 may bind to the ERS specific super‐enhancer, act on TRIB3 protein and enhance its expression, and further heighten ERS by positive feedback. ERS signaling pathway reduces endoplasmic reticulum pressure by enhancing protein folding ability and the degradation of misfolded protein, ensuring the continued survival of tumor cells, thereby playing a vital part in promoting HCC’s occurrence and evolution.
In conclusion, this study provides the first evidence that Sp2 plays a vital part in the emergence and evolution of HCC. The function may be related to the regulation of TRIB3 protein and ERS. Although the specific mechanism is not yet clear, and also need to further follow‐up experiments to clarify. However, the current study may offer new insights into HCC's pathogenesis and therapeutic targets. As mentioned above, the role of TRIB3 in malignant tumors is still controversial, and further work is needed to understand its role in ERS response pathway fully. More studies are required to elucidate the effects of Sp2 and TRIB3 expression on the occurrence, development and prognosis of HCC.
CONFLICT OF INTEREST
The authors declare no conflict of interest.
AUTHOR CONTRIBUTIONS
Guoping Sun initiated and designed the study, Yue Zhu and Jie Cui carried out relevant experiments, Wei Hua collected samples and provided clinical information, Jiatao Liu helped perform the analysis with constructive discussions, Yue Zhu wrote the manuscript. Wei Wei supervised the study. All authors have read and approve the final manuscript.
Zhu Y, Cui J, Liu J, Hua W, Wei W, Sun G. Sp2 promotes invasion and metastasis of hepatocellular carcinoma by targeting TRIB3 protein. Cancer Med. 2020;9:3592–3603. 10.1002/cam4.2977
Funding information
This article was Supported by the National Nature and Science Foundation of China (No. 81872047).
DATA AVAILABILITY STATEMENT
The datasets during and/or analyzed during the current study available from the corresponding author on reasonable request.
REFERENCES
- 1. Bray F, Ferlay J, Soerjomataram I, Siegel RL, Torre LA, Jemal A. Global cancer statistics 2018: GLOBOCAN estimates of incidence and mortality worldwide for 36 cancers in 185 countries. CA: Cancer J Clin. 2018,68(6): 394‐424. [DOI] [PubMed] [Google Scholar]
- 2. Llovet JM, Zucman‐Rossi J, Pikarsky E, et al. Hepatocellular carcinoma. Nat Rev Dis Primers. 2016;2(1):16018. [DOI] [PubMed] [Google Scholar]
- 3. Feng R, Zhai WL, Yang HY, Jin H, Zhang QX. Induction of ER stress protects gastric cancer cells against apoptosis induced by cisplatin and doxorubicin through activation of p38 MAPK. Biochem Biophys Res Commun. 2011;406(2):299‐304. [DOI] [PubMed] [Google Scholar]
- 4. Shin HS, Ryu ES, Oh ES. Endoplasmic reticulum stress as a novel target to ameliorate epithelial‐to‐mesenchymal transition and apoptosis of human peritoneal mesothelial cells. Lab Invest. 2015;95(10):1157‐1173. [DOI] [PubMed] [Google Scholar]
- 5. Pereira ER, Frudd K, Awad W, Hendershot LM. Endoplasmic reticulum (ER) stress and hypoxia response pathways interact to potentiate hypoxia‐inducible factor 1 (HIF‐1) transcriptional activity on targets like vascular endothelial growth factor (VEGF). J Biol Chem. 2014;289(6):3352‐3364. [DOI] [PMC free article] [PubMed] [Google Scholar]
- 6. Peñaranda Fajardo NM, Meijer C, Kruyt FAE. The endoplasmic reticulum stress/unfolded protein response in gliomagenesis, tumor progression and as a therapeutic target in glioblastoma. Biochem Pharmacol. 2016;118:1‐8. [DOI] [PubMed] [Google Scholar]
- 7. Zhang D, Richardson DR. Endoplasmic reticulum protein 29 (ERp29): An emerging role in cancer. Int J Biochem Cell Biol. 2011;43(1):33‐6. [DOI] [PubMed] [Google Scholar]
- 8. Guan M, Chen X, Ma Y, et al. MDA‐9 and GRP78 as potential diagnostic biomarkers for early detection of melanoma metastasis. Tumour Biol. 2015;36(4):2973‐82. [DOI] [PubMed] [Google Scholar]
- 9. Ohoka N, Yoshii S, Hattori T, Onozaki K, Hayashi H. TRB3, a novel ER stress‐inducible gene, is induced via ATF4‐CHOP pathway and is involved in cell death. EMBO J. 2005;24(6):1243‐1255. [DOI] [PMC free article] [PubMed] [Google Scholar]
- 10. Phan D, Cheng C‐J, Galfione M, et al. Identification of Sp2 as a transcriptional repressor of carcinoembryonic antigen‐related cell adhesion molecule 1 in tumorigenesis. Cancer Res. 2004;64(9):3072‐3078. [DOI] [PubMed] [Google Scholar]
- 11. Kim T‐H, Chiera SL, Linder KE, Trempus CS, Smart RC, Horowitz JM. Overexpression of transcription factor Sp2 inhibits epidermal differentiation and increases susceptibility to wound‐ and carcinogen‐induced tumorigenesis. Cancer Res. 2010;70(21):8507‐8516. [DOI] [PMC free article] [PubMed] [Google Scholar]
- 12. Zhao LY, Yao YU, Han J, et al. miR‐638 suppresses cell proliferation in gastric cancer by targeting Sp2. Dig Dis Sci. 2014;59(8):1743‐1753. [DOI] [PubMed] [Google Scholar]
- 13. Dunty WC, Kennedy MWL, Chalamalasetty RB, Campbell K, Yamaguchi TP. Transcriptional profiling of Wnt3a mutants identifies Sp transcription factors as essential effectors of the Wnt/β‐catenin pathway in neuromesodermal stem cells. PloS one. 2014;9(1):e87018. [DOI] [PMC free article] [PubMed] [Google Scholar]
- 14. O'Connor L, Gilmour J. The Role of the Ubiquitously Expressed Transcription Factor Sp1 in Tissue‐specific Transcriptional Regulation and in Disease. Yale J Biol Med. 2016;89(4):513‐525. [PMC free article] [PubMed] [Google Scholar]
- 15. Beishline K, Azizkhan‐Clifford J. Sp1 and the 'hallmarks of cancer'[J]. FEBS J. 2015;282(2):224‐258. [DOI] [PubMed] [Google Scholar]
- 16. Wang L, Wei D, Huang S, et al. Transcription factor Sp1 expression is a significant predictor of survival in human gastric cancer. Clin Cancer Res. 2003;9(17):6371‐6380. [PubMed] [Google Scholar]
- 17. Kong L‐M, Yao LI, Lu N, et al. Interaction of KLF6 and Sp1 regulates basigin‐2 expression mediated proliferation, invasion and metastasis in hepatocellular carcinoma. Oncotarget. 2016;7(19):27975‐27987. [DOI] [PMC free article] [PubMed] [Google Scholar]
- 18. Sankpal UT, Ingersoll SB, Ahmad S, et al. Association of Sp1 and survivin in epithelial ovarian cancer: Sp1 inhibitor and cisplatin, a novel combination for inhibiting epithelial ovarian cancer cell proliferation. Tumour Biol. 2016;37(10):14259‐14269. [DOI] [PubMed] [Google Scholar]
- 19. Su F, Geng J, Li X, et al. SP1 promotes tumor angiogenesis and invasion by activating VEGF expression in an acquired trastuzumab‐resistant ovarian cancer model. Oncol Rep. 2017;38(5):2677‐2684. [DOI] [PMC free article] [PubMed] [Google Scholar]
- 20. Hu H, Wu L‐L, Han T, et al. Correlated high expression of FXR and Sp1 in cancer cells confers a poor prognosis for pancreatic cancer: a study based on TCGA and tissue microarray. Oncotarget. 2017;8(20):33265‐33275. [DOI] [PMC free article] [PubMed] [Google Scholar]
- 21. Sakai S, Miyajima C, Uchida C, et al. Tribbles‐related protein family members as regulators or substrates of the ubiquitin‐proteasome system in cancer development. Curr Cancer Drug Tar. 2016;16(2):147‐156. [DOI] [PubMed] [Google Scholar]
- 22. Corcoran CA, Luo X, He Q, Jiang C, Huang Y, Sheikh MS. Genotoxic and endoplasmic reticulum stresses differentially regulate TRB3 expression. Cancer Biol Ther. 2005;4(10):1063‐1067. [DOI] [PubMed] [Google Scholar]
- 23. Dong S, Xia J, Wang H, et al. Overexpression of TRIB3 promotes angiogenesis in human gastric cancer. Onco Rep. 2016;36(4):2339‐2348. [DOI] [PubMed] [Google Scholar]
- 24. Hong B, Zhou J, Ma K, et al. TRIB3 promotes the proliferation and invasion of renal cell carcinoma cells via activating MAPK signaling pathway. Int J Biol Sci. 2019;15(3):587‐597. [DOI] [PMC free article] [PubMed] [Google Scholar]
- 25. Zhou H, Luo YI, Chen J‐H, et al. Knockdown of TRB3 induces apoptosis in human lung adenocarcinoma cells through regulation of Notch 1 expression. Mol Med Rep. 2013;8(1):47‐52. [DOI] [PubMed] [Google Scholar]
- 26. Zhang J, Wen H‐J, Guo Z‐M, et al. TRB3 overexpression due to endoplasmic reticulum stress inhibits AKT kinase activation of tongue squamous cell carcinoma. Oral Oncol. 2011;47(10):934‐939. [DOI] [PubMed] [Google Scholar]
- 27. Qu J, Liu B, Li B, et al. TRIB3 suppresses proliferation and invasion and promotes apoptosis of endometrial cancer cells by regulating the AKT signaling pathway. Onco Targets Ther. 2019,12:2235‐2245. [DOI] [PMC free article] [PubMed] [Google Scholar]
- 28. Wennemers M, Bussink J, van den Beucken T, Sweep FCGJ, Span PN. Regulation of TRIB3 mRNA and protein in breast cancer. PloS one. 2012;7(11):e49439. [DOI] [PMC free article] [PubMed] [Google Scholar]
- 29. Rouschop KMA, van den Beucken T, Dubois L, et al. The unfolded protein response protects human tumor cells during hypoxia through regulation of the autophagy genes MAP1LC3B and ATG5. J Clin Invest. 2010;120(1):127‐141. [DOI] [PMC free article] [PubMed] [Google Scholar]
- 30. Avery J, Etzion S, DeBosch BJ, et al. TRB3 function in cardiac endoplasmic reticulum stress. Circ Res. 2010;106(9):1516‐1523. [DOI] [PMC free article] [PubMed] [Google Scholar]
- 31. Clarke H, Chambers J, Liniker E, Marciniak S. Endoplasmic reticulum stress in malignancy. Cancer cell. 2014;25(5):563‐573. [DOI] [PubMed] [Google Scholar]
- 32. Hiramatsu N, Chiang W‐C, Kurt TD, Sigurdson CJ, Lin JH. Multiple mechanisms of unfolded protein response‐induced cell death. Am J Pathol. 2015;185(7):1800‐1808. [DOI] [PMC free article] [PubMed] [Google Scholar]
- 33. Yamamoto K, Sato T, Matsui T, et al. Transcriptional induction of mammalian ER quality control proteins is mediated by single or combined action of ATF6alpha and XBP1. Dev Cell. 2007;13(3):365‐376. [DOI] [PubMed] [Google Scholar]
- 34. Liu C‐Y, Hsu C‐C, Huang T‐T, et al. ER stress‐related ATF6 upregulates CIP2A and contributes to poor prognosis of colon cancer. Mol oncol. 2018;12(10):1706‐1717. [DOI] [PMC free article] [PubMed] [Google Scholar]
Associated Data
This section collects any data citations, data availability statements, or supplementary materials included in this article.
Data Availability Statement
The datasets during and/or analyzed during the current study available from the corresponding author on reasonable request.