Abstract
Nanocomposites based on Au- and SiO2-modified SnO2 were studied as sensitive materials for ethanol and benzene detection in dry (RH = 1%) and humid (RH = 20%) air. Modification of SnO2 by amorphous SiO2 (13 mol.%) was effectuated by hydrothermal synthesis; modification by Au nanoparticles (1 wt.%) was carried out via impregnation by citrate-stabilized Au sol. The composition of the samples was determined by X-ray fluorescent spectroscopy and energy-dispersive X-ray spectroscopy. The microstructure was characterized by XRD, HRTEM, and low-temperature nitrogen adsorption. The surface groups were investigated by XPS, TPR-H2, and FTIR spectroscopy. DRIFT spectroscopy was performed to investigate the interaction between ethanol and the surface of the synthesized materials. Studies of the sensor properties have shown that in all cases the most sensitive is the SnO2/SiO2-Au nanocomposite. This material retains high sensitivity even in a humid atmosphere. The obtained results are discussed in terms of the synergistic effect of two modifiers (Au and SiO2) in the formation of sensor properties of SnO2/SiO2–Au nanocomposites.
Keywords: tin dioxide, silicon dioxide, Au clusters, hydrothermal synthesis, gas sensor, thermal stability, humid air, volatile organic compounds
1. Introduction
Wide-band semiconductor metal oxides have proven to be excellent sensitive materials for gas sensors. Bulk doping of these oxides or modification of their surface by various catalytic clusters can increase their sensitivity and selectivity in detecting most toxic gases [1]. In addition to high sensitivity and selectivity, the most important characteristic of a sensor material is the stability of its properties. When working with sensors based on semiconductor metal oxides, a drift in resistance values can be observed over time. The main reason for this effect is an increase in the size of the nanoparticles of a semiconductor material at operating temperatures [2,3]. As was briefly summarized in References [4,5] the introduction of SiO2 into the SnO2 semiconductor matrix is one of the promising approaches for creating sensor materials with a high stability of microstructure parameters under conditions of semiconductor gas sensors’ operation. It was found [4,5] that the modification of tin dioxide with amorphous SiO2, on the one hand, prevents the growth of SnO2 nanoparticles during high-temperature post-synthetic processing that ensures the long-term stability of sensor characteristics at high temperatures even in humid air. The temperature stability of SnO2/SiO2 nanocomposites allows it to be used for detecting gases that require a high operating temperature (300–400 °C or higher) [6,7,8]: methane, hydrogen, volatile organic compounds (VOCs), which include ethanol, benzene, toluene, and others. VOCs have a different toxicity. For example, poisoning with ethanol vapor (the threshold limit value, TLV is 522 ppm [9]) leads to difficulty breathing, nausea, headache and dizziness [10]. Mixtures of air with ethanol in a concentration of 2.6–18.9 vol% are explosive [9]. Benzene (TLV is 4.6 ppm in working zone and 1.6 ppb in residential area), which is a carcinogen, has a significantly higher toxicity. Benzene vapors at a concentration of 0.8–8.6 vol% are explosive. Chronic poisoning leads to damage to the liver and central nervous system [9]. Thus, it is extremely important to accurately and quickly detect VOCs in the air of residential and work areas. Based on the data presented in the reviews [6,8,11,12,13], the optimal detection temperatures for ethanol and benzene using metal oxide based sensors are 250–300 °C and 300–400 °C, respectively. This indicates that it is necessary to use materials that retain a high specific surface area at very high temperatures to detect these gases. This requirement is fully met by SnO2/SiO2 nanocomposites.
Gold clusters deposited on metal oxides exhibit high catalytic activity in the reactions of partial hydrogenation, synthesis of hydrogen peroxide, oxidation of CO, hydrocarbons, and also volatile organic compounds [14,15,16,17,18,19,20]. The activity of Au-based catalysts depends on many factors, including deposition methods on the oxide surface [14,21], the chemical nature of the support [22,23], the concentration [24,25,26,27] and the size [28,29] of Au nanoparticles. A summary of the literature data about the sensor properties of Au-modified SnO2 sensor materials towards VOCs ethanol and benzene is presented in Table 1.
Table 1.
Sensor properties of Au-modified SnO2 sensor materials towards the detection of ethanol and benzene.
| Material Type | Au Modification Method | Gas | CGas, ppm | Tmes., °C | Sensor Signal | Reference |
|---|---|---|---|---|---|---|
| nanorods | Physical vapor deposition (PVD) | C2H5OH | 50 | 350 | 98 | [30] |
| bamboo-like nanorods | multistep alternate PVD of SnO2 and Au | 339 | ||||
| powders | deposition-precipitation | C2H5OH | 200 | 350 | 158 | [31] |
| nanoflowers | impregnation | C2H5OH | 100 | 200 | 123 | [32] |
| nanoflowers | deposition-precipitation | C2H5OH | 150 | 340 | 30 | [33] |
| nanowires | γ-ray radiolysis | C6H6 | 1 | 300 | 3 | [34] |
| nanofibres | electrosputtering | C6H6 | 10 | 300 | 2 | [35] |
| hollow spheres | electronic beam evaporation | C6H6 | 5 | 350 | 22 | [36] |
| C2H5OH | 10 | |||||
| nanofibres | UV-radiation + electrospinning | C6H6 | 2 | 400 | 4.5 | [37] |
This work is devoted to the study of the sensor properties of the thermally stable nanocrystalline SnO2/SiO2 composite to ethanol and benzene. To increase the sensitivity, the surface of SnO2/SiO2 nanocomposite was modified with Au nanoparticles. Based on the data from [24,25,26,27] for a combination of high catalytic activity and optimal resistance values for sensor measurements, the selected Au concentration was 1 wt.%. The most important result is that Au-modified SnO2/SiO2 retains a high sensitivity to ethanol and benzene in a humid atmosphere. Based on the DRIFTS investigations, this fact is discussed in terms of the synergistic effect of two modifiers (Au and SiO2) in the formation of sensor properties of the SnO2/SiO2-Au nanocomposite.
2. Materials and Methods
2.1. Materials Synthesis
It was found [4,5] that the SnO2/SiO2 nanocomposite with the composition ([Si]/([Sn] + [Si]) = 13 mol.% has optimal characteristics: a high specific surface area retained during high-temperature annealing (600 °C, 24 h); base line resistance suitable for sensor measurements; minimum sensitivity to the humidity change in the RH range from 4% to 65% over the whole range of operating temperatures. Therefore, this material has been selected as the matrix for the modification with Au nanoparticles. The synthesis of the SnO2/SiO2 nanocomposite ([Si]/([Sn] + [Si]) = 13 mol.%) was performed by hydrothermal method at 150 °C for 24 h using a xerogel of β- stannic acid SnO2·H2O and sol Si(OH)4. β- Stannic acid xerogel was obtained by ammonia hydrolysis of SnCl4·5H2O (98%, Sigma-Aldrich, St. Louis, MO, USA) with subsequent heat treatment at 50 °C for 24 h. Sol Si(OH)4 was obtained by hydrolysis of tetraethoxysilane (TEOS) (98%, Sigma-Aldrich, St. Louis, MO, USA). The synthesis method is described in detail in [4]. Post-synthetic annealing of the samples was performed at 600 °C for 24 h. Modification with Au (1 wt.%) was performed by mixing annealed SnO2/SiO2 powder and the sol of Au nanoparticles stabilized with sodium citrate, with the slow addition of a 1 M NaOH solution (>98%, Lahema, Prague, Czech Republic) to pH = 4.5–5.5. The sol of Au nanoparticles (1 mg/mL) was obtained by boiling a HAuCl4 solution (98%, Sigma-Aldrich, St. Louis, MO, USA) in distilled water with a solution of sodium citrate Na3C6H5O7 (>99%, Sigma-Aldrich, St. Louis, MO, USA). This method allows the obtaining of Au nanoparticles of a predetermined size [38]. Postmodification annealing was performed at 400 °C for 24 h. The sequence of synthesis stages can be described as Scheme 1.
Scheme 1.
SnO2/SiO2-Au nanocomposite synthesis scheme.
To determine the influence of SiO2 and Au on the sensor properties of tin dioxide, we also obtained SnO2 and SnO2-Au samples. Tin dioxide was obtained by annealing the xerogel of β-tin acid SnO2·H2O at 300 °C for 24 h. The modification with Au nanoparticles was carried out similarly to the preparation of SnO2/SiO2-Au nanocomposite, except that the postmodification annealing temperature in this case did not exceed 300 °C. The sequence of synthesis stages can be described as Scheme 2.
Scheme 2.
SnO2-Au synthesis scheme.
2.2. Materials Characterization
The Au concentration in SnO2-Au and SnO2/SiO2-Au samples was determined by X-ray fluorescence spectroscopy on an M1 MISTRAL instrument (Bruker, Berlin, Germany). The silicon content in SnO2/SiO2 and SnO2/SiO2-Au samples was determined by energy-dispersive X-ray spectroscopy (EDX) on a Carl Zeiss NVision 40 instrument (Carl Zeiss, Oberkochen, Germany).
The phase composition of sensitive materials was analyzed by X-ray diffraction on a DRON-4 diffractometer using monochromatic CuKα radiation (λ = 1.5406 Å) in the range of 2θ = 5–60° with a 0.1° increment. The crystallite size (dXRD) of the SnO2 phase was estimated from the broadening of the most intense XRD (101) and (110) peaks using Scherrer equation.
The microstructure of the modified nanocomposites was studied by high-resolution transmission electron microscopy on a JEM-2010 instrument (JEOL, Tokyo, Japan) with an accelerating voltage of 200 kV.
The specific surface area (Ssurf) was determined by low-temperature nitrogen adsorption on ASAP 2020 and Chemisorb 2750 instruments (Micromeritics, Norcross, GA, USA), followed by analysis using the BET model.
The surface composition was studied by IR spectroscopy, X-ray photoelectron spectroscopy (XPS), and thermoprogrammed reduction with hydrogen (TPR-H2). The IR spectra were recorded on a Frontier FTIR spectrometer (Perkin Elmer Inc., Waltham, MA, USA) in the transmission mode in the range of 4000–400 cm−1 with a 1 cm−1 step. The powders (1 wt.%) were grinded with dried KBr (“for FTIR analysis”, Aldrich, St. Louis, MO, USA) and pressed into tablets. IR spectra in the reflection mode during in situ studying the interaction of samples with ethanol were recorded in the range 4000–1000 cm−1 with a step of 1 cm−1 using a CdSe window. The ethanol vapor stream was set by bubbling part of the air stream through the absolute C2H5OH.
The X-ray photoelectron spectra were obtained on a K-Alpha spectrometer (ThermoFisher Scientific, Waltham, MA, USA) equipped with a monochromatic Al Kα X-ray source (E = 1486.7 eV). The positions of the peaks in the binding energy scale were corrected using the C1s peak corresponding to the carbon contamination of the surface (285.0 eV) with an accuracy of 0.1 eV. XP-spectra were fitted by Gaussian–Lorentzian convolution functions with the simultaneous optimization of Shirley background parameters.
The oxidative surface active sites were studied by the method of thermoprogrammed reduction with hydrogen (TPR-H2) on the Chemisorb 2750 (Micromeritics). The pre-treatment of the samples before the measurements was carried out in oxygen flow (20 mL/min) and included heating (10 °C/min) to 200 °C, annealing at 200 °C for 30 min, and cooling down to room temperature. During the TPR-H2 experiment, a H2/Ar gas mixture (8 vol.% H2) was passed through a flow-through quartz test tube with a sample. The heating was carried out up to 800 °C with a rate of 10 °C/min). The amount of hydrogen consumed in a given temperature range was calculated using calibration measurements for a standard Ag2O sample.
2.3. Study of Sensor Properties
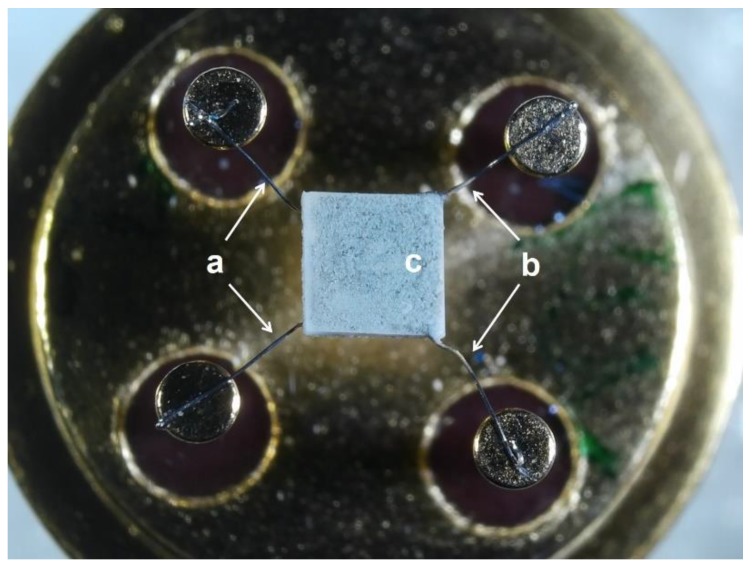
For gas sensor measurements, the powders of obtained materials were mixed with α-terpeniol (90%, Kosher, SAFC, St. Louis, MO, USA) to form a paste and then deposited layer by layer on alumina substrates with platinum contacts on the top side and platinum heater on the back side (Figure 1). After each layer deposition, it was dried at a temperature of 300 °C for 3 min by applying voltage to the heating contacts. The degree of coverage was controlled through an optical microscope. In all cases, five layers were applied, which provided a total film thickness in the range of 1.0–1.2 microns. The method of applying layers of a given thickness was pre-calibrated on glass substrates. The thickness of films on glass substrates was calculated from XRF data based on a decrease in the intensity of the Ca line. Thick films thus obtained were annealed for 24 h at 300 and 400 °C in the case of SnO2, SnO2-Au and SnO2/SiO2, SnO2/SiO2-Au, respectively, by using the backside heater. At an operating temperature of 300 °C, the power consumption of the sensor element is about 0.5 W. The interaction of the obtained materials with the gas phase was studied by in situ measurement of electrical conductivity. Certified gas mixtures containing 5220 ppm ethanol and 52.5 ppm benzene in N2 were used as the gas sources. The flow rate of the mixture of air and the detected gas in all measurements was constant at 100 ± 0.5 mL/min. The gas concentration was set using the gas flow controllers (Bronkhorst). The period of interaction of the sensors with the gas mixture and pure air was 15 and 30 min, respectively. To control reproducibility, three cycles of measurements were performed at each temperature. A relative humidity (at 25 °C) was set and controlled by Humidifier P-2 (Cellkraft AB, Stockholm, Sweden). The response S of the sensor was calculated as S = Rair/Rgas, where Rgas is the resistance of the sample in the presence of ethanol or benzene, Rair is the resistance in pure air.
Figure 1.
Microelectronic chip with: (a) platinum measuring contacts; (b) platinum heating contacts and (c) active layer of SnO2/SiO2 on the Al2O3 substrate.
3. Results
The analysis of the obtained SnO2-300, SnO2-Au, SnO2/SiO2, SnO2/SiO2-Au samples by X-ray diffraction showed the presence of only crystalline phase SnO2 with the cassiterite structure (ICDD 41–1445) (Figure S1, Supplementary Information). No Au-containing phases were detected because of the low Au content. The results of the analysis of the elemental composition, microstructure parameters, and electrophysical properties of the obtained samples are shown in Table 2. The addition of SiO2 at the stage of hydrothermal treatment of β-tin acid allows the stabilizing of the growth of SnO2 nanoparticles at high-temperature annealing and samples with a high specific surface area, similar to pure SnO2 annealed at lower temperature 300 °C, can be obtained. The increase in the sample’s resistance in the raw R (SnO2-300) < R (SnO2-Au) < R (SnO2/SiO2) < R (SnO2/SiO2-Au) is associated with the formation of Schottky barriers at the metal/semiconductor interface and dielectric properties of silicon dioxide. When the SnO2/SiO2 surface is modified by gold, due to the difference in the electron work function of Au (5.1 eV) [39] and SnO2 (<4.8 eV) [40], a Schottky barrier arises at the metal/semiconductor interface. This results in an increase in the thickness of the electron-depleted layer near the surface of the SnO2 crystallites and, consequently, an increase in the sensor resistance.
Table 2.
Composition, microstructure parameters and electrophysical properties of the obtained samples.
| Sample | Au, wt.% 1 | SiO2, mol.% 2 | Phase Composition | dXRD ± 0.5 nm | Ssurf ± 5 m2/g | Resistance in Air at 150oC, RH = 1%, 106 Ohm |
|---|---|---|---|---|---|---|
| SnO2-300 | - | - | SnO2 | 3.1 | 94 | 9 |
| SnO2-Au | 2.44 ± 0.03 | - | SnO2 | 3.0 | 91 | 60 |
| SnO2/SiO2 | - | 13.0 ± 0.8 | SnO2 | 2.8 | 105 | 50 |
| SnO2/SiO2-Au | 3.64 ± 0.05 | 13.0 ± 0.8 | SnO2 | 3.3 | 100 | 300 |
1 determined by X-ray fluorescence analysis; 2 determined by energy dispersive X-ray spectroscopy.
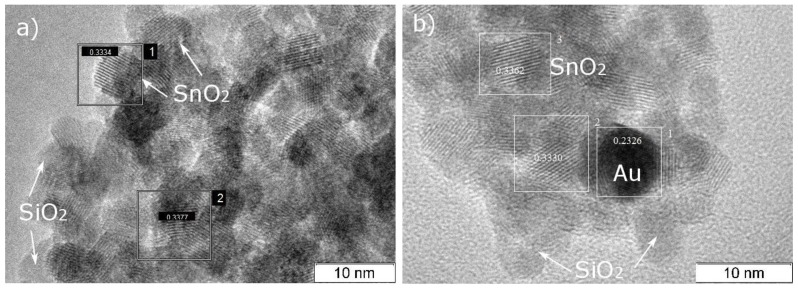
At the HRTEM image of SnO2/SiO2 (Figure 2a), the crystalline SnO2 phase with interplanar distances d = 0.34 nm (110) and amorphous silica particles distributed evenly on the surface of the semiconductor oxide are clearly distinguished. The cluster size of the Au modifier is one of the key factors affecting catalytic activity. According to the literature data, the optimal diameter of gold nanoparticles, which are highly active in oxidation reactions, is in the range of 1–10 nm [14,26,27,29,41]. A larger particle size leads to an insufficient degree of dispersion of the deposited modifier. According to HRTEM, the size of Au clusters on the surface of modified SnO2/SiO2 nanocomposites is 8 ± 1 nm (Figure 2b).
Figure 2.
HRTEM images of samples: (a) SnO2/SiO2; (b) SnO2/SiO2-Au.
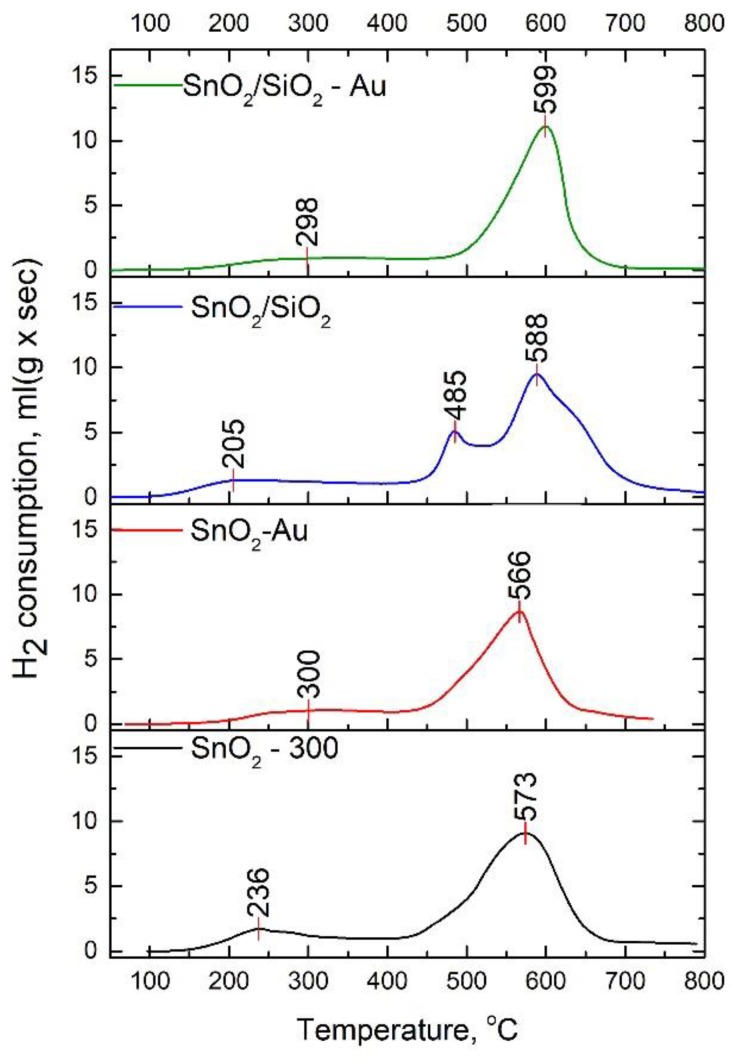
Active sites on the surface of the samples with oxidizing properties were studied by the method of thermally programmed reduction with hydrogen (TPR-H2). Figure 3 shows the temperature dependences of hydrogen consumption rates for SnO2-300, SnO2-Au, SnO2/SiO2, and SnO2/SiO2-Au samples. The TPR-H2 profiles of all samples contain two peaks. The appearance of a peak in the low-temperature region at 170–320 °C is associated with the reduction in oxygen-containing O2-, O- and OH-groups on the surface of semiconductor materials. On TPR-H2 profiles of the Au-modified samples, a shift of the maximum in this peak to higher temperatures is observed by 64 °C and 93 °C in the case of SnO2-Au and SnO2/SiO2-Au, respectively. This effect of increasing the activation energy of the reaction of reduction of surface groups can be explained by the presence of additional reactive oxygen species and their localization in the region of the Au/SnO2 interface [14,42,43].
Figure 3.
Temperature dependences of hydrogen consumption rate during reduction of SnO2-300, SnO2-Au, SnO2/SiO2 and SnO2/SiO2-Au samples.
In the temperature range 450–700 °C, the consumption of hydrogen is due to a Sn4+ → Sno reduction. In the case of the SnO2/SiO2 sample, in a high-temperature peak, two components are distinguished. The appearance of a signal with a maximum at 485 °C is due to the partial reduction of Sn4+ → Sn2+. The maximum of the component responsible for the reduction in metal tin in SnO2/SiO2 and SnO2/SiO2-Au samples is shifted by 15 and 26 degrees, respectively, to higher temperatures, compared to the unmodified SnO2-300 sample, due to the presence of the SiO2 phase, which is resistant to reduction with hydrogen under given conditions. At the TPR-H2 profile of SnO2/SiO2 nanocomposite, one can distinguish an additional high-temperature shoulder at 640 °C. This may be due to the difficult reduction in tin cations linked with SiO4 groups. The introduction of Au clusters leads to the disappearance of this shoulder, which can indicate the weakening of the Sn-O bond on the perimeter of the SnO2-SiO2 heterocontact under the influence of the modifier. The amount of hydrogen consumed during sample reduction that was determined is shown in Table 3.
Table 3.
TPR-H2 measurement results.
| Sample | Hydrogen Consumption, mol H2 per 1 mol SnO2 | ||
|---|---|---|---|
| Total | at 25 °C–400 °C | at 400 °C–800 °C | |
| SnO2-300 | 1.9 | 0.2 | 1.7 |
| SnO2-Au | 1.6 | 0.1 | 1.5 |
| SnO2/SiO2 | 2.3 | 0.3 | 2.0 |
| SnO2/SiO2-Au | 2.4 | 0.4 | 2.0 |
The total amount of consumed H2 per 1 mol of tin dioxide is close to the theoretical value (n = 2) determined by the reaction
| SnO2 + 2H2 = Sn + 2H2O | (1) |
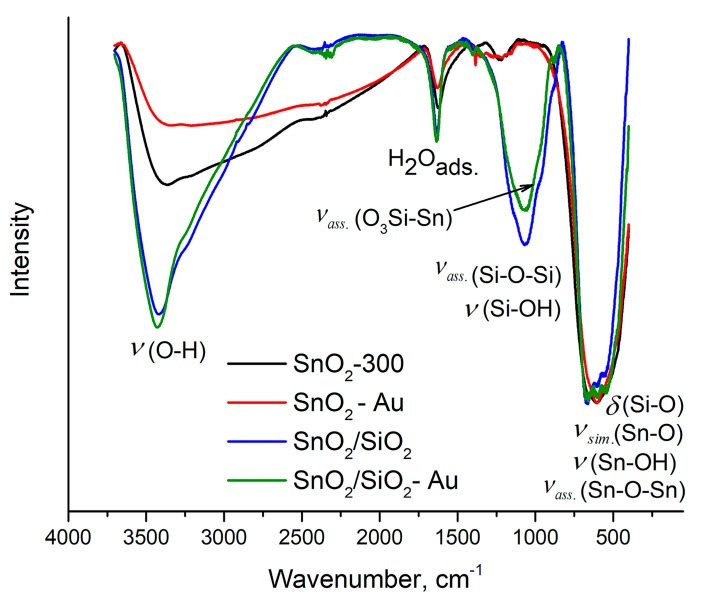
For the reduction in oxygen-containing groups on the surface of SnO2/SiO2 and SnO2/SiO2-Au, a greater amount of hydrogen is needed than in the case of samples unmodified with silicon dioxide. This can be explained by the additional contribution of silanol Si-OH groups present on the surface of these samples. The broad absorption band with a maximum at 1100 cm–1 in the IR spectra of SiO2 containing samples is due to the superposition of antisymmetric vibrations of Si-O-Si bridge bonds and vibrations of silanol groups (1250–870 cm–1) (Figure 4).
Figure 4.
IR-spectra of SnO2-300, SnO2-Au, SnO2/SiO2 and SnO2/SiO2-Au samples.
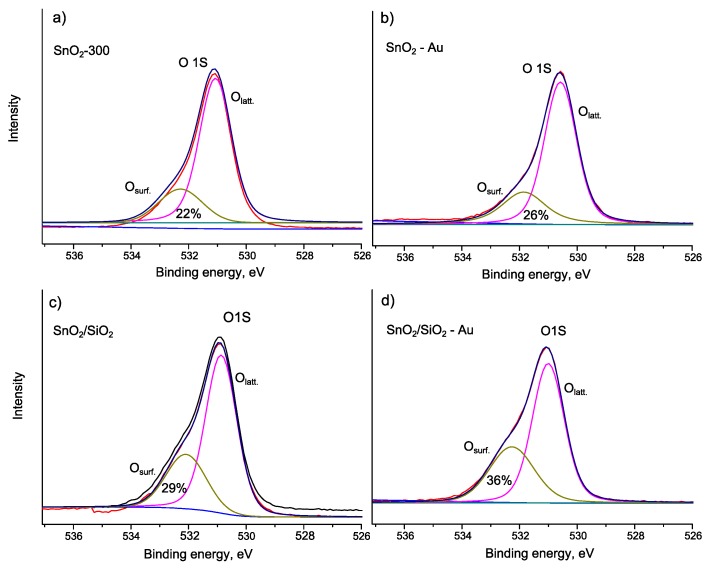
The surface composition of the obtained sensor materials was studied by the XPS method. The Sn 3d component is described by a doublet with peak maxima at 495.6 (Sn 3d5/2) and 487.2 (Sn3d3/2), which corresponds to Sn (IV) in SnO2 [44]. The spectra of samples containing SiO2 contain a signal from Si 2p with an energy of 103 eV [4]. The O 1s XP spectrum has an asymmetric form and decomposes into two peaks with energies of 531 eV (Olat) and 532 eV (Osurf). The first component has a much higher intensity and corresponds to the lattice oxygen of SnO2. The presence of the second peak corresponds to the different forms of chemisorbed oxygen and hydroxyl groups on the surface of the obtained materials. The ratio of integrated intensities Osurf/Olat increases in the series SnO2-300 < SnO2-Au < SnO2/SiO2 < SnO2/SiO2-Au (Figure 5, Table 4), which is consistent with the data of TPR-H2 and IR-spectroscopy. Thus, the modification of tin dioxide by SiO2 and Au makes it possible to increase the concentration of surface oxygen-containing groups compared to pure SnO2 with the same specific surface area.
Figure 5.
O 1s XP-spectra of: (a) SnO2-300; (b) SnO2-Au; (c) SnO2/SiO2 and (d) SnO2/SiO2-Au.
Table 4.
XPS measurement results.
| Sample | Osurf/Olat | Binding Energy, eV | ΔE (Sn 3d5/2-O1s), eV | ||
|---|---|---|---|---|---|
| Sn 3d5/2 | Au 4f7/2 | O 1s (lat) | |||
| SnO2-300 | 0.28 | 487.2 | - | 531.1 | 43.9 |
| SnO2-Au | 0.35 | 486.7 | 83.4 | 530.6 | 43.9 |
| SnO2/SiO2 | 0.36 | 487.1 | - | 531.1 | 44.0 |
| SnO2/SiO2-Au | 0.56 | 487.2 | 83.9 | 530.1 | 42.9 |
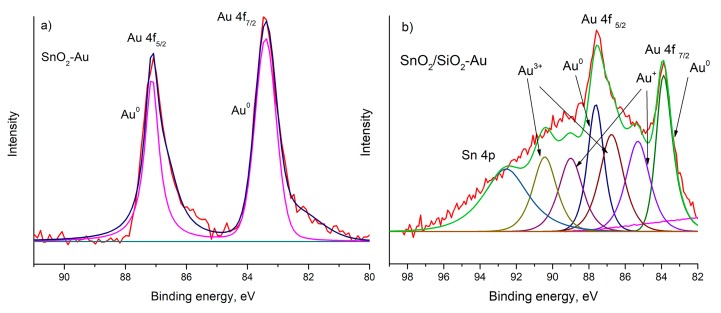
The signal from Au 4f7/2 (83.4 eV) in the SnO2-Au spectrum is somewhat shifted from the reference value of Au 4f7/2 (84.0 eV [44]). The main form of the modifier is metallic gold (Figure 6a), which is consistent with the data on the study of the charge state of gold catalysts deposited on oxide supports [45]. However, the corresponding spectral region of the SnO2/SiO2-Au sample has a more complex structure (Figure 6b), in which the components of metallic gold (83.9 eV 4f7/2), as well as Au+ (85.3 eV 4f7/2) and Au3+ cations (86.8 eV 4f7/2) [46] are present. The relative fractions of Au+ and Au3+ states are 11.2% and 11.4%, respectively. In addition, the region of the Au f-lines overlaps with the broad peak of Sn 4p (92.5 eV) [47]. The appearance of peaks corresponding to Au3+ in the SnO2/SiO2-Au spectrum can be explained by the ability of Au3+ (r(Au3+) = 0.068 nm) to integrate at the positions of coordination-unsaturated tin cations Sn4c (r(Sn4+) = 0.069 nm) on the non-stoichiometric SnO2 surface. In our previous work [5], it was found that the addition of SiO2 in an amount of 13 mol.% leads to an increase in the concentration of paramagnetic defects Sn3+ by 6.8 times in comparison with pure tin dioxide. The appearance of AuSn sites leads to a change in the electron density distribution on the Sn-O bond, which is confirmed by a decrease in ΔE (Sn 3d5/2-O1s) for the SnO2/SiO2-Au sample by 1.1 eV (Table 4) compared to the standard value for SnO2 (44 eV [44]). Cabot et al. [45] found a localization of Auδ+ at the sites of distortion of the SnO2 lattice. Yinga et al. [46] described the effect of the degree of defectiveness of the carrier on the charge state of Au. An additional effect exerted by silicon dioxide is the stabilization of cationic forms of gold by hydroxyl groups, due to the formation of an Auδ+-OH-bond [43,48,49] whose concentration on the surface of the SnO2/SiO2-Au sample is increased compared to SnO2-Au due to the contribution of silanol groups. It is worth noting that it is the presence of cationic forms Au+ and Au3+ that are associated with the high catalytic activity of gold catalysts [18,29,50,51], due to the preferred adsorption of oxygen on Auδ+ compared to metallic gold, as well as free d-orbitals of Au3+.
Figure 6.
Au-component XP-spectra of: (a) SnO2-Au and (b) SnO2/SiO2-Au.
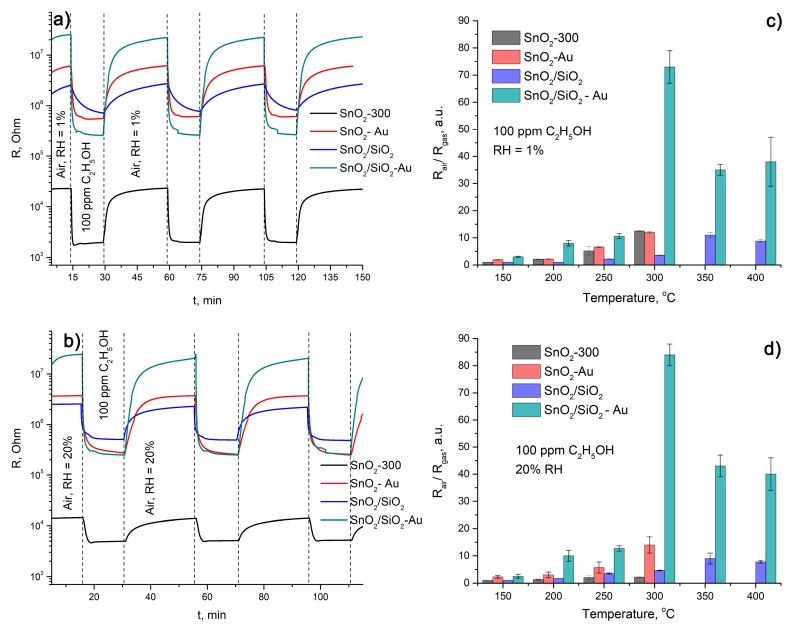
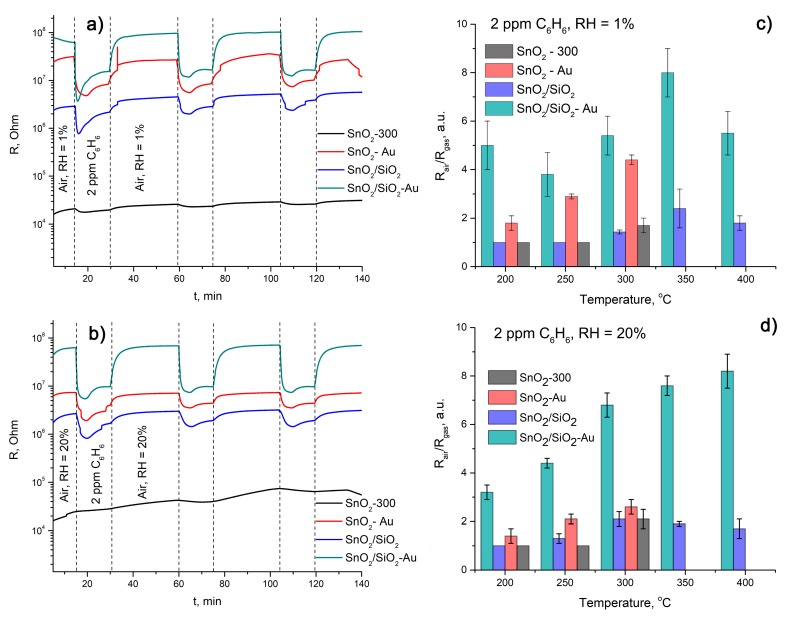
The sensor properties of the obtained semiconductor materials were studied in the detection of ethanol (Figure 7) and benzene (Figure 8) in dry air (RH = 1% at 25 °C) and at a relative humidity of RH = 20% (at 25 °C) in the temperature range of 150–400 °C with increments of 50 °C. The maximum measurement temperature for sensors based on SnO2-300 and SnO2-Au did not exceed the temperature of their post-synthetic treatment, i.e., 300 °C. In the presence of ethanol vapor (Figure 7a,b), the resistance of all sensors is reduced. After each cycle of interaction with the gas being determined, the resistance value in air reaches the initial value. The sensor signals are reproducible (Figure 7c,d).
Figure 7.
Change in the sample resistance at 300 °C in the presence of 100 ppm C2H5OH in dry air (a) and at RH = 20% (b). Temperature dependence of the sensor response in dry air (c) and at RH = 20% (d).
Figure 8.
Change in the samples’ resistance at 300 °C in the presence of 2 ppm C6H6 in dry air (a) and at RH = 20% (b). Temperature dependence of the sensor response in dry air (c) and at RH = 20% (d).
According to the literature data, the oxidation of ethanol on oxide surfaces proceeds in several stages. First, dissociative chemisorption of C2H5OH occurs with the formation of ethoxide by the reaction
| C2H5OH(g) → C2H5O(ads) + H(ads.). | (2) |
C2H5OH adsorption occurs through the oxygen atom of the hydroxyl group of the alcohol molecule on coordinatively unsaturated metal cations [52], while the hydrogen atom forms a weak bond with the surface oxygen anion. Further, depending on the conditions, ethoxide can be oxidized to acetaldehyde when reacted with chemisorbed oxygen species O- or O2- [17,52,53]
| C2H5O(ads) + O-(ads) → CH3CHO(ads) + H2O + e- | (3) |
| C2H5O(ads) → C2H4(ads) + OH(ads) | (4) |
The reactions responsible for the sensor response proceed via oxidation of organic species by O– as the predominant form of chemisorbed oxygen on the SnO2/SiO2 surface at 300–400 °C [5]. The resulting acetaldehyde enters into a decarbonylation reaction with the formation of methane and carbon monoxide
| CH3CHO(ads) → CH4(g) + CO(g), | (5) |
or further oxidizes to acetic acid
| (6) |
The incomplete oxidation reactions (3) and (6) mainly proceed up to 220–250 °C [52,53]. At higher temperatures, ethoxide and intermediates are oxidized to carbon dioxide
| CH3CHO(ads) + 5O-(ads) → 2CO2(g) + 2H2O + 5e-, | (7) |
| C2H4(ads) + 6O-(ads) → 2CO2(g) + 2H2O + 6e-. | (8) |
The sensitivity of pure tin dioxide decreases significantly in humid air (Figure 7d), while the sensor signal of SnO2/SiO2 remains almost unchanged due to its resistance to changes in relative humidity over a wide range [4]. Modification by the Au also made it possible to neutralize the negative effects of humidity. The Au-modified SnO2/SiO2 nanocomposite demonstrates the highest sensor response to ethanol among the obtained semiconductor materials. The temperature of the maximum signal to 100 ppm C2H5OH in both dry and wet air was 300 °C (Figure 7c,d). The absolute values of the response also coincide within the error. Sensor properties of SnO2-300, SnO2-Au, SnO2/SiO2 and SnO2/SiO2-Au towards 100 ppm C2H5OH at 300 °C are summarized in Table 5. Modification by silicon dioxide prevents the increasing of sensors’ response and recovery times in humid air.
Table 5.
Sensor properties of SnO2-300, SnO2-Au, SnO2/SiO2 and SnO2/SiO2-Au towards 100 ppm C2H5OH at 300 °C.
| Sample | Sensor Response | t, resp., s | t rec., s | |||
|---|---|---|---|---|---|---|
| RH = 1% | RH = 20% | RH = 1% | RH = 20% | RH = 1% | RH = 20% | |
| SnO2-300 | 12.5 ± 0.1 | 2.2 ± 0.1 | 83 ± 3 | 133 ± 2 | 167 ± 6 | 195 ± 4 |
| SnO2-Au | 12 ± 1 | 14 ± 3 | 88 ± 2 | 124 ± 4 | 164 ± 3 | 178 ± 6 |
| SnO2/SiO2 | 3.6 ± 0.1 | 4.6 ± 0.1 | 352 ± 5 | 119 ± 3 | 184 ± 7 | 124 ± 3 |
| SnO2/SiO2-Au | 73 ± 6 | 84 ± 4 | 93 ± 3 | 90 ± 2 | 159 ± 5 | 168 ± 3 |
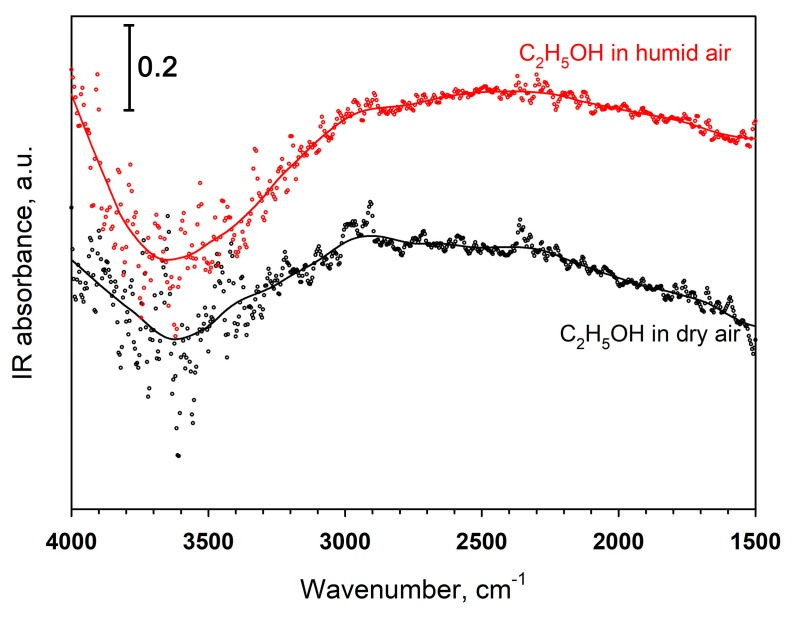
To determine the reason for the stability of the sensor response of Au-modified SnO2/SiO2 nanocomposite with an increase in air humidity, the interaction of this material with ethanol vapor in dry and wet air was studied by DRIFT spectroscopy in operando mode. The negative change in the vibration intensities of hydroxyl groups in the range 3300–3700 cm−1 (Figure 9) during the interaction of the surface of the SnO2/SiO2-Au sample with C2H5OH vapor indicates their direct participation in the adsorption of ethanol molecules
| C2H5OH(ads) + OH(ads) = C2H5O(ads) + H2O(g). | (9) |
Figure 9.
DRIFT spectra of SnO2/SiO2-Au during C2H5OH exposure at 300 °C in dry and humid air (RH = 20%).
Due to the high noise DRIFT IR spectra caused by an apparently more complex composition the surface of the test sample, we were not able to detect the oscillations of C-O bonds (1080–1115 cm−1), νass. CH3-, CH2- groups (2900–2990 cm−1), corresponding to adsorbed ethanol, νs. CH3-, CH2- located in the region (1300–1500 cm−1) [53,55,56], as well as vibrations of mono- (1530–1470, 1370–1300 cm−1) and bidentant carbonates (1630–1590, 1270–1260 cm−1) [53], Sn4+-CO, SiO2-CO (2100–2200 cm−1), corresponding to intermediate oxidation products.
At temperatures below 250 °C, the stability of Au-modified sensor materials to increased relative humidity can be due to the involvement of water molecules adsorbed on the surface of the semiconductor oxide in the process of oxygen activation along the perimeter of the Au/SnO2 contact
| O2(p) + H2O(surf) → O* + 2OH(p), | (10) |
where (p) indicates the particles adsorbed in the region of the perimeter of the Au/SnO2 contact, (surf) indicates particles adsorbed on the surface of the semiconductor oxide, (*) denotes the active forms of chemisorbed oxygen [23]. DFT calculations [57,58] showed that the energy of co-adsorption of H2O and O2 on the Au (111) surface is much lower than the sum of the individual adsorption energies. The adsorption of water molecules at an increased humidity (RH = 20%) also reduces the electron work function for Au [58]. The resulting excess electrons on gold are transferred to electron-acceptor Oads. In sensor measurements in humid air, the effect of stabilization of the cationic forms of gold by hydroxyl groups appears. The described effects are clearly manifested in an increase in the conversion of CO oxidation reactions on Au catalysts deposited on various oxide supports at high air humidity and low temperatures (below the onset of H2O desorption) [23,43,59]. Another factor affecting the increase in the sensor signal to 100 ppm C2H5OH, materials modified with gold, is the possibility of the adsorption of alcohol molecules directly onto Au nanoparticles [53]. It can also be assumed that the reaction with Hads [60], which was formed during the deprotonation of ethanol (Equation (2)), contributes to the formation of such a high sensor signal of the obtained semiconductor materials
| H(ads)+ SnSn + O-(ads) ↔ Sn-OH + e-, | (11) |
| H(ads)+ OO ↔ (OH)O+ + e-. | (12) |
Sensors based on SnO2-300 do not show sensor sensitivity to benzene in either dry or wet air (Figure 8). A small sensor response is found for SnO2/SiO2 at high temperatures above 300 °C. Such high temperatures are caused by the stability of the benzene molecule, the complete oxidation of which is a complex multi-electron process [7]
| C6H6 + 15O- → 6CO2 + 3H2O + 15e-. | (13) |
The modification of semiconductor materials with Au nanoparticles made it possible to detect benzene at a concentration of 2 ppm (Figure 8c,d). The sensitivity of the SnO2-Au sample in the atmosphere of humid air is somewhat reduced, apparently due to the competitive adsorption of C6H6 and H2O molecules. As in the case of ethanol, the sensor based on SnO2/SiO2-Au has the highest sensitivity and fastest response and recovery times. The temperature of the maximum sensor signal at RH = 1% was 300 °C. With an increase in relative air humidity of up to 20%, the maximum sensor response shifts to the region of higher temperatures (400 °C). This can indicate the involvement of SnO2 lattice oxygen in the benzene oxidation by Mars-van Krevelen mechanism [61]. The difference in energy between the lattice and surface O2– is about 20 eV, while the corresponding value for O2(gas) and O2-(ads.) is 1.5 eV [62]. According to XPS, the modification of SnO2/SiO2 with Au leads to a decrease in the Sn-O binding energy (Table 4). The weakening of this Sn-O bond, combined with an increase in the measurement temperature, makes it possible for lattice oxygen (in addition to oxygen chemisorbates) to participate in the process of benzene oxidation, leading to a change in the resistance of the sensitive material. This mechanism was proposed by Jiang et al. [63]. The sensor properties of SnO2-300, SnO2-Au, SnO2/SiO2 and SnO2/SiO2-Au towards 2 ppm C6H6 at 300 °C are summarized in Table 6.
Table 6.
Sensor properties of SnO2-300, SnO2-Au, SnO2/SiO2 and SnO2/SiO2-Au towards 100 ppm C6H6 at 300 °C.
| Sample | Sensor Response | t, resp., s | t rec., s | |||
|---|---|---|---|---|---|---|
| RH = 1% | RH = 20% | RH = 1% | RH = 20% | RH = 1% | RH = 20% | |
| SnO2-300 | 1.4 ± 0.3 | 1 | - | - | - | - |
| SnO2-Au | 4.4 ± 0.1 | 2.6 ± 0.3 | 97 ± 4 | 84 ± 8 | 161 ± 3 | 137 ± 8 |
| SnO2/SiO2 | 1.2 ± 0.1 | 2.1 ± 0.3 | 73 ± 7 | 105 ± 6 | 142 ± 5 | 129 ± 4 |
| SnO2/SiO2-Au | 8.2 ± 0.8 | 6.8 ± 0.5 | 62 ± 5 | 75 ± 4 | 125 ± 3 | 128 ± 5 |
Thus, the synergistic effect of two modifiers (Au and SiO2) in the formation of sensor properties of SnO2/SiO2-Au is that the amorphous SiO2 provides the formation of centers on the surface of SnO2 that stabilize the cationic forms of gold Au+ and Au3+. These forms on the one hand exhibit higher catalytic activity in the oxidation of organic compounds, and, on the other hand, reduce the energy of the Sn-O bond that, at a high temperature, provides the involvement of SnO2 lattice oxygen in the benzene oxidation by Mars-van Krevelen mechanism.
4. Conclusions
Studies of the sensor properties of SnO2 - 300, SnO2-Au, SnO2/SiO2, SnO2/SiO2-Au nanocrystalline materials when detecting ethanol and benzene in dry air and at RH = 20% have shown that, in all cases, the most sensitive is the SnO2/SiO2–Au nanocomposite. This material retains high sensitivity even in a humid atmosphere. The modification of SnO2 by amorphous SiO2 (13 mol.%) and Au nanoparticles (1 wt.%) allowed us to obtain a number of key properties that determine the high sensor sensitivity of SnO2/SiO2-Au:
-
—
The concentration of active oxygen-containing groups on the surface of SnO2/SiO2-Au, directly involved in the oxidation of ethanol and benzene, is the highest among all the samples, which is confirmed by XPS and TPR-H2;
-
—
The addition of silicon dioxide provides long-term stability of the sensor at high temperatures, which is especially necessary for the detection of benzene;
-
—
The addition of SiO2 increases the concentration of Sn3+ defects in tin dioxide, which, in turn, provide the formation of cationic forms Au+ and Au3+, and silanol groups are additionally involved in their stabilization. These forms are characterized by a higher catalytic activity than Au0;
-
—
Similar effective ionic radii provide the possibility of Au3+ substitution in Sn4c positions that leads to a change in the electron density distribution on the Sn-O bond. This effect also leads to the involvement of the SnO2 lattice oxygen in the SnO2/SiO2-Au nanocomposite in the benzene oxidation by the Mars-van Krevelen mechanism.
Acknowledgments
The spectral research was carried out using the equipment purchased by funds of Lomonosov Moscow State University Program of the Development.
Supplementary Materials
The following are available online at https://www.mdpi.com/2079-4991/10/4/813/s1, Figure S1: XRD patterns of nanocrystalline SnO2-300, SnO2-Au, SnO2/SiO2 and SnO2/SiO2-Au.
Author Contributions
Conceptualization, M.R. and A.G.; Methodology, D.G., M.R. and A.G.; Formal Analysis, D.G. and M.R.; Investigation, D.G., E.G., N.K. and E.T.; Data Curation, D.G. and M.R.; Writing–Original Draft Preparation, D.G. and M.R.; Writing–Review and Editing, M.R. and A.G.; Supervision, M.R. All authors have read and agreed to the published version of the manuscript.
Funding
This research was funded by Russian Science Foundation, grant number 19-13-00245.
Conflicts of Interest
The authors declare no conflict of interest.
References
- 1.Neri G. First Fifry Years of Chemoresistive Gas Sensors. Chemosensors. 2015;3:1–20. doi: 10.3390/chemosensors3010001. [DOI] [Google Scholar]
- 2.Park C.O., Akbar S.A. Ceramics for chemical sensing. J. Mater. Sci. 2003;38:4611–4637. doi: 10.1023/A:1027402430153. [DOI] [Google Scholar]
- 3.Matsuura Y., Takahata K. Stabilization of SnO2 sintered gas sensors. Sens. Actuat. B. 1991;5:205–209. doi: 10.1016/0925-4005(91)80248-I. [DOI] [Google Scholar]
- 4.Gulevich D., Rumyantseva M., Gerasimov E., Marikutsa A., Krivetskiy V., Shatalova T., Khmelevsky N., Gaskov A. Nanocomposites SnO2/SiO2 for CO gas sensors: Microstructure and reactivity in the interaction with the gas phase. Materials. 2019;12:1096. doi: 10.3390/ma12071096. [DOI] [PMC free article] [PubMed] [Google Scholar]
- 5.Gulevich D., Rumyantseva M., Marikutsa A., Shatalova T., Gerasimov E., Gaskov A. Nanocomposites SnO2/SiO2: SiO2 Impact on the Active Centers and Conductivity Mechanism. Materials. 2019;12:3618. doi: 10.3390/ma12213618. [DOI] [PMC free article] [PubMed] [Google Scholar]
- 6.Mirzaei A., Leonardi S.G., Neri G. Detection of hazardous volatile organic compounds (VOCs) by metal oxide nanostructures-based gas sensors: A review. Ceram. Int. 2016;42:15119–15141. doi: 10.1016/j.ceramint.2016.06.145. [DOI] [Google Scholar]
- 7.Bunpang K., Wisitsoraat A., Tuantranont A., Singkammo S., Phanichphant S., Liewhiran C. Highly selective and sensitive CH4 gas sensors based on flame-spray-made Cr-doped SnO2 particulate films. Sens. Actuat. B Chem. 2019;291:177–191. doi: 10.1016/j.snb.2019.04.049. [DOI] [Google Scholar]
- 8.Mirzaei A., Kim J.-H., Kim H.W., Kim S.S. Resistive-based gas sensors for detection of benzene, toluene and xylene (BTX) gases: A review. J. Mater. Chem. C. 2018;6:4342–4370. doi: 10.1039/C8TC00245B. [DOI] [Google Scholar]
- 9.Becker G., Domshke G., Fangchenel E., Fisher M., Gewald K., Mayer R., Pafel D., Schmidt G., Shvetlik K., Berger V., et al. Organikum. Practical Work on Organic Chemistry. T2. Translation from German. Mir; Moscow, Russia: 1992. p. 474. [Google Scholar]
- 10.Patnaik P. A Comprehensive Guide to the Hazardous Properties of Chemical Substances. 3rd ed. John Wiley & Sons; Hoboken, NJ, USA: 2007. p. 1059. [Google Scholar]
- 11.Malik R., Tomer V.K., Mishra Y.K., Lin L. Functional gas sensing materials. Appl. Phys. Rev. 2020;7:021301. doi: 10.1063/1.5123479. [DOI] [Google Scholar]
- 12.Joshi N., Hayasaka T., Liu Y., Liu H., Oliveira O.N., Jr., Lin L. A review on chemiresistive room temperature gas sensors based on metal oxide nanostructures, praphene and 2D transition metal dichalcogenides. Microchim. Acta. 2018;185:213. doi: 10.1007/s00604-018-2750-5. [DOI] [PubMed] [Google Scholar]
- 13.Tomer V.K., Duhan S. Ordered mesoporous Ag-doped TiO2/SnO2 nanocomposite based highly sensitive and selective VOC sensors. J. Mater. Chem. A. 2016;4:1033–1043. doi: 10.1039/C5TA08336B. [DOI] [Google Scholar]
- 14.Haruta M. Gold as a Novel Catalyst in the 21st Century: Preparation, Working Mechanism and Applications. Gold Bull. 2004;37:27–36. doi: 10.1007/BF03215514. [DOI] [Google Scholar]
- 15.Scirè S., Minicò S., Crisafulli C., Satriano C., Pistone A. Catalytic combustion of volatile organic compounds on gold/cerium oxide catalysts. Appl. Catal. B Environ. 2003;40:43–49. doi: 10.1016/S0926-3373(02)00127-3. [DOI] [Google Scholar]
- 16.Haruta M. When Gold Is Not Noble: Catalysis by Nanoparticles. Chem. Rec. 2003;3:75–87. doi: 10.1002/tcr.10053. [DOI] [PubMed] [Google Scholar]
- 17.Takei T., Iguchi N., Haruta M. Support effect in the gas phase oxidation of ethanol over nanoparticlate gold catalysts. New J. Chem. 2011;35:2227–2233. doi: 10.1039/c1nj20297a. [DOI] [Google Scholar]
- 18.Ishida T., Koga H., Okumura M., Haruta M. Advances in Gold Catalysis and Understanding the Catalytic Mechanism. Chem. Rec. 2016;16:2278–2293. doi: 10.1002/tcr.201600046. [DOI] [PubMed] [Google Scholar]
- 19.Korotcenkov G., Cho B.K., Gulina L., Tolstoy V. SnO2 thin films modified by the SnO2–Au nanocomposites: Response to reducing gases. Sens. Actuat. B. 2009;141:610–616. doi: 10.1016/j.snb.2009.06.001. [DOI] [Google Scholar]
- 20.Hutchings G.J. New Directions in Gold Catalysis. Gold Bull. 2004;37:3–11. doi: 10.1007/BF03215511. [DOI] [Google Scholar]
- 21.Takei T., Akita T., Nakamura I., Fujitani T., Okumura M., Okazaki K., Huang J., Ishida T., Haruta M. Heterogeneous Catalysis by Gold. In: Gates B.C., Jentoft F.C., editors. Advances in Catalysis. 1st ed. Volume 55. Academic Press; Cambridge, MA, USA: 2012. pp. 1–126. [DOI] [Google Scholar]
- 22.Fujita T., Horikawa M., Takei T., Murayama T., Haruta M. Correlation between catalytic activity of supported gold catalysts for carbon monoxide oxidation and metal–oxygen binding energy of the support metal oxides. Chin. J. Catal. 2016;37:1651–1655. doi: 10.1016/S1872-2067(16)62521-4. [DOI] [Google Scholar]
- 23.Date M., Okumura M., Tsubota S., Haruta M. Vital Role of Moisture in the Catalytic Activity of Supported Gold Nanoparticles. Angew. Chem. 2004;43:2129–2132. doi: 10.1002/anie.200453796. [DOI] [PubMed] [Google Scholar]
- 24.Katoch A., Byun J.-H., Choi S.-W., Kim S.S. One-pot synthesis of Au-loaded SnO2 nanofibers and their gas sensing properties. Sens. Actuat. B. 2014;202:38–45. doi: 10.1016/j.snb.2014.05.050. [DOI] [Google Scholar]
- 25.Wang S., Zhao Y., Huang J., Wang Y., Kong F., Wu S., Zhang S., Huang W. Preparation and CO gas-sensing behavior of Au-doped SnO2 sensors. Vacuum. 2006;81:394–397. doi: 10.1016/j.vacuum.2006.05.004. [DOI] [Google Scholar]
- 26.Zanella R. Characterization and reactivity in CO oxidation of gold nanoparticles supported on TiO2 prepared by deposition-precipitation with NaOH and urea. J. Catal. 2004;222:357–367. doi: 10.1016/j.jcat.2003.11.005. [DOI] [Google Scholar]
- 27.Haruta M., Yamada N., Kobayashi T., Iijima S. Gold Catalysts Prepared by Coprecipitation for Low-Temperature Oxidation of Hydrogen and of Carbon Monoxide. J. Catal. 1989;115:301–309. doi: 10.1016/0021-9517(89)90034-1. [DOI] [Google Scholar]
- 28.Grisel R., Weststrate K.-J., Gluhoi A., Nieuwenhuys B.E. Catalysis by Gold Nanoparticles. Gold Bull. 2002;35:39–45. doi: 10.1007/BF03214836. [DOI] [Google Scholar]
- 29.Haruta M., Daté M. Advances in the catalysis of Au nanoparticles. Appl. Catal. A Gen. 2001;222:427–437. doi: 10.1016/S0926-860X(01)00847-X. [DOI] [Google Scholar]
- 30.Jeon J., Shim Y., Han S.D., Kim D.H., Kim Y.H., Kang C., Kim J., Kim M., Jang H.W. Vertically ordered SnO2 nanobamboos for substantially improved detection of volatile reducing gases. J. Mater. Chem. A. 2015;3:17939–179452. doi: 10.1039/C5TA03293H. [DOI] [Google Scholar]
- 31.Liu C., Kuang Q., Xie Z., Zheng L. The effect of noble metal (Au, Pd and Pt) nanoparticles on the gas sensing performance of SnO2-based sensors: A case study on the {221} high-index faceted SnO2 octahedra. Cryst. Eng. Comm. 2015;17:6308–6313. doi: 10.1039/C5CE01162K. [DOI] [Google Scholar]
- 32.Cui Y., Zhang M., Li X., Wang B., Wang R. Investigation on synthesis and excellent gas-sensing properties of hierarchical Au-loaded SnO2 nanoflowers. J. Mater. Res. 2019;34:2944–2954. doi: 10.1557/jmr.2019.249. [DOI] [Google Scholar]
- 33.Guo J., Zhang J., Gong H., Ju D., Cao B. Au nanoparticle-functionalized 3D SnO2 microstructures for high performance gas sensor. Sens. Actuator. B Chem. 2016;226:266–272. doi: 10.1016/j.snb.2015.11.140. [DOI] [Google Scholar]
- 34.Kim J.-H., Wu P., Kim H.W., Kim S.S. Highly Selective Sensing of CO, C6H6, and C7H8 Gases by Catalytic Functionalization with Metal Nanoparticles. ACS Appl. Mater. Interfaces. 2016;8:7173–7183. doi: 10.1021/acsami.6b01116. [DOI] [PubMed] [Google Scholar]
- 35.Kim J.-H., Zheng Y., Mirzaei A., Kim S.S. Excellent Carbon Monoxide Sensing Performance of Au-Decorated SnO2 Nanofibers. Korean J. Mater. Res. 2016;26 doi: 10.3740/MRSK.2016.26.12.741. [DOI] [Google Scholar]
- 36.Moon Y.K., Jeong S.-Y., Kang Y.C., Lee J.-H. Metal Oxide Gas Sensors with Au Nanocluster Catalytic Overlayer: Toward Tuning Gas Selectivity and Response Using a Novel Bilayer Sensor Design. ACS Appl. Mater. Interfaces. 2019;11:32169–32177. doi: 10.1021/acsami.9b11079. [DOI] [PubMed] [Google Scholar]
- 37.Kim J.-H., Katoch A., Kim H.W., Kim S.S. Realization of ppm-level CO detection with exceptionally high sensitivity using reduced graphene oxide-loaded SnO2 nanofibers with simultaneous Au functionalization. Chem. Comm. 2016;52:3832–3835. doi: 10.1039/C5CC10482C. [DOI] [PubMed] [Google Scholar]
- 38.Grunwaldt J.-D., Kiener C., Wogerbauer C., Baiker A. Preparation of Supported Gold Catalysts for Low-Temperature CO Oxidation via “Size-Controlled” Gold Colloids. J. Catal. 1999;181:223–232. doi: 10.1006/jcat.1998.2298. [DOI] [Google Scholar]
- 39.Michaelson H.B. The work function of the elements and its periodicity. J. Appl. Phys. 1977;48:4729–4733. doi: 10.1063/1.323539. [DOI] [Google Scholar]
- 40.Orlandi M.O. Tin Oxide Materials. Synthesis, Properties and Applications. In: Korotcenkov G., editor. Metal Oxides Series. 1st ed. Elsevier; Amsterdam, The Netherlands: 2020. p. 666. [Google Scholar]
- 41.Overbury S., Schwartz V., Mullins D., Yan W., Dai S. Evaluation of the Au size effect: CO oxidation catalyzed by Au/TiO2. J. Catal. 2006;241:56–65. doi: 10.1016/j.jcat.2006.04.018. [DOI] [Google Scholar]
- 42.Green I.X., Tang W., Neurock M., Yates J.T. Spectroscopic Observation of Dual Catalytic Sites during Oxidation of CO on a Au/TiO2 Catalyst. Science. 2011;333:736–739. doi: 10.1126/science.1207272. [DOI] [PubMed] [Google Scholar]
- 43.Fujitani T., Nakamura I., Haruta M. Role of Water in CO Oxidation on Gold Catalysts. Catal. Lett. 2014;144:1475–1486. doi: 10.1007/s10562-014-1325-2. [DOI] [Google Scholar]
- 44.Thermo Scientific XPS Simplified. [(accessed on 1 March 2019)]; Available online: https://xpssimplified.com/elements.
- 45.Cabot A., Arbiol J., Morante J.R., Weimar U., Barsan N., Gopel W. Analysis of the noble metal catalytic additives introduced by impregnation of as obtained SnO2 sol–gel nanocrystals for gas sensors. Sens. Actuator. B. 2000;70:87–100. doi: 10.1016/S0925-4005(00)00565-7. [DOI] [Google Scholar]
- 46.Yinga F., Wang S., Au C.-T., Lai S.-Y. Effect of the oxidation state of gold on the complete oxidation of isobutane on Au/CeO2 catalysts. Gold Bull. 2010;43:241–251. doi: 10.1007/BF03214994. [DOI] [Google Scholar]
- 47.XPS Data. [(accessed on 15 January 2020)]; Available online: https://www.xpsdata.com/
- 48.Cybulski A., Moulinjn J.A., Stankewicz A. Novel concepts in Catalysis and Chemical Reactors: Improving the Efficiency for the Future. Wiley-VCH; Weinheim, Germany: 2010. 398p [Google Scholar]
- 49.Oh H.-S., Yang J.H., Costello C.K., Wang Y.M., Bare S.R., Kung H.H., Kung M.C. Selective Catalytic Oxidation of CO: Effect of Chloride on Supported Au Catalysts. J. Catal. 2002;210:375–386. doi: 10.1006/jcat.2002.3710. [DOI] [Google Scholar]
- 50.Guzman J., Gates B.C. Simultaneous Presence of Cationic and Reduced Gold in Functioning MgO-Supported CO Oxidation Catalysts: Evidence from X-ray Absorption Spectroscopy. J. Phys. Chem. B. 2002;106:7659–7665. doi: 10.1021/jp020584m. [DOI] [Google Scholar]
- 51.Wang D., Hao Z., Cheng D., Shi X. Influence of the calcination temperature on the Au/FeOx/Al2O3 catalyst. J. Chem. Technol. Biotechnol. 2006;81:1246–1251. doi: 10.1002/jctb.1533. [DOI] [Google Scholar]
- 52.Gazsi A., Koós A., Bánsági T., Solymosi F. Adsorption and decomposition of ethanol on supported Au catalysts. Catal. Today. 2011;160:70–78. doi: 10.1016/j.cattod.2010.05.007. [DOI] [Google Scholar]
- 53.Sheng P.-Y., Bowmaker G.A., Idriss H. The Reactions of Ethanol over Au/CeO2. Appl. Catal. A Gen. 2004;261:171–181. doi: 10.1016/j.apcata.2003.10.046. [DOI] [Google Scholar]
- 54.Shankar P., Bosco J., Rayappan B. Gas sensing mechanism of metal oxides: The role of ambient atmosphere, type of semiconductor and gases—A review. Sci. Lett. J. 2015;4:126. [Google Scholar]
- 55.Elavarasana M., Umab K., Yang T.C.K. Photocatalytic oxidation of ethanol using ultrasonic modified TiO2; an in situ diffuse reflectance infrared spectroscopy study. Results Phys. 2019:13. doi: 10.1016/j.rinp.2019.102237. [DOI] [Google Scholar]
- 56.Goto T., Itoh T., Akamatsu T., Shin W. CO Sensing Performance of a Micro Thermoelectric Gas Sensor with AuPtPd/SnO2 Catalyst and Effects of a Double Catalyst Structure with Pt/α-Al2O3. Sensors. 2015;15:31687–31698. doi: 10.3390/s151229873. [DOI] [PMC free article] [PubMed] [Google Scholar]
- 57.Su H.-Y., Yang M.-M., Bao X.-H., Li W.-X. The Effect of Water on the CO Oxidation on Ag(111) and Au(111) Surfaces: A First-Principle Study. J. Phys. Chem. C. 2008;112:17303–17310. doi: 10.1021/jp803400p. [DOI] [Google Scholar]
- 58.Bongiorno A., Landman U. Water-Enhanced Catalysis of CO Oxidation on Free and Supported Gold Nanoclusters. Phys. Rev. Lett. 2005;95 doi: 10.1103/PhysRevLett.95.106102. [DOI] [PubMed] [Google Scholar]
- 59.Dat´e M., Haruta M. Moisture Effect on CO Oxidation over Au/TiO2 Catalyst. J. Catal. 2001;201:221–224. doi: 10.1006/jcat.2001.3254. [DOI] [Google Scholar]
- 60.Grossmann K., Pavelko R.G., Barsan N., Weimar U. Interplay of H2, water vapor and oxygenat the surface of SnO2 based gas sensors—An operando investigation utilizing deuterated gases. Sens. Actuator. B. 2012;166–167:787–793. doi: 10.1016/j.snb.2012.03.075. [DOI] [Google Scholar]
- 61.Vladimirova S., Krivetskiy V., Rumyantseva M., Gaskov A., Mordvinova N., Lebedev O., Martyshov M., Forsh P. Co3O4 as p-type material for CO sensing in humid air. Sensors. 2017;17:2216. doi: 10.3390/s17102216. [DOI] [PMC free article] [PubMed] [Google Scholar]
- 62.Kohl D. Surface Processes In the Detection of Reducing Gases with SnO2-Based Devices. Sens. Actuator. 1989;18:71–113. doi: 10.1016/0250-6874(89)87026-X. [DOI] [Google Scholar]
- 63.Jiang W., Pang Y., Gu L., Yao Y., Su Q., Ji W., Au C.-T. Structurally defined SnO2 substrates, nanostructured Au/SnO2 interfaces, and their distinctive behavior in benzene and methanol oxidation. J. Catal. 2017;349:183–196. doi: 10.1016/j.jcat.2016.12.023. [DOI] [Google Scholar]
Associated Data
This section collects any data citations, data availability statements, or supplementary materials included in this article.


