Abstract
Colchicine is a well-known compound with strong antiproliferative activity that has had limited use in chemotherapy because of its toxicity. In order to create more potent anticancer agents, a series of novel colchicine derivatives have been obtained by simultaneous modification at C7 (amides and sulfonamides) and at C10 (methylamino group) positions and characterized by spectroscopic methods. All the synthesized compounds have been tested in vitro to evaluate their cytotoxicity toward A549, MCF-7, LoVo, LoVo/DX and BALB/3T3 cell lines. Additionally, the activity of the studied compounds was investigated using computational methods involving molecular docking of the colchicine derivatives to β-tubulin. The majority of the obtained derivatives exhibited higher cytotoxicity than colchicine, doxorubicin or cisplatin against tested cancer cell lines. Furthermore, molecular modeling studies of the obtained compounds revealed their possible binding modes into the colchicine binding site of tubulin.
Keywords: anticancer agents, colchicine amide, colchicine sulfonamide, tubulin inhibitors, docking studies, crystal structure
1. Introduction
Microtubules, which are composed of α- and β-tubulin heterodimers, are involved in a large number of processes, such as intracellular transport, cell shape development, cell division and cell motility. During cell division microtubules form the mitotic spindle that in normal cells correctly separates the chromosomes into two daughter cells. In cancer cells the rate of mitosis is typically increased but chromosome segregation is imperfect leading to aneuploidy. Microtubules formed during mitosis are considered as an ideal target for anticancer drugs since no cell can divide without the force generated by microtubules. Therefore, many inhibitors of microtubule dynamics have been investigated for their potential use as cancer chemotherapy drugs [1,2,3,4,5,6,7]. One of these compounds is colchicine 1 (see Scheme 1), a well–known tropolone alkaloid isolated from Colchicum autumnale, which has been shown to exhibit very high cytotoxic effects. It binds to tubulin at the colchicine binding site and induces conformational change in the tubulin dimer making it incompetent for microtubule assembly. As a result, the cell cycle is blocked and apoptosis is induced [8,9,10,11,12,13,14]. Unfortunately, colchicine is too toxic to be useful as an antitumor agent [8,15,16,17,18,19,20,21]. Nevertheless, it has found use in therapy, e.g., for the treatment of familial Mediterranean fever, Behcet’s disease or acute gout [22,23,24,25,26,27].
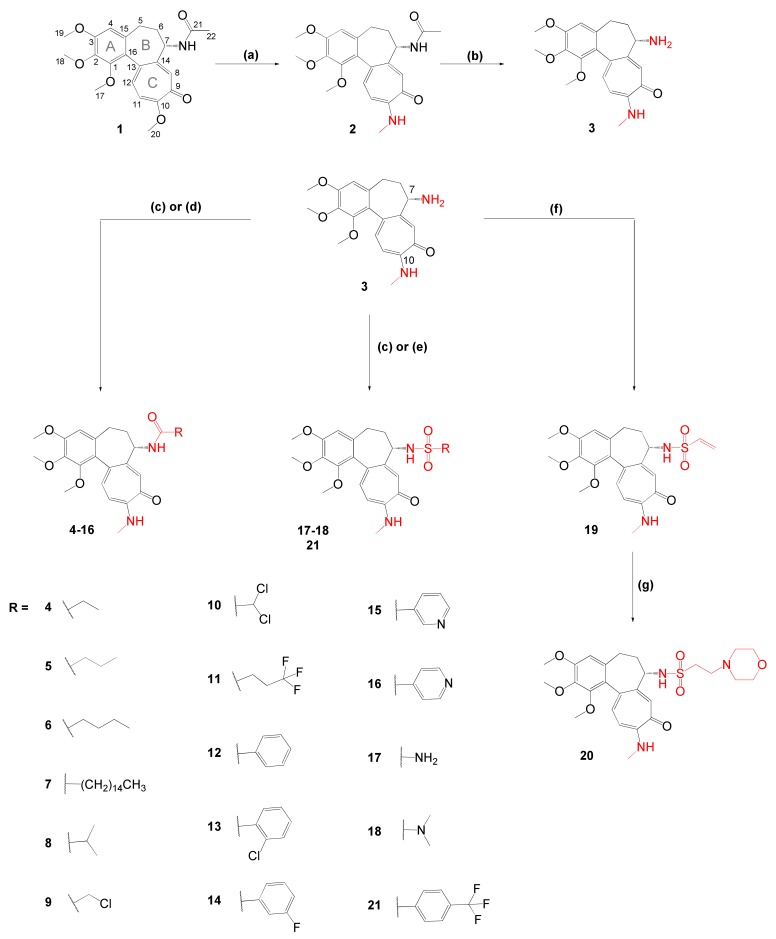
Scheme 1.
Synthesis of doubly modified colchicine derivatives (2–21), changes at C7 and C10 positions are highlighted in red. Reagents and conditions: (a) NHCH3/EtOH, reflux; (b) 2M HCl, reflux; (c) RC(O)Cl or RSO2Cl, Et3N, DCM, 0 °C to RT for 4, 8, 13, 15–16, 18 and 21; (d) RCOOH, EDCI, DCM, RT for 5–7, 9–12 and 14; (e) (1) N-(tert-butoxycarbonyl)-N-[4-(dimethylazaniumylidene)-1,4-dihydropyridin-1-ylsulfonyl]azanide, DCM, RT, (2) 4M HCl/EtOAc, RT for 17; (f) ClCH2CH2SO2Cl, Et3N, DCM, 0 °C to RT; (g) morpholine, DCM, RT.
Therefore, over the past few decades much interest has been focused on structural modifications of 1 in the hope of improving its therapeutic index [28,29,30,31]. Numerous double-modified colchicine derivatives have been synthesized with the group at position C7 substituted by various amide and sulfonamide moieties as well as with replacement of the methoxy group at position C10 by a group containing either a nitrogen or a sulfur atom and their biological activities have been determined [28,29,32,33,34,35,36]. These results have shown that new derivatives may have lower toxicity with respect to normal cells while maintaining high antitumor activity. In addition, from the chemical point of view, such a change at position C10 allows obtaining compounds more resistant to acid hydrolysis [29,30,33]. We have decided to check various amide and sulfonamide moieties because they have long been valued for their rich biological and chemical profiles and have emerged as a promising class of compounds in drug discovery [37,38,39,40,41].
Herein, we report the synthesis, crystallographic and spectroscopic analysis of a series of structurally different derivatives of colchicine obtained by its modification at position C7 (various amide, sulfonamide or sulfamide moieties) and at position C10 (methylamino group). We also describe the results of in vitro antiproliferative activity evaluation of colchicine (1) and the obtained colchicine derivatives (2–21) against four human cancer cell lines and one normal murine embryonic fibroblast cell line. To acquire more knowledge about the molecular mechanism of action of the investigated compounds (1–21), we also present results of in silico molecular docking study of the colchicine binding site (CBS) of β-tubulin.
2. Results and Discussion
2.1. Chemistry
To investigate the effect of methylamino group at position C10 and, at the same time, various amide, sulfonamide and sulfamide moieties at position C7 of colchicine 1 on its antiproliferative activity, eighteen new derivatives (4–21) were synthesized. To facilitate the structure-activity relationship analysis (SAR) we designed compounds with different side chains at position C7: alkyl chains of various length, straight and branched (4–8), unsaturated alkyl chain (19), alkyl chains of various lengths containing halogen atoms (9–11), an aromatic group without or with substituents (12–16, 21), and compounds containing an amino group 17–18 and 20.
The general route for the synthesis of colchicine derivatives 2–21 is depicted in Scheme 1. Colchicine (1) was treated with methylamine solution in ethanol to give 10-methylamino-10-demethoxycolchicine (2) with 80% yield, according to the method described earlier [42]. The replacement of water solution of methylamine by ethanol solution eliminated the work up after the reaction and permitted obtaining comparable final yields. Next, hydrolysis of 2 with 2M HCl yielded N-deacetyl-10-methylamino-10-demethoxycolchicine (3). Compounds 4–16, 18–19 and 21 were readily available from 3 by treatment with respective acid/ sulfonamide/ sulfamide chloride in the presence of triethylamine or with the corresponding carboxylic acid and carbodiimide as a condensing agent. Compound 17 was prepared using a N-(tert-butoxycarbonyl)-N-[4-(dimethylazaniumylidene)-1,4-dihydropyridin-1-ylsulfonyl]azanide and further modified by removal of the tert-butoxycarbonyl group from amine with HCl [43]. Vinylsulfonamide 19 was synthesized from 2-chloroethanesulfonyl chloride and 3 through sulfonylation and in situ β-elimination of HCl. Compound 19 was used as the Michael acceptor with an electron-deficient double bond for the reaction with morpholine to produce compound 20 [44,45]. All synthesized compounds were isolated in pure form after column chromatography.
The purity and structures of the obtained compounds 2–21 were determined using the LC-MS, 1H and 13C NMR methods and are shown in the Supplementary Materials and discussed below. The characteristic signals of -OCH3 group at position C10 of 1 in the 1H NMR and 13C NMR spectra were observed as a singlet at 4.0 ppm and at 56.5 ppm, respectively. These signals vanish after the reaction of colchicine with methylamine proving the substitution of the -OCH3 group in the tropolone ring of 1. After the introduction of -NHCH3 at position C10 the signals of this group in the obtained derivatives (2–21) were visible approx. at 3.1 ppm as a doublet and approx. at 7.4 ppm as a quartet in 1H NMR and approx. at 29.5 ppm in 13C NMR. The chemical shifts of the amide moiety can be found in the range 7.9–9.7 ppm in 1H NMR and in the range 164.2–175.2 ppm in 13C NMR, depending on the substituent used. The ESI mass spectrometry confirmed the structure of the obtained compounds by the presence of an m/z signals assigned to the corresponding pseudomolecular ions of these compounds.
2.2. X-ray Crystal Analysis
Structural characterization of the colchicine derivatives is very important in order to understand their anticancer properties stemming from their interaction with tubulin as well as to enable structure–activity relationship analysis (SAR) and related investigation. Therefore, structural analyses of all crystals that were suitable for X-ray analysis of single crystals were performed. Crystals of 6, 11, 12, 14, 18 and 19 suitable for the X-ray single crystal analysis were obtained by recrystallization of the respective colchicine derivatives from acetonitrile, whereas crystals 15 and 16 from ethyl acetate solutions. All crystals were measured at room (295 K) and low (100 K) temperature. Details of the data collection parameters, crystallographic data and the final agreement parameters are listed in Supplementary Table S1. In the temperature range from 295 K to 100 K, no structural phase transitions were observed in the crystals studied, although for colchicine derivative 11 at low temperature some disorder of the -CF3 group in the -CH2-CH2-CF3 group at atom C21 could be observed. Colchicine derivatives 6, 11, 12, 14, 15, and 16 crystallize in the P3221 space group of the trigonal system while derivative 18 crystallizes in the P212121 space group of the orthorhombic system and derivative 19 crystallizes in the P21 space group of the monoclinic system. These space groups are chiral since the compounds contain an asymmetric carbon (C7) atom. The absolute configuration at the C7 atom is S in all structures. The molecular structures of all colchicine derivatives (6, 11, 12, 14, 15, 16, 18 and 19) are illustrated in Supplementary Figure S60. The planar phenyl A and tropolone C rings in all colchicine derivatives (6, 11, 12, 14, 15, 16, 18 and 19) are twisted around the C13–C16 bond with the torsion angle describing the twisting conformation C1–C16–C13–C12 between ~53° and ~56° at 100 K and they do not differ significantly from the values at room temperature (Table 1). Ring B in all colchicine derivatives exhibits a similar puckering pattern and the extent of its non-planarity is such that it adopts a conformation, which is close to the twist-boat with a flattening caused by the fusion of rings A and C (see Supplementary Figure S60). So the conformation of the fused A, B and C rings of colchicine skeleton in the investigated derivatives is quite similar to that in colchicine itself [46].
Table 1.
Selected torsion angles (°) of colchicine derivatives 6, 11, 12, 14, 15, 16, 18 and 19 obtained by X-ray analysis and DFT computation for a comparison.
| 6 | 11 | 12 | 14 | 15 | 16 | 18 | 19 | ||
|---|---|---|---|---|---|---|---|---|---|
| C1–C16–C13–C12 | 100 K 295 K DFT value |
53.1(4) 55.2(4) 53.1 |
55.5(6) 55.5(6) 52.3 |
53.7(3) 55.0(3) 53.4 |
54.0(5) 54.4(4) 53.5 |
53.6(4) 54.7(4) 52.9 |
54.1(3) 55.0(3) 53.3 |
56.1(4) 56.1(4) 54.5 |
55.3(3) 55.9(4) 56.0 |
| C17–O1–C1–C2 | 100 K 295 K DFT value |
−79.0(4) −86.5(4) −73.0 |
−86.4(6) −86.4(6) −70.7 |
−89.3(3) −86.4(4) −80.3 |
−90.6(5) −87.4(5) −80.0 |
−87.3(4) −87.8(4) −72.9 |
−86.8(4) −86.4(4) −79.4 |
−108.6(3) −106.8(3) −74.8 |
66.2(3) 65.6(4) 59.2 |
| C18–O2–C2–C3 | 100 K 295 K DFT value |
108.0(3) 106.9(4) 70.1 |
105.2(6) 105.2(6) 68.8 |
96.1(2) 98.7(3) 82.1 |
95.5(4) 98.0(4) 82.3 |
99.7(4) 101.4(4) 71.1 |
94.5(3) 98.7(3) 81.1 |
−77.5(4) −74.0(4) −59.6 |
−102.7(3) −100.6(4) −77.2 |
| C19–O3–C3–C4 | 100 K 295 K DFT value |
−14.1(5) −8.1(7) −4.0 |
−10.5(9) −10.5(10) −3.7 |
8.6(4) 6.9(6) −2.0 |
14.4(6) 11.4(7) −1.9 |
−6.0(6) −2.3(6)−3.8 |
7.4(6) 6.9(6) −1.9 |
1.2(5) 0.2(5) 0.7 |
7.7(4) 6.8(5) 3.1 |
| C20–N1–C10–C11 | 100 K 295 K DFT value |
7.7(5) 6.8(6) −0.9 |
8.8(8) 8.7(9) −0.9 |
4.6(3) 7.5(4) −1.4 |
4.4(6) 5.0(6) −1.0 |
5.0(5) 5.2(5) −1.2 |
6.6(4) 7.5(4) −1.3 |
−0.2(5) −1.7(5) 0.2 |
4.7(4) 4.0(7) −1.6 |
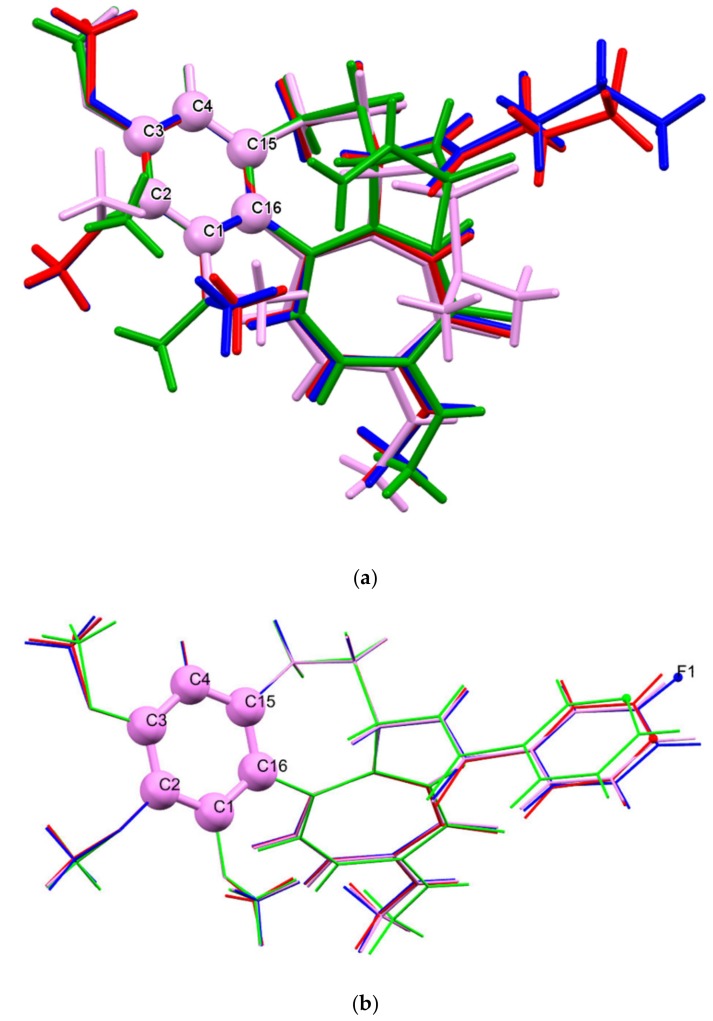
The methoxy group -OCH3 linked to the phenyl ring at C3 is almost coplanar with the ring in all structures of colchicine derivatives, whereas the other two methoxy groups linked at C1 and C2 atoms of the phenyl ring have different orientations in some colchicine derivatives (Table 1). The N-methylamino group (-NHCH3) linked to tropolone C ring at C10 atom is almost coplanar with the ring. The differences between the conformations of the investigated colchicine derivatives are illustrated in Figure 1 and Table 1. For clarity, the colchicine derivatives have been divided into two groups, according to the substituent in ring B at position C7; one group comprises the derivatives with a chain substituent (Figure 1a) and the other group comprises the derivatives with a substituent containing an aromatic ring (Figure 1b). Analysis of these results reveals a significant difference in the torsion angle C17-O1-C1-C2 in compounds 18 (~−109°) and 19 (~66°) or the difference between the calculated (~−103°) and measured (~−77°) torsion angle C18-O2 -C2-C3 in compound 19. These differences result from different approach to the description of the molecule conformations, the X-ray analysis values refer to the conformation of molecules in crystals, in which the intermolecular interactions play a significant role and leads crystallization and specific crystal packing, while the DFT values refer to a single isolated molecule in the gas state with the intermolecular interactions not taken into account.
Figure 1.
Comparison of the X-ray structure of (a) derivatives with a chain substituent at position C7: 6 (blue), 11 (red), 18 (pink) and 19 (green) and (b) derivatives with a substituent containing an aromatic ring at position C7: 12 (pink), 14 (blue), 15 (green) and 16 (red) showing the conformation of the colchicine skeleton. The molecules are overlapped one over another so that the ring C1-C2-C3-C4-C15-C16 is at the same position.
2.3. Molecular Electrostatic Potential Map Analysis
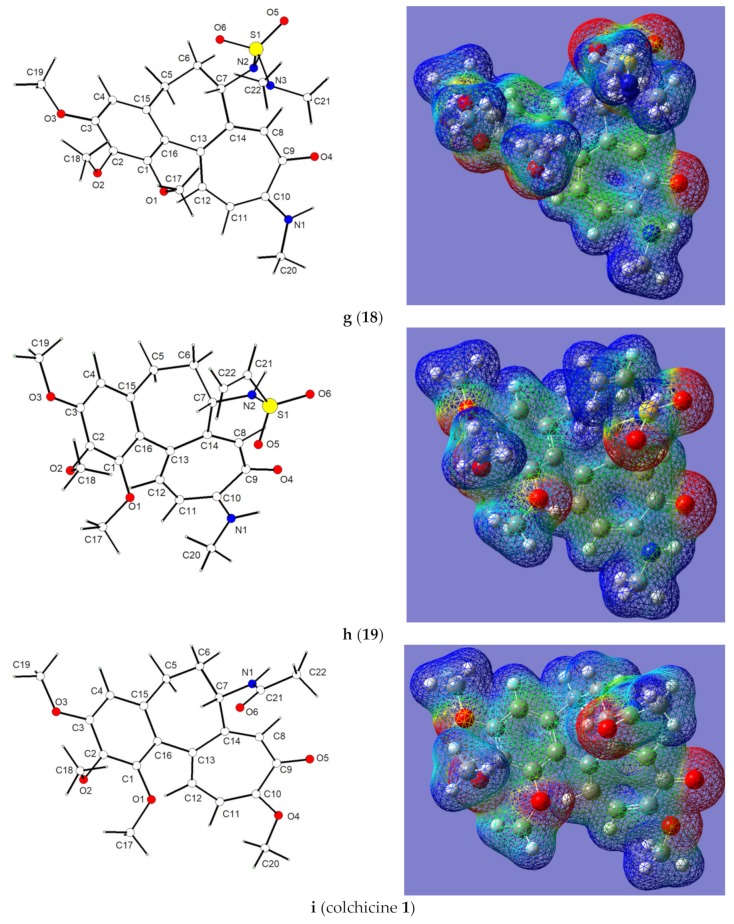
The role of the trimethoxyphenyl ring A of colchicine as well as that of the tropolone ring C in tubulin binding have been studied in great details. The tropolonoic ring C of the colchicine skeleton is found to be crucial for the interaction with tubulin [47,48]. The molecular electrostatic potential map (MESP) correlated with the electronic density in a molecule and is a powerful tool for analyzing interactions [49,50,51]. It was, therefore, calculated for all structurally characterized colchicine derivatives. Additionally, the gas-phase structures of all molecules were determined using the DFT optimization with the Gaussian09 program package [52]. All calculations were carried out by the DFT method using the Becke3-Lee–Yang–Parr correlation functional (B3LYP) [53,54,55,56] with the 6–31 + G basis set, starting from the X-ray geometry of molecules. The gas-phase optimized conformations of all colchicine derivatives are, in general, in good agreement with those obtained from the X-ray single crystal investigation, however the optimized torsion angle C18–O2–C2–C3 describing the orientation of the methoxy group is significantly smaller than that provided by the X-ray analysis (Table 1 and for more details see Supplementary Table S2).
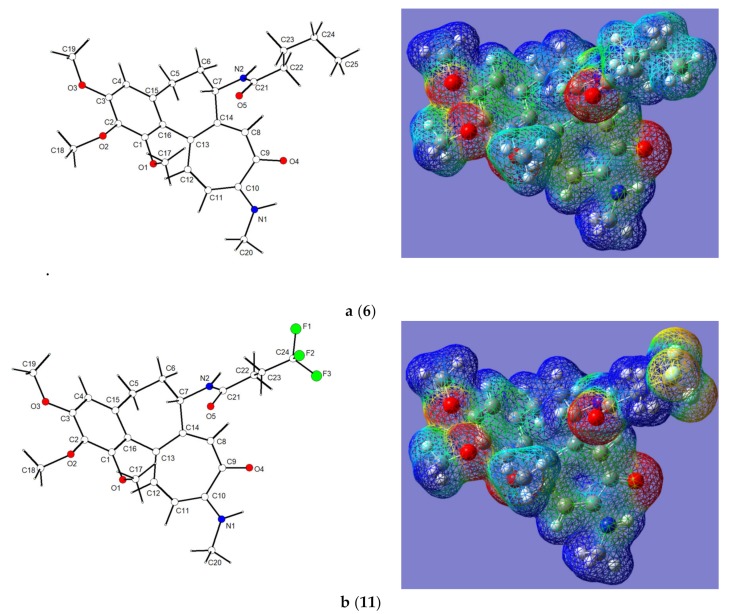
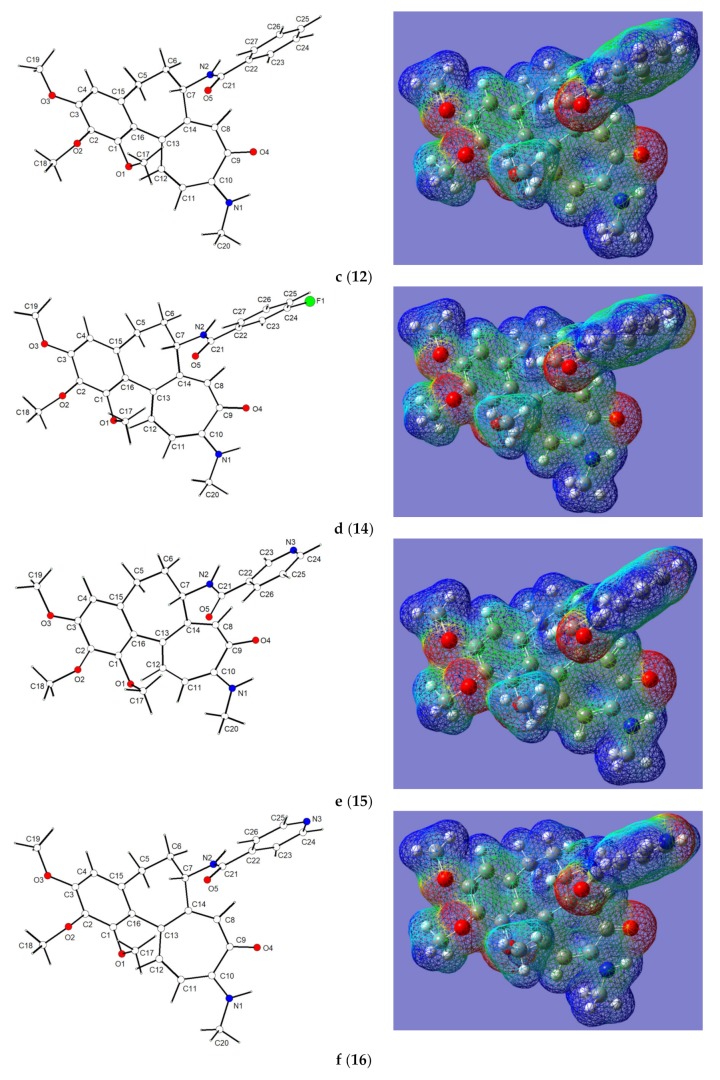
The region of tubulin that interacts with colchicine is near the αβ-tubulin/dimer interface [57]. In order to better understand the interaction of the colchicine derivatives with tubulin, the molecular electrostatic potential was calculated for all structurally characterized colchicine derivatives as well as, for comparison, for colchicine itself. The three-dimensional MESP maps for colchicine derivatives and for colchicine itself were calculated on the basis of the DFT (B3LYP) optimized geometries of molecules and mapped onto the total electron density isosurface (0.008 eÅ−3) for both molecules using the GaussView 5.0 program (Figure 2). The color coding of MESP is in the range of −0.05 (red) to 0.05 eÅ-1 (blue). For all colchicine derivatives, the regions of negative MESP are usually associated with the lone pair of electronegative atoms (O and N), whereas the regions of positive MESP are associated with the electropositive atoms (Figure 2).
Figure 2.
Optimized conformation (left) and three-dimensional molecular electrostatic potential map (right) for colchicine derivatives (a–h) and colchicine itself (i), for comparison. Color code: −0.05 eÅ−1 (red) to +0.05 eÅ−1 (blue).
The nucleophilic regions in colchicine derivatives are observed near oxygen atoms of all methoxy and carbonyl groups. In addition, significantly less negative value of MESP than that near the oxygen atoms spreads across the aromatic phenyl rings. The planar conformation of tropolone ring C, showing the alternating single and double C-C bonds, is manifested as partial delocalization of the π electrons resulting in a slightly negative value of MESP on both sides of the planar fragment of colchicine derivatives. The molecular electrostatic potential for colchicine itself was also calculated for comparison (Figure 2i). In all colchicine derivatives the methoxy (-OCH3) substituent in the tropolone C ring is replaced by N-methylamino substituent (-NHCH3), therefore, MESP maps show a less negative area near this group (Figure 2a–h) compared to the MESP map of colchicine itself (Figure 2i). Additionally, the replacement in colchicine molecule of the -NHC(O)CH3 group in ring B at C7 atom with various substituents modified the size of the molecule and the maps of electrostatic potential. This is particularly visible for derivatives 11, 14 and 18, 19 in which the -NHC(O)CH3 group is replaced by -NHC(O)C2H4CF3, -NHC(O)C6H4F in 11 and 14, respectively, and in 18 and 19 by the substituents containing sulfonyl group (-SO2R).
The DFT results, especially the three-dimensional molecular electrostatic potential map (MESP) providing information on the distribution of the electron density of molecules are useful for predictions of interactions between the tested compounds and homology modeled tubulin βI. The formation of guest-host complexes (colchicine derivatives as guest and tubulin as host) depends on the guest’s fit into the host cavity and their interactions that result from the mutual matching of electrostatic interactions.
2.4. In Vitro Determination of Drug-Induced Inhibition of Human Cancer Cell Line Growth
The synthesized colchicine derivatives 2–21 and starting material 1 were evaluated for their in vitro antiproliferative effect on four human cancer cell lines, including one cell line displaying various levels of drug resistance and additionally one normal murine embryonic fibroblast cells.
The majority of new derivatives of 1 showed antiproliferative activity in the nanomolar range and were characterized by lower IC50 values than unmodified colchicine 1, as well as doxorubicin and cisplatin, commonly used as antitumor agents in cancer chemotherapy (Table 2). From the set of tested compounds, the ones most active against A549 tumor cell line were 2, 4–6, 8–14 and 18–19 (IC50 ≤ 15 nM), against MCF-7 tumor cell line-were 2, 9–17 and 19 (IC50 ≤ 13 nM), against LoVo tumor cell line-were 2, 4–6, 8–16, 18–19 (IC50 ≤ 11 nM) of which the lowest IC50 values were shown by compounds 9–10 and 13 (IC50 = 0.7–1.8 nM). Moreover, compound 13 was observed to be most active towards the LoVo/DX line (IC50 = 9.6 nM), approx. 170 times more potent than unmodified colchicine 1 (IC50 = 1646.6 nM). Compound 7 from amides and compound 20 from sulfonamides showed the weakest activity (the highest IC50 values) against all cancer cell lines tested. The decrease in cytotoxicity of compound 7 could be related to an increase in hydrophobicity (high calculated octanol/water partition coefficient clogP = 8.7, see Table 3). It is well known that high clogP value and therefore low hydrophilicity are responsible for poor absorption and permeation to the colchicine binding pocket in β-tubulin. The high IC50 value for compound 20 may be due to the presence of a morpholine ring which is a large volume substituent and can adopt different conformations. Although these compounds were the least potent out of the whole series of tested derivatives (1–21), their IC50 values were in the micromolar range (see Table 2).
Table 2.
Antiproliferative activity (IC50) of colchicine (1) and its derivatives (2–21) compared with antiproliferative activity of standard anticancer drugs doxorubicin and cisplatin and the calculated values of the resistance index (RI) of tested compounds.
| Compound | A549 | MCF-7 | LoVo | LoVo/DX | BALB/3T3 | |
|---|---|---|---|---|---|---|
| IC50 [nM] | IC50 [nM] | IC50 [nM] | IC50 [nM] | RI | IC50 [nM] | |
| 1 | 115.3 ± 23.6 | 22.6 ± 1.3 | 17.5 ± 2.5 | 1646.6 ± 314.0 | 93.9 | 115.3 ± 36.8 |
| 2 | 10.8 ± 1.3 | 8.6 ± 1.3 | 4.3 ± 1.3 | 271.3 ± 99.9 | 63.0 | 10.8 ± 1.3 |
| 3 | 16.9 ± 2.8 | 19.7 ± 1.7 | 14.0 ± 1.7 | 129.2 ± 11.8 | 9.2 | 19.7 ± 7.0 |
| 4 | 14.6 ± 2.4 | 14.6 ± 1.5 | 9.7 ± 1.5 | 271.8 ± 104.4 | 28.0 | 19.4 ± 4.1 |
| 5 | 14.1 ± 2.4 | 14.1 ± 1.4 | 9.6 ± 0.5 | 194.8 ± 51.9 | 20.2 | 16.4 ± 3.5 |
| 6 | 13.6 ± 1.4 | 15.9 ± 6.6 | 6.8 ± 3.9 | 102.3 ± 20.7 | 15.0 | 13.6 ± 2.3 |
| 7 | 613.8 ± 194.4 | 464.8 ± 186.7 | 62.4 ± 16.9 | 2435.7 ± 923.4 | 39.0 | 545.9 ± 104.4 |
| 8 | 11.7 ± 1.4 | 18.8 ± 9.9 | 7.0 ± 1.4 | 171.2 ± 41.3 | 24.3 | 28.1 ± 10.8 |
| 9 | 11.6 ± 2.8 | 9.2 ± 1.4 | 1.8 ± 0.4 | 62.4 ± 6.7 | 35.2 | 11.6 ± 2.3 |
| 10 | 8.6 ± 1.3 | 8.6 ± 1.2 | 1.5 ± 0.5 | 38.5 ± 21.6 | 25.8 | 10.7 ± 1.3 |
| 11 | 14.6 ± 2.1 | 12.7 ± 0.4 | 10.4 ± 1.3 | 289.6 ± 165.2 | 27.8 | 81.3 ± 20.4 |
| 12 | 13.0 ± 1.3 | 13.0 ± 1.3 | 8.5 ± 0.4 | 99.9 ± 10.0 | 11.8 | 13.0 ± 3.3 |
| 13 | 6.3 ± 3.2 | 9.2 ± 0.8 | 0.7 ± 0.1 | 9.6 ± 3.3 | 14.0 | 6.2 ± 1.6 |
| 14 | 10.7 ± 0.6 | 12.6 ± 1.3 | 8.6 ± 0.8 | 102.5 ± 24.9 | 12.0 | 12.6 ± 2.1 |
| 15 | 36.8 ± 12.1 | 13.0 ± 2.2 | 10.8 ± 1.3 | 832.1 ± 292.7 | 76.8 | 43.3 ± 29.7 |
| 16 | 17.3 ± 3.7 | 12.8 ± 0.9 | 10.8 ± 1.3 | 946.9 ± 260.5 | 87.4 | 52.0 ± 29.3 |
| 17 | 56.6 ± 14.7 | 10.3 ± 3.9 | 21.1 ± 17.5 | 6466.0 ± 264.2 | 306.0 | 100.1 ± 24.1 |
| 18 | 10.6 ± 0.6 | 15.5 ± 1.7 | 9.3 ± 1.1 | 540.2 ± 107.2 | 57.8 | 14.2 ± 13.2 |
| 19 | 11.4 ± 1.7 | 13.0 ± 4.3 | 8.4 ± 0.7 | 306.7 ± 144.9 | 36.7 | 8.3 ± 3.8 |
| 20 | 800.3 ± 130.0 | 150.0 ± 25.3 | 268.4 ± 94.0 | 44385.7 ± 23852.0 | 165.4 | 991.1 ± 280.5 |
| 21 | 85.5 ± 5.4 | 134.3 ± 41.5 | 73.5 ± 15.7 | 6122.0 ± 825.1 | 83.3 | 87.6 ± 13.5 |
| Doxorubicin | 141.7 ± 46.0 | 204.2 ± 47.8 | 99.4 ± 41.0 | 8732.0 ± 2540.7 | 87.9 | 149.0 ±126.8 |
| Cisplatin | 5741.0 ± 968.0 | 7139.8 ± 1218.7 | 7076.3 ± 1596.2 | 8336.5 ± 1119.2 | 1.2 | 5665.1 ± 31.8 |
The IC50 value is defined as the concentration of a compound at which 50% growth inhibition is observed. The IC50 values shown are mean ± SD. Human lung adenocarcinoma (A549), human breast adenocarcinoma (MCF-7), human colon adenocarcinoma cell line (LoVo) and doxorubicin-resistant subline (LoVo/DX), normal murine embryonic fibroblast cell line (BALB/3T3). The RI (Resistance Index) indicates how many times more chemoresistant is a resistant subline relative to its parental cell line. The RI was calculated for each compound using the formula: RI = (IC50 for LoVo/DX cell line)/(IC50 for LoVo cell line). When RI is 0–2, the cells are sensitive to the compound tested, RI in the range 2–10 means that the cells shows moderate sensitivity to the drug tested, RI above 10 indicates strong drug resistance.
Table 3.
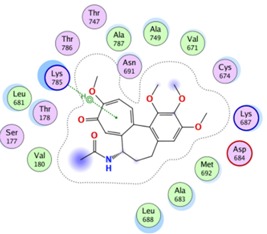
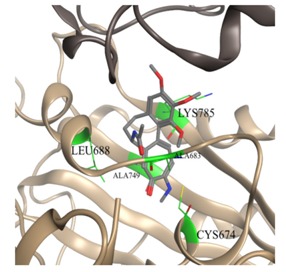
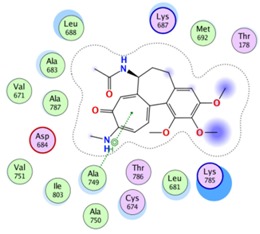
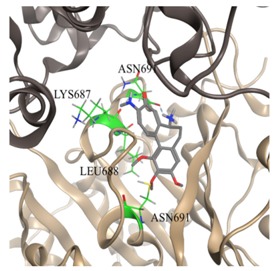
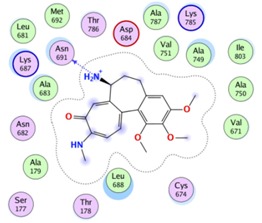
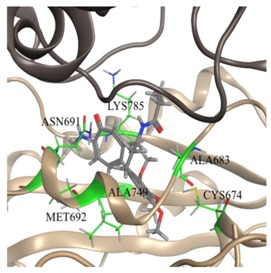
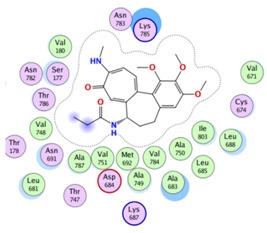
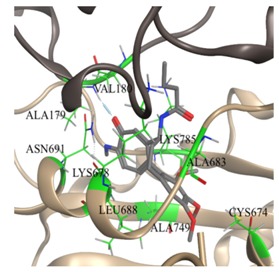
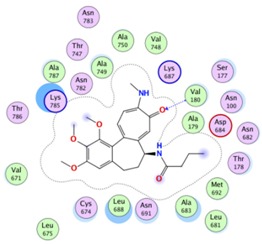
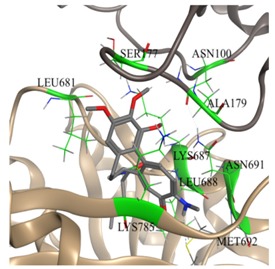
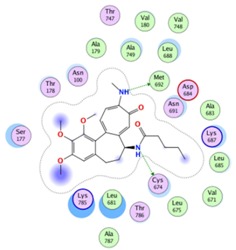
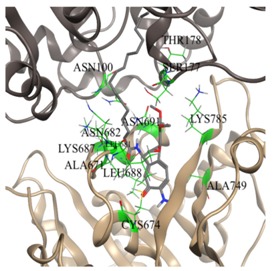
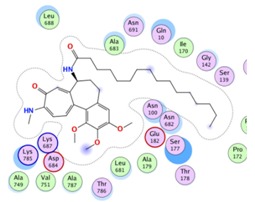
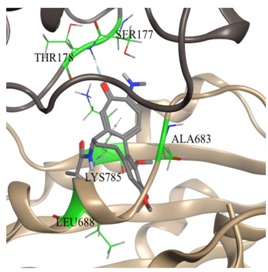
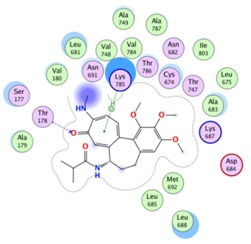
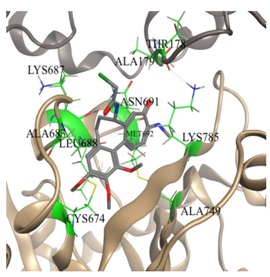
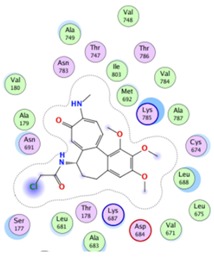
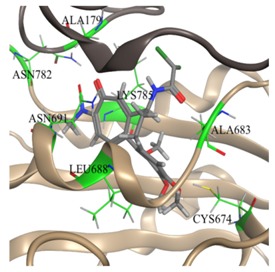
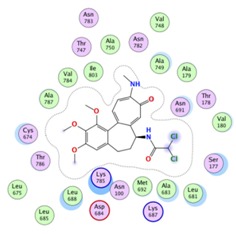
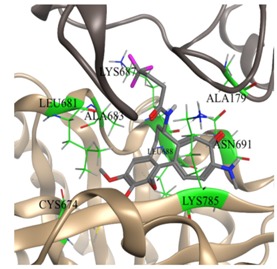
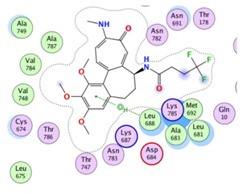
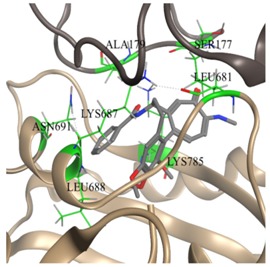
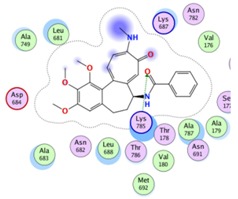
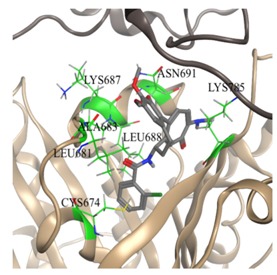
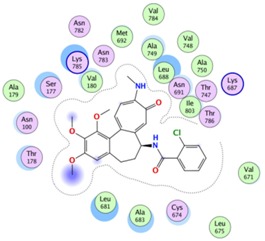
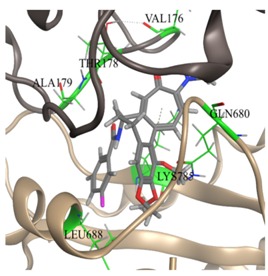
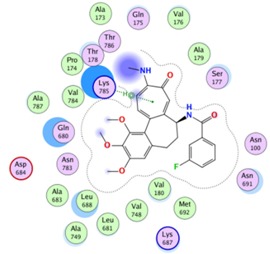
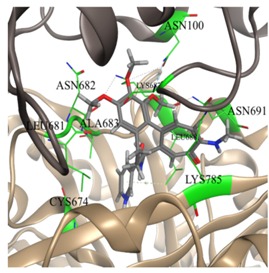
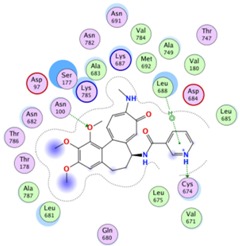
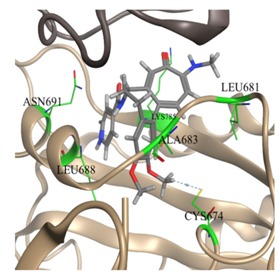
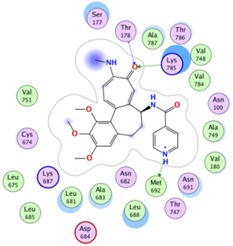
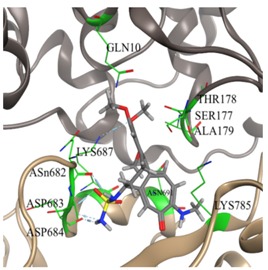
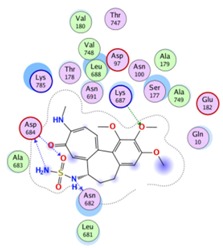
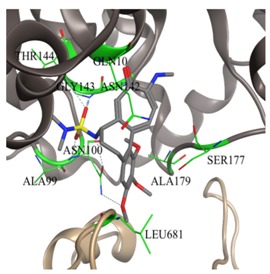
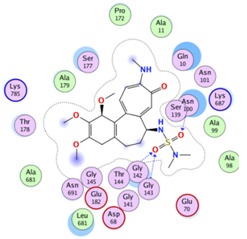
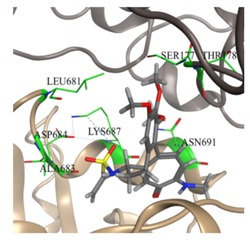
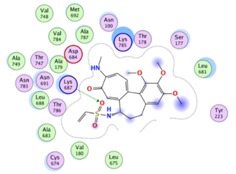
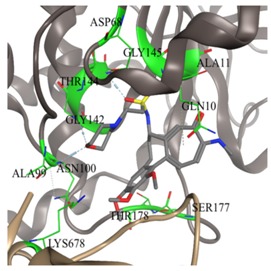
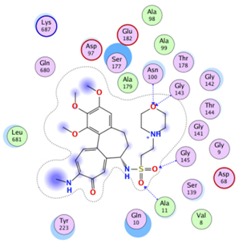
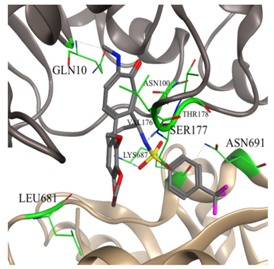
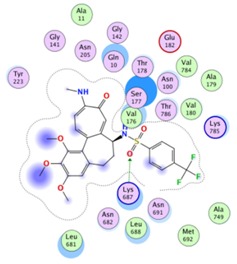
Computational predictions of interactions between tested compounds (1–21) and homology modeled tubulin βI. 3D representation and 2D layout of colchicine derivatives–tubulin protein complex, binding energy (BE), calculated octanol/water partition coefficient (clogP) and active residues are tabulated.
| Compound | 3D Representation of the Interactions | 2D Representation of the Interactions | Binding Energy [kcal/mol] | clogP | Active Residues |
|---|---|---|---|---|---|
| 1 |
|
|
−41.0 | 1.1 | Ala179 Val180 Cys674 Leu688 Asn691 Ala749 Lys785 |
| 2 |
|
|
−39.3 | 1.6 | Cys674 Ala683 Leu688 Lys785 |
| 3 |
|
|
−4.0 | 0.9 | Cys674 Lys687 Leu688 Asn691 |
| 4 |
|
|
−43.4 | 1.9 | Cys674 Ala683 Leu688 Asn691 Met692 Ala749 Lys785 |
| 5 |
|
|
−43.0 | 2.5 | Ala179 Val180 Cys674 Leu688 Asn691 Ala749 Lys785 |
| 6 |
|
|
−37.2 | 3.0 | Asn100 Ser177 Ala179 Leu681 Lys687 Leu688 Asn691 Lys785 |
| 7 |
|
|
−53.7 | 8.7 | Gln10 Asn100 Ser177 Thr178 Cys674 Leu681 Asn682 Ala683 Lys687 Leu688 Asn691 Ala749 Lys785 |
| 8 |
|
|
−32.3 | 2.7 | Ser177 Leu681 Ala683 Leu688 Lys785 |
| 9 |
|
|
−44.0 | 2.2 | Ala179 Cys674 Ala683 Lys687 Leu688 Asn691 Met693 Ala749 Lys785 |
| 10 |
|
|
−41.8 | 2.7 | Ala179 Cys674 Ala683 Leu688 Asn691 Asn782 Lys785 |
| 11 |
|
|
−34.7 | 3.0 | Ala179 Cys674 Leu681 Ala683 Lys687 Leu688 Asn691 Lys785 |
| 12 |
|
|
−35.2 | 3.3 | Ser177 Ala179 Leu681 Lys687 Leu688 Asn691 Lys785 |
| 13 |
|
|
−40.1 | 3.9 | Cys674 Leu681 Ala683 Lys687 Leu688 Asn691 Lys785 |
| 14 |
|
|
−34.3 | 3.4 | Val176 Ser177 Thr178 Ala179 Gln680 Leu688 Lys785 |
| 15 |
|
|
−43.9 | 2.0 |
Asn100 Ser177 Cys674 Leu681 Asn682 Ala683 Lys687 Leu688 Asn691 Lys785 |
| 16 |
|
|
−38.3 | 2.0 | Ser177 Thr178 Cys674 Leu681 Ala683 Leu688 Asn691 Lys785 |
| 17 |
|
|
−34.8 | 1.9 |
Gln10 Ser177 Thr178 Ala179 Asn682 Ala683 Asp684 Lys687 Asn691 Lys785 |
| 18 |
|
|
−54.6 | 2.5 |
Gln10 Ala99 Asn100 Gly142 Gly143 Thr144 Ser177 Thr178 Ala179 Leu681 |
| 19 |
|
|
−23.4 | 2..8 |
Ser177 Thr178 Leu681 Ala683 Asp684 Lys687 Asn691 Lys785 |
| 20 |
|
|
−59.6 | 2.4 | Gly9 Gln10 Ala11 Asp68 Ala99 Asn100 Gly142 Gly143 Thr144 Gly145 Ser177 Thr178 Lys687 |
| 21 |
|
|
−29.8 | 4.9 | Ala179 Val180 Cys674 Leu688 Asn691 Ala749 Lys785 |

|
|||||
Although the synthesized compounds are effective toward cancer cells, their potential is limited against cells with developed drug resistance. The data presented in Table 2 show that unmodified colchicine 1 and all of the colchicine derivatives 2–21 less effectively inhibited the proliferation of the doxorubicin-resistant subline LoVo/DX than the sensitive LoVo cell line. The calculated values of RI clearly confirmed that none of the tested amides and sulfonamides was able to overcome the drug resistance of LoVo/DX cell line (RI ranges from 11.8 to 306.0). It can be explained by the upregulated expression of efflux transporters in these cells, playing an important role in drug transport in many organs and determining the drug resistance of cancer cells. Because this type of resistance is one of the mechanisms of cancer resistance [58], compounds 1–2 and 4–21 are probably good substrates for such pumps. Increased efflux of compounds makes it impossible to reach their adequate concentrations in the cell and consequently to exert efficient cytotoxic effect. The only compound which showed RI < 10 was derivative 3, having at position C7 a free amino group. Keeping in mind its good activity (IC50 < 20 nM for three cancer cells, see Table 2) it can be still considered as a good starting point for the chase after antitumor agents active against drug resistant lines.
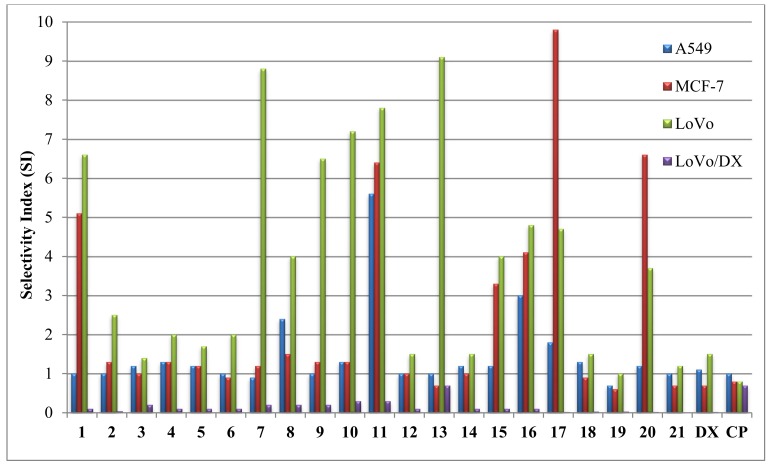
The selectivity index (SI) was calculated to evaluate the toxicity of the compounds studied against normal cells and to predict their therapeutic potential (see Figure 3). High SI values result from large differences between the cytotoxicity against cancer and normal cells and this means that cancer cells will be killed at a higher rate than normal ones. From the set of tested compounds with methylamino group at position C10 and alkyl chains at position C7 (2, 4–8, 19) the best selectivity index for A549, MCF-7 and LoVo cells (SI = 1.5–4.0) showed 8 with short and branched substituent (isobutyric acid derivative). The 4,4,4-trifluorobutyric acid derivative 11 (from compounds with alkyl chains of various lengths containing halogen atoms 9–11) showed outstanding selectivity for three out of four cancer cells (SI = 5.6–7.8). It should be emphasized that compound 11 was the only compound with SI values greater than that of unmodified colchicine 1 for all tumor cell lines. Despite the fact that compounds 9, 10, and 13 stood out from the synthesized compounds in terms of IC50 values, their selectivity indices were high only for LoVo lines (SI = 6.5–9.1), they were very cytotoxic also to non-cancerous BALB/3T3 cells (IC50 = 6.2–11.6 nM). Among aryl amides and sulfonamides 12–16 and 21, distinctive SI values were derived for colchicine derivatives containingnicotinic and isonicotinic amide residue (SI ranges 3.0 to 4.8). These results are noteworthy and suggest that extended and more detailed research of similar derivatives is necessary to determine the importance of ring aromaticity, its size or heteroatom type. Especially high SI values for MCF-7 were obtained for sulfamide 17 (SI = 9.8) and sulfonamide containing a morpholine ring 20 (SI = 6.6). These results deserve special attention and require further studies to determine whether the conversion of an amide bond to a sulfonamide bond with an appropriate substituent would allow obtaining compounds highly selective towards MCF7 cells, compared to colchicine 1. As many as thirteen of the obtained derivatives exhibited SI ≥ 2 for LoVo cell line (see Figure 3). The results indicated that properly designed doubly modified (at C7 and C10 positions) colchicine derivatives can have greater selectivity towards cancer cells than the parental compound.
Figure 3.
Comparison of selectivity index (SI) values of the tested compounds. The SI was calculated for each compound using the formula: SI = (IC50 for normal cell line BALB/3T3)/(IC50 for respective cancerous cell line). A favorable SI > 1.0 indicates a drug with efficacy against tumor cells greater than the toxicity against normal cells.
2.5. In Silico Determination of the Molecular Mode of Action
In the present study, computational investigation including molecular docking, molecular dynamics (MD) simulations, molecular mechanics generalized Born/surface area (MM/GBSA) binding free energy calculations and decomposition of pair-wise free energy on a per-residue basis were conducted to deeply explore the molecular basis for the binding of twenty novel double modified colchicine amides and sulfonamides to β-tubulin. The latter is one of the subunits of microtubules in the cytoskeleton structure of every eukaryotic cell, which is the target of many anticancer drugs. The twenty structures of colchicine derivatives described above were docked into the βІ-tubulin (the most abundant isotype in most cancer tumors) colchicine binding site.
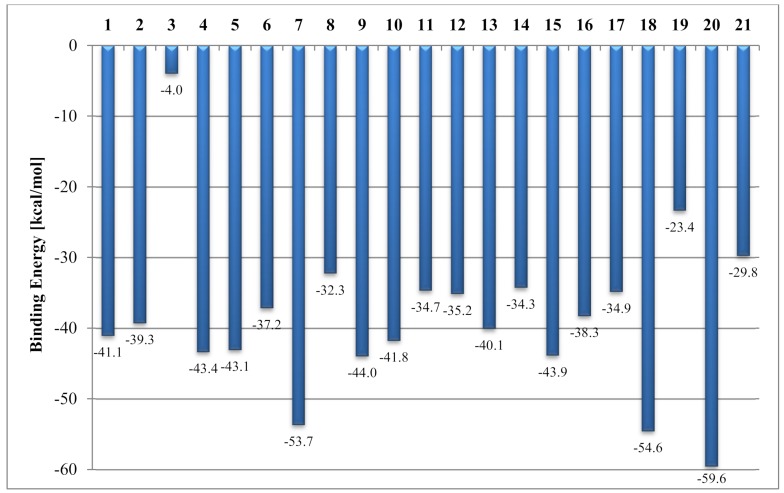
On the basis of our computational predictions, according to increasing binding energy, the compounds are ordered as follows: 20 (−59.6), 18 (−54.6), 7 (−53.7), 9 (−44.0), 15 (−43.9), 4 (−43.4), 5 (−43.1), 10 (−41.8), 1 (−41.1), 13 (−40.1), 2 (−39.3), 16 (−38.3), 6 (−37.2), 12 (−35.2), 17 (−34.9), 11 (−34.7), 14 (−34.3), 8 (−32.3), 21 (−29.8), 19 (−23.4), 3 (−4.0) kcal/mol with the binding energies in the parenthesis given in units of kcal/mol. Binding energies of these compounds are shown in Figure 4 and Table 3.
Figure 4.
Comparison of binding energies of the tested compounds complexed with tubulin βI. Binding energies have been estimated using the MM/GBSA method.
In view of the calculated binding energies, we can conclude that there is no strong correlation (the lower the binding energy, the more biologically active the chemical compound) between in silico computer calculations (BE values, Figure 4) and in vitro activity results (IC50 values, Table 2).
The lowest binding energies, −59.6 and −53.7 kcal/mol, were shown by sulfonamide 20 (derivative with the morpholine ring) and amide 7 (derivative of palmitic acid), respectively. However, these compounds showed the weakest antiproliferative activity (highest IC50 values) among all compounds tested (1–21).
Compound 18 has the third lowest energy (−54.6 kcal/mol) and good cytotoxicity with IC50 from 9.3 to 15.5 nM for LoVo, A549 and MCF-7 cancer cells. The molecular-level computations indicate that 18 fits well to βI-tubulin and probably uses this binding site as a target. The majority of the other derivatives 2, 4–6, 8–17 exhibited binding energy less than −30.0 kcal/mol, so close to the energy of unmodified colchicine 1 (BE = −41.1 kcal/mol), which is a compound known to inhibit tubulin polymerization. These compounds bind to the active sites of βI-tubulin isotype and may therefore have a mechanism of action similar to 1 and may be colchicine binding site inhibitors, although their in vitro activities towards various cells characterized by an IC50 value (Table 2) were lower than that of colchicine 1.
Derivative 3 showed the highest binding energy value (BE = −4.0 kcal/mol), therefore its antiproliferative activity is not exclusively the result of interaction with tubulin. This is an important finding because compound 3 was the only one which showed any possibility of breaking the drug resistance of the LoVo/DX line (RI = 9.2, see Table 2).
Therefore, we can see that the results only partly correlate with in vitro determined biological activity of these compounds as indicated though the corresponding IC50 values. This may be explained by several additional effects taking place in living cells compared to the computational simulations that focus only on the binding mode of the compounds to the target. Primarily off-target interactions involving efflux transporters with different affinities for the individual compounds and differences in solubility of these colchicine derivatives or their membrane permeability. Additionally, the lack of significant correlation may be due to the fact that in various cancer cells the expression of specific β-tubulin isotypes significantly varies [59]. We propose the inclusion of binding affinity calculations for these compounds with regard to not only other tubulin isotypes but also with respect to most important efflux transporters in order to minimize them and hence increase the activity of the drug in vitro and in vivo.
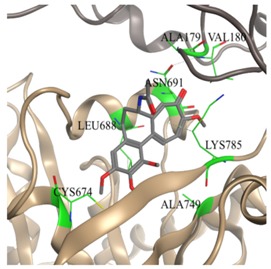
Schematic interactions of the compounds with CBS of βІ-tubulin residues are shown in Table 3.
In 3D representation, the interacting residues predicted from pairwise per-residue binding free energy decomposition calculations (E < −2 kcal/mol) are shown in stick presentation and their carbons and the ribbon are colored as green. Tubulin is shown in cartoon representation. Hydrogen bonds and their directionality are represented as black dashed arrows. The structures are color-coded as follows: tubulin αI, brown; tubulin βI, beige. Compounds are displayed with sticks and the atoms are colored as O (red), C (gray), N (blue), S (yellow), Cl (green) and F (pink). Binding energy defines the affinity of binding for colchicine derivatives complexed with tubulin βI. Binding energies are predicted by MM/GBSA method. The last column contains information about the active residues with the binding free energy decomposition (Edecomp) less than −2 kcal/mol (the residues with Edecomp < −3 kcal/mol are highlighted in boldface). The last line contains the graphical key to help interpret the 2D part of the ligand interactions panel.
Derivative compounds are designed with different side chains at C7 position of colchicine 1. Compounds 2, 4–8 have alkyl chains of various lengths, straight and branched and compound 19 has an unsaturated alkyl chain. The second lowest binding energy compound 7 within all the compounds is in this group (BE = −53.6 kcal/mol). Compound 7 appears to be engaged in some interactions with α-tubulin (−3 < Edecomp < −2 kcal/mol). Most of the compounds in this group are bound through Lys785, Lys687 and Leu688 residues.
Compounds 9–11 were designed with alkyl chains of various length containing halogen atoms side chains at position C7 of colchicine 1. In this group, the common binding residues with (−3 < Edecomp < −2 kcal/mol) are Ala179, Cys674, Asn691, while the strongest binding residues (Edecomp < −3 kcal/mol) are Leu688 and Lys785.
Compounds 12–16, 21 were designed with an aromatic group side chain without or with substituents at C7 position of colchicine 1. The same trend of strong binding of Leu688 and Lys785 residues with the compounds is seen in this group. The binding energies in this group are on the higher side compared to the other compounds.
As the last group, compounds 17–18 and 20 contain the sulfonamide moieties at position C7 of colchicine 1. The strongest binding residues in this group belong to both α-tubulin (Gln10 and Ser177) in compound 17, (Gln10, Gly142, Gly143, Thr144 and Ser177) in compound 18 and (Asp68 and Asn100) in compound 20 with (Edecomp < −3 kcal/mol) and β-tubulin (Asp684, Asn691, Lys785) in compound 17 and Lys687 in compound 20. The lowest binding energy between all the compounds characterizes compounds 20 and 18, which mainly bind to α-tubulin.
In the experimental part of the study, the highest IC50 values (the weakest activity) were found for compound 7 from the amides and compound 20 from the sulfonamides studied against all cancer cell lines tested. According to our computational analysis, although these compounds show the lowest binding energies, they do not bind to the CBS, which is located in β-tubulin and has the tendency to go beyond and also bind to α-tubulin.
3. Materials and Methods
3.1. General
All solvents, substrates and reagents were obtained from TriMen Chemicals (Poland) or Sigma Aldrich and were used without further purification. CDCl3 and CD2Cl2 spectral grade solvents were stored over 3 Å molecular sieves for several days. TLC analysis was performed using pre-coated glass plates (0.2 mm thickness, GF-254, pore size 60 Å) from Agela Technologies and spots were visualized by UV-light. Products were purified by flash chromatography using high-purity grade silica gel (pore size 60 Å, 230–400 mesh particle size, 40–63 μm particle size) from SiliCycle Inc. Preparative HPLC was performed on LC-20AP Shimadzu with ELSD-LTII detector equipped with Phenomenex Luna C18 250 × 21 mm, 5 μm column eluted with 20 mL/min flow over 20 min of acetonitrile in water. Solvents were removed using a rotary evaporator.
3.2. Spectroscopic Measurements
NMR spectra were recorded on Bruker Avance DRX 500 (1H NMR at 500 MHz and 13C NMR at 126 MHz) magnetic resonance spectrometers. 1H NMR spectra are reported in chemical shifts downfield from TMS using the respective residual solvent peak as internal standard (CDCl3 δ 7.26 ppm, CD2Cl2 δ 5.32 ppm, (CD3)2SO δ 2.50 ppm). 1H NMR spectra are described as follows: chemical shift (δ, ppm), multiplicity (s = singlet, d = doublet, t = triplet, q = quartet, dd = doublet of doublets, dt = doublet of triplets, dq = doublet of quartets, m = multiplet), coupling constant (J) in Hz, and integration. 13C NMR spectra are described in chemical shifts downfield from TMS using the respective residual solvent peak as internal standard (CDCl3 δ 77.16 ppm, CD2Cl2 δ 53.84 ppm and (CD3)2SO δ 39.52 ppm).
Electrospray ionization (ESI) mass spectra were obtained on a Waters Alliance 2695 separation module with a PDA 2996 UV detector and Waters Micromass ZQ 2000 mass detector equipped with Restek Ultra Biphenyl 50 × 3 mm, 3 μm column eluted with 0.3 mL/min flow of 3–100% gradient (over 6 min) of acetonitrile in water.
3.3. Synthesis
3.3.1. Synthesis of 2
To a solution of 1 (1.0 equiv.) in EtOH, a methylamine (solution 33% in EtOH, 10.0 equiv.) was added. The mixture was stirred at reflux for 24 h and then concentrated under reduced pressure to dryness. The residue was purified using column flash chromatography (silica gel; DCM/MeOH) and next lyophilized from dioxane to give the pure product 2 as a yellow solid with a yield of 80%.
ESI-MS for C22H26N2O5 (m/z): [M + H]+ 399, [M + Na]+ 421, [2M + H]+ 797, [2M + Na]+ 819, [M – H]− 397, [M + HCOO−]− 443.
1H NMR (500 MHz, CDCl3) δ 8.70 (d, J = 6.4 Hz, 1H), 7.58 (s, 1H), 7.46 (d, J = 11.1 Hz, 1H), 7.28–7.25 (m, 1H), 6.58 (d, J = 11.3 Hz, 1H), 6.52 (s, 1H), 4.73–4.64 (m, 1H), 3.93 (s, 3H), 3.88 (s, 3H), 3.61 (s, 3H), 3.08 (d, J = 5.4 Hz, 3H), 2.47–2.43 (m, 1H), 2.37–2.31 (m, 1H), 2.29–2.22 (m, 1H), 2.02–1.96 (m, 1H), 1.94 (s, 3H).
13C NMR (126 MHz, CDCl3) δ 175.11, 170.19, 155.23, 152.91, 151.61, 151.10, 141.51, 139.37, 134.66, 130.42, 126.93, 122.81, 108.28, 107.20, 61.46, 61.40, 56.16, 52.72, 37.06, 30.15, 29.53, 22.74.
3.3.2. Synthesis of 3
To a solution of compound 2 (1.0 equiv.) in dioxane, 2M HCl (10.0 equiv.) was added and the mixture was stirred at reflux. Reaction progress was monitored by LC-MS. Then the reaction mixture was neutralized with 4M NaOH to pH~10 and extracted four times with EtOAc. The organic layers were combined, washed with brine, dried over Na2SO4, filtered and evaporated under reduced pressure. The residue was purified using column flash chromatography (silica gel; DCM/MeOH) and next lyophilized from dioxane to give the pure product 3 as a yellow solid with a yield of 73%.
ESI-MS for C20H24N2O4 (m/z): [M + H]+ 357, [M + Na]+ 379, [2M + Na]+ 735.
1H NMR (500 MHz, CDCl3) δ 7.61 (s, 1H), 7.33 (d, J = 11.1 Hz, 1H), 7.23–7.21 (m, 1H), 6.50 (s, 1H), 6.50 (d, J = 11.4 Hz, 2H), 3.87 (s, 3H), 3.87 (s, 3H), 3.75–3.72 (m, 1H), 3.59 (s, 3H), 3.05 (d, J = 5.5 Hz, 3H), 2.41–2.37 (m, 1H), 2.33–2.31 (m, 2H), 2.25 (s, 2H), 1.71–1.61 (m, 1H).
13C NMR (126 MHz, CDCl3) δ 175.57, 154.99, 153.25, 152.76, 150.59, 141.06, 138.73, 135.41, 129.74, 126.63, 123.68, 107.35, 106.94, 61.19, 60.84, 56.06, 54.01, 40.90, 30.69, 29.48.
3.3.3. General Procedure for the Synthesis of Colchicine Derivatives 4, 8, 13, 15–16, 18 and 21
Compounds 4, 8, 13, 15–16, 18 and 21 were obtained directly from compound 3. To a solution of compound 3 (1.0 equiv.) and Et3N (3.0 equiv.) in DCM in an ice bath, the corresponding acid/sulfonyl/sulfamide chloride (1.1 equiv.) diluted with DCM was added slowly. Next the ice bath was removed and the reaction mixture was stirred at RT. Reaction progress was monitored by LC-MS. Then the reaction mixture was diluted with EtOAc, washed with H2O, 1M K2CO3, brine and dried over Na2SO4. The residue was purified using column flash chromatography (silica gel; DCM/MeOH) and next lyophilized from dioxane to give respective compound.
Compound 4
Yellow solid, yield 86%.
ESI-MS for C23H28N2O5 (m/z): [M + H]+ 413, [M + Na]+ 435, [2M + H]+ 825, [2M + Na]+ 847, [M−H]− 411, [M + HCOO−]− 457.
1H NMR (500 MHz, CDCl3) δ 8.46 (s, 1H), 7.53 (s, 1H), 7.44 (d, J = 11.1 Hz, 1H), 7.25–7.21 (m, 1H), 6.55 (d, J = 11.4 Hz, 1H), 6.50 (s, 1H), 4.72–4.65 (m, 1H), 3.91 (s, 3H), 3.86 (s, 3H), 3.61 (s, 3H), 3.06 (d, J = 5.4 Hz, 3H), 2.44–2.40 (m, 1H), 2.33–2.30 (m, 1H), 2.26–2.17 (m, 3H), 1.94–1.88 (m, 1H), 1.05 (t, J = 7.6 Hz, 3H).
13C NMR (126 MHz, CDCl3) δ 175.09, 173.89, 155.20, 152.86, 151.64, 151.09, 141.49, 139.23, 134.67, 130.33, 126.95, 122.94, 108.14, 107.20, 61.44, 56.14, 52.37, 37.20, 30.18, 29.53, 29.11, 9.72.
Compound 8
Yellow solid, yield 96%.
ESI-MS for C24H30N2O5 (m/z): [M + H]+ 427, [M + Na]+ 449, [2M + H]+ 853, [2M + Na]+ 875, [M−H]− 425, [M + HCOO−]− 471.
1H NMR (500 MHz, CDCl3) δ 7.48 (d, J = 11.2 Hz, 1H), 7.45 (s, 1H), 7.31–7.28 (m, 1H), 6.67 (d, J = 7.3 Hz, 1H), 6.59 (d, J = 11.3 Hz, 1H), 6.53 (s, 1H), 4.75–4.63 (m, 1H), 3.94 (s, 3H), 3.89 (s, 3H), 3.63 (s, 3H), 3.10 (d, J = 5.4 Hz, 3H), 2.53–2.43 (m, 2H), 2.38–2.32 (m, 1H), 2.28–2.20 (m, 1H), 1.93–1.82 (m, 1H), 1.14 (t, J = 6.7 Hz, 6H).
13C NMR (126 MHz, CDCl3) δ 176.86, 175.21, 155.19, 152.85, 151.15, 141.56, 139.08, 134.55, 130.09, 126.97, 123.07, 107.91, 107.22, 61.51, 61.45, 56.13, 51.96, 37.56, 35.21, 30.19, 29.54, 19.70, 19.60.
Compound 13
Yellow solid, yield 86%.
ESI-MS for C27H27ClN2O5 (m/z): [M + H]+ 495/497, [M + Na]+ 517, [2M + H]+ 989/991, [M-H]− 493/495, [M + HCOO−]− 540.
1H NMR (500 MHz, CD2Cl2) δ 8.12 (d, J = 7.5 Hz, 1H), 7.60 (s, 1H), 7.42–7.39 (m, 2H), 7.29–7.22 (m, 2H), 7.19 (t, J = 7.5 Hz, 1H), 7.06 (t, J = 7.4 Hz, 1H), 6.60 (s, 1H), 6.53 (d, J = 11.3 Hz, 1H), 4.88–4.83 (m, 1H), 3.91 (s, 3H), 3.89 (s, 3H), 3.71 (s, 3H), 3.03 (d, J = 5.2 Hz, 3H), 2.52–2,48 (m, 1H), 2.42–2.31 (m, 2H), 2.14–2.04 (m, 1H).
13C NMR (126 MHz, CD2Cl2) δ 174.51, 165.99, 155.24, 153.11, 150.94, 150.51, 141.52, 139.19, 135.71, 134.71, 130.64, 130.43, 130.01, 129.60, 129.58, 126.83, 126.79, 123.26, 107.90, 107.46, 61.08, 61.07, 56.02, 52.86, 37.83, 30.11, 29.35.
Compound 15
Yellow solid, yield 23%.
ESI-MS for C26H27N3O5 (m/z): [M + H]+ 462, [M + Na]+ 484, [2M + H]+ 923, [2M + Na]+ 945, [M-H]− 460, [M + HCOO−]− 506.
1H NMR (500 MHz, CDCl3) δ 9.35 (d, J = 7.0 Hz, 1H), 9.07 (d, J = 1.8 Hz, 1H), 8.48 (dd, J = 4.8, 1.5 Hz, 1H), 8.13–8.06 (m, 1H), 7.65 (s, 1H), 7.51 (d, J = 11.2 Hz, 1H), 7.31 (q, J = 5.1 Hz, 1H), 7.05 (dd, J = 7.9, 4.9 Hz, 1H), 6.61 (d, J = 11.4 Hz, 1H), 6.54 (s, 1H), 4.99–4.86 (m, 1H), 3.95 (s, 3H), 3.89 (s, 3H), 3.70 (s, 3H), 3.08 (d, J = 5.4 Hz, 3H), 2.51–2.45 (m, 1H), 2.40–2.34 (m, 1H), 2.33–2.27 (m, 1H), 2.17–2.09 (m, 1H).
13C NMR (126 MHz, CDCl3) δ 174.69, 165.09, 155.37, 153.01, 151.82, 151.42, 151.15, 148.87, 141.59, 139.62, 134.89, 134.61, 130.41, 129.34, 126.86, 123.08, 122.79, 108.49, 107.27, 61.53, 61.48, 56.15, 53.22, 36.83, 30.28, 29.58.
Compound 16
Yellow solid, yield 39%.
ESI-MS for C26H27N3O5 (m/z): [M + H]+ 462, [M + Na]+ 484, [2M + H]+ 923, [2M + Na]+ 945, [M-H]− 460, [M + HCOO−]− 506.
1H NMR (500 MHz, CDCl3) δ 9.71 (d, J = 6.6 Hz, 1H), 8.37 (d, J = 5.8 Hz, 2H), 7.69 (s, 1H), 7.64 (d, J = 5.8 Hz, 2H), 7.54 (d, J = 11.2 Hz, 1H), 7.32–7.28 (m, 1H), 6.65 (d, J = 11.4 Hz, 1H), 6.53 (s, 1H), 4.98–4.81 (m, 1H), 3.95 (s, 3H), 3.87 (s, 3H), 3.71 (s, 3H), 3.10 (d, J = 5.4 Hz, 3H), 2.50–2.41 (m, 1H), 2.41–2.25 (m, 2H), 2.16–2.11 (m, 1H).
13C NMR (126 MHz, CDCl3) δ 174.51, 164.91, 155.37, 153.05, 151.64, 151.17, 150.18, 141.59, 140.46, 139.81, 134.59, 130.64, 126.78, 122.68, 120.99, 108.68, 107.27, 61.55, 61.47, 56.14, 53.46, 36.50, 30.29, 29.60.
Compound 18
Yellow solid, yield 38%.
ESI-MS for C22H29N3O6S (m/z): [M + H]+ 464, [M + Na]+ 486, [2M + H]+ 927, [2M + Na]+ 949, [M-H]− 462.
1H NMR (500 MHz, CDCl3) δ 7.85 (s, 1H), 7.45–7.41 (m, 2H), 6.58 (d, J = 11.3 Hz, 1H), 6.54 (s, 1H), 6.49–6.46 (m, 1H), 4.33–4.19 (m, 1H), 3.93–3.89 (m, 6H), 3.57 (s, 3H), 3.10 (d, J = 5.1 Hz, 3H), 2.58 (s, 6H), 2.49–2.39 (m, 2H), 2.35–2.26 (m, 1H), 2.01–1.90 (m, 1H).
13C NMR (126 MHz, CDCl3) δ 174.73, 155.46, 153.08, 150.77, 150.08, 141.39, 139.41, 134.59, 129.64, 126.34, 124.53, 108.22, 107.43, 61.34, 60.80, 56.48, 56.05, 39.91, 37.95, 30.50, 29.57.
Compound 21
Yellow solid, yield 83%.
ESI-MS for C27H27F3N2O6S (m/z): [M + H]+ 565, [M + Na]+ 587, [2M + H]+ 1129, [2M + Na]+ 1151, [M-H]− 563.
1H NMR (500 MHz, CDCl3) δ 8.72 (d, J = 7.5 Hz, 1H), 8.07 (s, 1H), 7.92 (s, 1H), 7.84 (d, J = 8.2 Hz, 2H), 7.53 (d, J = 8.3 Hz, 2H), 7.48 (d, J = 11.5 Hz, 1H), 6.66 (d, J = 11.8 Hz, 1H), 6.46 (s, 1H), 4.16 (q, J = 8.8 Hz, 1H), 3.91 (s, 3H), 3.86 (s, 3H), 3.58 (s, 3H), 3.08 (d, J = 5.2 Hz, 3H), 2.45–2.31 (m, 1H), 2.31–2.18 (m, 2H), 2.16–2.10 (m, 1H).
13C NMR (126 MHz, CDCl3) δ 170.13, 155.43, 153.53, 150.65, 150.15, 144.53, 141.35, 134.75, 133.34, 131.89, 127.57, 125.82, 125.79, 125.49, 124.38, 123.51, 122.21, 111.26, 107.42, 61.29, 60.95, 56.63, 56.04, 38.98, 30.26, 29.78.
3.3.4. General Procedure for the Synthesis of Colchicine Derivatives 5–7, 9–12 and 14
Compounds 5–7, 9–12 and 14 were obtained directly from compound 3. To a solution of compound 3 (1.0 equiv.) in DCM corresponding carboxylic acid (1.1 equiv.) and 1-(3-dimethylaminopropyl)-3-ethylcarbodiimide hydrochloride (EDCI, 1.1 equiv.) were added. Reaction progress was monitored by LC-MS. Then the reaction mixture was diluted with EtOAc, washed with H2O, 1M K2CO3, brine and dried over Na2SO4. The residue was purified using column flash chromatography (silica gel; DCM/MeOH) and next lyophilized from dioxane to give respective compound.
Compound 5
Yellow solid, yield 93%.
ESI-MS for C24H30N2O5 (m/z): [M + H]+ 427, [M + Na]+ 449, [2M + H]+ 853, [2M + Na]+ 875, [M-H]− 425, [M + HCOO−]− 471.
1H NMR (500 MHz, CDCl3) δ 7.88 (s, 1H), 7.51 (s, 1H), 7.45 (d, J = 11.1 Hz, 1H), 7.27–7.25 (m, 1H), 6.56 (d, J = 11.3 Hz, 1H), 6.51 (s, 1H), 4.76–4.68 (m, 1H), 3.92 (s, 3H), 3.87 (s, 3H), 3.61 (s, 3H), 3.08 (d, J = 5.4 Hz, 3H), 2.45–2.41 (m, 1H), 2.35–2.27 (m, 1H), 2.25–2.17 (m, 3H), 1.91 –1.85 (m, 1H), 1.65–1.55 (m, 2H), 0.87 (t, J = 7.4 Hz, 3H).
13C NMR (126 MHz, CDCl3) δ 175.10, 172.96, 155.22, 152.87, 151.43, 151.13, 141.52, 139.20, 134.61, 130.31, 126.94, 123.10, 108.13, 107.22, 61.45, 56.13, 52.21, 38.22, 37.45, 30.18, 29.54, 19.09, 13.93.
Compound 6
Yellow solid, yield 73%.
ESI-MS for C25H32N2O5 (m/z): [M + H]+ 441, [M + Na]+ 463, [2M + H]+ 881, [2M + Na]+ 903, [M-H]− 439, [M + HCOO−]− 485.
1H NMR (500 MHz, CDCl3) δ 7.86 (s, 1H), 7.50 (s, 1H), 7.44 (d, J = 11.1 Hz, 1H), 7.26–7.21 (m, 1H), 6.55 (d, J = 11.3 Hz, 1H), 6.51 (s, 1H), 4.76–4.68 (m, 1H), 3.93 (s, 3H), 3.88 (s, 3H), 3.61 (s, 3H), 3.08 (d, J = 5.4 Hz, 3H), 2.45–2.41 (m, 1H), 2.36–2.30 (m, 1H), 2.25–2.18 (m, 3H), 1.93–1.84 (m, 1H), 1.58–1.51 (m, 2H), 1.30–1.22 (m, 2H), 0.81 (t, J = 7.3 Hz, 3H).
13C NMR (126 MHz, CDCl3) δ 175.19, 173.02, 155.19, 152.85, 151.32, 151.15, 141.54, 139.11, 134.59, 130.19, 126.98, 123.13, 107.97, 107.20, 61.44, 56.13, 52.20, 37.46, 36.05, 30.19, 29.53, 27.70, 22.46, 13.76.
Compound 7
Yellow solid, yield 24%.
ESI-MS for C36H54N2O5 (m/z): [M + H]+ 595, [2M + H]+ 1189, [M-H]− 593, [M + HCOO−]− 639.
1H NMR (500 MHz, CDCl3) δ 8.18–7.90 (m, 2H), 7.73–7.53 (m, 2H), 6.88 (d, J = 10.1 Hz, 1H), 6.55 (s, 1H), 4.74 (s, 1H), 3.93 (s, 3H), 3.89 (s, 3H), 3.62 (s, 3H), 3.19 (s, 3H), 2.47 (d, J = 7.4 Hz, 1H), 2.39–2.08 (m, 5H), 1.54–1.49 (m, 2H), 1.28–1.16 (m, 26H), 0.86 (t, J = 7.0 Hz, 3H).
13C NMR (126 MHz, CDCl3) δ 175.09, 173.07, 155.23, 152.89, 151.32, 151.14, 141.55, 139.25, 134.58, 130.35, 126.91, 123.12, 108.24, 107.23, 61.45, 56.12, 52.16, 37.56, 36.39, 31.95, 30.18, 29.73, 29.69, 29.54, 29.53, 29.43, 29.39, 25.64, 22.72, 14.16.
Compound 9
Yellow solid, yield 83%.
ESI-MS for C22H25ClN2O5 (m/z): [M + H]+ 433/435, [M + Na]+ 455/457, [2M + H]+ 865, [2M + Na]+ 887, [M-H]− 431.
1H NMR (500 MHz, CDCl3) δ 8.60–8.38 (m, 1H), 7.48–7.39 (m, 2H), 7.29 (q, J = 5.2 Hz, 1H), 6.56 (d, J = 11.4 Hz, 1H), 6.52 (s, 1H), 4.75–4.63 (m, 1H), 4.08–3.95 (m, 2H), 3.92 (s, 3H), 3.87 (s, 3H), 3.60 (s, 3H), 3.07 (d, J = 5.3 Hz, 3H), 2.50–2.43 (m, 1H), 2.40–2.31 (m, 1H), 2.28–2.21 (m, 1H), 2.04–1.93 (m, 1H).
13C NMR (126 MHz, CDCl3) δ 175.04, 166.12, 155.33, 152.97, 151.10, 150.18,141.57, 139.37, 134.41, 129.97, 126.80, 122.73, 108.18, 107.27, 61.45, 61.33, 56.14, 52.91, 42.63, 37.17, 30.02, 29.55.
Compound 10
Yellow solid, yield 46%.
ESI-MS for C22H24Cl2N2O5 (m/z): [M + H]+ 467/469, [M + Na]+ 489/491, [2M + H]+ 933/935, [2M + Na]+ 957/959, [M-H]− 465/467.
1H NMR (500 MHz, CDCl3) δ 9.53 (d, J = 7.2 Hz, 1H), 7.56 (s, 1H), 7.53 (d, J = 11.2 Hz, 1H), 7.34 (q, J = 5.2 Hz, 1H), 6.64 (d, J = 11.4 Hz, 1H), 6.52 (s, 1H), 6.20 (s, 1H), 4.77–4.69 (m, 1H), 3.94 (s, 3H), 3.89 (s, 3H), 3.63 (s, 3H), 3.12 (d, J = 5.4 Hz, 3H), 2.46–2.44 (m, 1H), 2.38–2.23 (m, 2H), 1.97–1.91 (m, 1H).
13C NMR (126 MHz, CDCl3) δ 174.73, 164.19, 155.51, 153.12, 151.17, 150.51, 141.69, 139.81, 134.31, 130.45, 126.66, 122.71, 108.80, 107.36, 66.56, 61.52, 61.48, 56.17, 53.28, 37.17, 30.06, 29.66.
Compound 11
Yellow solid, yield 89%.
ESI-MS for C24H27F3N2O5 (m/z): [M + H]+ 481, [M + Na]+ 503, [2M + H]+ 961, [2M + Na]+ 983, [M-H]− 479, [M + HCOO−]− 525.
1H NMR (500 MHz, CDCl3) δ 8.77–8.65 (m, 1H), 7.56 (s, 1H), 7.49 (d, J = 11.2 Hz, 1H), 7.35–7.28 (m, 1H), 6.61 (d, J = 11.4 Hz, 1H), 6.51 (s, 1H), 4.75–4.70 (m, 1H), 3.94 (s, 3H), 3.88 (s, 3H), 3.62 (s, 3H), 3.10 (d, J = 5.4 Hz, 3H), 2.56–2.46 (m, 2H), 2.45–2.27 (m, 4H), 2.25–2.20 (m, 1H), 1.90–1.84 (m, 1H).
13C NMR (126 MHz, CDCl3) δ 174.99, 169.79, 155.36, 152.97, 151.33, 151.12, 141.57, 139.53, 134.54, 130.36, 127.98, 126.81, 122.89, 108.41, 107.25, 61.46, 61.34, 56.13, 52.52, 37.37, 30.16, 29.56, 29.33, 28.17.
Compound 12
Yellow solid, yield 89%.
ESI-MS for C27H28N2O5 (m/z): [M + H]+ 461, [M + Na]+ 483, [2M + H]+ 921, [2M + Na]+ 943, [M-H]− 459, [M + HCOO−]− 505.
1H NMR (500 MHz, CDCl3) δ 8.36 (d, J = 7.3 Hz, 1H), 7.81 (d, J = 7.2 Hz, 2H), 7.68 (s, 1H), 7.49 (d, J = 11.2 Hz, 1H), 7.29–7.23 (m, 2H), 7.16 (t, J = 7.7 Hz, 2H), 6.57 (d, J = 11.4 Hz, 1H), 6.53 (s, 1H), 4.99–4.93 (m, 1H), 3.96 (s, 3H), 3.89 (s, 3H), 3.70 (s, 3H), 3.06 (d, J = 5.4 Hz, 3H), 2.50–2.45 (m, 1H), 2.41–2.37 (m, 1H), 2.34–2.26 (m, 1H), 2.11–2.06 (m, 1H).
13C NMR (126 MHz, CDCl3) δ 175.02, 167.10, 155.26, 152.91, 151.30, 151.20, 141.57, 139.18, 134.65, 133.84, 131.31, 130.17, 128.28, 127.17, 127.01, 123.23, 108.01, 107.28, 61.53, 61.49, 56.14, 52.85, 37.19, 30.30, 29.53.
Compound 14
Yellow solid, yield 57%.
ESI-MS for C27H27FN2O5 (m/z): [M + H]+ 479, [M + Na]+ 501, [2M + H]+ 957, [2M + Na]+ 979, [M-H]− 477, [M + HCOO−]− 523.
1H NMR (500 MHz, CDCl3) δ 8.75 (s, 1H), 7.68 (s, 1H), 7.59 (d, J = 7.5 Hz, 1H), 7.53–7.47 (m, 2H), 7.31–7.26 (m, 1H), 7.10–7.05 (m, 1H), 6.97–6.92 (m, 1H), 6.61 (d, J = 11.4 Hz, 1H), 6.55 (s, 1H), 4.99–4.90 (m, 1H), 3.96 (s, 3H), 3.90 (s, 3H), 3.70 (s, 3H), 3.09 (d, J = 5.4 Hz, 3H), 2.53–2.47 (m, 1H), 2.43–2.37 (m, 1H), 2.35–2.27 (m, 1H), 2.18–2.10 (m, 1H).
13C NMR (126 MHz, CDCl3) δ 174.84, 165.56, 155.31, 152.98, 151.38, 151.20, 141.59, 139.42, 134.63, 130.36, 129.84, 126.92, 123.06, 122.53, 118.29, 118.12, 114.70, 114.52, 108.29, 107.27, 61.52, 61.50, 56.15, 53.09, 37.00, 30.31, 29.56.
3.3.5. Synthesis of 17
To a solution of compound 3 (1.0 equiv.) in DCM, N-(tert-Butoxycarbonyl)-N-[4-(dimethylazaniumylidene)-1,4-dihydropyridin-1-ylsulfonyl]azanide (4.0 equiv.) was added and the mixture was stirred at RT. Reaction progress was monitored by LC-MS. Then the reaction mixture was diluted with EtOAc, washed with H2O, 10% citric acid, 1M K2CO3, brine and dried over Na2SO4. The residue was purified using column flash chromatography (silica gel; EtOAc/hexanes). To the obtained compound, 4M HCl/EtOAc was added and the reaction mixture was stirred at RT overnight. Next the solvent was removed under reduced pressure and the residue was purified using preparative HPLC (MeCN/H2O) and lyophilized from dioxane to give the pure hydrochloride product 17 as a yellow solid with a yield of 21%.
ESI-MS for C20H25N3O6S (m/z): [M + H]+ 436, [M + Na]+ 458, [2M + H]+ 871, [2M + Na]+ 893, [M-H]− 434.
1H NMR (500 MHz, CDCl3) δ 8.19 (s, 2H), 7.50–7.39 (m, 2H), 6.66 (s, 1H), 6.57 (s, 1H), 4.41–4.32 (m, 1H), 3.94 (m, 6H), 3.56 (s, 3H), 3.11 (s, 3H), 2.59–2.46 (m, 2H), 2.56–2.49 (s, 1H), 2.21 (s, 1H).
3.3.6. Synthesis of 19
To a solution of compound 3 (1.0 equiv.) and Et3N (3.0 equiv.) in DCM in an ice bath, 2-chloroethanesulfonyl chloride (1.2 equiv.) diluted with DCM was slowly added. Next, the ice bath was removed and the reaction mixture was stirred at RT. Reaction progress was monitored by LC-MS. Then the reaction mixture was diluted with EtOAc, washed with 1M K2CO3, brine and dried over Na2SO4. The residue was purified using column flash chromatography (silica gel; EtOAc/MeOH) and lyophilized from dioxane to give the pure product 19 as a yellow solid with a yield of 64%.
ESI-MS for C22H26N2O6S (m/z): [M + H]+ 447, [2M + H]+ 893, [2M + Na]+ 915, [M-H]− 445.
1H NMR (500 MHz, (CD3)2SO) δ 8.26 (d, J = 7.5 Hz, 1H), 8.04 (s, 1H), 7.41 (s, 1H), 7.23 (d, J = 11.2 Hz, 1H), 6.71 (s, 1H), 6.64 (d, J = 11.5 Hz, 1H), 6.48 (dd, J = 16.4, 9.9 Hz, 1H), 5.71 (dd, J = 21.1, 13.1 Hz, 2H), 3.84–3.76 (m, 4H), 3.73 (s, 3H), 3.37 (s, 3H), 2.95 (s, 3H), 2.49 (s, 1H), 2.11–2.01 (m, 2H), 1.88–1.82 (m, 1H).
13C NMR (126 MHz, (CD3)2SO) δ 173.10, 155.58, 153.04, 150.65, 149.28, 141.12, 139.36, 137.66, 134.78, 128.80, 126.48, 125.64, 123.98, 108.88, 108.07, 61.19, 60.73, 56.26, 55.99, 38.70, 29.82.
3.3.7. Synthesis of 20
Compound 20 was obtained directly from compound 19. To 19 in DCM, morpholine was added in excess. Reaction progress was monitored by LC-MS. Then the mixture was diluted with EtOAc, washed with H2O, brine and dried over Na2SO4. The residue was purified using column flash chromatography (silica gel; DCM/MeOH) and subsequently lyophilized from dioxane to give the pure product 20 as a yellow solid with a yield of 63%.
ESI-MS for C26H35N3O7S (m/z): [M + H]+ 534, [2M + H]+ 1067, [M-H]− 532.
1H NMR (500 MHz, CDCl3) δ 7.72 (s, 1H), 7.43 (d, J = 11.2 Hz, 1H), 7.40–7.38 (m, 1H), 6.84–6.50 (m, 1H), 6.56 (d, J = 11.3 Hz, 1H), 6.53 (s, 1H), 4.48–4.35 (m, 1H), 3.93 (s, 3H), 3.90 (s, 3H), 3.63 (t, J = 4.5 Hz, 4H), 3.58 (s, 3H), 3.17–3.11 (m, 1H), 3.10 (d, J = 5.4 Hz, 3H), 3.07–2.99 (m, 1H), 2.83–2.76 (m, 1H), 2.75–2.69 (m, 1H), 2.51–2.33 (m, 7H), 1.99–1.91 (m, 1H).
13C NMR (126 MHz, CDCl3) δ 175.05, 155.45, 153.09, 150.89, 149.61, 141.54, 139.38, 134.35, 129.35, 129.06, 128.25, 126.38, 124.07, 108.00, 107.38, 61.37, 61.02, 56.09, 55.65, 53.37, 52.68, 51.08, 39.95, 30.38, 29.56.
3.4. Single Crystal X-ray Measurement
The single crystals of colchicine derivatives (6, 11, 12, 14, 15, 16, 18 and 19) were used for data collection on a four-circle KUMA KM4 diffractometer equipped with two-dimensional CCD area detector at room (295(1) K) and low temperature (100(1) K. The graphite monochromatized Mo-Kα radiation (λ = 0.71073 Å) and the ω-scan technique (Δω = 1°) were used for data collection. Lattice parameters were refined by the least-squares methods at all reflection positions. One image was monitored as a standard after every 40 images for a control of the crystal stability. Data collection and reduction along with absorption correction were performed using the CrysAlis software package [60]. The structures were solved by direct methods using SHELXT [61] giving positions of almost all non-hydrogen atoms. The structures were refined using SHELXL–2018 [62] with the anisotropic thermal displacement parameters. Hydrogen atoms were refined as rigid. Visualizations of the structures were made with the Diamond 3.0 program [63]. Details of the data collection parameters, crystallographic data and final agreement parameters are collected in Supplementary Table S1. The structures have been deposited with the Cambridge Crystallographic Data Center in the CIF format, no. CCDC 1980349–1980354 for 6, 11, 12, CCDC 1980341–1980344 for 14 and 15, CCDC 1980339–1980340 for 16 and CCDC 1980345–1980348 for 18 and 19 at 100 K and RT, respectively. Copies of this information can be obtained free of charge from The Director, CCDC, 12 Union Road, Cambridge, CB2 1EZ, UK (fax: +44 1223 336 033); email: deposit@ccdc.cam.ac.uk or www: http://www.ccdc.cam.ac.uk).
3.5. DFT Molecular Modeling
Molecular orbital calculations with full geometry optimization of colchicine derivatives (6, 11, 12, 14, 15, 16, 18 and 19) were performed with the Gaussian09 program package [52]. All calculations were carried out with the DFT level using the Becke3-Lee–Yang–Parr correlation functional (B3LYP) [53,54,55,56] with the 6–31+G basis set assuming the geometry resulting from the X-ray diffraction study as the starting structure. As convergence criteria, the threshold limits of 0.00025 and 0.0012 a.u. were applied for the maximum force and the displacement, respectively. The three-dimensional molecular electrostatic potential (3D MESP) maps are obtained on the basis of the DFT (B3LYP/6–31G) optimized. The calculated 3D MESP is mapped onto the total electron density isosurface (0.008 eÅ-3) for each molecule. The color code of MESP maps is in the range of −0.05 eÅ−1 (red) to +0.05 eÅ−1 (blue).
3.6. In Vitro Antiproliferative Activity
3.6.1. Cell Lines and Culturing Conditions
Four human cancer cell lines and one murine normal cell line were used to evaluate antiproliferative activity of colchicine and its derivatives 1–21: human lung adenocarcinoma (A549), human breast adenocarcinoma (MCF-7), human colon adenocarcinoma cell lines sensitive and resistant to doxorubicin (LoVo) and (LoVo/DX) respectively, and normal murine embryonic fibroblast cell line (BALB/3T3). The A549 cell line was purchased from the European Collection of Authenticated Cell Cultures (ECACC, Salisbury, UK). The MCF-7, LoVo and LoVo/DX cell lines was purchased from American Type Culture Collection (ATCC, Manassas, VA, USA). All the cell lines are maintained in the Institute of Immunology and Experimental Therapy (IIET), Wroclaw, Poland.
Human lung adenocarcinoma cell line was cultured in a mixture of OptiMEM and RPMI 1640 (1:1) medium (IIET, Wroclaw, Poland), supplemented with 5% fetal bovine serum HyClone (GE Healthcare, USA) and 2 mM L-glutamine (Sigma-Aldrich, Germany). Human breast adenocarcinoma cell line was cultured in a mixture of Eagle medium (IIET, Wroclaw, Poland), supplemented with 10% fetal bovine serum, 2 mM l-glutamine, 8 μg/mL insulin and 1% amino acids (Sigma-Aldrich, Germany). Human colon adenocarcinoma cell lines were cultured in a mixture of OptiMEM and RPMI 1640 (1:1) medium (IIET, Wroclaw, Poland), supplemented with 5% fetal bovine serum HyClone (GE Healthcare, USA), 2 mM l-glutamine, 1 mM sodium pyruvate (Sigma-Aldrich, Germany) and 10 μg/100 mL doxorubicin (Accord) for LoVo/DX. Murine embryonic fibroblast cells were cultured in Dulbecco medium (Gibco), supplemented with 10% fetal bovine serum (GE Healthcare, USA) and 2 mM L-glutamine (Sigma-Aldrich, Germany). All culture media contained antibiotics: 100 U/mL penicillin (Polfa-Tarchomin, Poland) and 0.1 mg/mL streptomycin (Sigma Aldrich, Germany). All cell lines were cultured during entire experiment in humid atmosphere at 37 °C and 5% CO2.
3.6.2. Cell Viability Assays
Twenty-four hours before adding the tested compounds, all cell lines were seeded in 96-well plates (Sarstedt, Germany) in appropriate media with 0.5 × 10⁴ cells per well for A549 cell line, 0.75 × 10⁴ cells per well for MCF-7 cell line and 1.0 × 10⁴ cells per well for LoVo, LoVo/DX and BALB/3T3 cell lines. All cell lines were exposed to each tested agent at different concentrations in the range 100–0.001 μg/mL for 72 h. The cells were also exposed to the reference drug cisplatin (Teva Pharmaceuticals, Poland) and doxorubicin (Accord Healthcare Limited, UK). Additionally, all cell lines were exposed to DMSO (solvent used for tested compounds) (POCh, Poland) at concentrations corresponding to those present in dilutions of tested agents. After 72 h sulforhodamine B assay (SRB) was performed [64].
SRB
After 72 h of incubation with the tested compounds, the cells were fixed in situ by gently adding of 50 μL per well of cold 50% trichloroacetic acid TCA (POCh, Poland) and were incubated at room temperature for one hour. Then the wells were washed four times with water and air dried. Next, 50 μL of 0.1% solution of sulforhodamine B (Sigma-Aldrich, Germany) in 1% acetic acid (POCh, Poland) were added to each well and were incubated at room temperature for 0.5 h. After incubation time, unbound dye was removed by washing plates four times with 1% acetic acid, whereas the stain bound to cells was solubilized with 150 μL of 10 mM Tris base (Sigma-Aldrich, Germany). Absorbance of each solution was read from a Synergy H4 Hybrid Multi-Mode Microplate Reader (BioTek Instruments, USA) at the 540 nm wavelength.
Results are presented as mean IC50 (concentration of the tested compound that inhibits cell proliferation by 50%) ± standard deviation. IC50 values were calculated in Cheburator 0.4, Dmitry Nevozhay software (version 1.2.0 software by Dmitry Nevozhay, 2004–2014, http://www.cheburator.nevozhay.com, freely available for each experiment [65]. Compounds at each concentration were tested in triplicates in a single experiment and each experiment was repeated at least three times independently. Results are summarized in Table 2.
3.7. Molecular Docking Studies
3.7.1. Ligand Preparation
The ligand structures were prepared using Ligprep from the Schrödinger suite [66]. Conformations and tautomeric states were assigned to the ligands by following the ligand preparation protocol implemented in Schrödinger suite with default settings. LigPrep generates variants of the same ligand with different tautomeric, stereochemical, and ionization properties.
3.7.2. Tubulin Model
The tubulin crystal structures available in the PDB are those for bovine protein. The bovine tubulin structure of tubulin (PDB ID: 1SA0) [67] was used as a template to construct the homology model of human αβ-tubulin isotypes (βI (UniProtKb: P07437), which is the most abundant isotype in most tumors using the Molecular Operating Environment (MOE) software package [68]. The sequence corresponding to the gene TUBA1A (UniProt ID: Q71U36) was chosen as a reference sequence for human tubulin, whereas gene TUBB associated to I isoform (UniProt ID: P07437) was chosen for human tubulin. Homology modeling was performed using MOE by setting the number of generated models to 10 and by selecting the final model based on MOE’s generalized Born/volume integral (GB/VI) scoring function. The models used in the simulations performed for the present study were developed earlier and described in our previous publications [69]. These earlier investigations can also be considered to be validations of the computational model employed here since they were directly compared to the corresponding experimental data.
3.7.3. Molecular Dynamics Simulations
The missing hydrogens for heavy atoms were added using the tLEAP module of AMBER 14 with the AMBER14SB force field [70]. The protonation states of all ionizable residues were determined at pH = 7 using the MOE program [68]. Each protein model was solvated in a 12 Å box of TIP3P water. In order to bring the salt concentration to the physiological value of 0.15 M, 93 Na+ ions and 57 Cl− ions were added. Minimization of the structure was carried out in two steps, using the steepest descent and conjugate gradient methods successively. At first, minimization was made in 2 ps on solvent atoms only, by restraining the protein-ligand complex. Next, minimization was run without the restraint in 10 ps. After minimization, the molecular dynamics (MD) simulations were carried out in three steps: heating, density equilibration, and production. At first, each solvated system was heated to 298 K for 50 ps, with weak restraints on all backbone atoms. Next, density equilibration was carried out for 50 ps of constant pressure equilibration at 298 K, with weak restraints. Finally, MD production runs were performed for all systems for 70 ns. The root-mean-square deviation (RMSD) of both the entire tubulin structure and the colchicine binding site were found to reach a plateau after 40 ns. Clustering analysis of the last 30 ns of the generated MD trajectory was carried out using the Amber’s CPPTRAJ program [71] to identify representative conformations of the tubulin dimer. Clustering was made via the hierarchical agglomerative approach using the RMSD of atoms in the colchicine binding site as a metric. An RMSD cutoff of 1.0 Å was set to differentiate the clusters. On the basis of the clustering analysis, three representative structures of the tubulin dimer were found. The docking was performed on all the three representative structures and the one with the highest docking score was selected, which was the largest cluster (about 70% of the simulation) conformation of the tubulin structure. During the modeling, the cofactors including GTP, GDP, colchicine, and the magnesium ion located at the interface between α–and β–monomers were kept as part of the environment and included in the refinement step.
3.7.4. Docking Simulations
We used the AutoDock Vina [72] program to predict the binding pose of the ligands under flexible ligand and rigid receptor conditions. Dockbox package was used to facilitate preparing docking inputs and post-processing of the docking results [73]. Docking simulations performed with a cubic box (size 30.0 Å) were centered at the center of binding pockets and the docking was run separately on tubulin structure. Every generated pose was energy-minimized using Amber14 by keeping the protein fixed and was re-scored using the MOE’s GBVI/WSA dG scoring function [68]. No constraints were applied in the docking studies. For each compound/protein-structure pair, the pose with the best score was identified and used as an initial configuration for molecular mechanics Gibbs–Boltzmann surface area MM/GBSA computations.
3.7.5. Binding Energy and Pairwise Per-Residue Free Energy Decomposition Calculations Using MM/GBSA Method
The MM/GBSA technique is used to calculate the free energy associated with the binding of double modified colchicine amides and sulfonamides [74]. This method combines molecular mechanics with continuum solvation models. We performed MM-GBSA integrated in Amber. The binding free energy is estimated as:
| (1) |
where G is the average free energy of the complex, protein, and ligand, are calculated according to the equation:
| (2) |
where EMM are determined with the SANDER program and represent the internal energy (bond, angle, and dihedral), van der Waals and electrostatic interactions (see Equation (3)). TS is the entropy contribution estimated using normal mode (nmode) analysis.
| (3) |
The solvation free energy can be calculated as the sum of polar and nonpolar contributions. The polar parts are obtained by using the generalized-born (GB) model—resulting in the MM/GBSA method, whereas the nonpolar terms are estimated from a linear relation (Equation (4)) to the solvent accessible surface area (SASA).
| (4) |
In the present study, a 2 ns-duration MD trajectory was run in TIP3P water using Amber14, for every top pose generated at the end of the docking step. It is worth noting that to assess the performance of MM/GBSA methodology [75], we evaluated the prediction accuracy of this method by various simulation protocols including 1 ns MD production calculations using PDBbind data set. Too long an MD simulation could be prejudicious for the overall success of the MM/GBSA method. According to this study and the common practice to calculate binding energies using MM/GBSA, we have decided to run MD production simulation for 2 ns. The MM/GBSA calculations were performed on a subset of 200 frames collected at regular time intervals from the trajectory. For PB calculations, an ionic strength of 0.0 nM (istrng = 0.0) and a solvent probe radius of 1.6 Å (prbrad = 1.6) were used. For GB calculations, the igb parameter was set to 5 that corresponds to a modified GB model equivalent to model II in reference. Pairwise free energy decomposition analysis was performed using the MM/GBSA decomposition process by the MM/GBSA program in AMBER 14 to compute the interaction between the inhibitors and each residue. For each of the tested compounds, the active residues estimated from MM/GBSA decomposition process and the best GB score out of the trajectories associated with the representative structures of the tubulin dimer were collected and are reported in Table 3 and Figure 4.
3.8. Calculation clogP
We used the Molinspiration online database (http://www.molinspiration.com, free of charge) to predict the clogP values for all synthesized compounds and collected them in Table 3 [76].
4. Conclusions
In an attempt to discover novel potent inhibitors of microtubule dynamics, eighteen novel double modified colchicine analogs comprising methylamine substituent at position C10 of ring C and amide or sulfonamide substituents at position C7 of ring B were successfully synthesized, purified and their structures were confirmed by spectroscopic analyses as well as X-ray measurements. Four human cancer cell lines (A549, MCF-7, LoVo, LoVo/DX) were used to evaluate the anticancer potency of all synthesized compounds.
Compared with unmodified colchicine, the majority of its studied derivatives exhibited excellent potency against A549, MCF-7, and LoVo cell lines. The antiproliferative activity of colchicine derivatives was in the nanomolar range and they also were characterized by lower IC50 values also than doxorubicin and cisplatin, commonly used as antitumor agents in cancer chemotherapy. The preliminary SAR revealed that the type of substituent at position C7 in ring B and the presence of –NHCH3 group at position C10 in ring C of colchicine 1 were of cardinal importance to the compounds’ cytotoxicity.
The calculated values of the selectivity index (SI) clearly show that it is possible to design more selective compounds than colchicine 1. The most active double-modified colchicine derivatives were the compounds that included chloroacetamide and dichloroacetamide (9, 10) and 2–chlorobenzamide (13) moiety (Table 2). However, in vitro tests showed that they did not have high SI values (except towards the LoVo cells) and in vivo testing should be carried out to determine their therapeutic potential. But of all tested compounds, 4,4,4-trifluorobutyric amide of 10-N-methylaminocolchicine 11 was the most prominent. Compound 11 showed high activity towards A549, MCF7 and LoVo cell lines, with antiproliferative IC50 values ranging between 10.4 and 14.6 nM as well as SI values higher than 5 for these three cell lines. The most selective towards MCF-7 cell line was compound 17 (SI was almost 10) and towards LoVo cell line the most selective were compounds 7, 9, 10, and 13 (SI were over 6). So we conclude that the appropriate modification of colchicine molecule and synthesis of its analogs might overcome the toxicity, which is a major challenge in designing a potential colchicine-based drug candidate.
Compound 11 was subsequently identified as the that with potentially the best therapeutic index and therefore the most promising candidate for further development, as it showed strong in vitro anticancer activities with high SI against three human cancer cell lines. However, further in vivo studies should be conducted for the successful development of this compound.
Molecular docking study showed the ability of the obtained colchicine derivatives to bind into the active sites of βI-tubulin isotype with the well-defined binding modes. It is worthy to mention that 10-N-methylaminocolchicine based compounds serve as useful templates for the further development of the anticancer and antimitotic agents. Further evaluation should help to find more detailed structure-activity relationships of microtubule-targeting drugs and CBS inhibitors, which can help in rational drug design in future.
Acknowledgments
Financial support by a grant No. 2016/21/B/ST5/00111 of the Polish National Science Centre (NCN) –is gratefully acknowledged. JAT gratefully acknowledges research support from NSERC and the Allard Foundation for his research.
Supplementary Materials
The following are available online, Table S1: Details of the data collection parameters, crystallographic data and the final agreement parameters. (for compounds 6, 11, 12, 14, 15, 16, 18 and 19); Table S2: Optimized parameters for colchicine derivatives (6, 11, 12, 14, 15, 16, 18 and 19), Figure S1: The LC-MS chromatogram and mass spectra of 2; Figure S2: The 1H NMR spectrum of 2 in CDCl3; Figure S3: The 13C NMR spectrum of 2 in CDCl3; Figure S4: The LC-MS chromatogram and mass spectra of 3; Figure S5: The 1H NMR spectrum of 3 in CDCl3; Figure S6: The 13C NMR spectrum of 3 in CDCl3; Figure S7: The LC-MS chromatogram and mass spectra of 4; Figure S8: The 1H NMR spectrum of 4 in CDCl3, Figure S9: The 13C NMR spectrum of 4 in CDCl3, Figure S10: The LC-MS chromatogram and mass spectra of 5; Figure S11: The 1H NMR spectrum of 5 in CDCl3, Figure S12: The 13C NMR spectrum of 5 in CDCl3; Figure S13: The LC-MS chromatogram and mass spectra of 6; Figure S14: The 1H NMR spectrum of 6 in CDCl3; Figure S15: The 13C NMR spectrum of 6 in CDCl3; Figure S16: The LC-MS chromatogram and mass spectra of 7; Figure S17: The 1H NMR spectrum of 7 in CDCl3; Figure S18: The 13C NMR spectrum of 7 in CDCl3; Figure S19: The LC-MS chromatogram and mass spectra of 8; Figure S20: The 1H NMR spectrum of 8 in CDCl3; Figure S21:. The 13C NMR spectrum of 8 in CDCl3; Figure S22: The LC-MS chromatogram and mass spectra of 9; Figure S23: The 1H NMR spectrum of 9 in CDCl3; Figure S24: The 13C NMR spectrum of 9 in CDCl3; Figure S25: The LC-MS chromatogram and mass spectra of 10; Figure S26: The 1H NMR spectrum of 10 in CDCl3; Figure S27: The 13C NMR spectrum of 10 in CDCl3; Figure S28. The LC-MS chromatogram and mass spectra of 11; Figure S29. The 1H NMR spectrum of 11 in CDCl3; Figure S30: The 13C NMR spectrum of 11 in CDCl3; Figure S31. The LC-MS chromatogram and mass spectra of 12; Figure S32: The 1H NMR spectrum of 12 in CDCl3; Figure S33: The 13C NMR spectrum of 12 in CDCl3; Figure S34: The LC-MS chromatogram and mass spectra of 13; Figure S35: The 1H NMR spectrum of 13 in CD2Cl2; Figure S36: The 13C NMR spectrum of 13 in CD2Cl2. Figure S37: The LC-MS chromatogram and mass spectra of 14; Figure S38: The 1H NMR spectrum of 14 in CDCl3; Figure S39: The 13C NMR spectrum of 14 in CDCl3; Figure S40: The LC-MS chromatogram and mass spectra of 15; Figure S41: The 1H NMR spectrum of 15 in CDCl3; Figure S42: The 13C NMR spectrum of 15 in CDCl3; Figure S43: The LC-MS chromatogram and mass spectra of 16; Figure S44: The 1H NMR spectrum of 16 in CDCl3. Figure S45: The 13C NMR spectrum of 16 in CDCl3; Figure S46: The LC-MS chromatogram and mass spectra of 17; Figure S47: The 1H NMR spectrum of 17 in CDCl3; Figure S48: The LC-MS chromatogram and mass spectra of 18;Figure S49: The 1H NMR spectrum of 18 in CDCl3; Figure S50: The 13C NMR spectrum of 18 in CDCl3; Figure S51: The LC-MS chromatogram and mass spectra of 19; Figure S52: The 1H NMR spectrum of 19 in (CD3)2SO; Figure S53: The 13C NMR spectrum of 19 in (CD3)2SO; Figure S54: The LC-MS chromatogram and mass spectra of 20; Figure S55: The 1H NMR spectrum of 20 in CDCl3. Figure S56: The 13C NMR spectrum of 20 in CDCl3; Figure S57: The LC-MS chromatogram and mass spectra of 21; Figure S58: The 1H NMR spectrum of 21 in CDCl3. Figure S59: The 13C NMR spectrum of 21 in CDCl3; Figure S60: Molecular structure of colchicine derivatives (6, 11, 12, 14, 15, 16, 18 and 19) at 295 K and 100 K.
Author Contributions
Conceptualization, J.K., and A.H.; methodology, J.K., A.H., J.J., J.W. and J.A.T.; software, J.J.; M.A.; validation, A.H., J.A.T. and J.J.; formal analysis, A.H. and J.K.; investigation, J.K., E.M., J.J. and M.A; resources, A.H.; J.K. and W.M.; data curation, J.K., M.A. and E.M.; writing—original draft preparation, J.K., J.J. and M.A.; writing—review and editing, W.M., A.H. J.W. and J.A.T.; visualization, J.K., J.J. and M.A.; supervision, A.H.; project administration, A.H.; funding acquisition, A.H. and W.M. All authors have read and agreed to the published version of the manuscript.
Conflicts of Interest
The authors declare no conflict of interest.
Footnotes
Sample Availability: Not available
References
- 1.Amos L.A. Microtubule structure and its stabilisation. Org. Biomol. Chem. 2004;2:2153–2160. doi: 10.1039/b403634d. [DOI] [PubMed] [Google Scholar]
- 2.Wade R.H. On and around microtubules: An overview. Mol. Biotechnol. 2009;43:177–191. doi: 10.1007/s12033-009-9193-5. [DOI] [PubMed] [Google Scholar]
- 3.Hawkins T., Mirigian M., Selcuk Yasar M., Ross J.L. Mechanics of microtubules. J. Biomech. 2010;43:23–30. doi: 10.1016/j.jbiomech.2009.09.005. [DOI] [PubMed] [Google Scholar]
- 4.Wittmann T., Hyman A., Desai A. The spindle: A dynamic assembly of microtubules and motors. Nat. Cell Biol. 2001;3 doi: 10.1038/35050669. [DOI] [PubMed] [Google Scholar]
- 5.Jordan M.A., Wilson L. Microtubules and actin filaments: Dynamic targets for cancer chemotherapy. Curr. Opin. Cell Biol. 1998;10:123–130. doi: 10.1016/S0955-0674(98)80095-1. [DOI] [PubMed] [Google Scholar]
- 6.Pellegrini F., Budman D.R. Review: Tubulin function, action of antitubulin drugs, and new drug development. Cancer Invest. 2005;23:264–273. doi: 10.1081/CNV-200055970. [DOI] [PubMed] [Google Scholar]
- 7.Kumar B., Kumar R., Skvortsova I., Kumar V. Mechanisms of Tubulin Binding Ligands to Target Cancer Cells: Updates on their Therapeutic Potential and Clinical Trials. Curr. Cancer Drug Targets. 2016;17:357–375. doi: 10.2174/1568009616666160928110818. [DOI] [PubMed] [Google Scholar]
- 8.Capraro H.G., Brossi A. Chapter 1 Tropolonic Colchicum Alkaloids. Alkaloids Chem. Pharmacol. 1984;23:1–70. [Google Scholar]
- 9.Boyé O., Brossi A. Tropolonic Colchicum Alkaloids and Allo Congeners. Alkaloids Chem. Pharmacol. 1992;41:125–176. [Google Scholar]
- 10.Hastie S.B. Interactions of colchicine with tubulin. Pharmacol. Ther. 1991;51:377–401. doi: 10.1016/0163-7258(91)90067-V. [DOI] [PubMed] [Google Scholar]
- 11.Sapra S., Bhalla Y., Nandani Sharma S., Singh G., Nepali K., Budhiraja A., Dhar K.L. Colchicine and its various physicochemical and biological aspects. Med. Chem. Res. 2013;22:531–547. doi: 10.1007/s00044-012-0077-z. [DOI] [Google Scholar]
- 12.Skoufias D.A., Wilson L. Mechanism of Inhibition of Microtubule Polymerization by Colchicine: Inhibitory Potencies of Unliganded Colchicine and Tubulin-Colchicine Complexes. Biochemistry. 1992;31:738–746. doi: 10.1021/bi00118a015. [DOI] [PubMed] [Google Scholar]
- 13.Bhattacharyya B., Panda D., Gupta S., Banerjee M. Anti-mitotic activity of colchicine and the structural basis for its interaction with tubulin. Med. Res. Rev. 2008;28:155–183. doi: 10.1002/med.20097. [DOI] [PubMed] [Google Scholar]
- 14.Ravelli R.B.G., Gigant B., Curmi P.A., Jourdain I., Lachkar S., Sobel A., Knossow M. Insight into tubulin regulation from a complex with colchicine and a stathmin-like domain. Nature. 2004;428:198–202. doi: 10.1038/nature02393. [DOI] [PubMed] [Google Scholar]
- 15.Wiesenfeld P.L., Garthoff L.H., Sobotka T.J., Suagee J.K., Barton C.N. Acute oral toxicity of colchicine in rats: Effects of gender, vehicle matrix and pre-exposure to lipopolysaccharide. J. Appl. Toxicol. 2007;27:421–433. doi: 10.1002/jat.1198. [DOI] [PubMed] [Google Scholar]
- 16.Spiller H.A. Colchicine. In: Wexler P., editor. Encyclopedia of Toxicology. 3rd ed. Elsevier Inc.; London, UK: 2014. pp. 1007–1008. [Google Scholar]
- 17.Roubille F., Kritikou E., Busseuil D., Barrere-Lemaire S., Tardif J.-C. Colchicine: An Old Wine in a New Bottle? Antiinflamm. Antiallergy. Agents Med. Chem. 2013;12:14–23. doi: 10.2174/1871523011312010004. [DOI] [PubMed] [Google Scholar]
- 18.Mendis S. Colchicine cardiotoxicity following ingestion of Gloriosa superba tubers. Postgrad. Med. J. 1989;65:752–755. doi: 10.1136/pgmj.65.768.752. [DOI] [PMC free article] [PubMed] [Google Scholar]
- 19.Margolis R.L., Wilson L. Addition of colchicine tubulin complex to microtubule ends: The mechanism of substoichiometric colchicine poisoning. Proc. Natl. Acad. Sci. USA. 1977;74:3466–3470. doi: 10.1073/pnas.74.8.3466. [DOI] [PMC free article] [PubMed] [Google Scholar]
- 20.Kuncl R.W., Duncan G., Watson D., Alderson K., Rogawski M.A., Peper M. Colchicine Myopathy and Neuropathy. N. Engl. J. Med. 1987;316:1562–1568. doi: 10.1056/NEJM198706183162502. [DOI] [PubMed] [Google Scholar]
- 21.Finkelstein Y., Aks S.E., Hutson J.R., Juurlink D.N., Nguyen P., Dubnov-Raz G., Pollak U., Koren G., Bentur Y. Colchicine poisoning: The dark side of an ancient drug. Clin. Toxicol. 2010;48:407–414. doi: 10.3109/15563650.2010.495348. [DOI] [PubMed] [Google Scholar]
- 22.Cocco G., Chu D.C.C., Pandolfi S. Colchicine in clinical medicine. A guide for internists. Eur. J. Intern. Med. 2010;21:503–508. doi: 10.1016/j.ejim.2010.09.010. [DOI] [PubMed] [Google Scholar]
- 23.Zemer D., Revach M., Pras M., Modan B., Schor S., Sohar E., Gafni J. A Controlled Trial of Colchicine in Preventing Attacks of Familial Mediterranean Fever. N. Engl. J. Med. 1974;291:932–934. doi: 10.1056/NEJM197410312911803. [DOI] [PubMed] [Google Scholar]
- 24.Cerquaglia C., Diaco M., Nucera G., La Regina M., Montalto M., Manna R. Pharmacological and clinical basis of treatment of Familial Mediterranean Fever (FMF) with colchicine or analogues: An update. Curr. Drug Targets Inflamm. Allergy. 2005;4:117–124. doi: 10.2174/1568010053622984. [DOI] [PubMed] [Google Scholar]
- 25.Masuda K., Urayama A., Kogure M., Nakajima A., Nakae K., Inaba G. Double-masked trial of cyclosporin versus colchicine and long-term open study of cyclosporin in Behçet’s disease. Lancet. 1989;333:1093–1096. doi: 10.1016/S0140-6736(89)92381-7. [DOI] [PubMed] [Google Scholar]
- 26.Keith M.P., Gilliland W.R. Updates in the Management of Gout. Am. J. Med. 2007;120:221–224. doi: 10.1016/j.amjmed.2006.02.044. [DOI] [PubMed] [Google Scholar]
- 27.Hitzeman N., Stephens R. Colchicine for acute gout. Am. Fam. Physician. 2015;91:759–760. [PubMed] [Google Scholar]
- 28.Kerekes P., Sharma P.N., Brossi A., Chignell C.F., Quinn F.R. Synthesis and Biological Effects of Novel Thiocolchicines. 3. Evaluation of N-Acyldeacetylthiocolchicines, N-(Alkoxycarbonyl)deacetylthiocolchicines, and O-Ethyldemethylthiocolchicines. New Synthesis of Thiodemecolcine and Antileukemic Effects of 2-Demeth. J. Med. Chem. 1985;28:1204–1208. doi: 10.1021/jm00147a014. [DOI] [PubMed] [Google Scholar]
- 29.Sun L., Hamel E., Lin C.M., Hastie S.B., Pyluck A., Lee K.H. Antitumor Agents. 141. Synthesis and Biological Evaluation of Novel Thiocolchicine Analogs: N-Acyl-, N-Aroyl-, and N-(Substituted benzyl)deacetylthiocolchicines as Potent Cytotoxic and Antimitotic Compounds. J. Med. Chem. 1993;36:1474–1479. doi: 10.1021/jm00062a021. [DOI] [PubMed] [Google Scholar]
- 30.Majcher U., Urbaniak A., Maj E., Moshari M., Delgado M., Wietrzyk J., Bartl F., Chambers T.C., Tuszynski J.A., Huczyński A. Synthesis, antiproliferative activity and molecular docking of thiocolchicine urethanes. Bioorg. Chem. 2018;81:553–566. doi: 10.1016/j.bioorg.2018.09.004. [DOI] [PubMed] [Google Scholar]
- 31.Marzo-Mas A., Falomir E., Murga J., Carda M., Marco J.A. Effects on tubulin polymerization and down-regulation of c-Myc, hTERT and VEGF genes by colchicine haloacetyl and haloaroyl derivatives. Eur. J. Med. Chem. 2018;150:591–600. doi: 10.1016/j.ejmech.2018.03.019. [DOI] [PubMed] [Google Scholar]
- 32.Shen L.H., Li H.Y., Shang H.X., Tian S.T., Lai Y.S., Liu L.J. Synthesis and cytotoxic evaluation of new colchicine derivatives bearing 1,3,4-thiadiazole moieties. Chinese Chem. Lett. 2013;24:299–302. doi: 10.1016/j.cclet.2013.01.052. [DOI] [Google Scholar]
- 33.Shen L.H., Li Y., Zhang D.H., Lai Y.S., Liu L.J. Synthesis and evaluation of nitrate derivatives of colchicine as anticancer agents. Chinese Chem. Lett. 2011;22:768–770. doi: 10.1016/j.cclet.2010.12.037. [DOI] [Google Scholar]
- 34.Shen L.H., Wang S.L., Li H.Y., Lai Y.S., Liu L.J. Synthesis and bioactivity of furoxan-based nitric oxide-releasing colchicine derivatives as anticancer agents. Asian, J. Chem. 2013;25:3294–3296. doi: 10.14233/ajchem.2013.13635. [DOI] [Google Scholar]
- 35.Kim S.K., Cho S.M., Kim H., Seok H., Kim S.O., Kwon T.K., Chang J.S. The colchicine derivative CT20126 shows a novel microtubule-modulating activity with apoptosis. Exp. Mol. Med. 2013;45:e19-e7. doi: 10.1038/emm.2013.38. [DOI] [PMC free article] [PubMed] [Google Scholar]
- 36.Lee S.H., Park S.K., Kim J.M., Kim M.H., Kim K.H., Chun K.W., Cho K.H., Youn J.Y., Namgoong S.K. New synthetic thiocolchicine derivatives as low-toxic anticancer agents. Arch. Pharm. (Weinheim) 2005;338:582–589. doi: 10.1002/ardp.200500148. [DOI] [PubMed] [Google Scholar]
- 37.Saeedi M., Goli F., Mahdavi M., Dehghan G., Faramarzi M.A., Foroumadi A., Shafiee A. Synthesis and biological investigation of some novel sulfonamide and amide derivatives containing coumarin moieties. Iran. J. Pharm. Res. 2014;13:881–892. [PMC free article] [PubMed] [Google Scholar]
- 38.Ashraf Z., Mahmood T., Hassan M., Afzal S., Rafique H., Afzal K., Latip J. Dexibuprofen amide derivatives as potential anticancer agents: Synthesis, in silico docking, bioevaluation, and molecular dynamic simulation. Drug Des. Devel. Ther. 2019;13:1643–1657. doi: 10.2147/DDDT.S178595. [DOI] [PMC free article] [PubMed] [Google Scholar]
- 39.Ragha Suma V., Sreenivasulu R., Subramanyam M., Rao K.R.M. Design, Synthesis, and Anticancer Activity of Amide Derivatives of Structurally Modified Combretastatin-A4. Russ. J. Gen. Chem. 2019;89:499–504. doi: 10.1134/S1070363219030228. [DOI] [Google Scholar]
- 40.Kachaeva M.V., Hodyna D.M., Semenyuta I.V., Pilyo S.G., Prokopenko V.M., Kovalishyn V.V., Metelytsia L.O., Brovarets V.S. Design, synthesis and evaluation of novel sulfonamides as potential anticancer agents. Comput. Biol. Chem. 2018;74:294–303. doi: 10.1016/j.compbiolchem.2018.04.006. [DOI] [PubMed] [Google Scholar]
- 41.Gul H.I., Yamali C., Sakagami H., Angeli A., Leitans J., Kazaks A., Tars K., Ozgun D.O., Supuran C.T. New anticancer drug candidates sulfonamides as selective hCA IX or hCA XII inhibitors. Bioorg. Chem. 2018;77:411–419. doi: 10.1016/j.bioorg.2018.01.021. [DOI] [PubMed] [Google Scholar]
- 42.Kiyoshi A. N-methyldeacetylcolchiceinamide. EP0607647(A1) Patent. 1994 Jul 27
- 43.Winum J.Y., Toupet L., Barragan V., Dewynter G., Montero J.L. N-(tert-Butoxycarbonyl)-N-[4-(dimethylazaniumylidene)-1,4-dihydropyridin-1-ylsulfonyl]azanide: A new sulfamoylating agent. Structure and reactivity toward amines. Org. Lett. 2001;3:2241–2243. doi: 10.1021/ol010155r. [DOI] [PubMed] [Google Scholar]
- 44.Al-Riyami L., Pineda M.A., Rzepecka J., Huggan J.K., Khalaf A.I., Suckling C.J., Scott F.J., Rodgers D.T., Harnett M.M., Harnett W. Designing anti-inflammatory drugs from parasitic worms: A synthetic small molecule analogue of the acanthocheilonema viteae product ES-62 prevents development of collagen-induced arthritis. J. Med. Chem. 2013;56:9982–10002. doi: 10.1021/jm401251p. [DOI] [PMC free article] [PubMed] [Google Scholar]
- 45.Cruz C.M., Ortega-Muñoz M., López-Jaramillo F.J., Hernández-Mateo F., Blanco V., Santoyo-González F. Vinyl Sulfonates: A Click Function for Coupling-and-Decoupling Chemistry and their Applications. Adv. Synth. Catal. 2016;358:3394–3413. doi: 10.1002/adsc.201600628. [DOI] [Google Scholar]
- 46.Lessinger L., Margulis T.N. The crystal structure of colchicine. A new application of magic integers to multiple-solution direct methods. Acta Crystallogr. Sect. B Struct. Crystallogr. Cryst. Chem. 1978;34:578–584. doi: 10.1107/S0567740878003568. [DOI] [Google Scholar]
- 47.McClure W.O., Paulson J.C. The interaction of colchicine and some related alkaloids with rat brain tubulin. Mol. Pharmacol. 1977;13:560–575. [PubMed] [Google Scholar]
- 48.Hastie S.B., Williams R.C., Puett D., Macdonald T.L. The binding of isocolchicine to tubulin. Mechanisms of ligand association with tubulin. J. Biol. Chem. 1989;264:6682–6688. [PubMed] [Google Scholar]
- 49.Politzer P., Laurence P.R., Jayasuriya K. Molecular electrostatic potentials: An effective tool for the elucidation of biochemical phenomena. Environ. Health Perspect. 1985;61:191–202. doi: 10.1289/ehp.8561191. [DOI] [PMC free article] [PubMed] [Google Scholar]
- 50.Chemical Applications of Atomic and Molecular Electrostatic Potentials. [(accessed on 13 April 2020)]; Available online: https://www.springer.com/gp/book/9780306406577.
- 51.Murray J.S., Politzer P. The electrostatic potential: An overview. Wiley Interdiscip. Rev. Comput. Mol. Sci. 2011;1:153–163. doi: 10.1002/wcms.19. [DOI] [Google Scholar]
- 52.Frisch M.J., Trucks G.W., Schlegel H.B., Scuseria G.E., Robb M.A., Cheeseman J.R., Scalmani G., Barone V., Mennucci B., Petersson G.A., et al. Gaussian 09, Revision E.01. Gaussian, Inc; Wallingford, CT, USA: 2013. [Google Scholar]
- 53.Becke A.D. Density-functional thermochemistry. IV. A new dynamical correlation functional and implications for exact-exchange mixing. J. Chem. Phys. 1996;104:1040–1046. doi: 10.1063/1.470829. [DOI] [Google Scholar]
- 54.Lee C., Yang W., Parr R.G. Development of the Colle-Salvetti correlation-energy formula into a functional of the electron density. Phys. Rev. B. 1988;37:785–789. doi: 10.1103/PhysRevB.37.785. [DOI] [PubMed] [Google Scholar]
- 55.Patterson J.D. Density-functional theory of atoms and molecules. Ann. Nucl. Energy. 1989;16:611. doi: 10.1016/0306-4549(89)90016-9. [DOI] [Google Scholar]
- 56.Bai R., Pei X.F., Boyé O., Getahun Z., Grover S., Bekisz J., Nguyen N.Y., Brossi A., Hamel E. Identification of cysteine 354 of β-tubulin as part of the binding site for the a ring of colchicine. J. Biol. Chem. 1996;271:12639–12645. doi: 10.1074/jbc.271.21.12639. [DOI] [PubMed] [Google Scholar]
- 57.Chaudhuri A.R., Seetharamalu P., Schwarz P.M., Hausheer F.H., Ludueña R.F. The interaction of the B-ring of colchicine with α-Tubulin: A novel footprinting approach. J. Mol. Biol. 2000;303:679–692. doi: 10.1006/jmbi.2000.4156. [DOI] [PubMed] [Google Scholar]
- 58.Cheung C.H.A., Wu S.Y., Lee T.R., Chang C.Y., Wu J.S., Hsieh H.P., Chang J.Y. Cancer cells acquire mitotic drug resistance properties through beta i-tubulin mutations and alterations in the expression of beta-tubulin isotypes. PLoS ONE. 2010;5:1–11. doi: 10.1371/journal.pone.0012564. [DOI] [PMC free article] [PubMed] [Google Scholar]
- 59.Ravanbakhsh S., Gajewski M., Greiner R., Tuszynski J.A. Determination of the optimal tubulin isotype target as a method for the development of individualized cancer chemotherapy. Theor. Biol. Med. Model. 2013 doi: 10.1186/1742-4682-10-29. [DOI] [PMC free article] [PubMed] [Google Scholar]
- 60.CrysAlis CCD and CrysAlis RED, version 1171.32.15. Oxford Diffraction Ltd; Abingdon, Oxford, UK: 2009. [Google Scholar]
- 61.Sheldrick G.M. SHELXT-Integrated space-group and crystal-structure determination. Acta Crystallogr. Sect. A Found. Crystallogr. 2015;71:3–8. doi: 10.1107/S2053273314026370. [DOI] [PMC free article] [PubMed] [Google Scholar]
- 62.Sheldrick G.M. Crystal structure refinement with SHELXL. Acta Crystallogr. Sect. C Struct. Chem. 2015;71:3–8. doi: 10.1107/S2053229614024218. [DOI] [PMC free article] [PubMed] [Google Scholar]
- 63.Brandenburg K., Putz H. DIAMOND. Crystal Impact GbR; Bonn, Germany: 2006. [Google Scholar]
- 64.Skehan P., Storeng R., Scudiero D., Monks A., Mcmahon J., Vistica D., Warren J.T., Bokesch H., Kenney S., Boyd M.R. New colorimetric cytotoxicity assay for anticancer-drug screening. J. Natl. Cancer Inst. 1990;82:1107–1112. doi: 10.1093/jnci/82.13.1107. [DOI] [PubMed] [Google Scholar]
- 65.Nevozhay D. Cheburator software for automatically calculating drug inhibitory concentrations from in vitroscreening assays. PLoS ONE. 2014;9:e106186. doi: 10.1371/journal.pone.0106186. [DOI] [PMC free article] [PubMed] [Google Scholar]
- 66.Schrödinger Schrödinger Release 2019–4: LigPrep. [(accessed on 13 April 2020)];2019 Available online: https://www.schrodinger.com/ligprep.
- 67.Löwe J., Li H., Downing K.H., Nogales E. Refined structure of αβ-tubulin at 3.5 Å resolution. J. Mol. Biol. 2001;313:1045–1057. doi: 10.1006/jmbi.2001.5077. [DOI] [PubMed] [Google Scholar]
- 68.Molecular Operating Environment (MOE) Chemical Computing Group Inc; Montreal, QC, Canada: 2012. [Google Scholar]
- 69.Klejborowska G., Urbaniak A., Maj E., Preto J., Moshari M., Wietrzyk J., Tuszynski J.A., Chambers T.C., Huczyński A. Synthesis, biological evaluation and molecular docking studies of new amides of 4-chlorothiocolchicine as anticancer agents. Bioorg. Chem. 2020;97 doi: 10.1016/j.bioorg.2020.103664. [DOI] [PubMed] [Google Scholar]
- 70.Case D., Babin V., Berryman J., Betz R., Cai Q., Cerutti D., Cheatham T., III, Darden T., Duke R., Gohlke H., et al. Amber 14. University of California; San Francisco, CA, USA: 2014. [Google Scholar]
- 71.Roe D.R., Cheatham T.E. PTRAJ and CPPTRAJ: Software for processing and analysis of molecular dynamics trajectory data. J. Chem. Theory Comput. 2013;9:3084–3095. doi: 10.1021/ct400341p. [DOI] [PubMed] [Google Scholar]
- 72.Trott O., Olson A.J. Software news and update AutoDock Vina: Improving the speed and accuracy of docking with a new scoring function, efficient optimization, and multithreading. J. Comput. Chem. 2010;31:455–461. doi: 10.1002/jcc.21334. [DOI] [PMC free article] [PubMed] [Google Scholar]
- 73.Preto J., Gentile F. Assessing and improving the performance of consensus docking strategies using the DockBox package. J. Comput. Aided. Mol. Des. 2019;33:817–829. doi: 10.1007/s10822-019-00227-7. [DOI] [PubMed] [Google Scholar]
- 74.Hou T., Wang J., Li Y., Wang W. Assessing the performance of the MM/PBSA and MM/GBSA methods. 1. The accuracy of binding free energy calculations based on molecular dynamics simulations. J. Chem. Inf. Model. 2011;51:69–82. doi: 10.1021/ci100275a. [DOI] [PMC free article] [PubMed] [Google Scholar]
- 75.Sun H., Duan L., Chen F., Liu H., Wang Z., Pan P., Zhu F., Zhang J.Z.H., Hou T. Assessing the performance of MM/PBSA and MM/GBSA methods. 7. Entropy effects on the performance of end-point binding free energy calculation approaches. Phys. Chem. Chem. Phys. 2018;20:14450–14460. doi: 10.1039/C7CP07623A. [DOI] [PubMed] [Google Scholar]
- 76.Molinspiration Property Calculation Service. [(accessed on 3 April 2020)]; Available online: http://www.molinspiration.com.
Associated Data
This section collects any data citations, data availability statements, or supplementary materials included in this article.


