Abstract
Introduction
The habenular nucleus (Hb), a famous relay station in the midbrain, is vital for controlling many physiological functions of vertebrates. The role of Hb in the pathogenesis of depression has been thoroughly studied, but whether it functions in the pathogenesis of diabetes remains unknown. In this study, we found that Hb lesions could improve glucose metabolism in type 2 diabetes mellitus (T2DM) by inhibiting the peripheral sympathetic nervous system and hepatic glucose production.
Research design and methods
T2DM rats were induced by a high-carbohydrate and fat diet combined with streptozotocin. Electrical lesion method was applied to suppress the function of Hb. Serum and tissue samples of rats in the control group, T2DM group, sham group, and Hb lesion group were detected by ELISA, western blotting, and biochemical methods.
Results
Compared with the sham group, the expression levels of AMPK phosphorylation and insulin receptor (IR) were significantly increased, whereas glucose-6-phosphatase and phosphoenolpyruvate carboxylated kinase were reduced in the liver of the Hb lesion group. In the glucose tolerance test and pyruvate tolerance test, the lesion group showed stronger glucose tolerance and lower hepatic gluconeogenesis than the sham. These results suggest that Hb lesions not only effectively increase insulin sensitivity and improve insulin resistance but also inhibit gluconeogenesis in T2DM rats. Moreover, Hb lesions increase the expression of brain-derived neurotrophic factor, tropomyosin receptor kinase B, glucocorticoid receptor, and IR in the hippocampus. In this study, we also found that Hb lesions increase the content of acetylcholine in the adrenal glands and reduce the content of epinephrine in both the adrenal glands and the liver, which may be the main reason for the Hb lesions to regulate glucose metabolism in the liver.
Conclusion
Hb is an important neuroanatomical target for the regulation of glucose metabolism in the central nervous system of diabetic rats.
Keywords: type 2 diabetes, insulin resistance, gluconeogenesis, central nervous system
Significance of this study.
What is already known about this subject?
The critical role of habenular nucleus (Hb) in the pathogenesis of depression is already known.
What are the new findings?
In this study, we found that Hb has an essential role in regulating glucose metabolism, especially in improving the regulation of glucose metabolism in type 2 diabetes mellitus (T2DM) rats.
Hb lesions improve hippocampal function in T2DM rats by upregulating brain-derived neurotrophic factor, glucocorticoid receptor, and insulin receptor.
Hb lesions improve glucose metabolism disorders in T2DM rats by inhibiting the peripheral sympathetic system.
How might these results change the focus of research or clinical practice?
These results provide a new and reliable experimental basis for the central neuropathological mechanism of diabetes. It also suggests new ideas for the clinical treatment of T2DM.
Introduction
The habenula nucleus (Hb) is a small area in the epithalamus that is highly conserved across vertebrates1 and has been suggested to play essential roles in the development of depressive disorder.2 Although several studies have shown that diabetes and depression have many similarities in etiology and pathophysiology,3–5 especially in the central nervous system (CNS), the hippocampus, and the hypothalamic–pituitary–adrenal (HPA) axis,3 6 indicating a pathological connection between diabetes and depression, little is known regarding the role of Hb in the pathophysiology of depression contributing to the development of diabetes.
The Hb can be divided into two regions: the small medial region and the larger lateral region. These two areas significantly differ from other regions of the brain in their neuroanatomical connections. The medial Hb mainly receives input from the medial and lateral septal nuclei, and its output is almost entirely projected to the interpeduncular nucleus of the midbrain. On the other hand, the lateral Hb is the hub of various structures in the brain, including the septum, hypothalamus, basal forebrain, globus pallidus, and prefrontal cortex, as well as the dopaminergic, serotonergic and noradrenergic systems.1 As increasing attention has been focused on understanding the functions of Hb, neuroscientists have observed that changes in the activity of Hb play a vital role in the pathologies of several diseases, including mood,7 addiction,8 cardiovascular disorder,9 10 and respiratory diseases.11 Previously, Paulson et al have observed changes in the activity of Hb in streptozotocin (STZ)-induced hyperglycemic rats.12 Meanwhile, we have reported that the excessive enhancement of neuronal activity in the lateral Hb is an essential factor for inducing depression.13 However, the mechanisms of Hb in the pathogenesis of diabetes is still poorly understood.
In this study, we used type 2 diabetes mellitus (T2DM) rats, induced by a high-carbohydrate and fat diet (HCFD) combined with STZ, to study the functions of Hb in the hippocampus and liver. Using electrically induced ablation of Hb, we observed that Hb plays a vital role in regulating insulin sensitivity and glucose metabolism in the liver of T2DM rats. Hence, Hb lesions improved glucose metabolism in T2DM rats by increasing insulin sensitivity and inhibiting hepatic gluconeogenesis.
Materials and methods
Reagents
Primary antibodies against 5′ AMP-activated protein kinase (AMPK) (#5831), phosphorylated AMP-activated protein kinase (#2535), Akt (#4691) P-Akt (#4060) and antirabbit IgG (#7074) were purchased from Cell Signaling Technology (Beverly, Massachusetts, USA). Primary antibodies against brain-derived neurotrophic factor (BDNF) (ab108319), tropomyosin receptor kinase B (TrkB) (ab214185), insulin receptor (IR) (ab5500), glucocorticoid receptor (ab183127), and actin (ab115777) were purchased from Abcam (Cambridge, UK). The eECL western blot kit (CW0049) was obtained from Cwbio (Beijing, China). BeyoColor Prestained Color Protein Marker (P0077) was supplied by Beyotime (Nantong, China). Radio-Immunoprecipitation Assay (RIPA) buffer (PC0010), bicinchoninic acid (BCA) protein assay kit (PC0020), and other chemicals for western blotting were obtained from Solarbio (Beijing, China). The glucose assay kit was purchased from Robio Co. (Shanghai, China). Rat fast serum insulin (INS) ELISA Kit was procured from Elabscience Biotechnology Co. (Wuhan, China). STZ (552201) was obtained from Sigma (USA).
Animals
Male Sprague Dawley rats were purchased from the Laboratory Animal Services Center (Dalian Medical University, Dalian, China). The animals were housed, five per cage and provided with food and water ad libitum, on a 12-hour light/dark cycle with lights on at 06:00 hours and controlled (22°C–23°C) temperature. They were acclimated for 7 days before experimentation. Rats weighing between 270 and 320 g at the time of surgery were used. All animals were cared for and used following the National Institutes of Health guidelines for the care and use of experimental animals, and all procedures were approved by the Animal Care and Use Committee of the Dalian University.
T2DM model
After 1 week of adaptation, the rats were started on an HCFD. Two weeks later, T2DM was induced by administering an intravenous injection of low-dose STZ (35 mg/kg). STZ was dissolved in 0.1 M sodium citrate buffer with the pH adjusted at 4.5. Four weeks later, rats presenting blood glucose levels higher than 11.1 mmol/L14 were considered diabetic. The rats could continue to feed on HCFD until the end of the experiments.
Bilateral electrical lesions of the lateral Hb
After the successful induction of the T2DM rat model, the T2DM-lesioned rats received a direct current delivery of 0.5 mA for 10 s through an electrode inserted into the right Hb (Anterior-Posterior of bregma : −3.6 to −3.8 mm, lateral to the midline: 0.6–0.9 mm, ventral to the dural: 4.2–4.6 mm relative to bregma)15 and similarly into the left Hb. For sham-lesioned rats, the electrode was inserted at the same coordinates for the same time period, but no current was passed. After surgery, rats were allowed to recover for 1 week before the experiments.
Oral glucose tolerance test (OGTT) and pyruvate tolerance test (PTT)
For OGTT, 16-hour-fasted rats were administered glucose (1 g/kg from 50% glucose solution); for PTT, 16-hour-fasted rats received anintraperitoneal injection of sodium pyruvate (1 g/kg from a 20% pyruvate solution). For measuring blood glucose, blood samples were collected using the tail vein at 0, 15, 30, 60, 90, and 120 min postadministration or injection using a blood glucose monitor (Bioland, Shenzhen).
Western blotting
The Hb and hippocampus were lysed in RIPA lysis buffer containing protease inhibitor cocktail for 30 min on ice. Insoluble fractions were removed by centrifugation at 12 000 rpm (4°C) for 30 min and denatured by boiling in the loading buffer. Samples containing 60 µg proteins were separated by 8%~15% sodium dodecyl sulfate–polyacrylamide gel electrophoresis and were transferred onto polyvinylidene fluoride (PVDF) membranes. After blocking with 5% non-fat milk at room temperature for 1 hour, membranes were incubated with primary antibodies at 4°C overnight followed by washing three times in phosphate-buffered saline+Tween 20 and then incubated with secondary antibodies (antirabbit at 1:2000; Beverly, Massachusetts, USA) for 1 hour at room temperature. Detection was performed using an Odyssey infrared imaging system (LI-COR Biosciences). β-Actin/Glyceraldehyde-3-phosphate dehydrogenase (GAPDH) was used to normalize the densitometry results.
ELISA
The serum fasting blood glucose (FBG) levels were determined using the glucose assay kit, measured at 505nm using a microplate reader (Robio, China). Serum Insulin levels were determined using the Rat INS ELISA kit, measured at 450nm using a microplate reader (Elabscience, China).
Statistical analysis
Experimental data were expressed as mean±SD of at least three independent experiments. A paired t-test was used to compare the significance before and after treatment within the same group. Student’s t-test was used to perform a comparison between two groups, and one-way analysis of variance was used to compare three or more groups.
Results and discussion
HCFD combined with STZ effectively induces T2DM rats
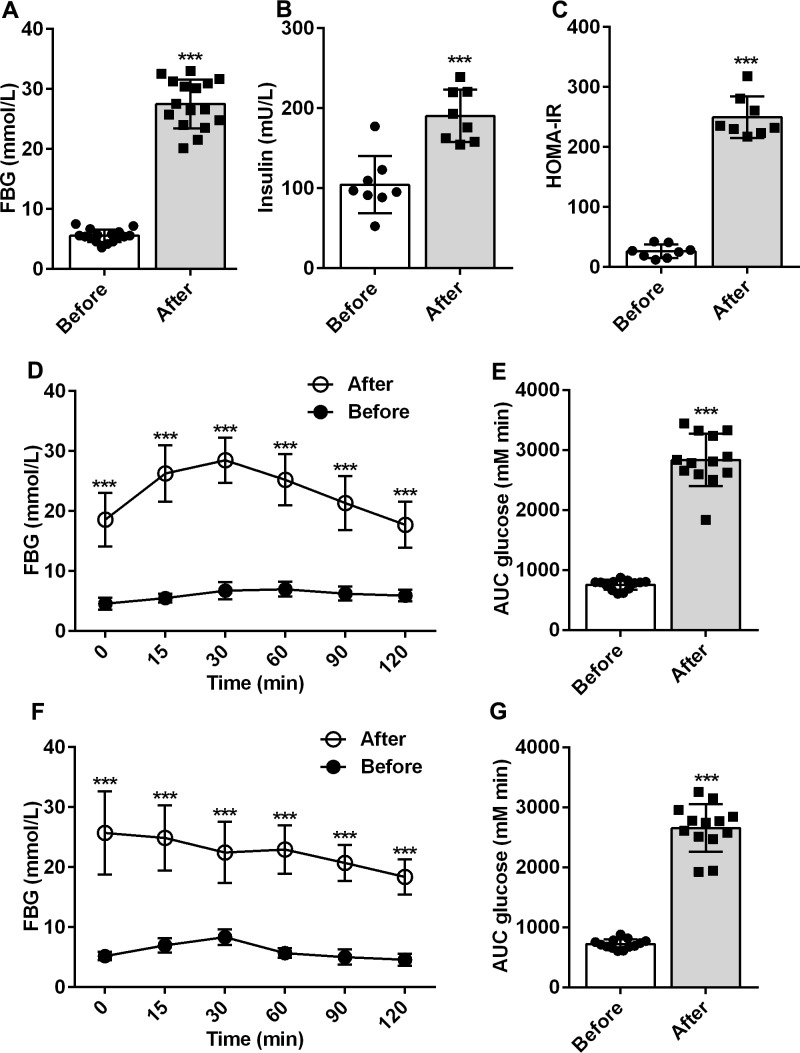
The HCFD combined with the low-dose STZ-induced diabetes animal models have been recognized to mimic human T2DM for experimental purposes.14 In this study, after 6 weeks of induction, the levels of serum glucose and insulin were significantly higher in rats than those observed previously (p<0.001; figure 1A, B). In rats, the insulin resistance index was significantly higher than that previously recorded (p<0.001, figure 1C), indicating that insulin resistance had occurred in rats, which is a typical symptom of type 2 diabetes.
Figure 1.
Changes in type 2 diabetes mellitus rats reduced by high-carbohydrate and fat diet combined with streptozotocin. (A) Concentration of serum glucose before and after induction (n=16). (B) Changes in serum insulin before and after induction (n=8). (C) Insulin resistance index calculated by the values of serum glucose and insulin (n=8). (D, E) Changes in oral glucose tolerance test before and after induction (n=13). (F, G) Change in pyruvate tolerance test before and after induction (n=13). ***P<0.001. AUC, area under the curve; FBG, fasting blood glucose; HOMA-IR, homeostatic model assessment of insulin resistance index.
The OGTT is a glucose stress test used to understand islet β-cell function and the body's ability to regulate blood glucose. It is a specific test for diagnosing diabetes and is widely used in clinical practice. As we compared the OGTT between before and after induction, the results demonstrated that the glucose tolerance in rats was significantly reduced (p<0.001; figure 1D, E). Pyruvate is a substrate for gluconeogenesis, and PTT is commonly used to measure gluconeogenesis in the liver. Compared with the values before induction, gluconeogenesis in the liver of T2DM rats was severely impaired (p<0.001; figure 1F, G). The pyruvate injection failed to induce significant changes in the blood glucose levels.
The aforementioned results implied that rats presented apparent clinical symptoms of T2DM 6 weeks after the induction by using HCFD combined with a low dose of STZ. Hence, T2DM rats induced by HCFD combined with a low dose of STZ are valid and reliable.
Hb lesions effectively reduce blood glucose and serum insulin levels and improve insulin resistance in T2DM rats
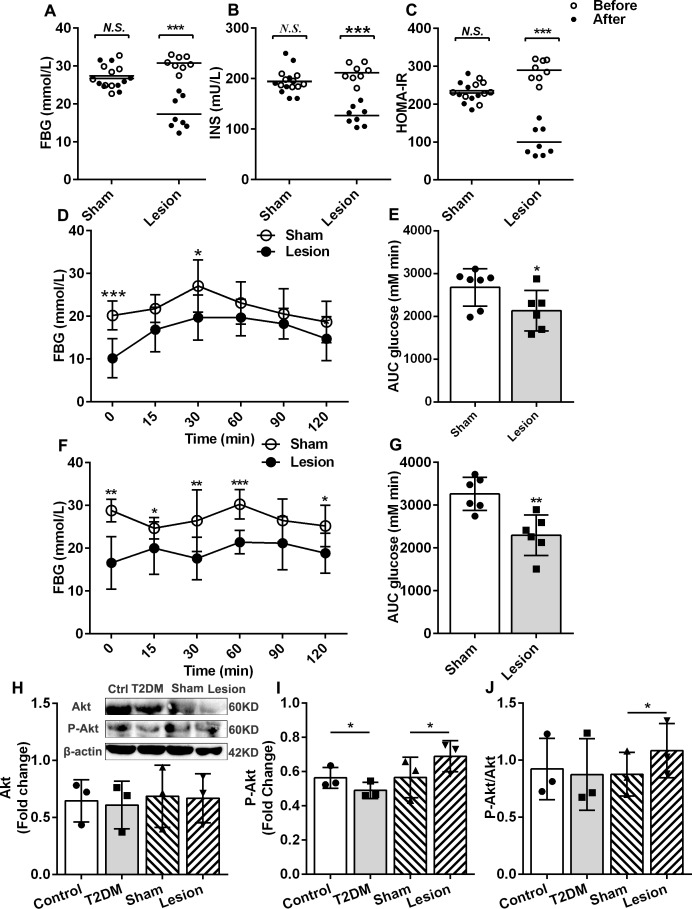
To determine the role of Hb in the pathophysiology of diabetes, we first observed the effects of Hb lesions on serum glucose and serum insulin in T2DM rats. The results demonstrated that both the concentration of serum glucose and insulin in the lesion group were lower than those observed in the sham group (figure 2A, B). In T2DM rats, the insulin resistance index dramatically reduced after Hb lesions (figure 2, p<0.05). Based on these results, we determined that Hb lesions lower the blood glucose level and improve insulin resistance in T2DM rats. These results were consistent with the OGTT results (figure 2D, E). Hb lesions enhanced glucose tolerance and improved insulin resistance in T2DM rats. However, the mechanisms by which these results are achieved remain unclear. To this end, we examined the effects of Hb lesions on the liver, an essential metabolic organ.
Figure 2.
Effects of habenular nucleus lesions on the T2DM rats. (A) Changes in fast serum glucose in the sham and lesion groups of T2DM (n=8). (B) Serum insulin changes of sham and lesion groups of T2DM (n=8). (C) Insulin resistance index of sham and lesion groups of T2DM (n=8). (D, E) Oral glucose tolerance test of sham and lesion groups of T2DM rats (n=6.) (F, G) Pyruvate tolerance test of sham and lesion groups of T2DM (n=6). (H) Western blot of Akt, P-Akt, and the statistic results of Akt in four groups (n=3). (I) Statistic results of P-Akt (n=3). (J) Ratio of P-Akt and Akt (n=3). *P<0.05, **P<0.01, ***P<0.001. AUC, area under curve; FBG, fasting blood glucose; HOMA-IR, homeostatic model assessment of insulin resistance index; INS, fast serum insulin; N.S., no significance; T2DM, type 2 diabetes mellitus.
Akt is a substrate in the insulin signaling pathway, with insulin exerting glycemic regulation by activating Akt phosphorylation.16 17 Therefore, the degree of Akt phosphorylation is also an indicator of insulin sensitivity. Our results demonstrated that the levels of Akt in the liver of rats was not significantly altered, but the levels of phosphorylated Akt in the liver of T2DM rats were lower than that observed in the control, and the levels of phosphorylated Akt in Hb lesion group were higher than that of the sham (figure 2H, I). The ratio of phosphorylated Akt to Akt in the liver of the Hb lesion group was higher than that of sham (figure 2J). These results suggest that Hb lesions could promote Akt phosphorylation and improve insulin sensitivity in T2DM rats.
Hb lesions increase AMPK phosphorylation and upregulate IRs in the liver
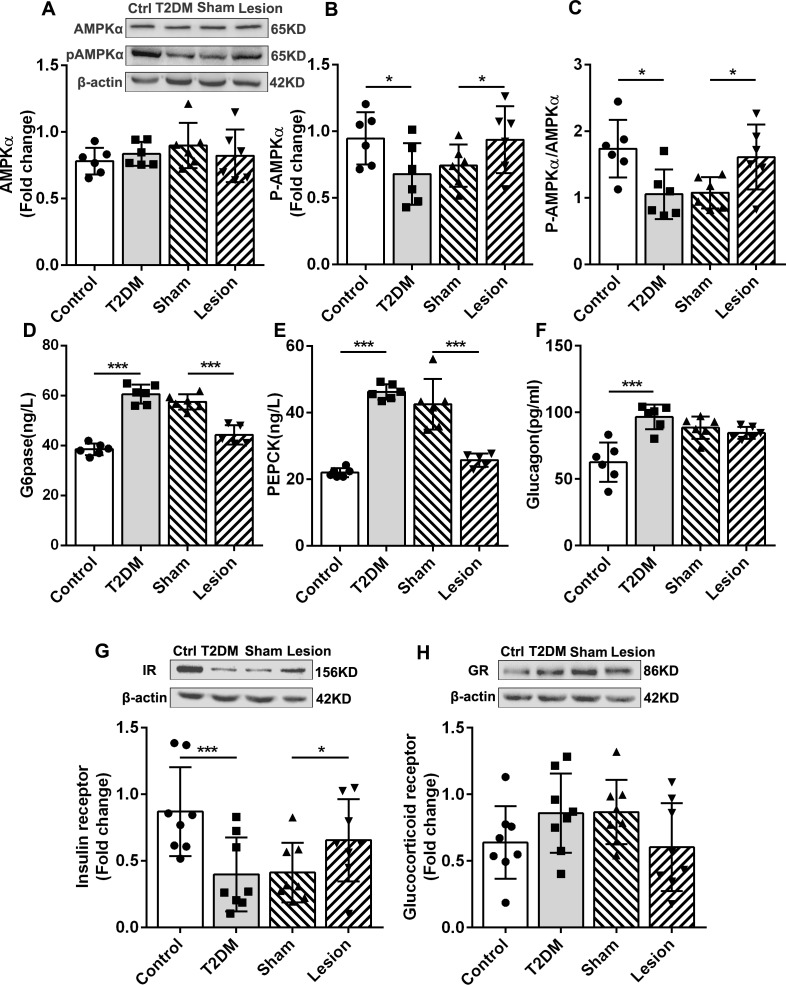
The liver is the main organ that regulates glucose metabolism. In the liver cells, activation of AMPK can inhibit gluconeogenesis and glycogen synthesis.18 19 Phosphorylation of the AMPK α (AMPKα) subunit is the primary form of AMPK activation. Western blotting demonstrated that, although the total amount of AMPKα was not significantly different in the liver of all four groups (figure 3A), AMPKα phosphorylation (P-AMPKα) levels in T2DM rats were lower than those observed in the control, whereas P-AMPKα levels in the Hb lesions group were significantly higher than those in the sham group (figure 3B). Moreover, in the Hb lesion group, the ratio of P-AMPKα to AMPKα increased significantly (figure 3C). Consistent with AMPK, the two key rate-limiting enzymes of gluconeogenesis, glucose-6-phosphatase (p<0.001, figure 3D) and phosphoenolpyruvate carboxy kinase (p<0.001, figure 3E), were increased in the T2DM group and significantly decreased in the Hb lesion group. In T2DM rats, Hb lesions resulted in the inhibition of hepatic gluconeogenesis. PTT results further demonstrate that Hb lesions inhibit hepatic gluconeogenesis (p<0.01; figure 2F, G).
Figure 3.
Effects of habenular nucleus lesions on glucose metabolism in the liver of T2DM rats. (A) Western blot of AMPK, P-AMPK, and the statistic results of AMPK in four groups (n=6). (B) Statistic results of P-AMPK (n=6). (C) Ratio of P-AMPK and AMPK (n=6). (D) Concentrations of G6pase (n=6). (E) Concentrations of PEPCK in the liver of rats (n=6). (F) Concentration of glucagon in the liver (n=6). (G) Western blot and expression levels of the IR in the liver of rats (n=8). (H) Western blot and statistic results of the GR in rat liver (n=8). *P<0.05, ***P<0.001. AMPK, adenosine 5’-monophosphate-activated protein kinase; Ctrl, control; G6pase, glucose-6-phosphatase; GR, glucocorticoid receptor; IR, insulin receptor; P-AMPK, phosphorylated AMP-activated protein kinase; PEPCK, phosphoenolpyruvate carboxylated kinase; T2DM, type 2 diabetes mellitus.
In the liver, the upregulation of IRs results in the inhibition of hepatic glucose production by inhibiting glycogenolysis.20 In this study, we observed that the expression levels of the IR were lower in the liver of T2DM rats than in the control, Hb lesions increased the expression of IRs (figure 3G). Hb lesions improved insulin function by upregulating IRs and promoting Akt phosphorylation (figure 2I). Additionally, we observed no significant differences in the liver glucocorticoid receptor expression levels in the four groups, although they tended to be higher in the T2DM group than that in the control group and lower in the lesion group than in the sham group (figure 3H). Our results suggest that Hb lesions inhibit hepatic glycogen synthesis and glycogenolysis by upregulating the insulin signaling pathway. Glucagon is a hormone that antagonizes insulin and raises blood glucose levels. It can increase blood glucose by promoting glycogenolysis and gluconeogenesis. However, we failed to observe that Hb lesions could reduce glucagon in the liver of T2DM rats (figure 3F).
The aforementioned results suggest that Hb lesions inhibit gluconeogenesis and glycogenolysis by activating the AMPK signaling pathway and upregulating IRs.
Hb lesions improve the functions of the hippocampus and inhibit the sympathetic nervous system
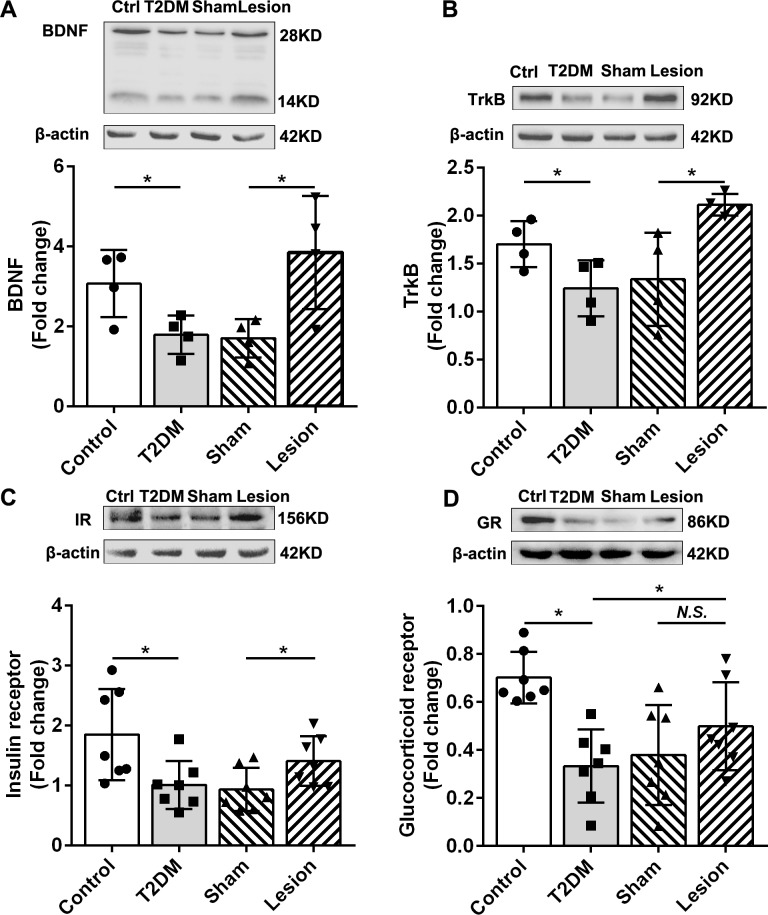
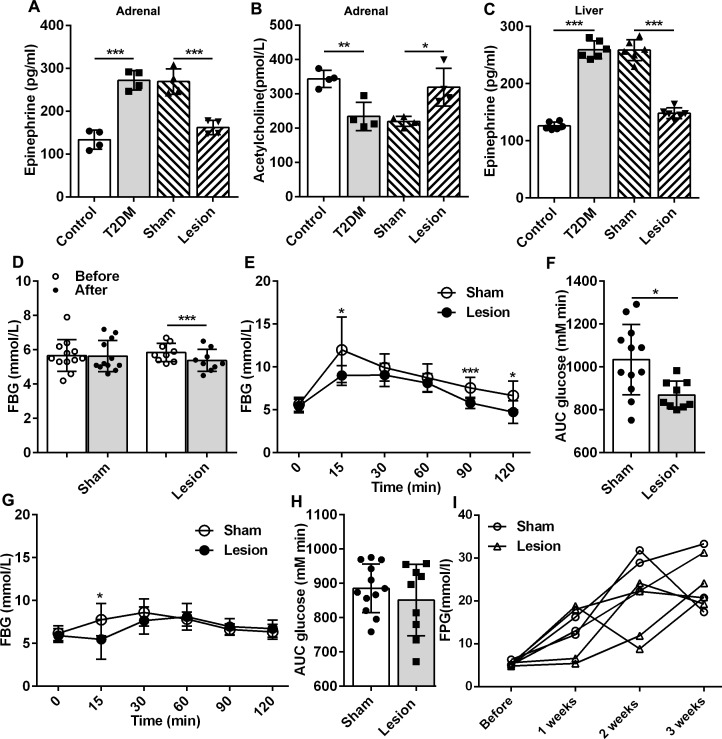
BDNF is an essential member of the neurotrophin family and plays a crucial role in regulating the survival, growth, and maintenance of neurons. Reportedly, BDNF and its receptor TrkB levels are reduced in the hippocampus of diabetic mice.21 This was consistent with our results, demonstrating lower BDNF and TrkB levels in the hippocampus of T2DM rats than those observed in the control group (p<0.05; figure 4A, B). Studies have shown that reduced BDNF expression in the hippocampus of diabetic rodents have a disinhibited effect on the HPA axis.22 We observed that Hb lesions can significantly increase the expression of BDNF and TrkB in the hippocampus of T2DM rats (p<0.05; figure 4A, B), indicating that Hb lesions might inhibit the HPA axis in T2DM rats by increasing the expression of BDNF in the hippocampus. Although the glucocorticoid receptor expression in the rat hippocampus of the lesion group was not significantly higher than that of the sham group, a clear upward trend was observed. HPA axis activity is negatively regulated by the binding of endogenous glucocorticoids to their receptors.23 The hippocampus has a rich glucocorticoid receptor expression crucial in the feedback regulation of the HPA axis.24 Hb lesions may inhibit the function of the HPA axis by upregulating glucocorticoid receptors in the hippocampus. Collectively, Hb lesions could improve glucose metabolism in T2DM rats by inhibiting the activity of the HPA axis, by enhancing the expression of BDNF and its receptors. Furthermore, a decrease in epinephrine (EP) (p<0.001, figure 5A) and an increase in acetylcholine (p<0.05, figure 5B) in the adrenal glands, as well as a decrease in EP levels in the liver (p<0.001, figure 5C), suggested that Hb lesions could cause peripheral sympathetic nervous system depression (figure 5A). Overall, the inhibition of Hb lesions in the HPA axis and sympathetic nervous system may be essential for mediating the regulation on liver glucose metabolism.
Figure 4.
Effects of habenular nucleus lesions on the hippocampus of rats. (A) Western blot and statistic results of BDNF in four groups of rats (n=4). (B) Western blot and statistic results of TrkB in four groups of rats (n=4). (C) Western blot and statistic results of the IR in rat hippocampus (n=7). (D) Western blot and statistic results of the GR in rat hippocampus (n=7). *P<0.05. BDNF, brain-derived neurotrophic factor; Ctrl, control; GR, glucocorticoid receptor; IR, insulin receptor; N.S., no significance; T2DM, type 2 diabetes mellitus; TrkB, tropomyosin receptor kinase B.
Figure 5.
Effects of Hb lesions on the peripheral nervous system of normal rats. (A, B) Concentrations of EP and Ach in adrenal of rats (n=4). (C) Concentration of EP in the liver of rats (n=6). (D) Effects of Hb lesions on serum glucose levels in normal rats, Sham: n=12; lesion: n=9. (E, F): Effects of Hb lesions on the oral glucose tolerance test of normal rats (sham: n=12, lesion: n=9). (G, H) Effects of Hb lesions on the pyruvate tolerance test of normal rats (sham: n=12, lesion: n=9). (I) Dynamic observation of high-carbohydrate and fat diet on serum glucose levels in rats after Hb lesions (sham: n=3, lesion: n=4). *P<0.05, **P<0.01, ***P<0.001. Ach: acetylcholine; AUC, area under curve; EP, epinephrine; FBG, fasting blood glucose; Hb, habenular nucleus; T2DM, type 2 diabetes mellitus.
Studies by Soto et al have shown that IR deletion in the hippocampus and central amygdala result in glucose intolerance in mice.25 In our study, the expression levels of IR in the hippocampus of T2DM rats were lower than those in the control (figure 4C). Compared with the sham group, the expression of IR in the hippocampus of Hb lesion rats was significantly increased (figure 4C), and the rats in the lesion group indicated stronger glucose tolerance in OGTT (figure 2D, E). This evidence suggests that the increased IR expression in the hippocampus may be the main reason mediating Hb lesions to improve glucose tolerance in T2DM rats.
Effects of Hb lesions on blood glucose, glucose tolerance, and hepatic gluconeogenesis in rats under physiological conditions
We observed the effects of Hb lesions on glucose metabolism in diabetic rats, but the role of Hb lesions under physiological conditions is unclear. Hence, we applied the same method and ablated bilateral Hb in normal rats and revealed that the blood glucose levels in the lesions group was also significantly reduced, lower than that of the sham group (p<0.001, figure 5D). Hb lesions decreased the level of blood glucose in normal rats. This result indicates that under normal physiological conditions, Hb has a certain regulatory effect on glucose metabolism in rats. Increased Hb activity results in increased blood glucose production or/and decreased insulin sensitivity. Therefore, we examined the effect of Hb lesions on glucose tolerance in normal rats. OGTT demonstrated that Hb lesions increase insulin sensitivity in normal rats (p<0.05; figure 5E, F), but PTT results indicated that Hb lesions did not affect gluconeogenesis in normal rats (figure 5G, H). Based on the aforementioned two experiments, it can be observed that Hb lesions possess no visible regulatory effect on gluconeogenesis in normal rats but can significantly alter the glucose tolerance of normal rats. Under normal physiological conditions, Hb lesions mainly regulate glucose metabolism by regulating insulin sensitivity.
To determine whether Hb lesions had a preventive effect on diabetes, we first lesioned the Hb 1 week before induction and then induced diabetes using HCFD and STZ. We observed that Hb lesions did not prevent the onset of diabetes, but demonstrated some delaying effects on the rate of rise in blood glucoselevels (figure 5I). These results suggest that Hb lesions can only increase insulin sensitivity in normal rats but have no effect on gluconeogenesis under physiological conditions. Hb lesions do not possess diabetes preventive effects.
Conclusion
Based on the results obtained in this study, we speculate that hyperglycemia caused by diabetes can lead to Hb dysfunction and an excessive enhancement of activity. Hb lesions inhibit the HPA axis and peripheral sympathetic nervous system by enhancing hippocampal function, exerting its ability to inhibit liver gluconeogenesis and glycogenolysis, and therefore improving glucose tolerance in diabetic rats. This study provides a new and reliable experimental basis for the central neuropathological mechanism of diabetes and suggests Hb as a critical diabetic target in the CNS that could be targeted for T2DM treatment.
Acknowledgments
We thank Dr Ting Bai and Dr Zhiyu Wei for advice on the manuscript writing and Editage (www.editage.com) for English language editing.
Footnotes
PQ, YW, LL and MQ contributed equally.
Contributors: LY, QZ, and LL designed and drafted the manuscript. PQ, YW, and MQ performed the experiments and analyzed the data. YW contributed to the writing of the manuscript. YS, SZ, ZX, and CL performed western blot experiments. XB performed western blot experiments of Akt/P-Akt. All authors read and approved the final manuscript. LY will take responsibility for the contents of the article.
Funding: This work was supported by the National Natural Science Foundation of China (grant numbers 31571087 and 31200839) and the Educational Department of Liaoning Province (grant number L2019602).
Competing interests: None declared.
Patient consent for publication: Not required.
Ethics approval: All rats were cared for and used following the National Institutes of Health guidelines for the care and use of experimental animals, and all procedures were approved by the Animal Care and Use Committee of the Dalian University.
Provenance and peer review: Not commissioned; externally peer reviewed.
Data availability statement: Data are available upon reasonable request. The datasets generated and/or analyzed during the current study are available from the corresponding author on reasonable request. LY will take all correspondence of this paper.
References
- 1.Namboodiri VMK, Rodriguez-Romaguera J, Stuber GD. The habenula. Curr Biol 2016;26:R873–7. 10.1016/j.cub.2016.08.051 [DOI] [PubMed] [Google Scholar]
- 2.Yang Y, Wang H, Hu J, et al. . Lateral habenula in the pathophysiology of depression. Curr Opin Neurobiol 2018;48:90–6. 10.1016/j.conb.2017.10.024 [DOI] [PubMed] [Google Scholar]
- 3.Bădescu SV, Tătaru C, Kobylinska L, et al. . The association between diabetes mellitus and depression. J Med Life 2016;9:120–5. [PMC free article] [PubMed] [Google Scholar]
- 4.Holt RIG, de Groot M, Golden SH. Diabetes and depression. Curr Diab Rep 2014;14:491. 10.1007/s11892-014-0491-3 [DOI] [PMC free article] [PubMed] [Google Scholar]
- 5.Jeon E-J. Diabetes and depression. Yeungnam Univ J Med 2018;35:27–35. 10.12701/yujm.2018.35.1.27 [DOI] [PMC free article] [PubMed] [Google Scholar]
- 6.Moulton CD, Costafreda SG, Horton P, et al. . Meta-Analyses of structural regional cerebral effects in type 1 and type 2 diabetes. Brain Imaging Behav 2015;9:651–62. 10.1007/s11682-014-9348-2 [DOI] [PubMed] [Google Scholar]
- 7.Lee HW, Yang SH, Kim JY, et al. . The role of the medial habenula cholinergic system in addiction and Emotion-Associated behaviors. Front Psychiatry 2019;10:100. 10.3389/fpsyt.2019.00100 [DOI] [PMC free article] [PubMed] [Google Scholar]
- 8.McLaughlin I, Dani JA, De Biasi M. The medial habenula and interpeduncular nucleus circuitry is critical in addiction, anxiety, and mood regulation. J Neurochem 2017;142 Suppl 2:130–43. 10.1111/jnc.14008 [DOI] [PMC free article] [PubMed] [Google Scholar]
- 9.Zubcevic J, Watkins J, Perez PD, et al. . MEMRI reveals altered activity in brain regions associated with anxiety, locomotion, and cardiovascular reactivity on the elevated plus maze in the WKY vs SHR rats. Brain Imaging Behav 2018;12:1318–31. 10.1007/s11682-017-9798-4 [DOI] [PubMed] [Google Scholar]
- 10.Lv Y, Ma D, Meng H, et al. . Habenula regulates cardiovascular activities in the insula cortex in a rat model of epilepsy. Int J Neurosci 2012;122:314–23. 10.3109/00207454.2012.654413 [DOI] [PubMed] [Google Scholar]
- 11.Wang J, Wang M, Wei Z, et al. . The lateral habenular nucleus mediates signal transduction from the insular cortex in OSA rats. Sleep Breath 2014;18:491–7. 10.1007/s11325-013-0910-8 [DOI] [PubMed] [Google Scholar]
- 12.Paulson PE, Wiley JW, Morrow TJ. Concurrent activation of the somatosensory forebrain and deactivation of periaqueductal gray associated with diabetes-induced neuropathic pain. Exp Neurol 2007;208:305–13. 10.1016/j.expneurol.2007.09.001 [DOI] [PMC free article] [PubMed] [Google Scholar]
- 13.Yang L-M, Hu B, Xia Y-H, et al. . Lateral habenula lesions improve the behavioral response in depressed rats via increasing the serotonin level in dorsal raphe nucleus. Behav Brain Res 2008;188:84–90. 10.1016/j.bbr.2007.10.022 [DOI] [PubMed] [Google Scholar]
- 14.Gheibi S, Kashfi K, Ghasemi A. A practical guide for induction of type-2 diabetes in rat: incorporating a high-fat diet and streptozotocin. Biomed Pharmacother 2017;95:605–13. 10.1016/j.biopha.2017.08.098 [DOI] [PubMed] [Google Scholar]
- 15.Paxinos CW G. The rat brain in stereotaxic coordinates. 4th edn San Diego: Academic Press, 1998. [Google Scholar]
- 16.Yang Q, Vijayakumar A, Kahn BB. Metabolites as regulators of insulin sensitivity and metabolism. Nat Rev Mol Cell Biol 2018;19:654–72. 10.1038/s41580-018-0044-8 [DOI] [PMC free article] [PubMed] [Google Scholar]
- 17.Huang X, Liu G, Guo J, et al. . The PI3K/Akt pathway in obesity and type 2 diabetes. Int J Biol Sci 2018;14:1483–96. 10.7150/ijbs.27173 [DOI] [PMC free article] [PubMed] [Google Scholar]
- 18.Zang Y, Fan L, Chen J, et al. . Improvement of lipid and glucose metabolism by capsiate in palmitic acid-treated HepG2 cells via activation of the AMPK/SIRT1 signaling pathway. J Agric Food Chem 2018;66:6772–81. 10.1021/acs.jafc.8b01831 [DOI] [PubMed] [Google Scholar]
- 19.Zhang Y, Chen J, Zeng Y, et al. . Involvement of AMPK activation in the inhibition of hepatic gluconeogenesis by Ficus carica leaf extract in diabetic mice and HepG2 cells. Biomed Pharmacother 2019;109:188–94. 10.1016/j.biopha.2018.10.077 [DOI] [PubMed] [Google Scholar]
- 20.Sindelar DK, Balcom JH, Chu CA, et al. . A comparison of the effects of selective increases in peripheral or portal insulin on hepatic glucose production in the conscious dog. Diabetes 1996;45:1594–604. 10.2337/diab.45.11.1594 [DOI] [PubMed] [Google Scholar]
- 21.Stranahan AM, Lee K, Martin B, et al. . Voluntary exercise and caloric restriction enhance hippocampal dendritic spine density and BDNF levels in diabetic mice. Hippocampus 2009;19:951–61. 10.1002/hipo.20577 [DOI] [PMC free article] [PubMed] [Google Scholar]
- 22.Wosiski-Kuhn M, Bota M, Snider CA, et al. . Hippocampal brain-derived neurotrophic factor determines recruitment of anatomically connected networks after stress in diabetic mice. Hippocampus 2018;28:900–12. 10.1002/hipo.23018 [DOI] [PMC free article] [PubMed] [Google Scholar]
- 23.Cattaneo A, Riva MA. Stress-Induced mechanisms in mental illness: a role for glucocorticoid signalling. J Steroid Biochem Mol Biol 2016;160:169–74. 10.1016/j.jsbmb.2015.07.021 [DOI] [PubMed] [Google Scholar]
- 24.Jacobson L, Sapolsky R. The role of the hippocampus in feedback regulation of the hypothalamic-pituitary-adrenocortical axis. Endocr Rev 1991;12:118–34. 10.1210/edrv-12-2-118 [DOI] [PubMed] [Google Scholar]
- 25.Soto M, Cai W, Konishi M, et al. . Insulin signaling in the hippocampus and amygdala regulates metabolism and neurobehavior. Proc Natl Acad Sci U S A 2019;116:6379–84. 10.1073/pnas.1817391116 [DOI] [PMC free article] [PubMed] [Google Scholar]


