

Abstract
Pseudomonas aeruginosa is an opportunistic pathogen that produces numerous exoproducts during infection that help it evade the host immune system and procure nutrients from the host environment. Among these products are a family of secreted 2-alkyl-4(1H)-quinolone metabolites (AQs), which exhibit a range of biological activities. Here, we describe the validation of a liquid chromatography-tandem mass spectrometry (LC-MS/MS)-based method for quantifying multiple AQ congeners in complex biological matrices. The assay was validated for selectivity, sensitivity, linearity, accuracy, precision, carryover, dilution integrity, recovery, matrix effects, and various aspects of stability (freeze-thaw, bench-top, long-term storage, and autosampler/post-preparative). Using authentic standards for 6 distinct AQ congeners, we report accurate quantitation within a linear range between 25 and 1000 nmol/L for all of the validated AQ standards. This method was successfully applied to quantify AQ concentrations in P. aeruginosa cell culture and in the lungs of mice infected with P. aeruginosa. Further, we confirmed the presence of unsaturated forms of several AQ congeners in cell culture.

Graphical abstract
Electronic supplementary material
The online version of this article (10.1007/s00216-019-02374-0) contains supplementary material, which is available to authorized users.
Keywords: 2-Alkyl-4(1H)-quinolones, Pseudomonas aeruginosa, AQs, Bacterial, LC-MS/MS
Introduction
Pseudomonas aeruginosa is a bacterial pathogen capable of causing acute and chronic opportunistic infections, including hospital-acquired pneumonias and chronic, polymicrobial lung infections in individuals with cystic fibrosis (CF) [1–5]. During infection, P. aeruginosa produces numerous exoproducts that help it evade the host immune system and procure nutrients from the host environment. Among these products are a family of secreted 2-alkyl-4(1H)-quinolone metabolites (AQs), which exhibit a range of biological activities during infection [6–10]. 2-Heptyl-3(1H)-hydroxy-4-quinolone (referred to as C7-PQS) and 2-heptyl-4(1H)-quinolone (HHQ) are two distinct AQ quorum signaling molecules that can regulate expression of virulence factors that contribute to infection [11–15]. C7-PQS, but not HHQ, has also been shown to complex with iron and may help P. aeruginosa acquire this critical but limiting nutrient in iron-deplete environments [16]. Another AQ, 2-heptyl-4-hydroxyquinolone-N-oxide (HQNO), is a potent cytochrome b inhibitor that blocks the respiratory chain in both eukaryotic and bacterial cells [8]. Importantly, these different AQs each contribute to antimicrobial activity against microbial pathogens, most notably Staphylococcus aureus, during co-culture and co-infection [7, 17–19]. Moreover, it is hypothesized that they significantly contribute to infection, as deletion of an AQ regulator, PqsR, attenuates P. aeruginosa virulence in several in vivo infection models [20–23]. However, the precise contributions of each individual AQ during in vivo infection have not been directly tested, and there is a need for analytical tools that can facilitate THE study of these AQs both in vitro and in vivo.
AQ biosynthesis is facilitated by the activity of numerous enzymes encoded in the pqs operon (Fig. 1) and is initiated by the conversion of anthranilic acid into anthraniloyl-CoA by the enzyme PqsA, an anthranilate CoA ligase. Anthraniloyl-CoA, along with malonyl-CoA, are then condensed to 2-(aminobenzoyl)acetyl-CoA (2-ABA) by the enzyme PqsD [24–29]. 2-ABA can be converted directly into HHQ by the PqsBC complex [24, 26]. While HHQ has several biological functions in itself, it can also be converted by the PqsH mono-oxygenase, encoded at a distal site of the P. aeruginosa chromosome, into PQS [22]. Alternatively, 2-ABA can be further altered by the enzyme PqsL, which is also encoded at a distal site on the P. aeruginosa chromosome, into the unstable product, 2-hydroxylaminobenzoyl acetate (2-HABA). 2-HABA and octanoyl-CoA can then be converted to HQNO via the PqsBC complex [30].
Fig. 1.

Schematic of the AQ biosynthetic pathway in Pseudomonas aeruginosa. Variations in the molecular structure of anthraniloyl-CoA result in the formation of several distinct AQ congeners with alkyl chains of variable length and degree of unsaturation. AQs with either fully saturated (R) or unsaturated (R’) alkyl chains can be distinguished either by characteristic m/z transitions, or by retention time. The m/z transitions of saturated and unsaturated AQ congeners observed in these studies are listed beneath their characteristic structure. Asterisks denote transitions of commercially available AQs that were used for assay validation experiments
HHQ, HQNO, and C7-PQS can be classified into three general categories: 2-alkyl-4(1H)-hydroxyquinolones (AHQs), 2-alkyl-4-hydroxyquinolone N-oxides (AQNOs), and 2-alkyl-3-hydroxy-4(1H)-quinolone molecules (PQS), respectively. C7-PQS, HHQ, and HQNO are each distinguished by fully saturated alkyl chains that are seven carbons in length. However, variations in alkyl chain length and saturation account for over 50 distinct AQ congeners, several of which are listed in Fig. 1 [31]. It is currently unclear if variation in the alkyl chains of these structures is due to promiscuity of AQ biosynthetic enzymes, or to an as-of-now uncharacterized enzymatic activity in P. aeruginosa, but they clearly alter the biological activity of these metabolites [32, 33]. The precise function of each of these AQs has not been fully characterized, however, due in part to limitations of existing analytical methodology that can identify and quantify each congeners. For instance, PQS production has been studied in previous literature using low-resolution and non-specific thin layer chromatography [6, 7, 34]. However, this method is only suitable for determining qualitative production of PQS congeners and cannot distinguish between co-eluting congeners with varying alkyl chain lengths and saturation. More recent liquid chromatography-tandem mass spectrometry (LC-MS/MS) methods have allowed for quantitative analysis of different AQ congeners [7, 31, 35–37], although there is still need for more comprehensive LC-MS/MS methods that will facilitate accurate analysis of the broad spectrum of AQs in cell culture and tissue.
In this work, we present validation for an LC-MS/MS method that can be used to simultaneously analyze multiple AQ congeners produced by P. aeruginosa using selected reaction monitoring (SRM). The validation experiments were carried out according to the FDA Bioanalytical Method Validation Guidance for Industry, and this method was successfully applied to quantitate several saturated and unsaturated AQ molecules in P. aeruginosa cultures. We further demonstrate the utility of this method in detecting the presence of AQs in the lungs of P. aeruginosa-infected mice. As such, we anticipate that this method will be a useful tool for in vitro and in vivo studies of P. aeruginosa AQ production.
Methods
Chemicals and reagents
Nalidixic acid was procured from Research Products International Corporation (Mount Prospect, IL, USA). 2-Heptyl-3-hydroxy-4-(1H)-quinolone (C7-PQS) and 2-heptyl-4-quinolone (HHQ) were obtained from Millipore Sigma (Burlington, MA, USA). 2-Heptyl-4-hydroxyquinolone (HQNO) was procured from Axxora (Farmingdale, NY, USA). 2-Nonyl-3-hydroxy-4-(1H)-quinolone (C9-PQS) was obtained from Cayman Chemical Company (Ann Arbor, MI, USA). 2-Nonyl-4-quinolone (NHQ) was purchased from Combi-Blocks (San Diego, CA, USA), and 2-nonyl-4-hydroxyquinolone (NQNO) was purchased from Santa Cruz Biotechnology, Inc. (Dallas, TX, USA). LC-MS grade acetonitrile and water were purchased from Fisher Scientific (Hampton, NH, USA). Chelex 100 was purchased from Bio-Rad (Hercules, CA). Bacto™ Tryptone and Bacto™ Yeast Extract were purchased from Becton, Dickinson, and Company (Sparks, MD, USA). Iron (III) chloride hexahydrate (FeCl3), tryptic soy broth, ethylenediaminetetraacetic acid disodium salt dehydrate (EDTA), sodium chloride, and formic acid (FA) were all purchased from Millipore Sigma (Burlington, MA, USA).
Bacterial strains and growth conditions
The strains used in this study are detailed in Table S1 (see Electronic Supplementary Material (ESM). The wild type P. aeruginosa strain, PAO1, produces a robust range of AQs in cell culture, including C7-PQS, C9-PQS, HQNO, NQNO, HHQ, and NHQ [7, 31, 38, 39]. The PAO1∆pqsA strain is a deletion strain that lacks production of AQs, yielding a biologically relevant matrix devoid of AQs [40]. P. aeruginosa strains were cultured from freezer stock onto Luria agar plates and incubated for 18 h at 37 °C. Five isolated colonies of each strain were used to inoculate 5 mL of Luria broth (LB), representing one biological replicate. Six biological replicates were prepared in LB and incubated at 37 °C for 18 h. After overnight incubation, LB cultures were diluted in 5 mL dialysed trypticase soy broth media (DTSB) to an OD600 of 0.05 and incubated for 18 h at 37 °C. DTSB is an iron-deplete media that has been treated with a metal-chelating material, Chelex 100, and then dialysed to remove Chelex 100 and remaining trace metals. This media has been widely used to study iron starvation responses in P. aeruginosa, and has been specifically used to study the impact of iron availability on AQ production [7, 38, 41]. To quantify the impact of iron availability on AQ production, DTSB media was supplemented with either high iron (100 μM FeCl3) or low iron (0 μM FeCl3) prior to incubation.
Animal studies
Male and female CD-1 mice (4 to 6 weeks old) were purchased from Charles River Laboratories. For lung infection studies, the P. aeruginosa PAO1 strain was streaked onto Pseudomonas isolation agar (PIA) plates and incubated for 8 h at 37 °C. Isolated colonies from plates were then resuspended in phosphate-buffered saline (PBS) and dilutions were prepared according to their absorbance at 600 nm. Mice were anesthetized with 200 μl of ketamine (6.7 mg/ml) and xylazine (1.3 mg/ml) via intraperitoneal injection and were inoculated intranasally (i.n.) with 20 μl of inoculum (10 μl per nostril, total dose of 108 viable bacteria/mouse) (n = 6 mice, 3 male, + 3 female). To enumerate the delivered dose, inocula were serially diluted and plated onto PIA. Mice were euthanized by intraperitoneal injection of 200 μL of a solution of 39 mg/mL pentobarbital sodium 16 h post infection. Lungs were excised and then homogenized in 1 mL sterile PBS. To determine bacterial burden in infected mouse lungs, 300 μL of lung homogenate was serially diluted in sterile PBS and plated onto PIA in four technical replicates per biological replicate. Remaining lung homogenates were stored at − 80 °C prior to AQ extraction. To determine the presence of exogenous AQs present in the lungs of CD-1 mice, uninfected mice (4 to 6 weeks old, n = 10, 5 male, + 5 female) were euthanized, and lung tissue was harvested, homogenized, and stored as described above.
Sample preparation
For assay validation, iron regulation experiments, and lung infection experiments, 300 μL of bacterial cultures or 300 μL of homogenized lung tissue was aliquoted into fresh microcentrifuge tubes. Six microliters of 25 μM nalidixic acid internal standard was added to each sample to a final concentration of 500 nM, followed by 900 μL of ethyl acetate acidified with 0.1% (v/v) acetic acid. Samples were then vortexed rigorously for 1 min, followed by centrifugation at 15000×g for 1 min. Five hundred microliters of upper organic phase was removed and transferred to a fresh microcentrifuge tube. An additional 500 μL of fresh acidified ethyl acetate was added to samples and the extraction protocol was repeated. Extracts were immediately dried using a Speedvac concentrator and stored at − 80 °C. Prior to analysis, all extracts were resuspended in 300 μL of a 1:1:1 (v/v/v) solvent mixture of methanol, water, and acetonitrile, and then sonicated for 15 s in a sonicating water bath. When necessary, culture extracts from iron studies were diluted 40× in sterile media prior to extraction to quantitate AQ concentrations above the ULOQ.
Preparation of standard solutions, calibration curve, and quality control samples
Working solutions containing a combination of HQNO, NQNO, C7-PQS, C9-PQS, HHQ, and NHQ standards were prepared in methanol (MeOH) at concentration of 50 μM. To prepare these working solutions, 5 mg of the individual lyophilized AQ standards was dissolved separately in MeOH to concentrations of 1 mM. Five hundred microliters of each individual 1 mM AQ stock was combined and further diluted with 7 mL of MeOH, resulting in a 10 mL solution containing 50 μM of each AQ congeners. One milliliter of aliquots of the 50 μM AQ working solution was transferred into fresh microcentrifuge tubes and lyophilized in a Speedvac concentrator. Lyophilized aliquots were stored in a − 80 °C freezer. Prior to use, these stocks were resuspended in 1 mL methanol and sonicated for 15 s in a sonicating bath.
Calibration standards containing a mix of the six AQ standards were prepared at concentrations of 25 nM, 50 nM, 100 nM, 250 nM, 500 nM, 750 nM, and 1000 nM by dilution of a 50 μM stock solution into 300 μL of blank PAO1∆pqsA cell culture and spiked with 6 μL of 25 μM nalidixic acid (internal standard) to yield a final concentration of 500 nM internal standard (I.S.). Calibration samples prepared in blank ∆pqsA matrix were then subjected to ethyl acetate extraction, lyophilization, and resuspension as described above. Analyte responses were determined by multiplying peak areas of each analyte by the ratio of the internal standard concentration to the internal standard peak area. Calibration curves were constructed for each AQ standard by plotting the response of each AQ analyte versus the nominal concentration. Linearity of calibration curves was assessed through linear regressive analysis using a weighting factor of 1/x.
Quality control (QC) samples were also prepared by spiking 300 μL of PAO1∆pqsA with AQs at known concentrations that correspond to LLOQ (25 nM), low QC (50 nM), medium QC (250 nM), and high QC (1000 nM) concentrations of the AQ congeners (pre-extraction spiked). AQs were extracted from these samples and lyophilized, as described above, and resuspended prior to analysis in 300 μL of a 1:1:1 mixture (v/v/v) mixture of methanol, water, and acetonitrile. QC samples at equivalent concentrations were also prepared in neat solvent and blank extract from the PAO1∆pqsA matrix (post-extraction spiked).
Liquid chromatography-tandem mass spectrometry
Separation and detection of AQ standards was carried out on an LC-MS/MS system consisting of Waters H-Class UPLC system and a Waters Xevo TQ-XS tandem quadrupole mass spectrometer (Milford, MA, USA). Chromatographic separation was carried out at a flow rate of 0.4 mL/min using a 2.1 × 100 mm, 2.7 μm Ascentis Express C8 HPLC Column (Supelco; Eden Prairie, MN, USA) maintained at 30 °C. Gradient elution was effected with solvent A composed of 0.1% FA and 200 μM EDTA in H2O and solvent B composed of 0.1% FA in acetonitrile. The gradient was as follows: 0.0–0.5 min hold at 80% A, 0.5–4.0 min linear gradient from 80% A to 5% A, 4.5–5.0 min hold at 5% A, 5.5–6.0 min linear gradient from 5% A to 80% A, and 6.0–8.0 min hold at 80% A to re-equilibrate the column. Sample injections were 2 μL.
Mass spectrometric analysis was carried out in selected reaction monitoring (SRM) mode. Optimized tuning of the mass spectrometer for SRM was achieved by directly infusing standards dissolved in 1:1 (v/v) acetonitrile and water at a flow rate of 5 μL/min. The electrospray ionization source was operated in positive ion mode with a capillary voltage of 1 kV and maintained source temperature of 550 °C. Cone voltages and collision energy parameters for the various AQ congeners are provided in ESM Table S2. For SRM, dwell time for each transition was 5 milliseconds.
Selectivity and sensitivity
Six biological replicates of blank PAO1∆pqsA culture extracts were analyzed to verify the absence of endogenous interference in blank matrix. Peak areas of blank extracts were assessed at the transitions and retention times corresponding to the AQ analytes and internal standard. Selectivity for each AQ was deemed suitable if blank matrix was free of interfering peaks with areas greater than 15% of the LLOQ. Selectivity of the IS was deemed suitable if the average IS peak in un-spiked blank matrix was ≤ 5% of the IS-spiked blank matrix. Sensitivity of the assay was characterized for each individual AQ standard by determining minimum concentrations of each AQs that could be quantified with intraday CV ≤ 20% and accuracy within ± 15% of nominal concentration; these concentrations were defined as the LLOQ. Similarly, upper limit of quantitation (ULOQ) was defined as the maximum concentration of analyte that could be quantified with the same degree of intraday precision and accuracy.
Method validation
The method was validated in accordance with the Guidance for Industry: Bioanalytical Method Validation by the US Food and Drug Administration for selectivity, sensitivity, linearity, carryover, dilution integrity, accuracy, precision, recovery, matrix effect, and stability (freeze-thaw, bench-top, long-term storage, and autosampler/post-preparative stability) [42].
Recovery and matrix effects
Recovery values of AQs from cell culture (n = 6) and uninfected lung tissue (n = 5) were characterized by spiking known concentrations of AQs into 300 μL of either PAO1∆pqsA cell culture or homogenized lung tissue from uninfected mice (pre-extraction spiked) at LLOQ QC, low QC, medium QC, or high QC concentrations. Six microliters of 25 μM nalidixic acid was added to each sample prior to extraction, yielding a final concentration of 500 nM. Samples were subjected to ethyl acetate extraction as described above. AQ recovery from the respective matrices was calculated by comparing the peak areas of AQ standard(s) in pre-extraction spiked samples to those of neat solvent spiked with equivalent concentrations of AQs. Further, we characterized matrix effects to determine the suppression or enhancement of ionization among the various analytes resulting from the presence of biological matrix. To do so, we compared peak areas of neat solvent spiked with LLOQ, low QC, medium QC, and high QC concentrations of AQs to those of cellular (n = 6) or uninfected lung extracts (n = 5) spiked with equivalent concentrations of AQs (post-extraction spiked).
Stability assays
The relative stability for each AQ standard was evaluated across a variety of storage conditions, including storage at room temperature for 6 and 24 h (bench-top stability), freezer storage at − 80 °C for 1 month (long-term storage stability), and storage in the instrument autosampler at 4 °C for 16 h (post-preparative/autosampler stability). In addition, freshly prepared processed samples were subjected to three cycles of freezing at − 80 °C and thawing at room temperature in order to characterize freeze-thaw stability of the AQ standards. Six biological replicates of LLOQ and high concentration QC samples were prepared for each storage condition. Stability across each of these storage conditions was calculated by comparing analyte response in stored samples vs. freshly prepared samples (n = 6).
Dilution integrity
To determine the dilution integrity of the AQ standards at concentrations greater than the ULOQ, 5 replicates of PAO1∆pqsA cell cultures were spiked with 10 μM of each AQ standard. These samples were then diluted in four serial dilutions down to a concentration of 750 nM. Six microliters of 25 μM IS was spiked into each sample, and samples were prepared as described above. Extracts were lyophilized and resuspended as described above. Accuracy was determined by comparing analyte response in diluted sample extracts to those of fresh extract from culture spiked with 750 nM of AQs.
Statistics
Mass spectrometry data were collected and processed with MassLynx (version 4.2). Statistically significant differences in alkyl quinolone production were identified between treatment groups using a Student’s t test with a significance threshold of p < 0.05. Concentrations of AQs in bacterial culture are reported as the average of five biological concentrations ± standard deviation. Statistics were calculated using Microsoft Office Excel 2013.
Results
Optimization of LC-MS/MS conditions
Mass transitions for saturated and unsaturated AQ congeners were previously identified in Lépine et al [31]. We verified AQ transitions and optimized tuning parameters for each of the authentic AQ standards using Waters Intellistart software (Milford, MA, USA). C7 congeners of AQNO and PQS both exhibit identical m/z transitions of 260.1 > 159.1 and 260.1 > 175.1. Similarly, C9 congeners of AQNO and PQS both share transitions of 288.1 > 159.1 and 288.1 > 175.1. However, AQNOs were distinguishable from PQS congeners based on characteristic retention time (ESM Fig. S1). In addition, AQNOs preferentially fragmented to form product ions with m/z values of 159.1, whereas PQS congeners preferentially fragmented to form product ions with m/z values of 175.1 (ESM Fig. S1). For each of the AQs standards, optimized ionization and detection parameters are listed in ESM Table S2. For analysis of PQS, AHQ, and AQNO molecules with altered chain lengths and degrees of unsaturation, optimized tuning parameters from fully saturated PQS, AHQ, and AQNO standards were used, respectively. Specifically, optimized parameters for fully saturated C7 standards were applied to unsaturated and saturated AQs with chain lengths of 7 carbons or less; optimized parameters for fully saturated C9 standards were applied to unsaturated and saturated AQs with chain length of 8 carbons or more.
We initially used a C18 column for our liquid chromatography-based alkyl quinolone separation, as described in Lepine et al [31]. Application of a linear solvent gradient using a C18 column resulted in long sample runs, however, which were not conducive to analyzing large numbers of samples. We next tested whether a C8 column, which would not retain nonpolar AQs as strongly as a C18 column, would reduce the elution times of the different AQs and thus shorten our run time. Using a linear gradient and an Ascentis Express C8 column, we found we could successfully separate the AQ congeners at faster rates than several other pre-existing methods. In addition, we were able to successfully elute the C11-PQS congener within our linear gradient, which has not been attained by any other existing methods. This liquid chromatography method, therefore, provided an ideal combination of expedience and analyte coverage which has not been demonstrated in previously described methods.
The UPLC solvent system used for AQ analysis was initially described in Ortori et al. and was comprised of 0.1% FA and 200 μM EDTA in water (Solvent A) and 0.1% FA in acetonitrile (Solvent B) [39]. PQS molecules demonstrate substantial chromatographic issues, including excessive peak broadening and peak tailing, without the addition of a metal chelator to the solvent system [35, 39]. PQS is capable of coordinating labile iron, which is hypothesized to result in the observed peak tailing [16, 35]. The addition of chelating agents to the mobile phase is thought to mitigate this effect by limiting contaminating metals, as reported previously [35, 39]. As such, EDTA was incorporated into our assay, as recommended in Ortori et al. With the addition of EDTA, we did not observe peak tailing of PQS, as has been previously reported [35, 39]. Ortori et al. recommended measures to prevent source contamination by the non-volatile EDTA, which were followed for the experiments listed herein. These measures included limiting analytical runs to 120 injections or less prior to cleaning the outer sample cone, and using a flow diverter in between data acquisition windows [39]. While Ortori et al. reported slight ionization suppression of the AQs in the presence of EDTA (> 20% reduction in peak area), we observed that the described solvent system was still able to accurately and precisely measure AQs at concentrations well below those observed in bacterial culture (Table 1 and ESM Table S6). Therefore, the solvent system was deemed acceptable. In addition, there did not appear to be any detrimental effects of EDTA on other methods being performed on the shared-access instrument used in these studies, as had been reported in Turnpenny et al. [35].
Table 1.
Intraday and interday precision and accuracy of six AQ standards at LLOQ, low QC, middle QC, and high QC concentrations. Concentrations of QC samples were determined by comparison of analyte response to calibration curves of each analyte. Accuracy was calculated in 6 biological replicate across 1 day (intraday) or 18 biological replicates across 3 days (interday) by comparison of average calculated concentrations to the expected nominal concentrations for each QC samples. Intraday precision was determined from the coefficient of variance (CV), or relative standard deviation (RSD), of either 6 independent biological replicates (intraday) or 18 biological replicates (interday)
| Accuracy (%) | Precision (%CV) | |||||||
|---|---|---|---|---|---|---|---|---|
| 25 nM (LLOQ) |
50 nM (Low) |
250 nM (Med) |
1000 nM (High) |
25 nM (LLOQ) |
50 nM (Low) |
250 nM (Med) |
1000 nM (High) |
|
| Intraday (n = 6) | ||||||||
| C7PQS | 100.1% | 102.0% | 97.3% | 98.4% | 14.2% | 5.1% | 3.1% | 3.3% |
| C9PQS | 106.1% | 101.6% | 93.7% | 101.3% | 8.1% | 4.8% | 6.1% | 5.3% |
| HHQ | 104.7% | 98.4% | 95.9% | 100.5% | 2.7% | 6.0% | 5.5% | 5.8% |
| NHQ | 107.3% | 99.7% | 93.3% | 101.1% | 4.1% | 8.9% | 7.1% | 7.4% |
| HQNO | 99.8% | 103.7% | 96.0% | 99.5% | 8.4% | 7.4% | 6.9% | 5.2% |
| NQNO | 101.2% | 101.3% | 94.6% | 98.8% | 14.6% | 8.9% | 6.4% | 5.2% |
| Interday (n = 18) | ||||||||
| C7-PQS | 97.4% | 101.4% | 104.0% | 105.9% | 13.0% | 5.2% | 5.6% | 7.0% |
| C9-PQS | 98.3% | 95.6% | 102.2% | 110.8% | 13.6% | 8.9% | 8.2% | 9.3% |
| HHQ | 100.7% | 101.5% | 103.2% | 108.5% | 5.3% | 6.3% | 6.6% | 6.6% |
| NHQ | 94.9% | 96.4% | 99.5% | 106.7% | 13.2% | 10.2% | 6.0% | 5.9% |
| HQNO | 101.1% | 106.2% | 102.7% | 107.5% | 7.2% | 5.8% | 6.4% | 6.7% |
| NQNO | 105.9% | 105.9% | 105.0% | 110.5% | 7.3% | 6.7% | 8.1% | 8.3% |
We selected the quinolone antibiotic, nalidixic acid (NA), as an internal standard due to its structural similarity to the AQ congeners and similar retention time. In clinical settings, nalidixic acid is rarely administered to treat bacterial infections, as safer, more potent alternatives are currently available [43]. As such, there is little risk of extracting residual nalidixic acid from patient samples in future analyses.
Method validation
Selectivity, sensitivity, and linearity
Figure 2 demonstrates the chromatographic separation of the six authentic AQ standards (25 nM LLOQ) and the nalidixic acid internal standard (500 nM) in blank PAO1ΔpqsA matrix at their observed m/z transitions, which are listed in each panel. These transitions were also monitored in blank cellular matrix to confirm the absence of endogenous AQs, nalidixic acid, or non-specific interferences in PAO1∆pqsA strain. There was no significant interfering signal observed for any of the AQ or IS m/z transitions in blank matrix, except for C9-PQS, the peak area of which was greater than 15% of the LLOQ (Fig. 2). It is important to note that the average peak area of this signal was roughly 300 times less than the average peak area of C9-PQS produced by the wild type strain, PAO1. As such, interference of C9-PQS in blank matrix will not likely interfere with practical application of this method for in vitro purposes.
Fig. 2.
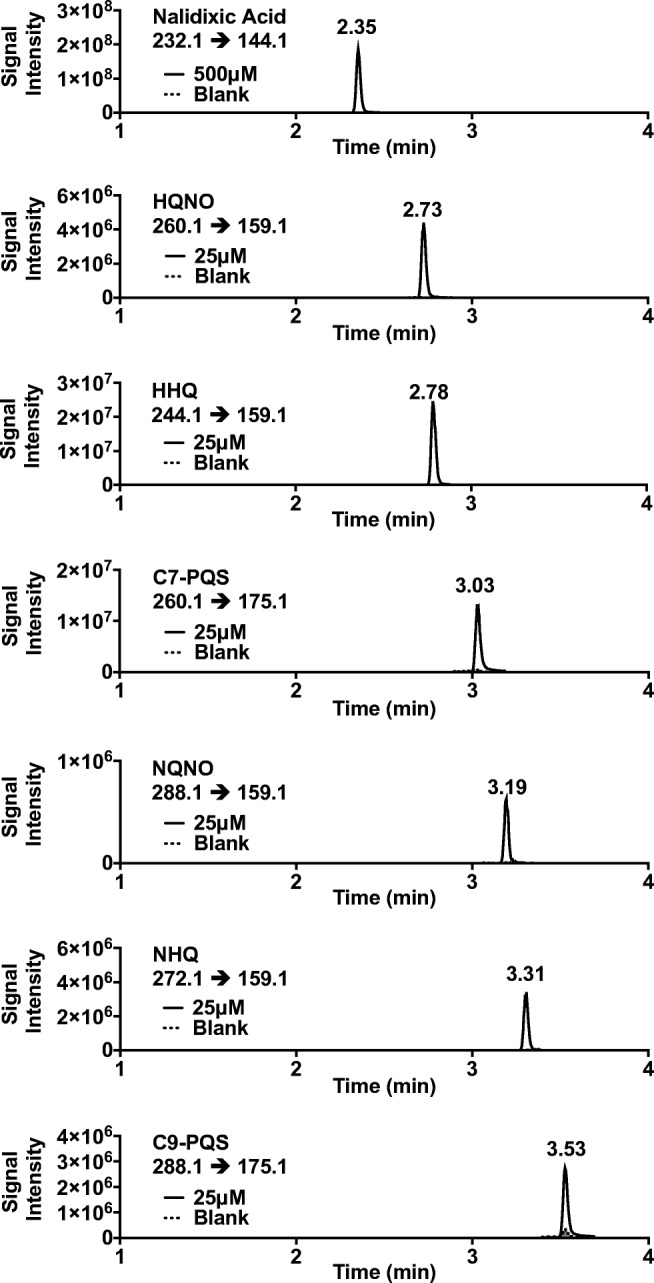
Representative chromatograms of AQ standards (25 nM) and nalidixic acid IS (500 nM) spiked into cell culture of the AQ-deficient strain, PAO1∆pqsA. Chromatograms from spiked samples (solid chromatograms) were collected from LLOQ samples. Peak interference was measured for each transition (dotted chromatograms with gray fill) by analyzing extracts from blank matrix devoid of spiked AQs or IS
Each AQ could be adequately distinguished either by retention time and/or characteristic m/z transition. Sensitivity of the assay, as described in the FDA’s Bioanalytical Method Validation guidance, was characterized through determination of the lowest concentration of each AQ standard that could be quantified with acceptable precision and accuracy, or LLOQ, which is listed in Table 1. The ULOQ was defined as the highest point in the dynamic linear range of an individual analyte that could be quantified with acceptable precision and accuracy. The ULOQ was determined to be 1000 nM for each of the AQs. Calibration curves for each AQ standard demonstrated a dynamic linear range (r2 ≥ 0.995) of 25–1000 nM (Table 2). Limit of detection in this assay was defined as the minimum concentration where the signal-to-noise (S/N) was greater than 3, and was determined to be 5 nM for each of the AQ standards.
Table 2.
Dynamic linear range, recovery, and matrix effects observed for AQ standards at 25 nM (LLOQ), low QC (50 nM), middle QC (250 nM), and high QC (1000 nM) concentrations. Recovery and matrix effects were calculated by comparison of peak areas from pre-extraction spike QC samples (recovery) and post-extraction spike QC samples (matrix effects) with those from QC standards prepared in neat solvent ± coefficient of variation
| Dynamic linear range | % Recovery (±%CV) | % matrix effect (±%CV) | |||||||
|---|---|---|---|---|---|---|---|---|---|
| 25 nM (LLOQ) |
50 nM (Low) |
250 nM (Med) |
1000 nM (High) |
25 nM (LLOQ) |
50 nM (Low) |
250 nM (Med) |
1000 nM (High) |
||
| C7-PQS | 25–1000 nM (R2 = 0.997) | 94.3% ± 2.4% | 105.8% ± 5.0% | 113.4% ± 6.1% | 92.0% ± 1.4% | 78.7% ± 4.7% | 83.1% ± 1.5% | 88.2% ± 3.3% | 84.7% ± 2.8% |
| C9-PQS | 25–1000 nM (R2 = 0.995) | 39.2% ± 4.0% | 55.1% ± 2.2% | 76.5% ± 5.5% | 81.8% ± 2.2% | 76.5% ± 3.6% | 82.8% ± 3.2% | 86.6% ± 3.5% | 83.2% ± 4.5% |
| HHQ | 25–1000 nM (R2 = 0.998) | 41.3% ± 2.8% | 49.3% ± 2.3% | 68.2% ± 3.9% | 81.9% ± 4.8% | 83.3% ± 2.3% | 85.1% ± 1.53% | 87.1% ± 2.9% | 86.5% ± 4.6% |
| NHQ | 25–1000 nM (R2 = 0.998) | 68.7% ± 5.7% | 80.1% ± 7.0% | 80.0% ± 2.1% | 83.8% ± 4.9% | 129.5% ± 10.5% | 129.0% ± 6.4% | 123.1% ± 5.6% | 122.1% ± 5.0% |
| HQNO | 25–1000 nM (R2 = 0.997) | 100.9% ± 4.3% | 98.8% ± 3.9% | 103.0% ± 5.6% | 89.3% ± 5.6% | 16.0% ± 1.6% | 33.6% ± 1.8% | 67.1% ± 2.3% | 78.3% ± 3.7% |
| NQNO | 25–1000 nM (R2 = 0.997) | 78.0% ± 4.0% | 85.6% ± 3.6% | 93.7% ± 4.1% | 80.2% ± 2.4% | 18.3% ± 1.7% | 40.7% ± 2.4% | 74.5% ± 4.2% | 90.2% ± 5.0% |
Precision and accuracy
The intraday and interday precision and accuracy values of the various AQs are compiled in Table 1. The calculated average concentrations of QC samples ranged from 94.6 to 107.3% of nominal concentrations for intraday samples, and between 94.9 and 110.8% for interday samples. Accuracy for both intraday and interday samples was within the acceptable range of 85.0–115.0%. Average precision (%CV) of the QC samples at the LLOQ ranged from 14.6 to 2.7% for intraday analysis and between 13.6 and 5.3% for interday analysis. These values are within the acceptable range of 0.0–20.0% CV for QC samples at the LLOQ. Average precision for low QC, medium QC, and high QC samples ranged between 3.1 and 8.9% CV for intraday analysis and between 5.2 and 10.2% CV for interday analysis. These precision values for intraday and interday analysis were within the acceptable ranges of 0.0 to 15.0% CV for low QC, medium QC, and high QC samples.
Recovery and matrix effects
Recovery of AQ standards from blank ∆pqsA matrix ranged from 39.2 to 113.4% across the LLOQ, low QC, med QC, and high QC samples (Table 2). AQs are known to interact or embed in lipid bilayers, which may account for lower recovery values of some AQ standards, notably C9-PQS and HHQ [44–47]. Additionally, as low recoveries were most pronounced at low concentrations, AQ adherence to surfaces during sample preparation may play a role. Low recoveries due to surface adherence can be exacerbated at low concentration [48]. Matrix effects were also variable among the different AQ standards, ranging from 16.0 to 129.5% (Table 2). These results indicate that ionization is impacted for several AQ standards in the presence of the complex cellular matrix. The recovery efficiency and matrix effects observed in this assay preclude accurate quantitation of unknown samples using a calibration curve prepared in neat solvent. As a result, it is highly recommended that matrix matched calibration curves be prepared in cellular matrix (pre-extraction spike) prior to analysis. In doing so, accurate quantitation of AQs will not be adversely affected by matrix effects and recovery efficiency [49, 50].
Stability
The stability of AQ standards across a number of different handling and storage conditions, including freeze-thaw stability, bench-top stability (6 h and 24 h), long-term storage stability, and autosampler stability, is detailed in ESM Tables S3, S4, and S5.
Average autosampler stability, which measures stability of processed samples after incubation for 24 h in the 4 °C autosampler, ranged from 91.4 to 114.2% for LLOQ QC samples and from 99.2 to 110.0% for high QC samples (ESM Table S3). Moreover, processed sample stability, which assesses the stability of processed samples after incubation in the 4 °C autosampler against freshly prepared QC samples, ranged from 88.3 to 106.0% in LLOQ samples and from 94.4 to 98.3% in high QC samples (ESM Table S3). Long-term stability (1 month) at − 80 °C ranged from 86.3 to 115.3% in LLOQ samples and from 101.9 to 112.2% in High QC samples (ESM Table S4). Stability of the six AQ standards over three freeze-thaw cycles ranged from 85.2 to 89.8% in LLOQ QC samples and from 84.1 to 89.8% in high QC samples (ESM Table S4). Stability under each of these storage conditions was considered acceptable, as the accuracy of LLOQ samples was within ± 20% of nominal concentration and high QC samples are within ± 15.0% of nominal concentrations. As such, these results together indicate that processed samples exhibit acceptable stability under a number of relevant storage conditions.
However, bench-top stability, which measures stability of the analytes in cellular matrix prior to extraction, was found to be unsuitable at the two time points tested. C9-PQS, HHQ, NHQ, and NQNO had concentration deviations that exceeded the acceptable range of ± 15% at room temperature for 24 h. Similarly, HHQ, NHQ, HQNO, and NQNO had concentration deviations that exceeded 15% at room temperature for 6 h. It is therefore advised that samples be processed immediately at the desired timepoint in order to facilitate accurate quantitation.
Dilution integrity
Six QC replicates containing all six AQ standards were prepared above the ULOQ and were diluted to a concentration of 750 nM in blank ∆pqsA cell culture. When diluted, these samples exhibited accuracy ranging from 99.2 to 105.2% compared to fresh QC samples (n = 6) prepared at the nominal concentration (ESM Table S5). These values fall within the acceptable range of 85.0–115.0% accuracy, indicating that AQs prepared above the ULOQ can be reliably quantified when diluted.
Application
Iron deprivation enhances AQ concentrations in P. aeruginosa cultures
AQ production is indirectly regulated by iron homeostasis mechanisms in P. aeruginosa, and previous analyses using semi-quantitative analytical methods have indicated that iron-deplete conditions induce AQ production [7, 38]. To substantiate these previous results, we quantified AQs, focusing on the fully saturated C7 and C9 AQs grown under low or high iron conditions using the quantitative method validated above. The wild-type PAO1 strain and the AQ-deficient PAO1∆pqsA mutant were grown in DTSB media and supplemented with either 100 μM iron (high iron) or with 0 μM iron (low iron). These iron concentrations are not only reflective of physiologically relevant concentrations observed in the host during infection, but are shown to induce robust iron regulatory responses in P. aeruginosa [7, 19, 51, 52]. The results of these experiments are shown in Fig. 3 and ESM Table S6. Similar to previous analyses, we observed statistically significant increases in concentrations of all AQs in wild type cultures grown in low iron media ranging from 1.2-fold to 3.3-fold. The PAO1∆pqsA strain did not produce AQ congeners above the LLOQ, regardless of iron supplementation, verifying that deletion of the pqsA gene prevents AQ production.
Fig. 3.

Concentrations of AQs produced by P. aeruginosa in low iron conditions and high iron conditions. P. aeruginosa strains were inoculated into dialysed trypticase soy broth media (DTSB) supplemented with either 0 μM FeCl3 (low iron) or 100 μM FeCl3 (high iron), and incubated in shaking conditions for 18 h at 37 °C. Cultures were diluted 40× in sterile media prior to extraction as described in Materials and Methods. Bars in each graph indicate the average value, individual data points represent individual biological replicates. Error bars indicate standard deviation of six independent experiments. Asterisks indicate a significant difference as determined by a two-tailed Student’s t test with a significance threshold of *p ≤ 0.05
Detection and quantitation of AQs with altered alkyl chain lengths and saturation
Authentic standards were used in this validation to characterize the analytical performance of six AQ congeners. These six congeners represent only a small portion of the numerous AQs produced by P. aeruginosa, however, and over 50 distinct AQs have been observed in P. aeruginosa cultures [31]. These 50+ congeners can be categorized into three primary AQ groups: PQS, AHQs, and AQNOs. The various PQS molecules are differentiated from one another by the length and saturation of their alkyl chains; the same trend applies for AHQ and the AQNO molecules. Due to the similarity in structure among each respective AQ groupings, we have assumed that the analytical performances of the other saturated and unsaturated AQ congeners will be comparable to those of the six fully saturated authentic standards used to validate this method. This assumption is supported by prior literature, in which saturated and unsaturated AQs were quantified using calibration curves constructed from isotopically labeled C7 AQs [31]. Based on this assumption, we quantified numerous saturated and unsaturated AQ congeners in low iron and high iron conditions using calibration curves constructed for the fully saturated C7 and C9 congeners, the results of which are listed in ESM Table S6. To do so, we compared analyte responses of all altered AQs with chain lengths of 7 or less to calibration curves of the fully saturated C7 congeners, while those of AQs with chains lengths of 8 carbons or more were compared to calibration curves for fully saturated C9 congeners. Chromatograms of saturated and unsaturated AQ congeners are shown in ESM Figs. S2 and S3. For unsaturated AHQ cis and trans forms of the unsaturated congeners eluted at close proximity to one another, forming two distinct peaks with no baseline resolution (ESM Fig. S3). For these congeners, peak areas were integrated as one, comprising the combined areas of both cis and trans forms of the molecule. Relative elution time of AQs with altered alkyl chain lengths or degrees of unsaturation corresponded proportionally to elution times described in Lepine et al. [31]. In total, we quantified 22 AQ congeners with altered chain lengths and/or unsaturated alkyl chains. Average concentrations of unsaturated AQ congeners were greater in low iron cultures than in high iron cultures, ranging from 33 nM to 3.0 μM in low iron conditions and from <LLOQ to 1.0 μM in high iron conditions. Average concentrations of fully saturated AQs were also enhanced in low iron, ranging from 25 nM to 1.7 μM in low iron and from <LLOQ to 1.0 μM. These results demonstrate that iron deprivation enhances production of all measured AQ congeners and further suggests that AQs may also have a biological function in iron-depleted conditions. It is unclear, however, how these other AQs may contribute to infection in the iron-limiting host environment.
Detection and quantitation of AQs in a murine lung infection model
Previous studies have demonstrated that certain AQs, specifically AHQs, are readily detected in the sputum of cystic fibrosis patients suffering from P. aeruginosa lung infections; concentrations of NHQ have even been shown to correlate to patient disease progression [36, 37]. These studies suggest that AQs play a significant role during lung infections, although little is known about their relative contributions. Mouse models have facilitated the study of acute and chronic P. aeruginosa lung infections [21–23]. However, in order to study the impact of individual AQs, there is a need for accurate and precise methods for detecting and quantifying these molecules in tissue samples. As such, we applied the validated method described above to test whether AQs could be quantified in uninfected CD1 mice (n = 10) and mice infected with wild type P. aeruginosa PAO1 (n = 6). Despite high concentrations of AQs observed in cell culture, we did not observe C7-PQS, HHQ, HQNO, or NQNO in any of the infected mice. NHQ, however, was present in concentrations ranging from <LLOQ to 6770 nM. C9-PQS was detected in two of the infected mice, yet levels were below the lower limit of quantitation (ESM Table S7). We compared NHQ concentrations in infected mouse lung to bacterial burden in the lung (ESM Table S8), however there was no strong correlation between bacterial burden and AQ concentrations observed in mouse lungs (R2 = 0.34). Interestingly, HHQ was detected in one of the uninfected mouse lungs at a concentration of 25 nM. It is unclear whether this is due to matrix interference, or whether endogenous bacterial populations in the uninfected lung may have produced HHQ at these concentrations.
Similar to cell culture matrix, recovery of the certain AQs from lung tissue was variable, ranging from 12.8 to 224.7% recovery (ESM Table S9). C7-PQS and C9-PQS exhibited the most variable recovery from tissue, ranging from 15.41 to 101.9%. HHQ and NHQ had the most efficient extraction ranging from 84.24 to 130.57%, except for LLOQ QC samples, which display some interference (224% recovery). HQNO and NQNO had similar recoveries ranging from 12.84 to 42.23%. In addition, matrix effects in lung tissues were significant, ranging from 41.6 to 119.0%. These results suggest that matrix matched calibration curves should be used and further optimization may be required for improved accuracy of quantitation of the different AQs in lung tissue, particularly PQS and AQNO congeners.
Discussion
We have developed and validated an LC-MS/MS method for quantifying concentrations of AQ in in bacterial cell culture according to the FDA Bioanalytical Method Development Guidance for Industry [42]. The validation experiments detailed herein are intended to characterize technical properties of the various AQs that have not been previously reported in the literature, including bench-top stability, autosampler stability, and freeze-thaw stability. Moreover, the current method features improved chromatography and coverage of the different quinolone congeners compared to other existing methods. Importantly, we characterized each of these validation parameters in a biologically relevant cell culture matrix comprised of the AQ-deficient P. aeruginosa strain, ∆pqsA. As demonstrated above, this has helped to identify limitations in bacterial cell extraction that have not been explored in prior works. For instance, we observe that HHQ, NHQ, NQNO, and C9-PQS all exhibit poor recovery values from cell culture in one or more QC concentration. These findings are similar to those reported in Ortori et al. wherein they reported poor recovery of C7- and C9-PQS from sterile media [35, 39]. However, we observe that the blank ∆pqsA cell culture used in the current report exhibited more complex matrix effects than sterile media, suggesting that the presence of bacterial cells may exert additional confounding effects on analyte recovery and performance. In support of this, recent studies have demonstrated that PQS integrates into the lipid bilayer of P. aeruginosa, and that AHQ molecules readily interact with outer membrane components [44–46]. AQNOs, as well, are shown to interact with membrane-embedded cytochrome bc1 complex in P. aeruginosa [47]. We anticipate, therefore, that the ability of these molecules to embed into lipid membranes and/or adhere to surfaces may alter recovery efficiency of AQs from cell culture and other complex matrices, especially at low concentration. Indeed, we observed variable recovery of the AQ congeners when extracted from mouse lung tissue, as well, suggesting that matrix effects are a significant limitation to accurate quantitation. As a result, it is imperative that matrix matched calibration samples are prepared in cellular culture (or otherwise relevant biological matrix) in order to correct for matrix effects and recovery efficiency of the AQ species, and to ensure accurate and precise quantitation of AQs in unknown samples [49, 50].
In this validation, we chose ∆pqsA cell culture as a relevant blank matrix for our calibration samples, as it most closely reflects the matrix that is used in our ongoing studies of P. aeruginosa AQ production. It is a clean deletion mutant in a PAO1 background, meaning that it possesses all of the cellular structures and physiology of P. aeruginosa, but produces virtually no AQs. Interestingly, we observed background signal at the retention time and mass transition corresponding to C9-PQS in this matrix. Because the ∆pqsA mutant is a clean deletion that lacks the requisite enzyme for PQS production, it is unclear what could account for this background signal. It is possible that this signal is derived from contamination in the culture media by wild-type P. aeruginosa, although the presence of this signal across multiple independent biological replicates at consistent signal intensity would suggest this is not the case. Alternately, it may be the result of interference from an unrelated product ion, although further study would be required to verify this. In any case, peak intensity of this transition in blank matrix was less than in LLOQ QC samples (< 25% peak intensity), and the peak intensity of this molecule in blank matrix was roughly 100× less than the lowest AQ peak intensity observed in P. aeruginosa wild-type culture. As such, this interference will not dramatically skew analyses of AQs in bacterial culture. By characterizing these analytical performance parameters in cellular matrix, our approach will allow for confident and robust quantification during relevant experimental conditions.
In this validation, we have identified the quinolone drug, nalidixic acid, as a useful internal standard for AQ quantitation. While stable isotope-labeled internal standards are ideal for quantitative LC-MS/MS assays, synthesizing or purchasing stable isotope forms of each AQ congeners is highly impractical. To circumvent this issue, we used nalidixic acid due to its cost-efficiency, structural similarity to AQs, and similar retention time. By doing so, we are able to precisely and accurately quantitate AQ concentrations in cell culture despite changes in instrument performance over time. We then applied this quantitative method to measure AQs in P. aeruginosa cultures grown in conditions of either high or low iron availability. Previous analyses have demonstrated this phenomenon using semi-quantitative methods [7]. However, the methods used in these previous studies measured only relative concentrations and could not correct for variations in instrument performance. Therefore, the data provided in the present report represents the strongest evidence yet that AQ production is enhanced in low iron, presumably as part of the iron acquisition strategy of P. aeruginosa. We also observed that concentrations of non-traditional AQ congeners are enhanced in low iron conditions as well, which has not been previously demonstrated. While these altered AQ congeners are present at lower concentrations than the fully saturated C7 and C9 forms, studies have indicated that quinolone molecules with altered alkyl chains can exhibit heightened biological activity relative to their fully saturated C7 or C9 counterparts [32, 53]. Therefore, the concentrations of these AQ congeners may not be reflective of their relative biological significance.
P. aeruginosa is one of the most common causes of respiratory infection in nosocomial environments [54–57], and significant effort has been put towards understanding P. aeruginosa virulence and survival during these infections. In vitro studies indicate that AQs play a significant role in quorum signaling and electron transport inhibition, and reports have shown that deletion of the AQ regulator pqsR attenuates P. aeruginosa virulence in an acute murine lung infection model [58]. These reports suggest AQs may contribute significantly to disease state. However, there have been no published studies testing the direct impact of AQs during acute or chronic lung infection, to the best of our knowledge. In addition, no analytical methods have been reported that can quantitate all C7 and C9 AQ congeners in lung tissue. While Turnpenny et al. reported a viable, efficient method for quantitation of HHQ and C7-PQS in mouse lung, there is still need of comprehensive methods for the quantitation of AQNOs, C9-PQS, NHQ, and other AQ congeners in lung tissue. To address this gap in knowledge, we applied the LC-MS/MS method described above to quantitation of AQ congeners in lung tissue excised from PAO1-infected mice, to determine whether this method would be suitable to in vivo studies of AQ production and function during lung infection. As described above, we were able to quantify NHQ in homogenized lung tissue. While we did not observe strong correlation between NHQ concentrations and bacterial burden in these mouse lungs, we did observe generally higher concentrations of NHQ in the more densely colonized male mice (ESM Tables S7 and S8). A possible correlation between these two variables in mouse lungs may be more perceptible upon further optimization of this method for analysis in lung tissues. To the best of our knowledge, this is the first reported instance of quantifiable AQs in infected murine lung tissue. However, the relative recovery efficiencies of the different AQs were highly variable across different QC concentrations and were often very low (< 20%). Considering that concentrations of AQs are already hypothesized to be very low in lung tissue as a result of rapid clearance [35], further optimization will be required in order to reliably quantitate each of the AQ congeners in homogenized lung. Attempts to optimize this method for in vivo use were not included in this report, however, as it fell outside the scope of the current study objectives. It should be noted that the non-detectable results for AQs in lung tissue reported in ESM Table S7 is possibly due to a low bacterial burden in the lung tissue assayed, not due to analytical challenges. In these samples, the bacterial burden ranges from 3.5e2 to 1.3e4 CFU (ESM Table S8) as compared to the cell culture studies which were typically 2.5e9 or 1.3e10 CFU/ml, which is 5–8 orders of magnitude higher than the bacterial burden in the lung.
While AQ concentrations are thought to be relatively low in P. aeruginosa-infected lung tissue [35], AQs are produced in relatively high concentrations in P. aeruginosa bacterial cultures (ESM Fig. S6). In fact, the method herein accurately quantitates AQs at concentrations well below those observed in vitro (Table 1 and Fig. 3). These results are consistent with previous in vitro studies of AQ concentrations, which report concentrations of C7 and C9 AQs above the LLOQ of this assay [31, 39]. Because of the high abundances of these AQ in vitro, variable recovery efficiency from bacterial culture (Table 2) does not limit the utility of this method for in vitro AQ analysis as long as calibration standards are prepared in similar biological matrix.
Conclusions
Herein, we demonstrate a LC-MS/MS assay for the simultaneous quantitation of alkyl quinolones in bacterial culture, which was developed and validated according to the FDA Bioanalytical Method Validation Guidance for Industry [42]. Method validation experiments were performed in a relevant cellular matrix comprised of an AQ-depleted ∆pqsA P. aeruginosa strain. The validated assay was applied to the quantitation of AQs in cultures of P. aeruginosa grown in either low or high iron conditions, and also to the quantitation of AQs in lung tissue from wild type P. aeruginosa PAO1-infected and uninfected mice. Moreover, we applied this validated method to the quantitation of AQs with altered chain lengths and degree of unsaturation in bacterial culture, which are significantly induced by iron starvation. This method provides framework for future studies of the diverse AQs produced by P. aeruginosa, and how AQ production contributes to the dynamic response of P. aeruginosa to different growth environments. However, the utility of this method for the measurement of AQs in lung tissue is limited, and we highlight the need for optimized protocols for AQ analysis in this matrix.
Electronic supplementary material
(PDF 419 kb)
Funding information
This work was funded in parts by the National Institutes of Health (NIH) grant entitled “Role of PrrF and PrrH regulation in P. aeruginosa pathogenesis” (project number RO1AI123320-01A1), and NIH training grant entitled, “Graduate Training at the Chemistry Biology Interface” (T32 GM066706-11). This work was also supported in part by the University of Maryland, School of Pharmacy Mass Spectrometry Center (SOP1841-IQB2014).
Compliance with ethical standards
Animal experiments were performed in accordance with the National Institute of Health Guide for the care and use of laboratory animals. The protocol used was approved by the West Virginia University Animal Care and Use Committee (WVU-ACUC protocol 1602000070).
Conflict of interest
The authors declare that they have no conflicts of interest.
Footnotes
Publisher’s note
Springer Nature remains neutral with regard to jurisdictional claims in published maps and institutional affiliations.
References
- 1.Ciofu O, Hansen CR, Hoiby N. Respiratory bacterial infections in cystic fibrosis. Curr Opin Pulm Med. 2013;19(3):251–258. doi: 10.1097/MCP.0b013e32835f1afc. [DOI] [PubMed] [Google Scholar]
- 2.Kerem E, Corey M, Gold R, Levison H. Pulmonary function and clinical course in patients with cystic fibrosis after pulmonary colonization with Pseudomonas aeruginosa. J Pediatr. 1990;116(5):714–719. doi: 10.1016/S0022-3476(05)82653-8. [DOI] [PubMed] [Google Scholar]
- 3.Koch C. Early infection and progression of cystic fibrosis lung disease. Pediatr Pulmonol. 2002;34(3):232–236. doi: 10.1002/ppul.10135. [DOI] [PubMed] [Google Scholar]
- 4.Paganin P, Fiscarelli EV, Tuccio V, Chiancianesi M, Bacci G, Morelli P, Dolce D, Dalmastri C, De Alessandri A, Lucidi V, Taccetti G, Mengoni A, Bevivino A. Changes in cystic fibrosis airway microbial community associated with a severe decline in lung function. PLoS One. 2015;10(4):e0124348. doi: 10.1371/journal.pone.0124348. [DOI] [PMC free article] [PubMed] [Google Scholar]
- 5.Salsgiver EL, Fink AK, Knapp EA, LiPuma JJ, Olivier KN, Marshall BC, Saiman L. Changing epidemiology of the respiratory bacteriology of patients with cystic fibrosis. Chest. 2016;149(2):390–400. doi: 10.1378/chest.15-0676. [DOI] [PMC free article] [PubMed] [Google Scholar]
- 6.Collier DN, Anderson L, McKnight SL, Noah TL, Knowles M, Boucher R, Schwab U, Gilligan P, Pesci EC. A bacterial cell to cell signal in the lungs of cystic fibrosis patients. FEMS Microbiol Lett. 2002;215(1):41–46. doi: 10.1111/j.1574-6968.2002.tb11367.x. [DOI] [PubMed] [Google Scholar]
- 7.Nguyen AT, Jones JW, Ruge MA, Kane MA, Oglesby-Sherrouse AG. Iron depletion enhances production of antimicrobials by Pseudomonas aeruginosa. J Bacteriol. 2015;197(14):2265–2275. doi: 10.1128/JB.00072-15. [DOI] [PMC free article] [PubMed] [Google Scholar]
- 8.Van Ark G, Berden JA. Binding of HQNO to beef-heart sub-mitochondrial particles. Biochim Biophys Acta. 1977;459(1):119–127. doi: 10.1016/0005-2728(77)90014-7. [DOI] [PubMed] [Google Scholar]
- 9.Musken M, Di Fiore S, Dotsch A, Fischer R, Haussler S. Genetic determinants of Pseudomonas aeruginosa biofilm establishment. Microbiology. 2010;156(Pt 2):431–441. doi: 10.1099/mic.0.033290-0. [DOI] [PubMed] [Google Scholar]
- 10.Kim K, Kim YU, Koh BH, Hwang SS, Kim SH, Lepine F, Cho YH, Lee GR. HHQ and PQS, two Pseudomonas aeruginosa quorum-sensing molecules, down-regulate the innate immune responses through the nuclear factor-kappaB pathway. Immunology. 2010;129(4):578–588. doi: 10.1111/j.1365-2567.2009.03160.x. [DOI] [PMC free article] [PubMed] [Google Scholar]
- 11.Deziel E, Lepine F, Milot S, He J, Mindrinos MN, Tompkins RG, Rahme LG. Analysis of Pseudomonas aeruginosa 4-hydroxy-2-alkylquinolines (HAQs) reveals a role for 4-hydroxy-2-heptylquinoline in cell-to-cell communication. Proc Natl Acad Sci U S A. 2004;101(5):1339–1344. doi: 10.1073/pnas.0307694100. [DOI] [PMC free article] [PubMed] [Google Scholar]
- 12.Reen FJ, Mooij MJ, Holcombe LJ, McSweeney CM, McGlacken GP, Morrissey JP, O'Gara F. The Pseudomonas quinolone signal (PQS), and its precursor HHQ, modulate interspecies and interkingdom behaviour. FEMS Microbiol Ecol. 2011;77(2):413–428. doi: 10.1111/j.1574-6941.2011.01121.x. [DOI] [PubMed] [Google Scholar]
- 13.Diggle SP, Matthijs S, Wright VJ, Fletcher MP, Chhabra SR, Lamont IL, Kong X, Hider RC, Cornelis P, Camara M, Williams P. The Pseudomonas aeruginosa 4-quinolone signal molecules HHQ and PQS play multifunctional roles in quorum sensing and iron entrapment. Chem Biol. 2007;14(1):87–96. doi: 10.1016/j.chembiol.2006.11.014. [DOI] [PubMed] [Google Scholar]
- 14.Pesci EC, Milbank JB, Pearson JP, McKnight S, Kende AS, Greenberg EP, Iglewski BH. Quinolone signaling in the cell-to-cell communication system of Pseudomonas aeruginosa. Proc Natl Acad Sci U S A. 1999;96(20):11229–11234. doi: 10.1073/pnas.96.20.11229. [DOI] [PMC free article] [PubMed] [Google Scholar]
- 15.Rampioni G, Falcone M, Heeb S, Frangipani E, Fletcher MP, Dubern JF, Visca P, Leoni L, Camara M, Williams P. Unravelling the genome-wide contributions of specific 2-alkyl-4-quinolones and PqsE to quorum sensing in Pseudomonas aeruginosa. PLoS Pathog. 2016;12(11):e1006029. doi: 10.1371/journal.ppat.1006029. [DOI] [PMC free article] [PubMed] [Google Scholar]
- 16.Bredenbruch F, Geffers R, Nimtz M, Buer J, Haussler S. The Pseudomonas aeruginosa quinolone signal (PQS) has an iron-chelating activity. Environ Microbiol. 2006;8(8):1318–1329. doi: 10.1111/j.1462-2920.2006.01025.x. [DOI] [PubMed] [Google Scholar]
- 17.Filkins LM, Graber JA, Olson DG, Dolben EL, Lynd LR, Bhuju S, O'Toole GA. Coculture of Staphylococcus aureus with Pseudomonas aeruginosa drives S. aureus towards fermentative metabolism and reduced viability in a cystic fibrosis model. J Bacteriol. 2015;197(14):2252–2264. doi: 10.1128/JB.00059-15. [DOI] [PMC free article] [PubMed] [Google Scholar]
- 18.Mashburn LM, Jett AM, Akins DR, Whiteley M. Staphylococcus aureus serves as an iron source for Pseudomonas aeruginosa during in vivo coculture. J Bacteriol. 2005;187(2):554–566. doi: 10.1128/JB.187.2.554-566.2005. [DOI] [PMC free article] [PubMed] [Google Scholar]
- 19.Diggle CP, Sukoff Rizzo SJ, Popiolek M, Hinttala R, Schulke JP, Kurian MA, Carr IM, Markham AF, Bonthron DT, Watson C, Sharif SM, Reinhart V, James LC, Vanase-Frawley MA, Charych E, Allen M, Harms J, Schmidt CJ, Ng J, Pysden K, Strick C, Vieira P, Mankinen K, Kokkonen H, Kallioinen M, Sormunen R, Rinne JO, Johansson J, Alakurtti K, Huilaja L, Hurskainen T, Tasanen K, Anttila E, Marques TR, Howes O, Politis M, Fahiminiya S, Nguyen KQ, Majewski J, Uusimaa J, Sheridan E, Brandon NJ. Biallelic mutations in PDE10A lead to loss of striatal PDE10A and a hyperkinetic movement disorder with onset in infancy. Am J Hum Genet. 2016;98(4):735–743. doi: 10.1016/j.ajhg.2016.03.015. [DOI] [PMC free article] [PubMed] [Google Scholar]
- 20.Deziel E, Gopalan S, Tampakaki AP, Lepine F, Padfield KE, Saucier M, Xiao G, Rahme LG. The contribution of MvfR to Pseudomonas aeruginosa pathogenesis and quorum sensing circuitry regulation: multiple quorum sensing-regulated genes are modulated without affecting lasRI, rhlRI or the production of N-acyl-L-homoserine lactones. Mol Microbiol. 2005;55(4):998–1014. doi: 10.1111/j.1365-2958.2004.04448.x. [DOI] [PubMed] [Google Scholar]
- 21.Xiao G, Deziel E, He J, Lepine F, Lesic B, Castonguay MH, Milot S, Tampakaki AP, Stachel SE, Rahme LG. MvfR, a key Pseudomonas aeruginosa pathogenicity LTTR-class regulatory protein, has dual ligands. Mol Microbiol. 2006;62(6):1689–1699. doi: 10.1111/j.1365-2958.2006.05462.x. [DOI] [PubMed] [Google Scholar]
- 22.Gallagher LA, McKnight SL, Kuznetsova MS, Pesci EC, Manoil C. Functions required for extracellular quinolone signaling by Pseudomonas aeruginosa. J Bacteriol. 2002;184(23):6472–6480. doi: 10.1128/JB.184.23.6472-6480.2002. [DOI] [PMC free article] [PubMed] [Google Scholar]
- 23.Cao H, Krishnan G, Goumnerov B, Tsongalis J, Tompkins R, Rahme LG. A quorum sensing-associated virulence gene of Pseudomonas aeruginosa encodes a LysR-like transcription regulator with a unique self-regulatory mechanism. Proc Natl Acad Sci U S A. 2001;98(25):14613–14618. doi: 10.1073/pnas.251465298. [DOI] [PMC free article] [PubMed] [Google Scholar]
- 24.Dulcey CE, Dekimpe V, Fauvelle DA, Milot S, Groleau MC, Doucet N, Rahme LG, Lepine F, Deziel E. The end of an old hypothesis: the pseudomonas signaling molecules 4-hydroxy-2-alkylquinolines derive from fatty acids, not 3-ketofatty acids. Chem Biol. 2013;20(12):1481–1491. doi: 10.1016/j.chembiol.2013.09.021. [DOI] [PMC free article] [PubMed] [Google Scholar]
- 25.Bera AK, Atanasova V, Robinson H, Eisenstein E, Coleman JP, Pesci EC, Parsons JF. Structure of PqsD, a Pseudomonas quinolone signal biosynthetic enzyme, in complex with anthranilate. Biochemistry. 2009;48(36):8644–8655. doi: 10.1021/bi9009055. [DOI] [PMC free article] [PubMed] [Google Scholar]
- 26.Drees SL, Li C, Prasetya F, Saleem M, Dreveny I, Williams P, Hennecke U, Emsley J, Fetzner S. PqsBC, a condensing enzyme in the biosynthesis of the Pseudomonas aeruginosa quinolone signal: crystal structure, inhibition, and reaction mechanism. J Biol Chem. 2016;291(13):6610–6624. doi: 10.1074/jbc.M115.708453. [DOI] [PMC free article] [PubMed] [Google Scholar]
- 27.Bredenbruch F, Nimtz M, Wray V, Morr M, Muller R, Haussler S. Biosynthetic pathway of Pseudomonas aeruginosa 4-hydroxy-2-alkylquinolines. J Bacteriol. 2005;187(11):3630–3635. doi: 10.1128/JB.187.11.3630-3635.2005. [DOI] [PMC free article] [PubMed] [Google Scholar]
- 28.Zhang YM, Frank MW, Zhu K, Mayasundari A, Rock CO. PqsD is responsible for the synthesis of 2,4-dihydroxyquinoline, an extracellular metabolite produced by Pseudomonas aeruginosa. J Biol Chem. 2008;283(43):28788–28794. doi: 10.1074/jbc.M804555200. [DOI] [PMC free article] [PubMed] [Google Scholar]
- 29.Pistorius D, Ullrich A, Lucas S, Hartmann RW, Kazmaier U, Muller R. Biosynthesis of 2-alkyl-4(1H)-quinolones in Pseudomonas aeruginosa: potential for therapeutic interference with pathogenicity. Chembiochem. 2011;12(6):850–853. doi: 10.1002/cbic.201100014. [DOI] [PubMed] [Google Scholar]
- 30.Drees SL, Ernst S, Belviso BD, Jagmann N, Hennecke U, Fetzner S. PqsL uses reduced flavin to produce 2-hydroxylaminobenzoylacetate, a preferred PqsBC substrate in alkyl quinolone biosynthesis in Pseudomonas aeruginosa. J Biol Chem. 2018;293(24):9345–9357. doi: 10.1074/jbc.RA117.000789. [DOI] [PMC free article] [PubMed] [Google Scholar]
- 31.Lepine F, Milot S, Deziel E, He J, Rahme LG. Electrospray/mass spectrometric identification and analysis of 4-hydroxy-2-alkylquinolines (HAQs) produced by Pseudomonas aeruginosa. J Am Soc Mass Spectrom. 2004;15(6):862–869. doi: 10.1016/j.jasms.2004.02.012. [DOI] [PubMed] [Google Scholar]
- 32.Szamosvari D, Bottcher T. An unsaturated quinolone N-oxide of Pseudomonas aeruginosa modulates growth and virulence of Staphylococcus aureus. Angew Chem Int Ed Engl. 2017;56(25):7271–7275. doi: 10.1002/anie.201702944. [DOI] [PubMed] [Google Scholar]
- 33.Lightbown JW, Jackson FL. Inhibition of cytochrome systems of heart muscle and certain bacteria by the antagonists of dihydrostreptomycin: 2-alkyl-4-hydroxyquinoline N-oxides. Biochem J. 1956;63(1):130–137. doi: 10.1042/bj0630130. [DOI] [PMC free article] [PubMed] [Google Scholar]
- 34.Palmer GC, Schertzer JW, Mashburn-Warren L, Whiteley M. Quantifying Pseudomonas aeruginosa quinolones and examining their interactions with lipids. Methods Mol Biol. 2011;692:207–217. doi: 10.1007/978-1-60761-971-0_15. [DOI] [PMC free article] [PubMed] [Google Scholar]
- 35.Turnpenny P, Padfield A, Barton P, Teague J, Rahme LG, Pucci MJ, Zahler R, Rubio A. Bioanalysis of Pseudomonas aeruginosa alkyl quinolone signalling molecules in infected mouse tissue using LC-MS/MS; and its application to a pharmacodynamic evaluation of MvfR inhibition. J Pharm Biomed Anal. 2017;139:44–53. doi: 10.1016/j.jpba.2017.02.034. [DOI] [PubMed] [Google Scholar]
- 36.Barr HL, Halliday N, Barrett DA, Williams P, Forrester DL, Peckham D, Williams K, Smyth AR, Honeybourne D, Whitehouse JL, Nash EF, Dewar J, Clayton A, Knox AJ, Camara M, Fogarty AW. Diagnostic and prognostic significance of systemic alkyl quinolones for P. aeruginosa in cystic fibrosis: a longitudinal study; response to comments. J Cyst Fibros. 2017;16(6):e21. doi: 10.1016/j.jcf.2017.09.008. [DOI] [PubMed] [Google Scholar]
- 37.Barr HL, Halliday N, Camara M, Barrett DA, Williams P, Forrester DL, Simms R, Smyth AR, Honeybourne D, Whitehouse JL, Nash EF, Dewar J, Clayton A, Knox AJ, Fogarty AW. Pseudomonas aeruginosa quorum sensing molecules correlate with clinical status in cystic fibrosis. Eur Respir J. 2015;46(4):1046–1054. doi: 10.1183/09031936.00225214. [DOI] [PMC free article] [PubMed] [Google Scholar]
- 38.Djapgne L, Panja S, Brewer L, Gans J, Kane MA, Woodson SA, et al. The Pseudomonas aeruginosa PrrF1 and PrrF2 small regulatory RNAs (sRNAs) promote 2-alkyl-4-quinolone production through redundant regulation of the antR mRNA. J Bacteriol. 2018. 10.1128/JB.00704-17. [DOI] [PMC free article] [PubMed]
- 39.Ortori CA, Dubern JF, Chhabra SR, Camara M, Hardie K, Williams P, Barrett DA. Simultaneous quantitative profiling of N-acyl-L-homoserine lactone and 2-alkyl-4(1H)-quinolone families of quorum-sensing signaling molecules using LC-MS/MS. Anal Bioanal Chem. 2011;399(2):839–850. doi: 10.1007/s00216-010-4341-0. [DOI] [PubMed] [Google Scholar]
- 40.Nguyen AT, O'Neill MJ, Watts AM, Robson CL, Lamont IL, Wilks A, Oglesby-Sherrouse AG. Adaptation of iron homeostasis pathways by a Pseudomonas aeruginosa pyoverdine mutant in the cystic fibrosis lung. J Bacteriol. 2014;196(12):2265–2276. doi: 10.1128/JB.01491-14. [DOI] [PMC free article] [PubMed] [Google Scholar]
- 41.Oglesby AG, Farrow JM, 3rd, Lee JH, Tomaras AP, Greenberg EP, Pesci EC, Vasil ML. The influence of iron on Pseudomonas aeruginosa physiology: a regulatory link between iron and quorum sensing. J Biol Chem. 2008;283(23):15558–15567. doi: 10.1074/jbc.M707840200. [DOI] [PMC free article] [PubMed] [Google Scholar]
- 42.Administration FaD. Bioanalytical method validation guidance for industry. 2018. https://www.fda.gov/files/drugs/published/Bioanalytical-Method-Validation-Guidance-for-Industry.pdf. Accessed 12 Aug 2019
- 43.Aldred KJ, Kerns RJ, Osheroff N. Mechanism of quinolone action and resistance. Biochemistry. 2014;53(10):1565–1574. doi: 10.1021/bi5000564. [DOI] [PMC free article] [PubMed] [Google Scholar]
- 44.Mashburn-Warren L, Howe J, Garidel P, Richter W, Steiniger F, Roessle M, Brandenburg K, Whiteley M. Interaction of quorum signals with outer membrane lipids: insights into prokaryotic membrane vesicle formation. Mol Microbiol. 2008;69(2):491–502. doi: 10.1111/j.1365-2958.2008.06302.x. [DOI] [PMC free article] [PubMed] [Google Scholar]
- 45.Florez C, Raab JE, Cooke AC, Schertzer JW. Membrane distribution of the Pseudomonas quinolone signal modulates outer membrane vesicle production in Pseudomonas aeruginosa. MBio. 2017;8(4). 10.1128/mBio.01034-17. [DOI] [PMC free article] [PubMed]
- 46.Schertzer JW, Whiteley M. A bilayer-couple model of bacterial outer membrane vesicle biogenesis. MBio. 2012;3(2). 10.1128/mBio.00297-11. [DOI] [PMC free article] [PubMed]
- 47.Hazan R, Que YA, Maura D, Strobel B, Majcherczyk PA, Hopper LR, Wilbur DJ, Hreha TN, Barquera B, Rahme LG. Auto poisoning of the respiratory chain by a quorum-sensing-regulated molecule favors biofilm formation and antibiotic tolerance. Curr Biol. 2016;26(2):195–206. doi: 10.1016/j.cub.2015.11.056. [DOI] [PMC free article] [PubMed] [Google Scholar]
- 48.Kane MA, Chen N, Sparks S, Napoli JL. Quantification of endogenous retinoic acid in limited biological samples by LC/MS/MS. Biochem J. 2005;388(Pt 1):363–369. doi: 10.1042/BJ20041867. [DOI] [PMC free article] [PubMed] [Google Scholar]
- 49.Panuwet P, Hunter RE, Jr, D'Souza PE, Chen X, Radford SA, Cohen JR, Marder ME, Kartavenka K, Ryan PB, Barr DB. Biological matrix effects in quantitative tandem mass spectrometry-based analytical methods: advancing biomonitoring. Crit Rev Anal Chem. 2016;46(2):93–105. doi: 10.1080/10408347.2014.980775. [DOI] [PMC free article] [PubMed] [Google Scholar]
- 50.Trufelli H, Palma P, Famiglini G, Cappiello A. An overview of matrix effects in liquid chromatography-mass spectrometry. Mass Spectrom Rev. 2011;30(3):491–509. doi: 10.1002/mas.20298. [DOI] [PubMed] [Google Scholar]
- 51.Reid DW, Withers NJ, Francis L, Wilson JW, Kotsimbos TC. Iron deficiency in cystic fibrosis: relationship to lung disease severity and chronic Pseudomonas aeruginosa infection. Chest. 2002;121(1):48–54. doi: 10.1378/chest.121.1.48. [DOI] [PubMed] [Google Scholar]
- 52.Hunter RC, Asfour F, Dingemans J, Osuna BL, Samad T, Malfroot A, Cornelis P, Newman DK. Ferrous iron is a significant component of bioavailable iron in cystic fibrosis airways. MBio. 2013;4(4). 10.1128/mBio.00557-13. [DOI] [PMC free article] [PubMed]
- 53.Reil E, Hofle G, Draber W, Oettmeier W. Quinolones and their N-oxides as inhibitors of mitochondrial complexes I and III. Biochim Biophys Acta. 1997;1318(1–2):291–298. doi: 10.1016/s0005-2728(96)00150-8. [DOI] [PubMed] [Google Scholar]
- 54.Chatzinikolaou I, Abi-Said D, Bodey GP, Rolston KV, Tarrand JJ, Samonis G. Recent experience with Pseudomonas aeruginosa bacteremia in patients with cancer: retrospective analysis of 245 episodes. Arch Intern Med. 2000;160(4):501–509. doi: 10.1001/archinte.160.4.501. [DOI] [PubMed] [Google Scholar]
- 55.Gaynes R, Edwards JR. National Nosocomial Infections Surveillance S. Overview of nosocomial infections caused by gram-negative bacilli. Clin Infect Dis. 2005;41(6):848–854. doi: 10.1086/432803. [DOI] [PubMed] [Google Scholar]
- 56.Hidron AI, Edwards JR, Patel J, Horan TC, Sievert DM, Pollock DA, Fridkin SK, National Healthcare Safety Network T, Participating National Healthcare Safety Network F NHSN annual update: antimicrobial-resistant pathogens associated with healthcare-associated infections: annual summary of data reported to the National Healthcare Safety Network at the Centers for Disease Control and Prevention, 2006-2007. Infect Control Hosp Epidemiol. 2008;29(11):996–1011. doi: 10.1086/591861. [DOI] [PubMed] [Google Scholar]
- 57.Vincent JL, Rello J, Marshall J, Silva E, Anzueto A, Martin CD, Moreno R, Lipman J, Gomersall C, Sakr Y, Reinhart K, Investigators EIGo International study of the prevalence and outcomes of infection in intensive care units. JAMA. 2009;302(21):2323–2329. doi: 10.1001/jama.2009.1754. [DOI] [PubMed] [Google Scholar]
- 58.Starkey M, Lepine F, Maura D, Bandyopadhaya A, Lesic B, He J, Kitao T, Righi V, Milot S, Tzika A, Rahme L. Identification of anti-virulence compounds that disrupt quorum-sensing regulated acute and persistent pathogenicity. PLoS Pathog. 2014;10(8):e1004321. doi: 10.1371/journal.ppat.1004321. [DOI] [PMC free article] [PubMed] [Google Scholar]
Associated Data
This section collects any data citations, data availability statements, or supplementary materials included in this article.
Supplementary Materials
(PDF 419 kb)