Abstract
Background:
The Centers for Disease Control and Prevention, the American Cancer Society, the National Cancer Institute, and the North American Association of Central Cancer Registries collaborate to provide annual updates on cancer occurrence and trends in the United States and to address a special topic of interest. Part 1 of this report focuses on national cancer statistics and Part 2 characterizes progress in achieving select Healthy People 2020 cancer objectives.
Methods:
For this report, we selected objectives—including death rates, cancer screening, and major risk factors—related to 4 common cancers (lung, colorectal, female breast, and prostate). We examined baseline values, recent values, and percentage change from baseline to recent values overall and by select sociodemographic characteristics. Data from national surveillance systems were obtained from the Healthy People 2020 website.
Results:
Targets for death rates were met overall and in most sociodemographic groups, but not among males, blacks, and people in rural areas, although these groups did experience larger decreases in rates compared to other groups. During 2007 to 2017, cancer death rates decreased 15% overall, ranging from –4% (rural) to –22% (metropolitan). Targets for breast and colorectal cancer screening were not yet met overall or in any sociodemographic groups except those with the highest educational attainment, while lung cancer screening was generally low (<10%). Targets were not yet met overall for cigarette smoking, recent smoking cessation, excessive alcohol use, or obesity, but were met for secondhand smoke exposure and physical activity. Some sociodemographic groups did not meet targets or had less improvement than others toward reaching objectives.
Conclusions:
Monitoring trends in cancer risk factors, screening test use, and mortality can help assess the progress made toward decreasing the cancer burden in the United States. While many interventions to reduce cancer risk factors and promote healthy behaviors are proven to work, they may not be equitably applied or work well in every community. Implementing cancer prevention and control interventions that are sustainable, focused, and culturally appropriate may boost success in communities with the greatest need, ensuring that all Americans can access a path to long, healthy, cancer-free lives.
Keywords: cancer, epidemiology, surveillance, Healthy People 2020
Precis
Part 2 of the Annual Report to the Nation characterizes progress in achieving select Healthy People 2020 cancer-related objectives. This report shows that Healthy People 2020 objectives for reducing death from four major cancer types (lung, colorectal, female breast, and prostate) have been met overall; however, improvement is still needed to achieve health equity and to meet other Healthy People 2020 objectives related to these cancers, including increasing cancer screening, smoking cessation, and physical activity and reducing cigarette smoking, secondhand smoke exposure, obesity, and excessive alcohol use.
INTRODUCTION
“If you don’t know where you are going, you’ll end up someplace else.” These words by Yogi Berra highlight the importance of envisioning our future, setting goals to ensure our path, and selecting milestones to measure our progress. One such vision set by the U.S. Department of Health and Human Services is a society in which all people live long, healthy lives.1 As a pathway to realizing this vision, the national initiative Healthy People specifies four overarching health goals: attain high-quality, longer lives free of preventable disease, disability, injury, and premature death; achieve health equity, eliminate disparities, and improve the health of all groups; create social and physical environments that promote good health for all; and promote quality of life, healthy development, and healthy behaviors across all life stages.2
Healthy People sets measurable objectives with 10-year targets that guide health promotion and disease prevention efforts in several topic areas. Each topic area is assigned to one or more lead agencies; for example, the Centers for Disease Control and Prevention and the National Cancer Institute jointly lead the development and monitoring of objectives related to cancer outcomes including cancer screening, with the goal of reducing the number of new cancer cases as well as illness, disability, and death caused by cancer.3
Population-based screening is recommended by the U.S. Preventive Services Task Force (USPSTF) for persons at average risk of breast,4 colorectal,5 and cervical6 cancers and for persons at high risk of lung cancer.7 Screening aims to detect these cancers at an early, often treatable, stage and, in so doing, reduce mortality. Screening also can detect precancerous colorectal polyps and cervical lesions, which can be treated to prevent progression to cancer and, as a result, reduce incidence. The USPSTF recommends that men talk with their clinician about the benefits and harms of prostate cancer screening with the prostate-specific antigen (PSA) test in order to make informed decisions about whether to be screened.8
Healthy People topic areas include objectives related to risk factors that increase the risk of multiple diseases, including cancer, such as cigarette smoking, secondhand smoke exposure, excess body weight, physical inactivity, and excessive alcohol use. Cigarette smoking is linked to increased risk of at least 12 different cancers, including two of the most common cancers (lung and colorectal), while smoking cessation reduces the risk of developing or dying from cancer.9–11 Among people diagnosed with cancer (including prostate cancer), smoking cessation improves prognosis, whereas continued smoking worsens prognosis and can lead to subsequent primary cancers.9,11 Exposure to secondhand smoke from burning tobacco products can cause sudden infant death syndrome, respiratory infections, ear infections, and asthma attacks in infants and children, and coronary heart disease, stroke, and lung cancer in adult nonsmokers.9,12 Excess body weight, including overweight (a body mass index (BMI measured as weight in kilograms by the square of height in meters) ≥25.0) and obesity (BMI≥30.0 kg/m2), is linked with at least 13 cancers, including colon, rectum, and postmenopausal breast cancers.13,14 Independent of body weight, there is strong evidence that being physically active decreases the risk of cancers of the colon, breast (postmenopausal) and endometrium; and that undertaking regular vigorous-intensity physical activity decreases the risk of both pre- and post-menopausal breast cancer.14,15 Physical activity also improves health-related quality of life and fitness among cancer survivors.15 Alcohol use can contribute to the development of at least 6 cancers, including cancer of the colon, rectum, and female breast.14,16
Monitoring trends in cancer risk factors, screening test use, incidence, and mortality can help assess the progress made toward decreasing the burden of cancer in the United States.17,18 While trends in cancer incidence can be difficult to interpret because they reflect changes in diagnostic practices and the use of screening tests as well as changes in exposure to risk factors, declines in cancer death rates tend to reflect improvements in primary prevention, early detection, and treatment, and are a true indicator of progress.19
The Centers for Disease Control and Prevention (CDC), the American Cancer Society (ACS), the National Cancer Institute (NCI), and the North American Association of Central Cancer Registries (NAACCR) collaborate each year to provide updated information about cancer occurrence and trends in the United States and to address a special topic of interest. Part 1 of this report focuses on national cancer statistics and Part 2 characterizes progress in achieving select Healthy People 2020 objectives related to four common cancers (lung, colorectal, female breast, and prostate), including death rates, cancer screening, and risk factors. The progress is examined in this report with a lens on health equity, one of the Healthy People Initiative’s overarching goals.
MATERIALS AND METHODS
Healthy People 2020 has more than 1200 objectives, and each measurable objective has a reliable national surveillance system data source, a baseline measure, a target for specific improvements to be achieved by the year 2020, and midcourse review data.2 For this report, we selected objectives for disease outcomes, cancer screening, and risk factors related to 4 common cancers (lung, colorectal, female breast, and prostate) that make up about half of all new cancer cases and deaths (Table). We examined baseline values, recent midcourse review values, and changes from baseline to recent values (measured as percent change) overall and by select sociodemographic characteristics. Data were obtained from the Healthy People 2020 website during June 2019.2 The website did not include data for lung cancer screening, so these data were obtained from NCI.17
Table.
Healthy People 2020 Objectives Related to Cancer
| Objective1 | Measure2 | Data Source |
|---|---|---|
| Disease outcome | ||
| Reduce the overall cancer death rate (C-1) | Overall cancer deaths per 100,000 population | NVSS |
| Reduce the lung cancer death rate (C-2) | Lung cancer deaths per 100,000 population | NVSS |
| Reduce the female breast cancer death rate (C-3) | Female breast cancer deaths per 100,000 population | NVSS |
| Reduce the colorectal cancer death rate (C-5) | Colorectal cancer deaths per 100,000 population | NVSS |
| Reduce the prostate cancer death rate (C-7) | Prostate cancer deaths per 100,000 population | NVSS |
| Cancer screening/counseling | ||
| Increase the proportion of adults who receive a colorectal cancer screening based on the most recent guidelines (C-16) | Proportion of adults aged 50 to 75 years who received a colorectal cancer screening based on the most recent guidelines in 2008 (a blood stool test in the past year, sigmoidoscopy in the past 5 years and blood stool test in the past 3 years, or a colonoscopy in the past 10 years) | NHIS |
| Increase the proportion of women who receive a breast cancer screening based on the most recent guidelines (C-17) | Proportion of females aged 50 to 74 years who received a breast cancer screening based on the most recent guidelines in 2008 (a mammogram in the past 2 years) | NHIS |
| Increase the proportion of men who discuss the advantages and disadvantages of the prostate-specific antigen (PSA) test to screen for prostate cancer with their health care provider (C-19) | Proportion of men aged ≥40 years who had discussed the advantages and disadvantages of the prostate-specific antigen (PSA) test to screen for prostate cancer with their health care provider (a shared decision making discussion) | NHIS |
| Increase the proportion of adults who receive a lung cancer screening based on the most recent guidelines (no objective) | Proportion of adults aged 55 to 80 years who have ≥ 30 pack-year smoking history and currently smoke or quit within the past 15 years who received a lung cancer screening based on the most recent guidelines in 2013 (a low-dose computed tomography [LDCT] chest scan to check for lung cancer in the past year) | NHIS |
| Cancer risk factors | ||
| Reduce cigarette smoking by adults (TU-1.1) | Proportion of adults aged ≥18 years who were current cigarette smokers | NHIS |
| Increase recent smoking cessation success by adult smokers (TU-5.1) | Proportion of adults aged ≥18 years who successfully stopped smoking within past 6 months to 1 year | NHIS |
| Reduce the proportion of adults aged ≥18 years exposed to secondhand smoke (TU-11.3) | Proportion of nonsmoking adults aged ≥18 years exposed to secondhand smoke, defined as having a serum cotinine level ≥ 0.05 ng/mL and ≤10 ng/mL | NHANES |
| Increase the proportion of adults who meet the objectives for aerobic physical activity and for muscle-strengthening activity (PA-2.4) | Proportion of adults aged ≥18 years who met the objectives for aerobic physical activity and for muscle-strengthening activity in 2008 (light or moderate physical activity ≥150 minutes per week or vigorous physical activity ≥75 minutes per week or an equivalent combination of moderate and vigorous-intensity activity and physical activities specifically designed to strengthen muscles at least twice per week) | NHIS |
| Reduce the proportion of adults who are obese (NWS-9) | Proportion of adults aged ≥20 years who are obese (a body mass index (BMI measured as weight in kilograms by the square of height in meters) ≥30.0) | NHANES |
| Reduce the proportion of adults who drank excessively in the previous 30 days (SA-15) | Proportion of adults aged ≥18 years who reported that they drank excessively in the previous 30 days (drank >2 drinks per day on average (for men) or >1 drink per day on average (for women) or who drank ≥5 during a single occasion (for men) or ≥4 drinks during a single occasion (for women) | National Survey on Drug Use and Health |
Abbreviations: NVSS = National Vital Statistics System; NHIS = National Health Interview Survey; NHANES = National Health and Nutrition Examination Survey.
Healthy People 2020 objectives are indicated by topic area and number in parentheses.
Measures were age adjusted to the year 2000 standard population.
Disease outcomes
Healthy People 2020 uses data from the National Center for Health Statistics National Vital Statistics System (NVSS)20 to measure objectives related to lung, colorectal, female breast, and prostate cancer death rates. Data from 2007 were used as a baseline, and recent data were from 2017. We calculated the number and proportion that different cancer sites made up of total cancer deaths in 2017.
Cancer screening
Healthy People 2020 uses data from the National Health Interview Survey (NHIS)21 to measure objectives related to lung, colorectal, breast, and prostate cancer screening, consistent with age and screening interval recommendations (Table). Data from 2008 were used as a baseline for colorectal cancer screening uptake, breast cancer screening uptake, and prostate cancer screening discussions, and data from 2010 were used as a baseline for lung cancer screening uptake. Recent data were from 2015.
Cancer risk factors
Objectives related to cigarette smoking (including smoking cessation), secondhand smoke exposure, alcohol use, physical activity and excess body weight were selected for this report because these risk factors account for a high proportion of potentially avoidable cancers.22
Healthy People 2020 uses data from the NHIS to measure objectives about current cigarette smoking, recent smoking cessation success, and physical activity, with baseline measures from 2008 and recent data from 2017.
Data from the National Health and Nutrition Examination Survey (NHANES)23 were used to measure objectives about secondhand smoke exposure and obesity (BMI≥30 kg/m2), with baseline measures in 2005–2008. Recent data were from 2011–2014 for secondhand smoke exposure and from 2013–2016 for obesity.
Data from the National Survey on Drug Use and Health (NSDUH) were used to measure objectives about excessive alcohol use, with baseline measures from 2008 and recent data from 2016.
Sociodemographic characteristics
This report presents baseline and recent values overall and by select sociodemographic characteristics including sex (male or female), race-ethnicity, geographic location, health insurance status, and educational attainment. Categories for race and ethnicity in this report varied by type of data source, and not all available categories were included in this report. This report presents results for respondents in the NVSS by race categorized as white, black or African American (black), Asian or Pacific Islander (API), American Indian/Alaska Native (AIAN), and by ethnicity Hispanic or Latino (Hispanic) or not Hispanic; respondents in the NHIS categorized as white only (i.e., persons who reported only one racial group, regardless of ethnicity), black only, AIAN only, Asian only, or Hispanic; respondents in the NHANES categorized as non-Hispanic white only, non-Hispanic black only, or Mexican American; and respondents in the NSDUH categorized as white only, black only, AIAN only, Asian only, or Hispanic. Geographic location was classified as metropolitan/urban or nonmetropolitan/rural, as defined by the Office of Management and Budget.24
Respondents age < 65 years were categorized as, at the time of survey, having private health insurance, public health insurance, or being uninsured. Educational attainment was presented for respondents age ≥ 25 years in NHIS as less than high school, high school graduate, 4-year college degree, or advanced degree and in NHANES as less than high school, high school graduate (including General Educational Development high school equivalency diploma [GED]), or college graduate or above (not all available categories were included in this report).
Measures were age adjusted to the year 2000 standard population. Data for other sociodemographic characteristics were available but were not included in this report.
Target Assessment
Each Healthy People 2020 target specified a target-setting method, such as projection/trend analysis, minimal statistical significance, or percentage improvement. While Healthy People 2020 target values and target-setting methods (for example, 10% improvement) are intended for the overall population, we also examined whether they were met in each sociodemographic group. Examining percentage change in rates is another way to gauge progress, particularly for groups whose baseline values had improved, but had not improved enough to meet the target, or for groups whose baseline values had already met the target and were still improving. In figures in this report, Healthy People 2020 targets are indicated by black dotted lines. The baseline value is indicated as a white circle, and the most recent estimate is indicated as a colored circle (blue for death rates, purple for screening, and green for risk factors) if the target was met and as a red circle if the target was not met. The percentage change from the baseline value to the most recent estimate is indicated as a blue/purple/green bar if the percentage improvement target was met (or if the percentage change was in the indicated direction, when a percentage improvement target was not specified) and as a red bar if the percentage improvement target was not met (or if the percentage change was not in the indicated direction, when a percentage improvement target was not specified).
RESULTS
In 2017, about 600,000 cancer deaths occurred in the United States. Among females, the 3 most common causes of cancer death were lung, breast, and colorectal cancers, while among males, the 3 most common were lung, prostate, and colorectal cancers. Overall, 24% of cancer deaths were lung cancers, 9% were colorectal cancers, 7% were female breast cancers, and 5% were prostate cancers; together these 4 cancers accounted for almost half of all cancer deaths (Figure 1). Pancreatic cancer accounted for 7% of cancer deaths and was the 4th most common cause of cancer death among both females and males. The next 3 most common cancers were liver and intrahepatic bile duct, leukemia, and non-Hodgkin lymphoma; all other cancer types individually accounted for <3% of cancer deaths.
Figure 1.
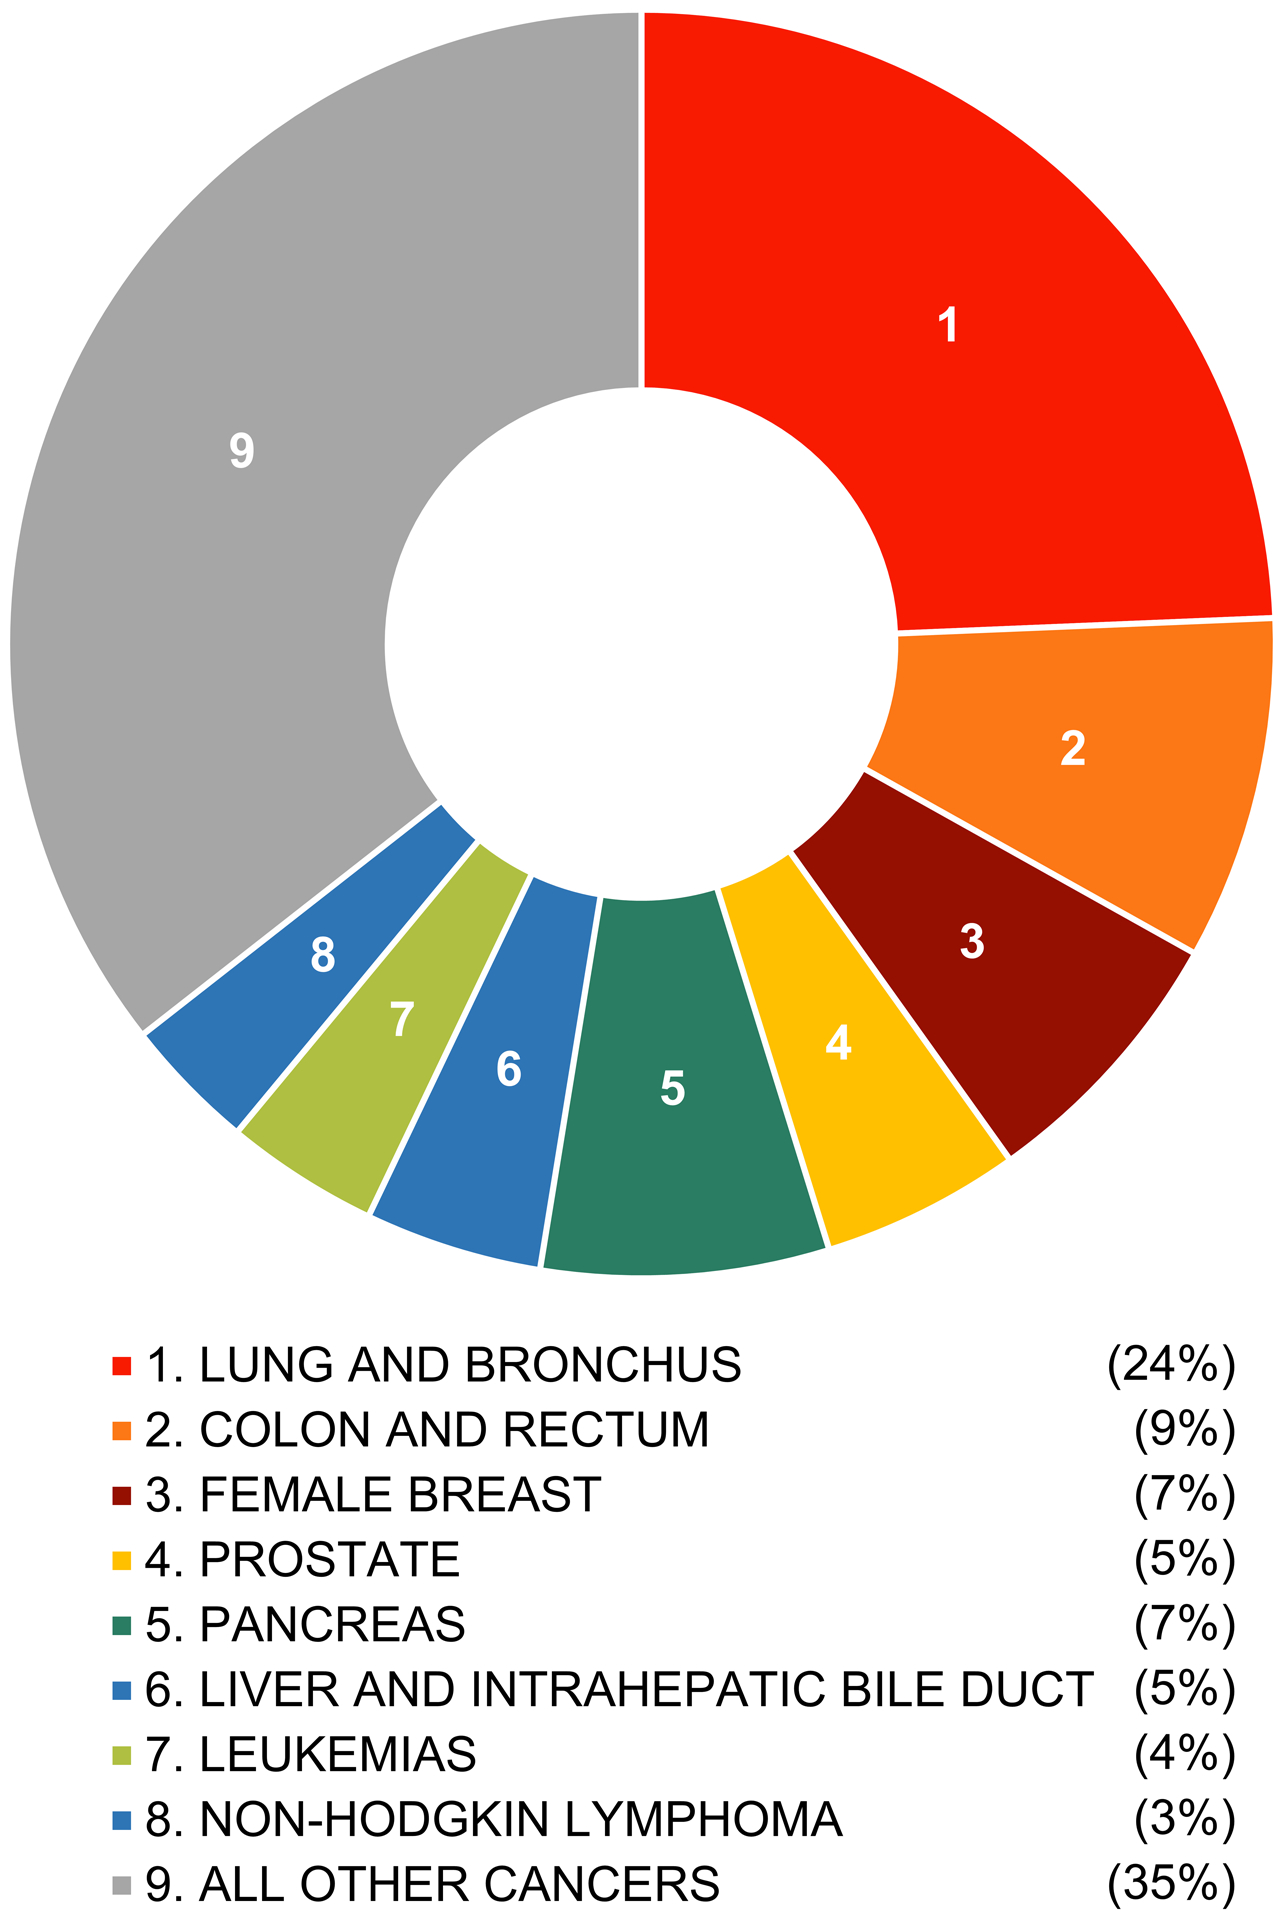
The distribution of cancer deaths is illustrated by cancer type for both sexes, all ages, and all races/ethnicities combined—United States, 2017.
The target death rate (161.4 deaths per 100,000 persons) for all cancers combined was met overall and in most sociodemographic groups. Although the target was not yet met in males, blacks, and people in rural areas, these groups did experience larger decreases in rates compared to other groups (Figure 2a). During 2007 to 2017, cancer death rates decreased 15% overall, and the percent improvement goal (–10%) was met in many, but not all, sociodemographic groups, ranging from –4% (rural) to –22% (metropolitan).
Figure 2.
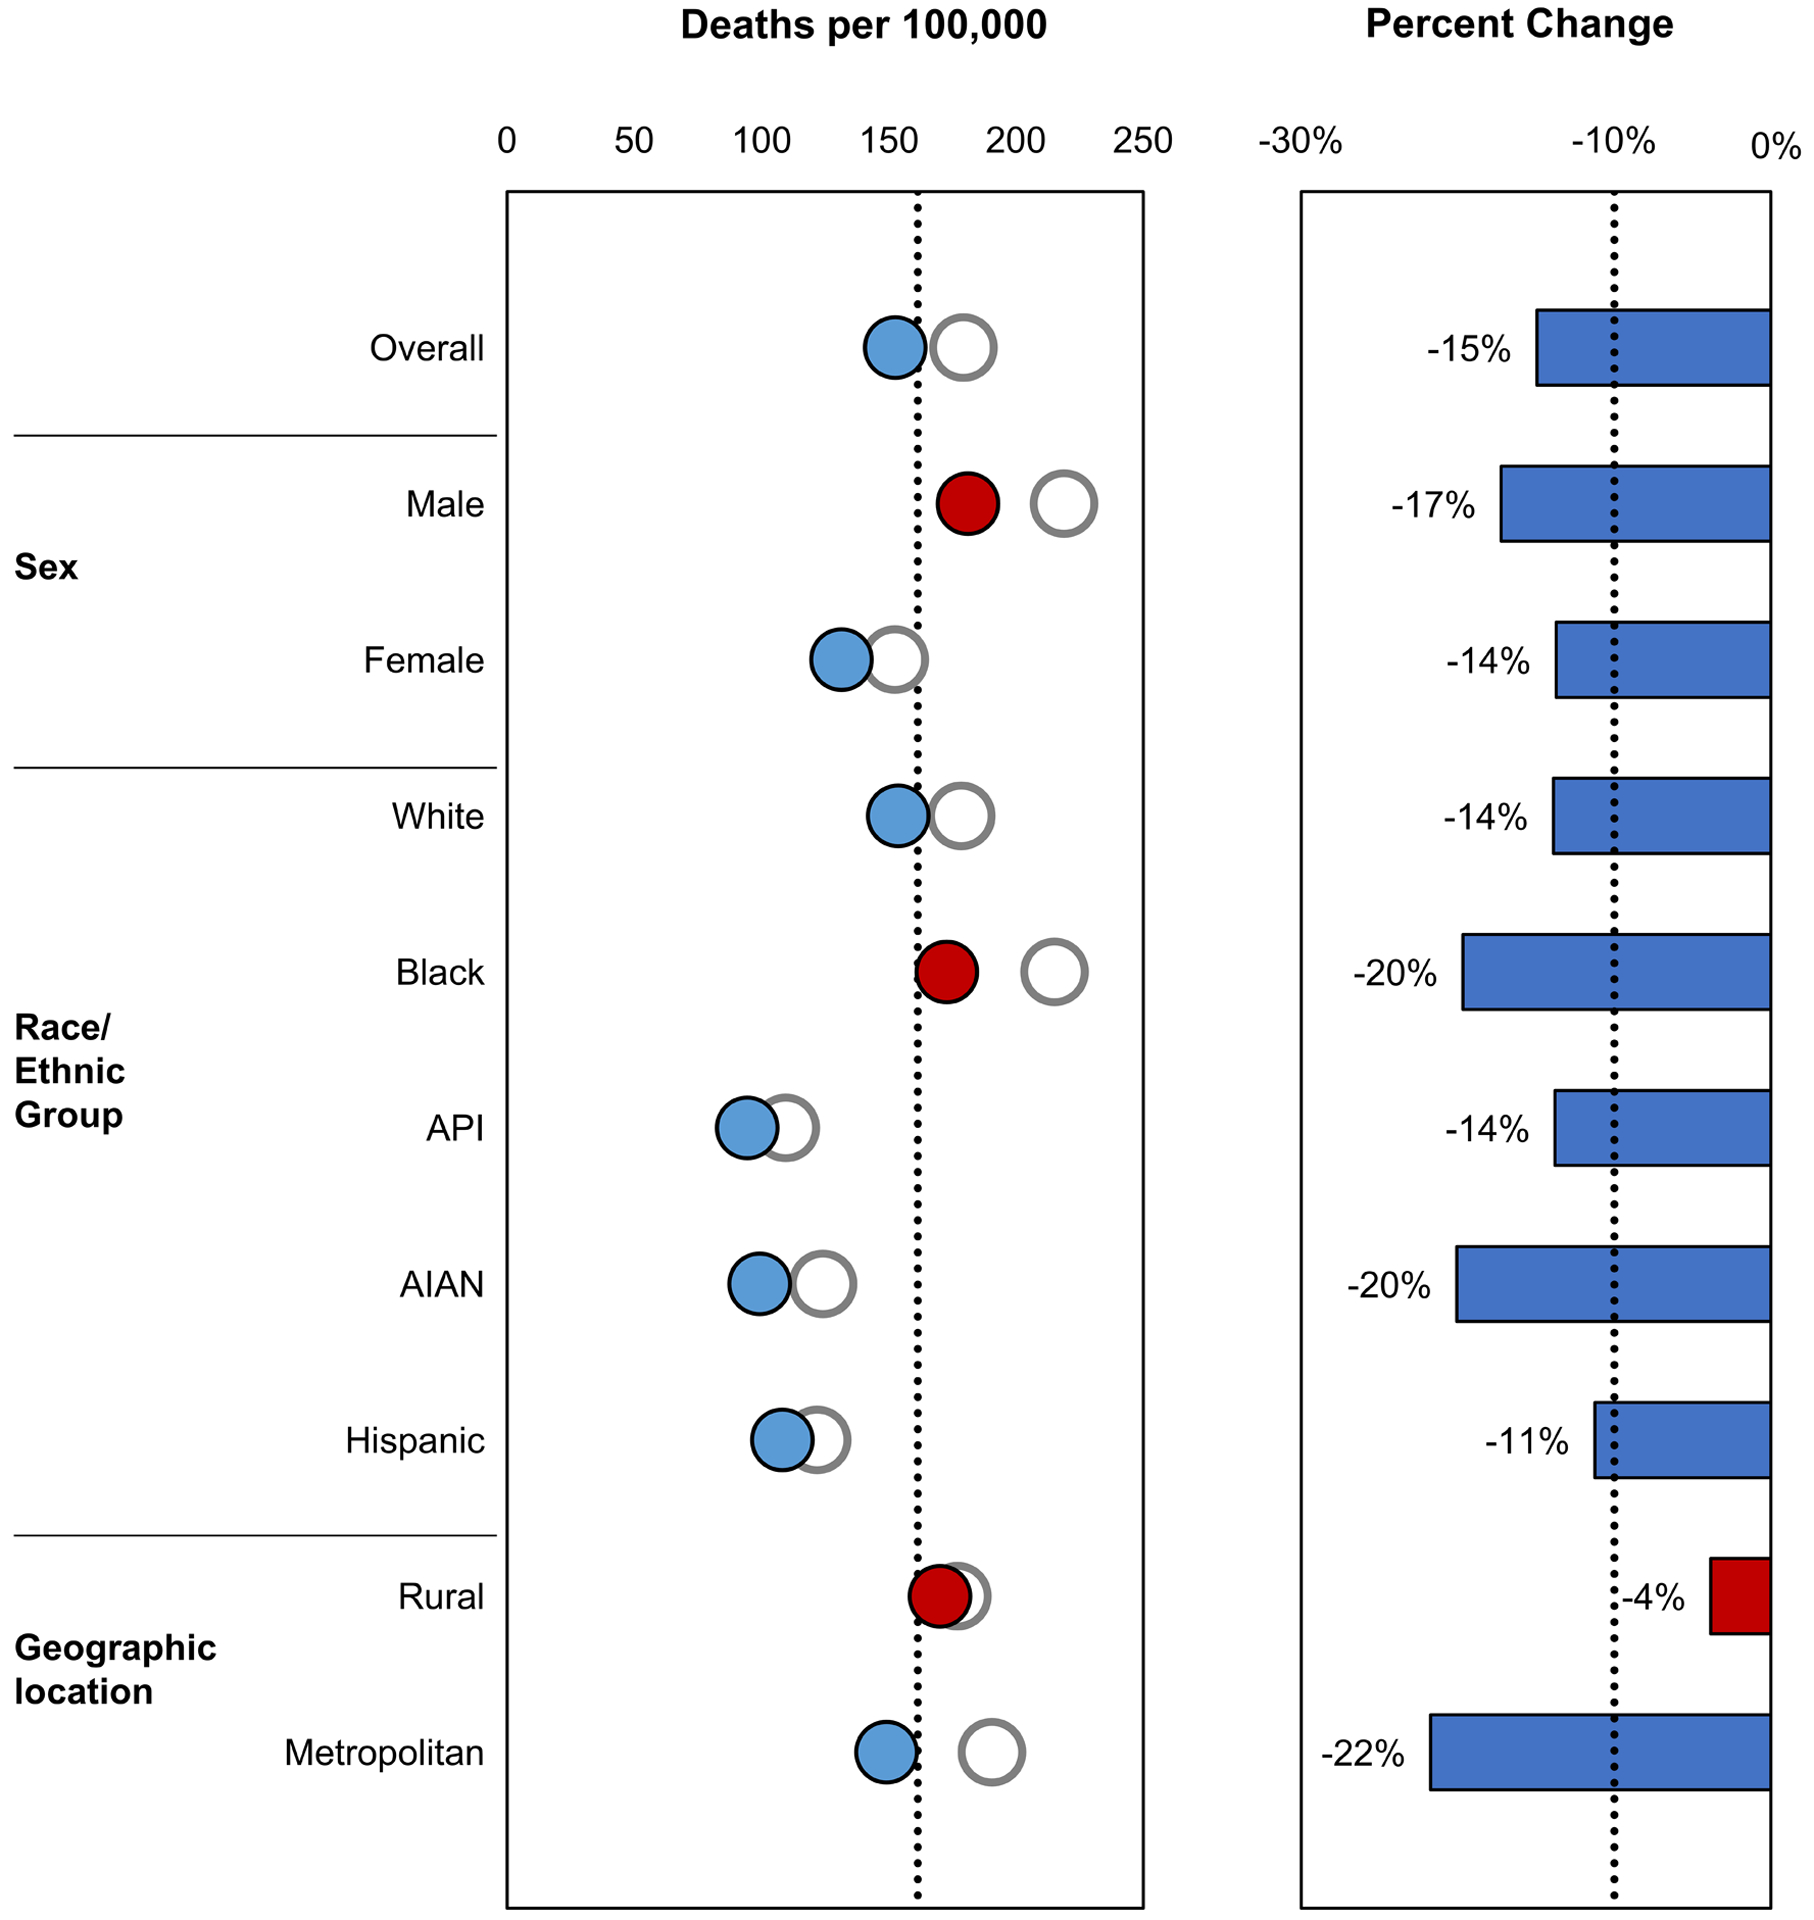
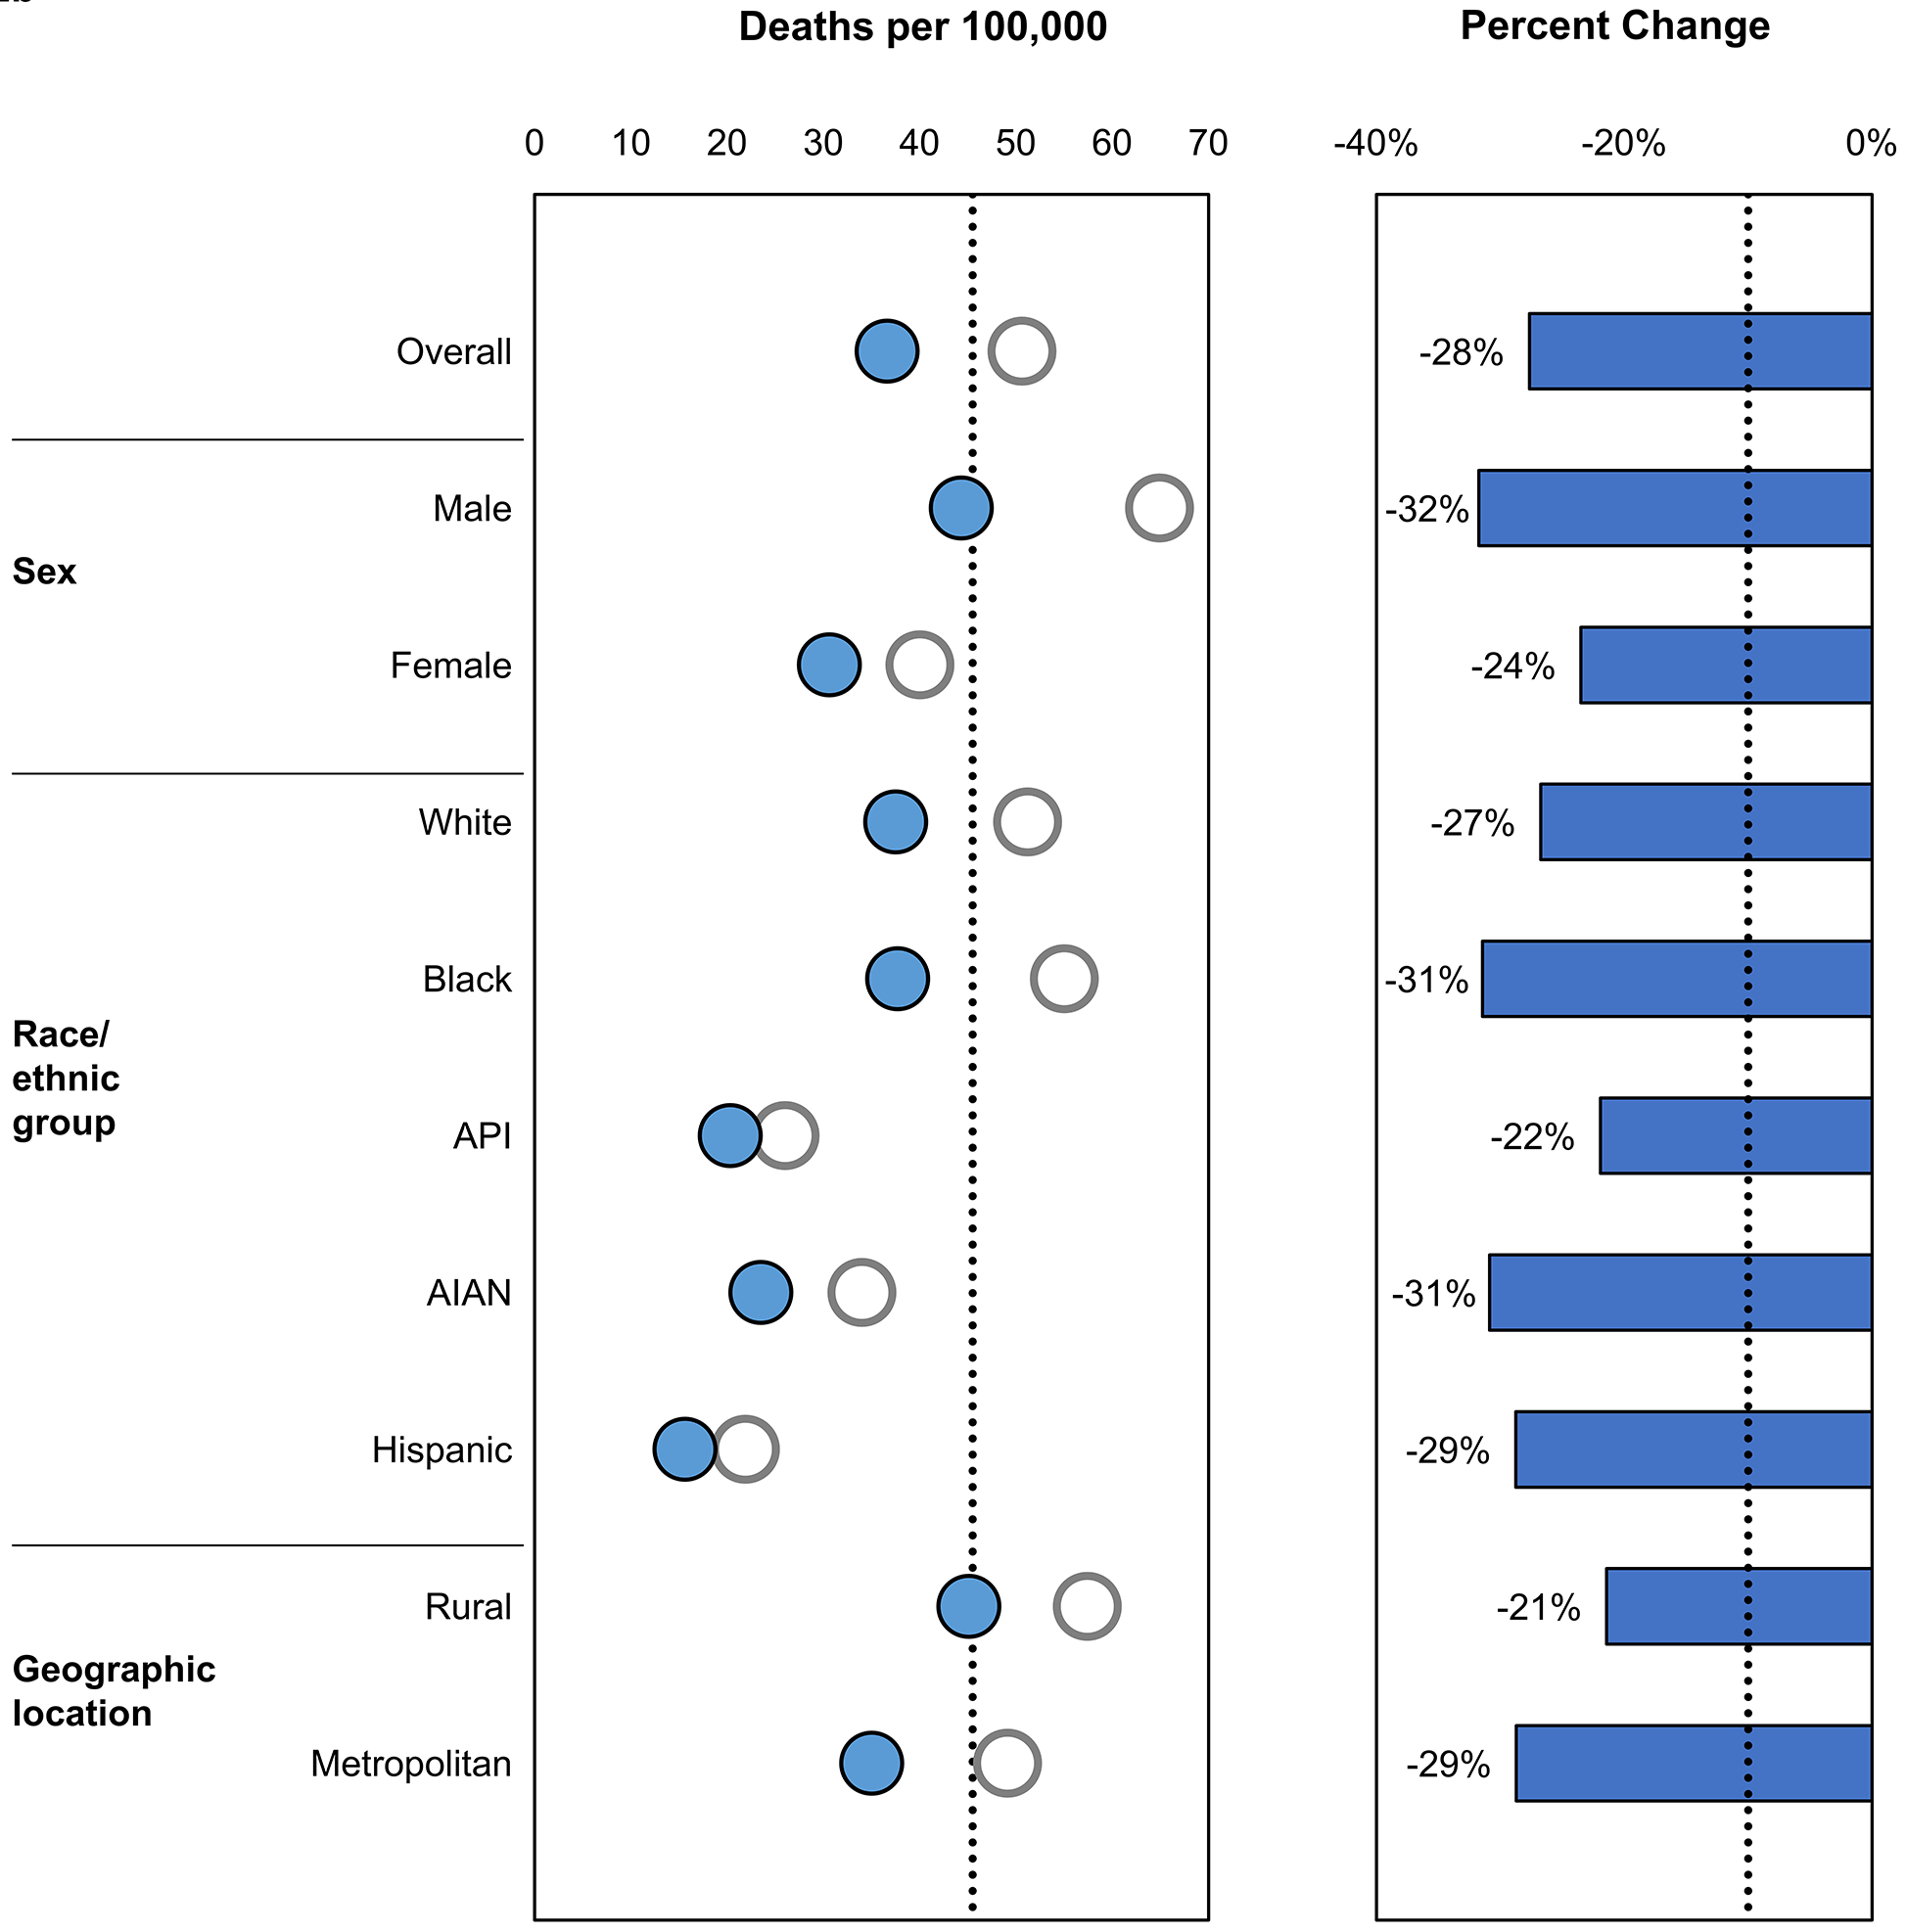
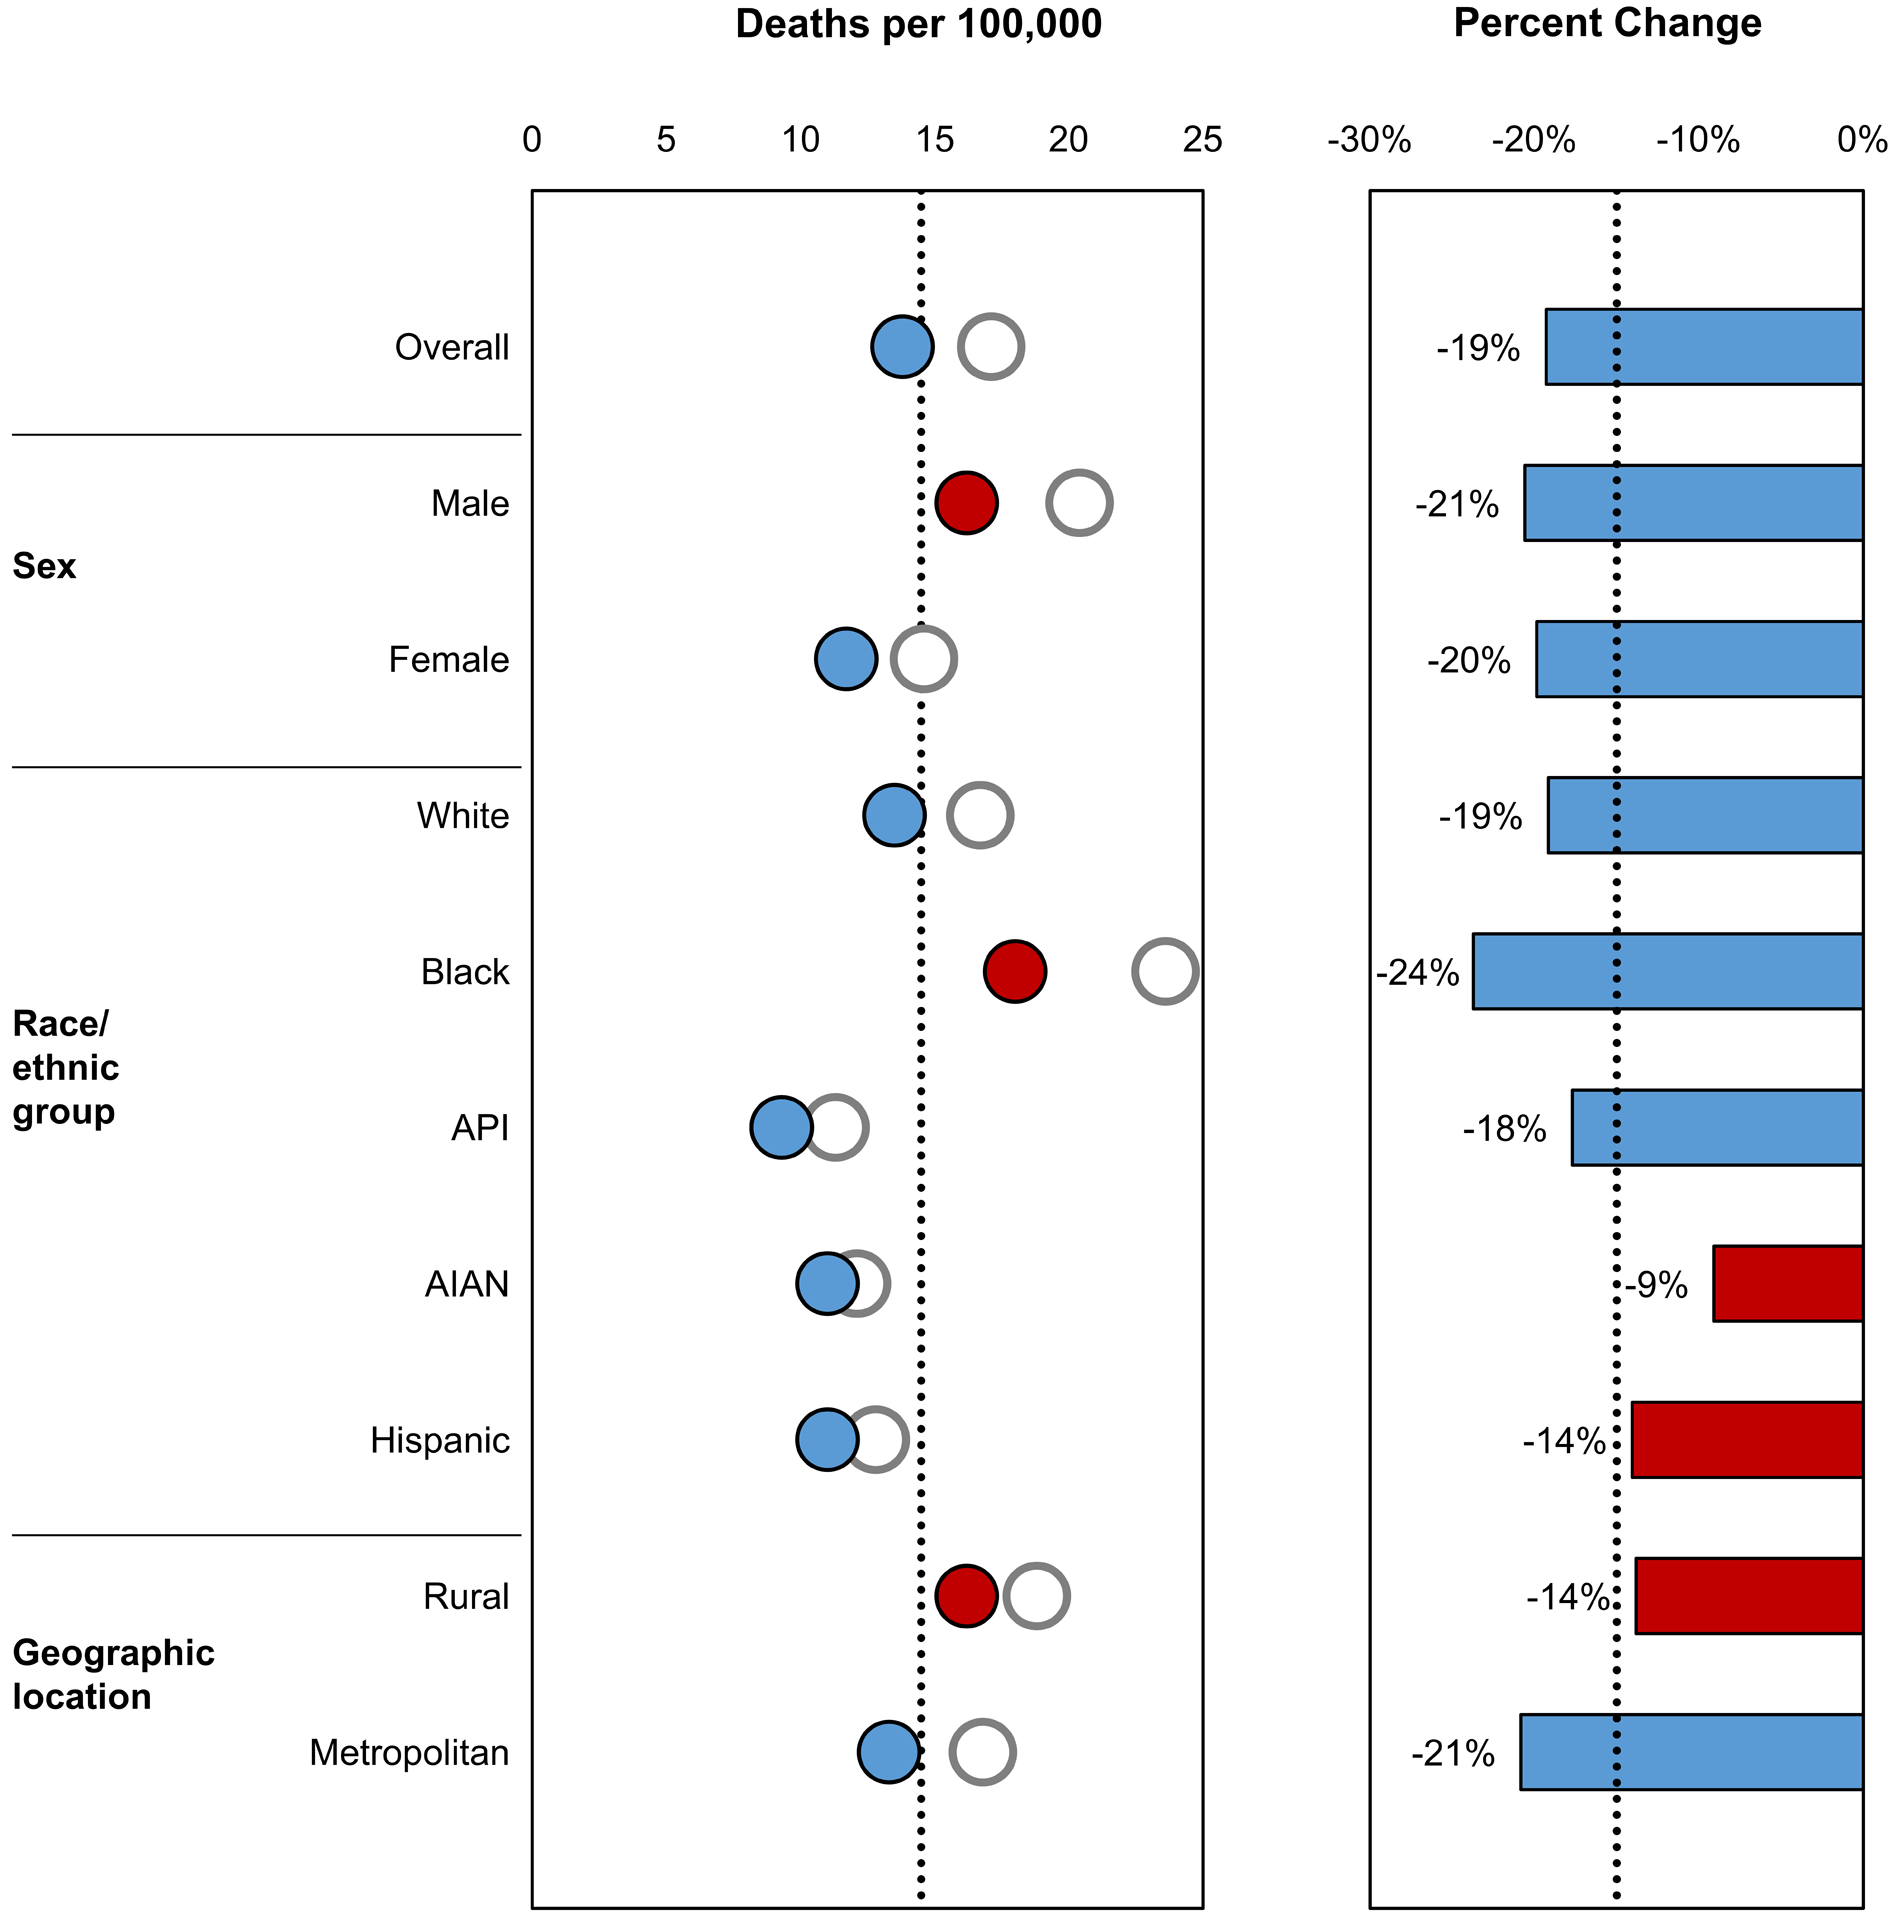
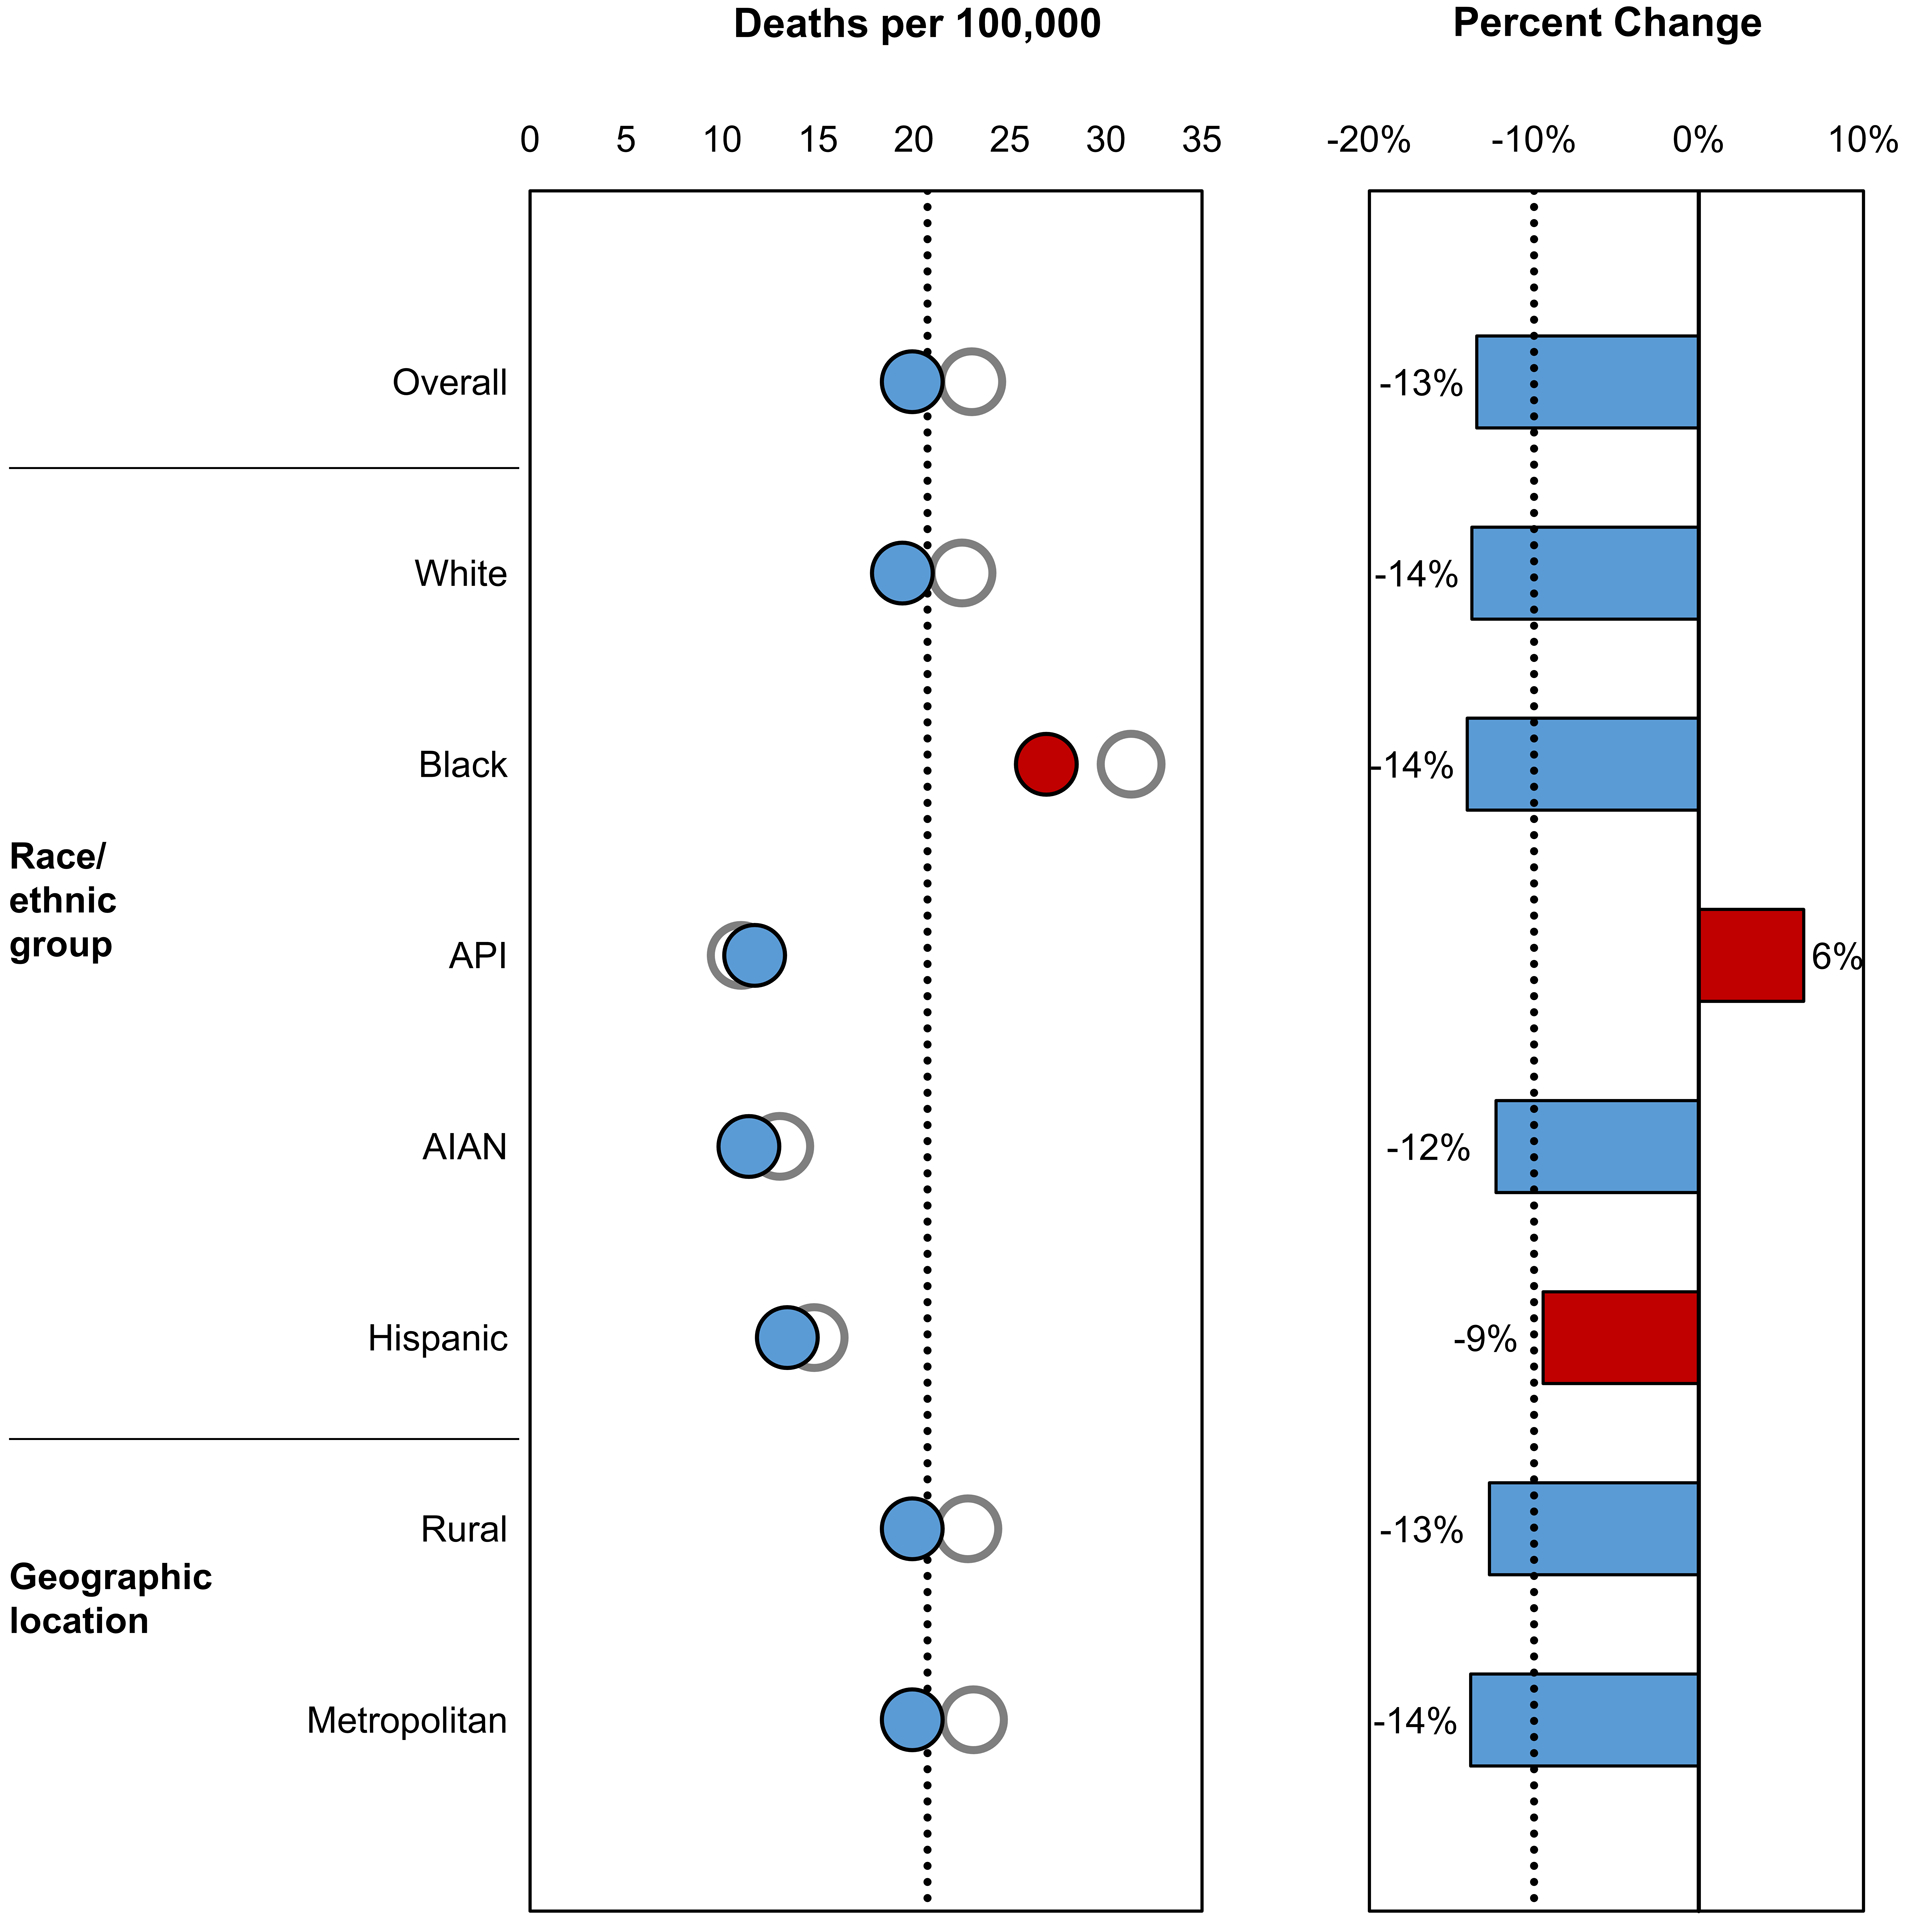
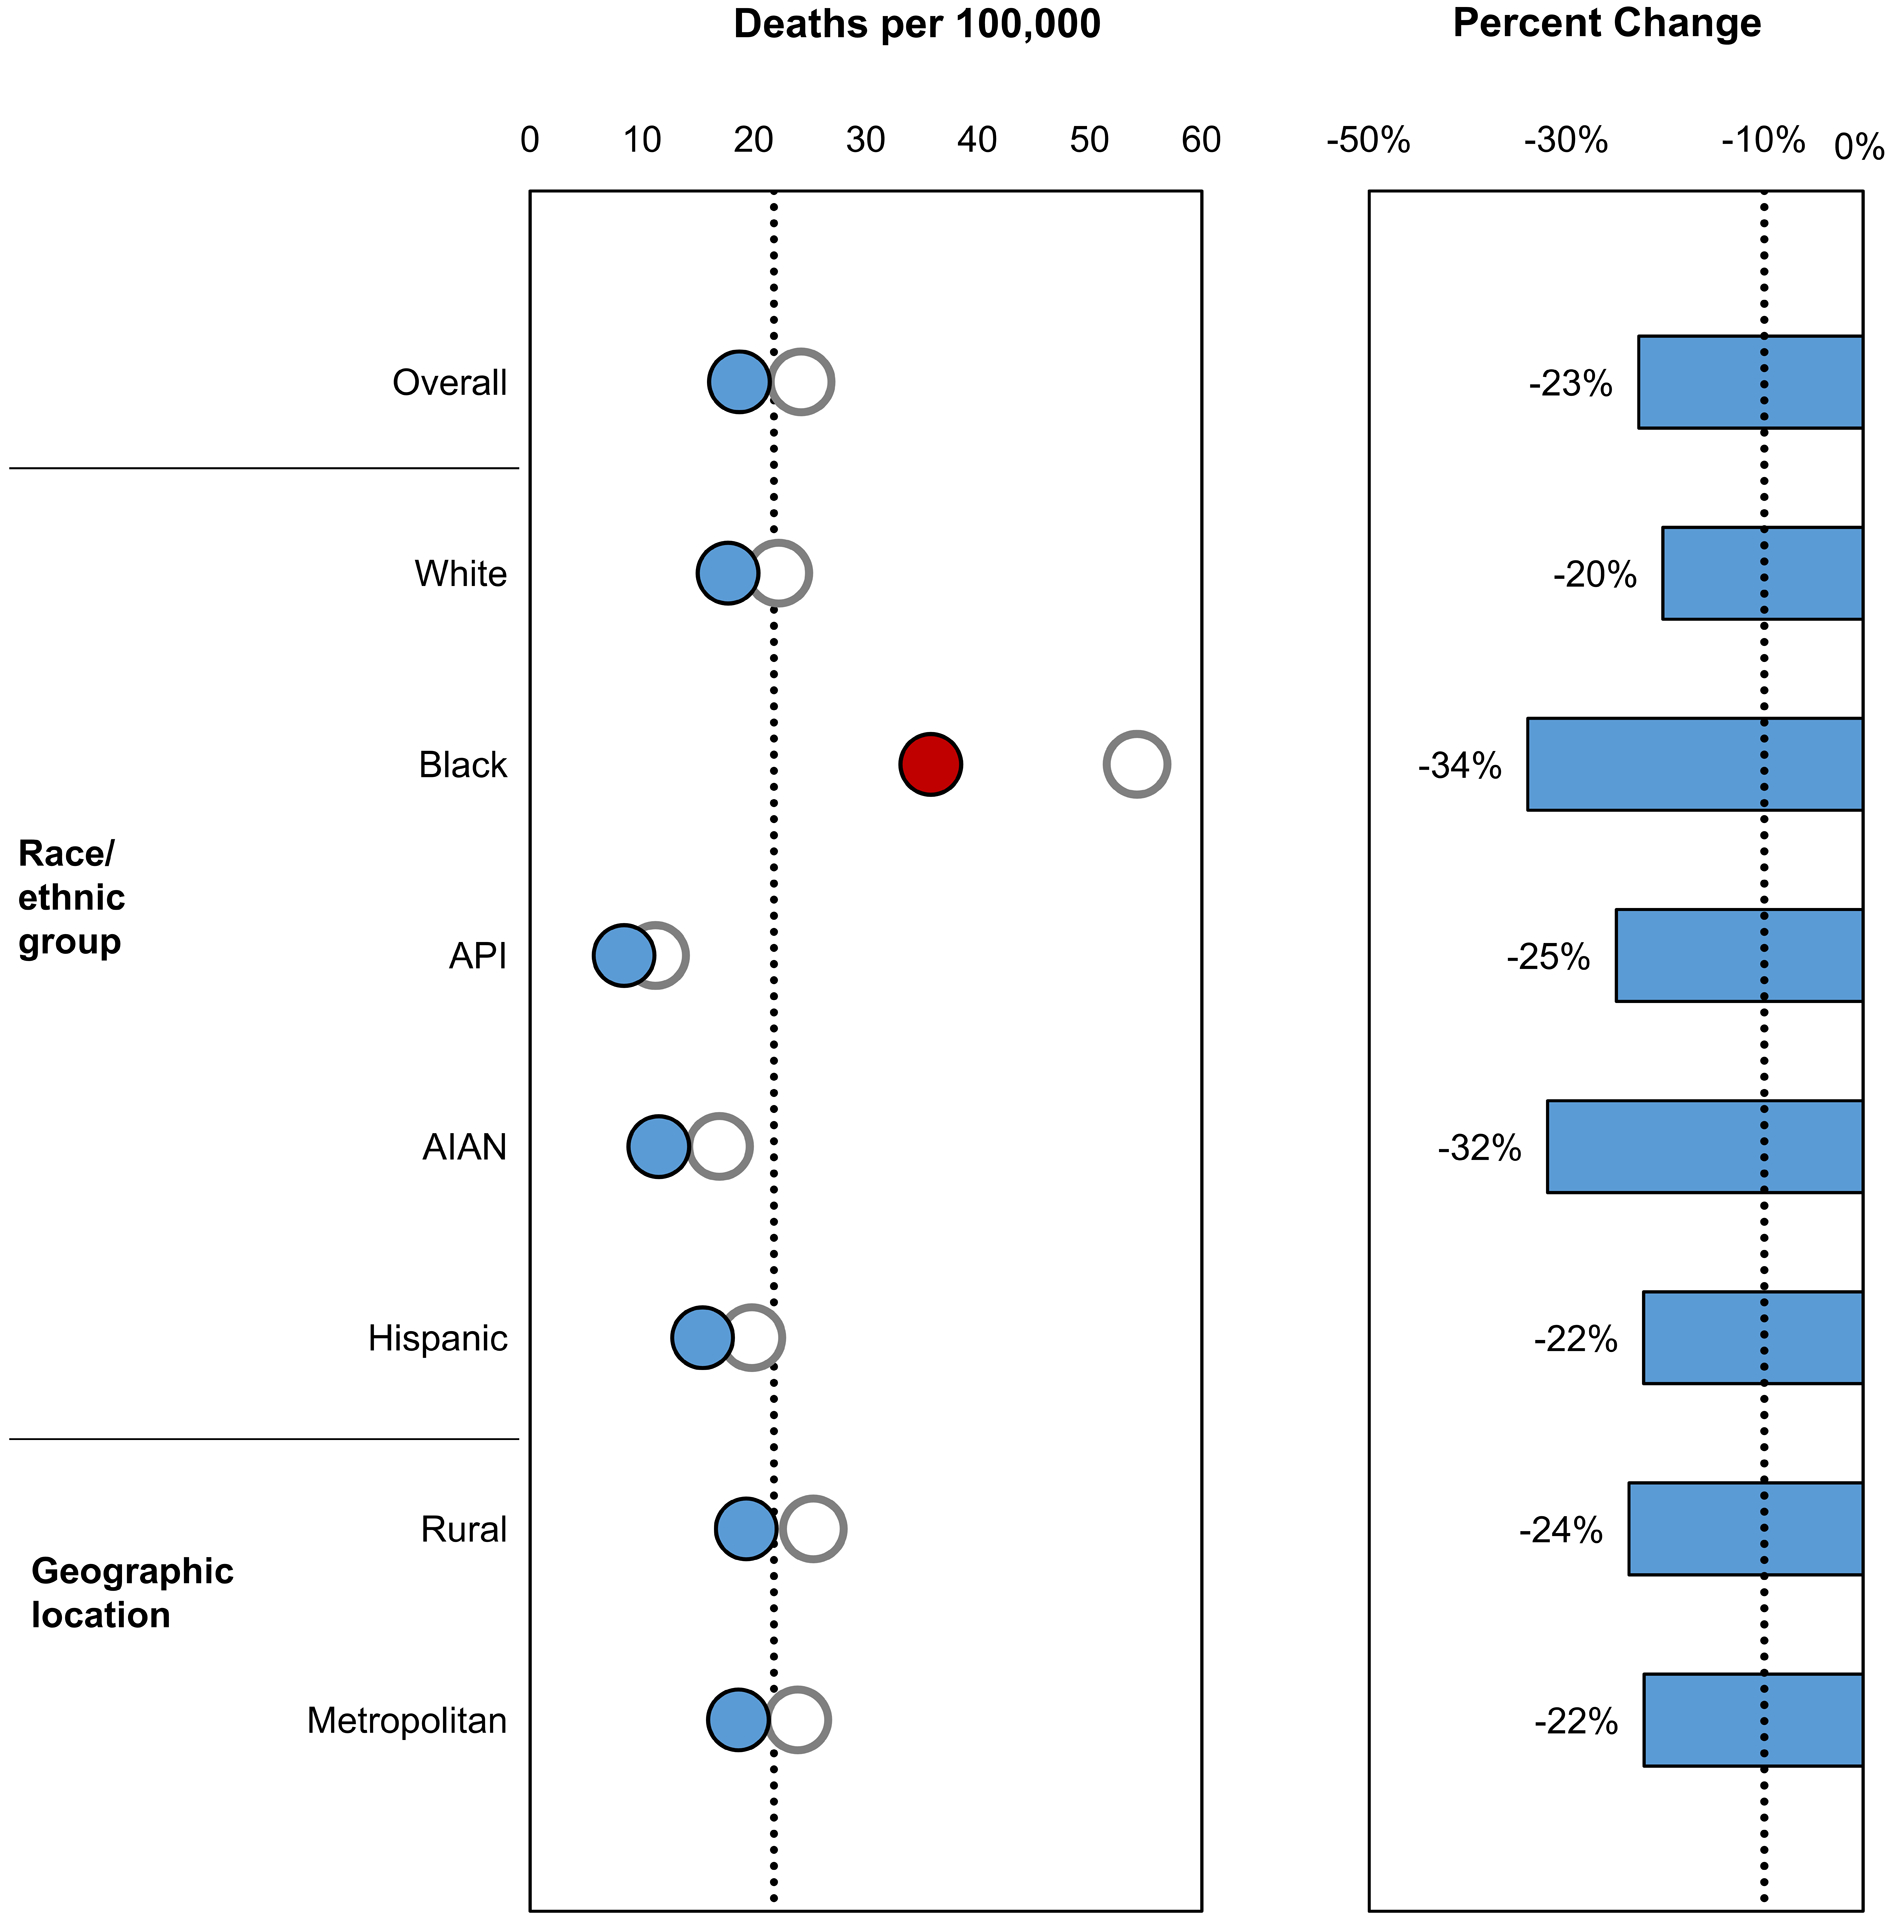
Healthy People 2020 objectives related to cancer death rates are illustrated. Data are from the National Vital Statistics System, baseline values are from 2007, and the most recent estimates are from 2017. Healthy People 2020 targets are indicated by black dotted lines. The baseline value is indicated as a white circle, and the most recent estimate is indicated as a blue circle if the target was met and as a red circle if the target was not met. The percentage change from the baseline value to the most recent estimate is indicated as a blue bar if the percentage improvement target was met and as a red bar if the percentage improvement target was not met. The Healthy People 2020 targets are: (A) reduce overall cancer deaths per 100,000 population from 179.3 in 2007 to 161.4 in 2020, a 10% improvement; (B) reduce lung cancer deaths per 100,000 population from 50.6 in 2007 to 45.5 in 2020, a 10% improvement; (C) reduce colorectal cancer deaths per 100,000 population from 17.1 in 2007 to 14.5 in 2020, a 15% improvement; (D) reduce female breast cancer deaths per 100,000 female population from 23.0 in 2007 to 20.7 in 2020, a 10% improvement; and (E) reduce prostate cancer deaths per 100,000 male population from 24.2 in 2007 to 21.8 in 2020, a 10% improvement. AIAN indicates American Indian/Alaska Native; API, Asian or Pacific Islander.
The target lung cancer death rate (45.5 deaths per 100,000 persons) was met overall and in each sociodemographic group (Figure 2b). During 2007 to 2017, lung cancer death rates decreased 28% overall, ranging from –21% (rural) to –32% (males). Lung cancer screening of adults at high risk was low (about 6% overall); however, it increased from 2010 to 2015 in most groups except in Hispanics and among those with less than or more than a high school education (Figure 3a).
Figure 3.
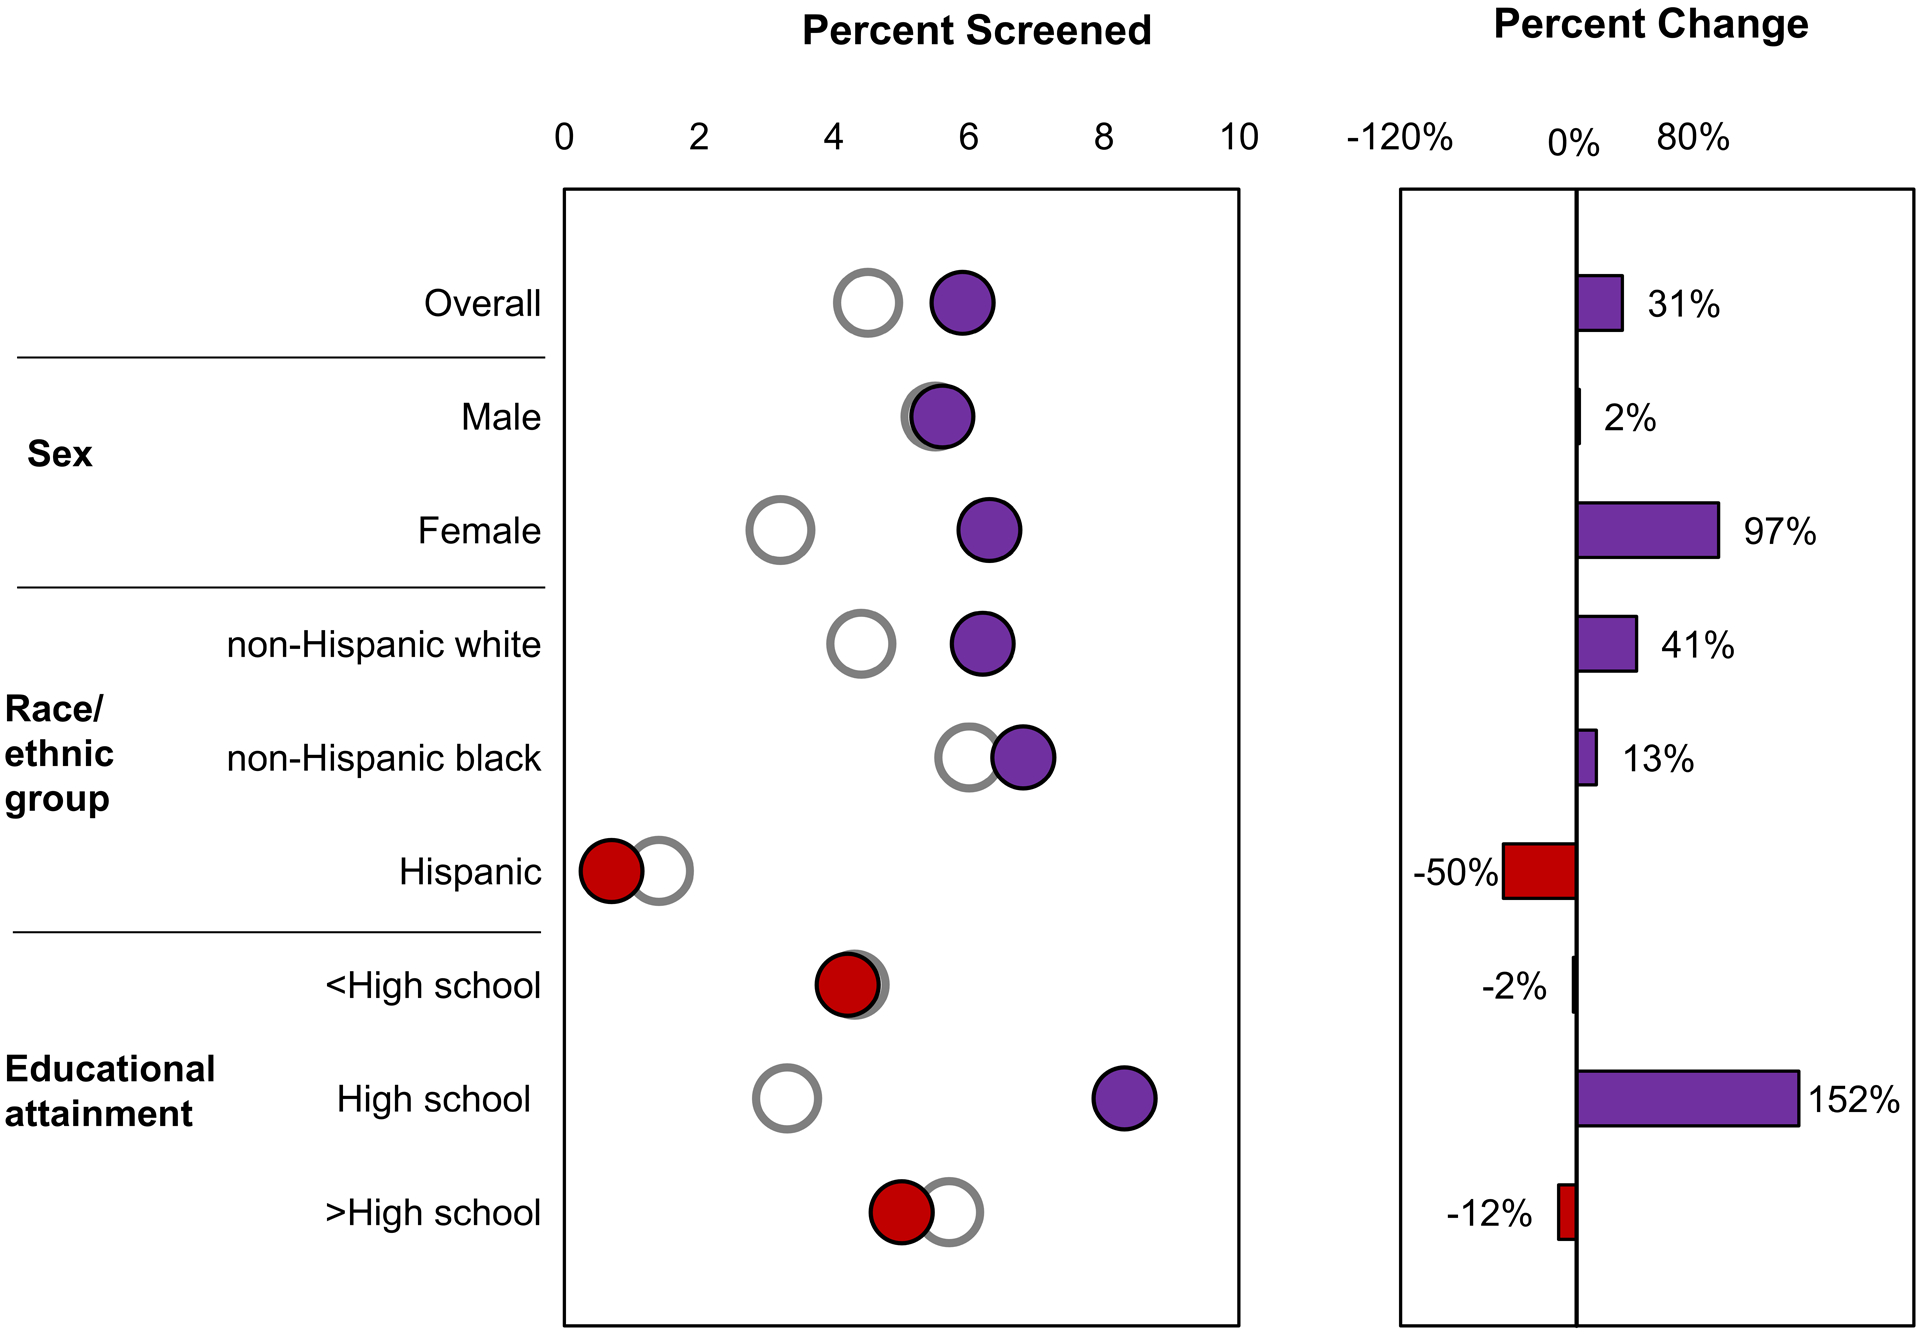
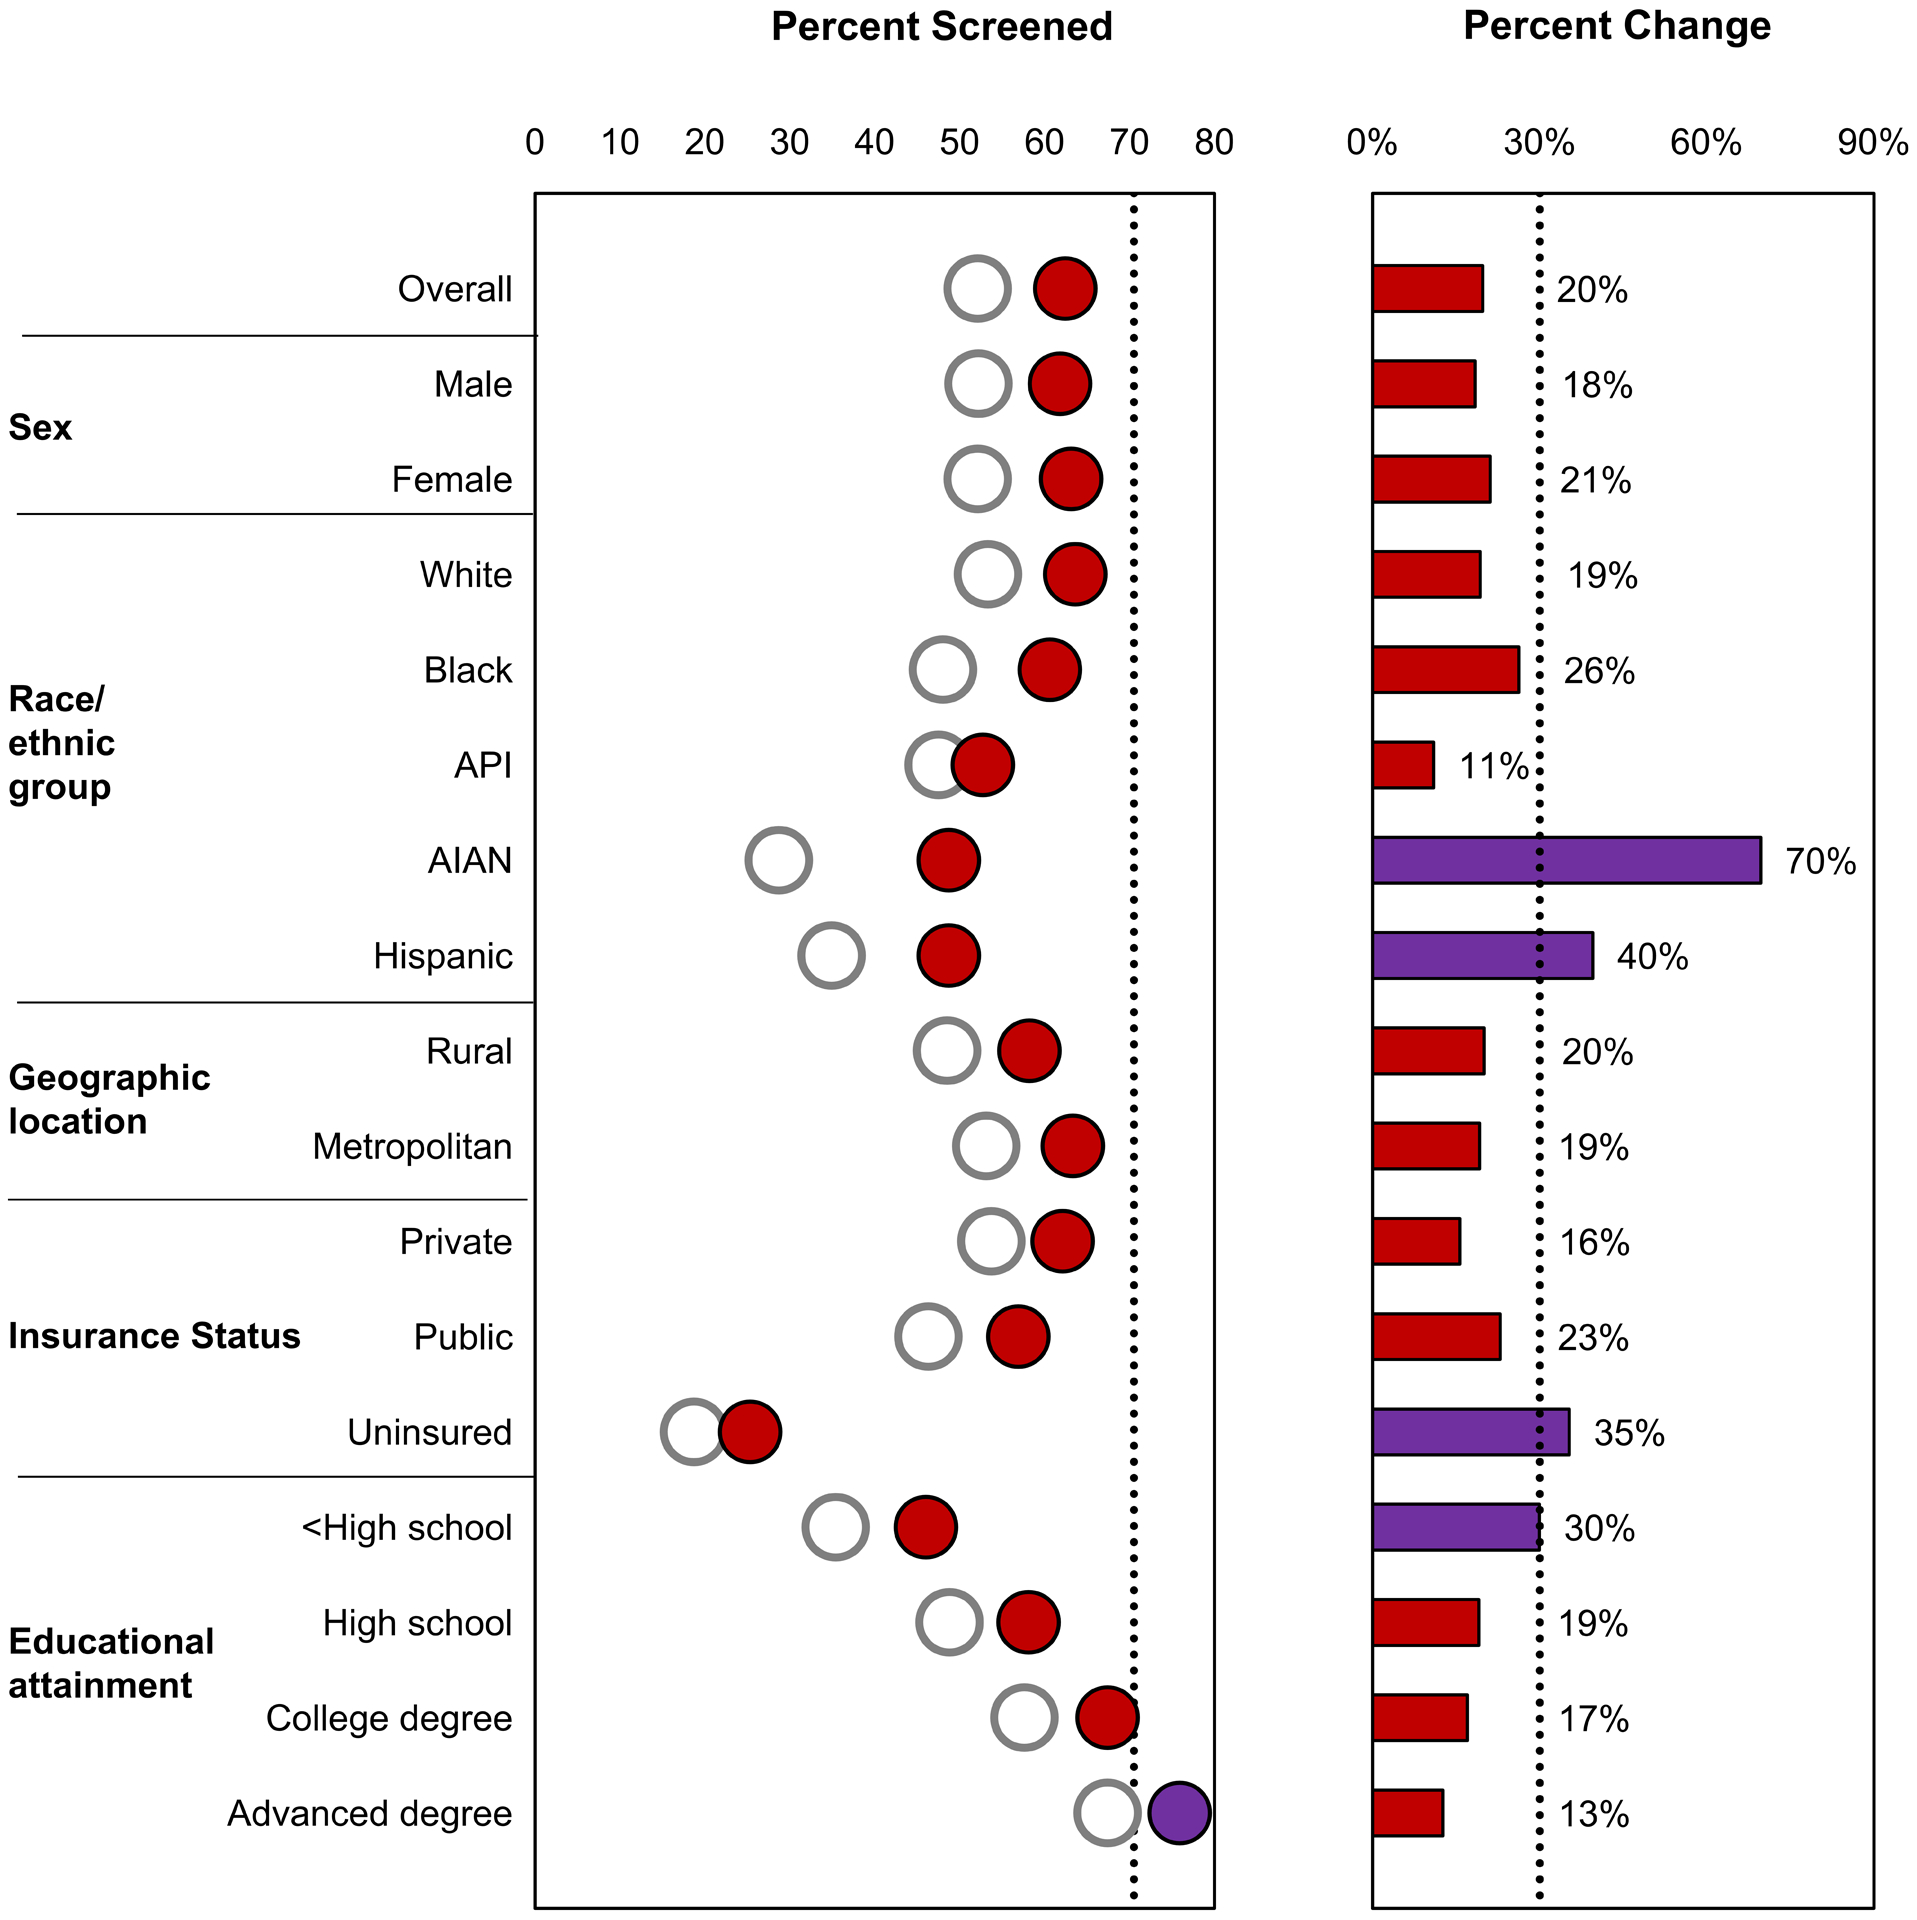
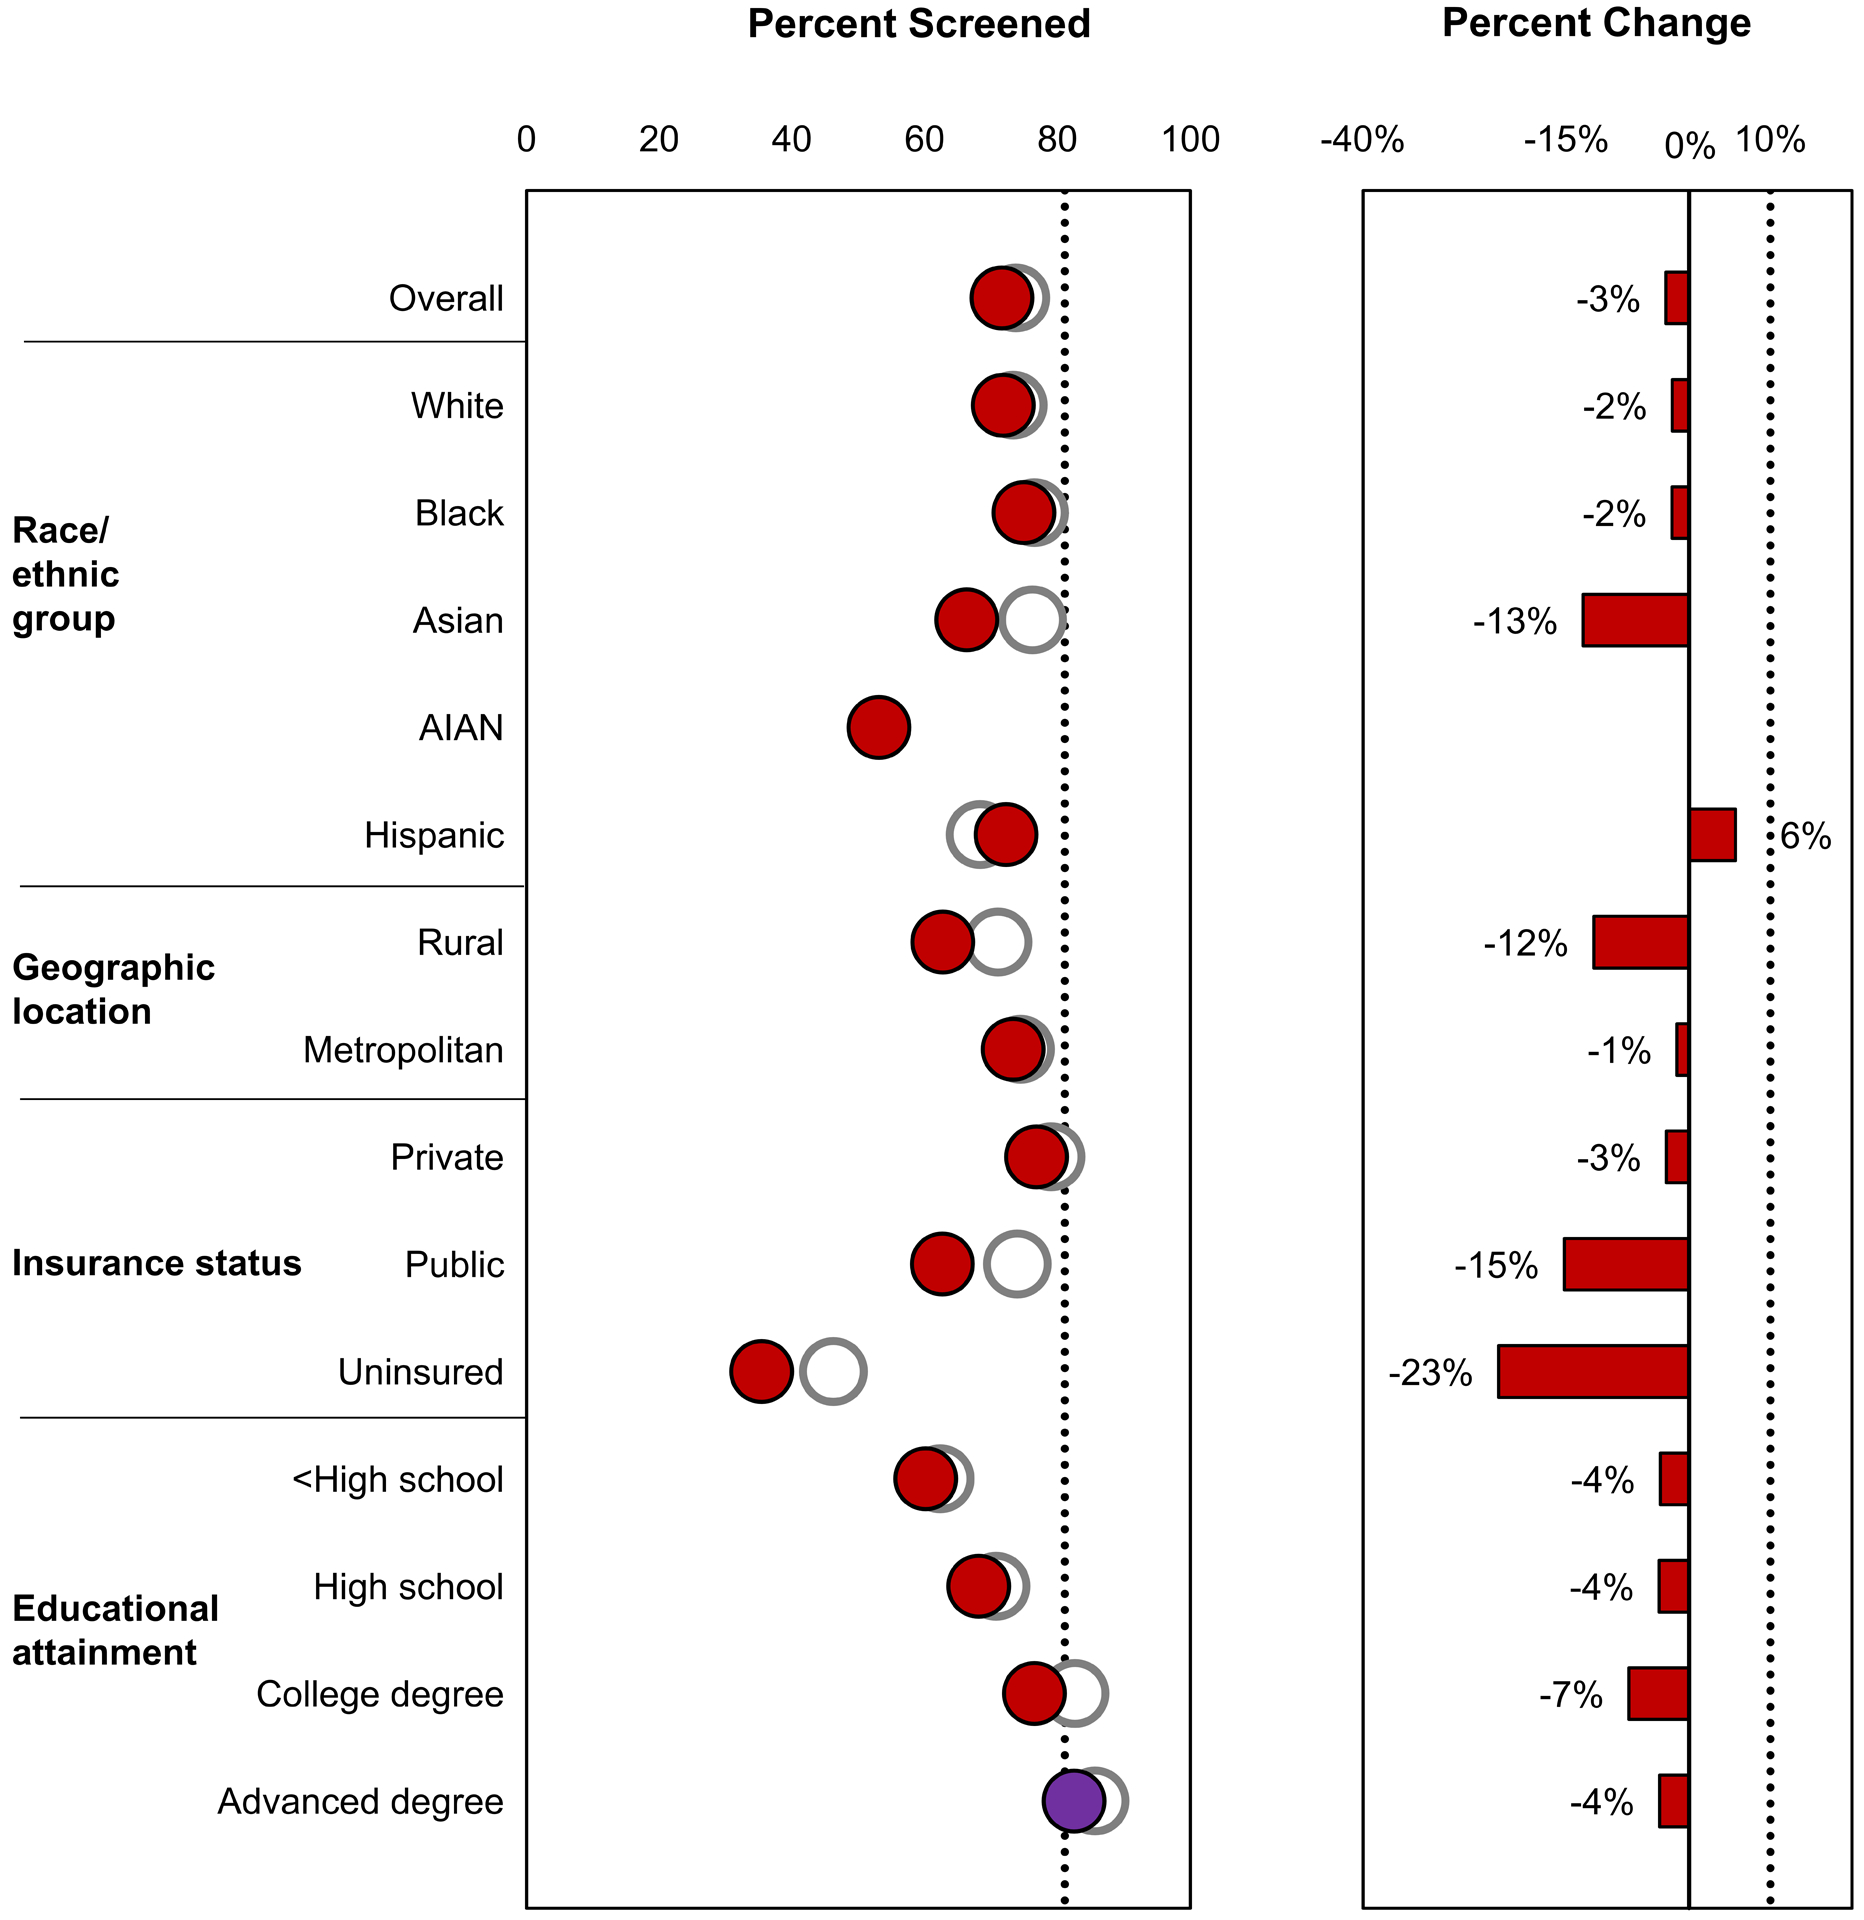
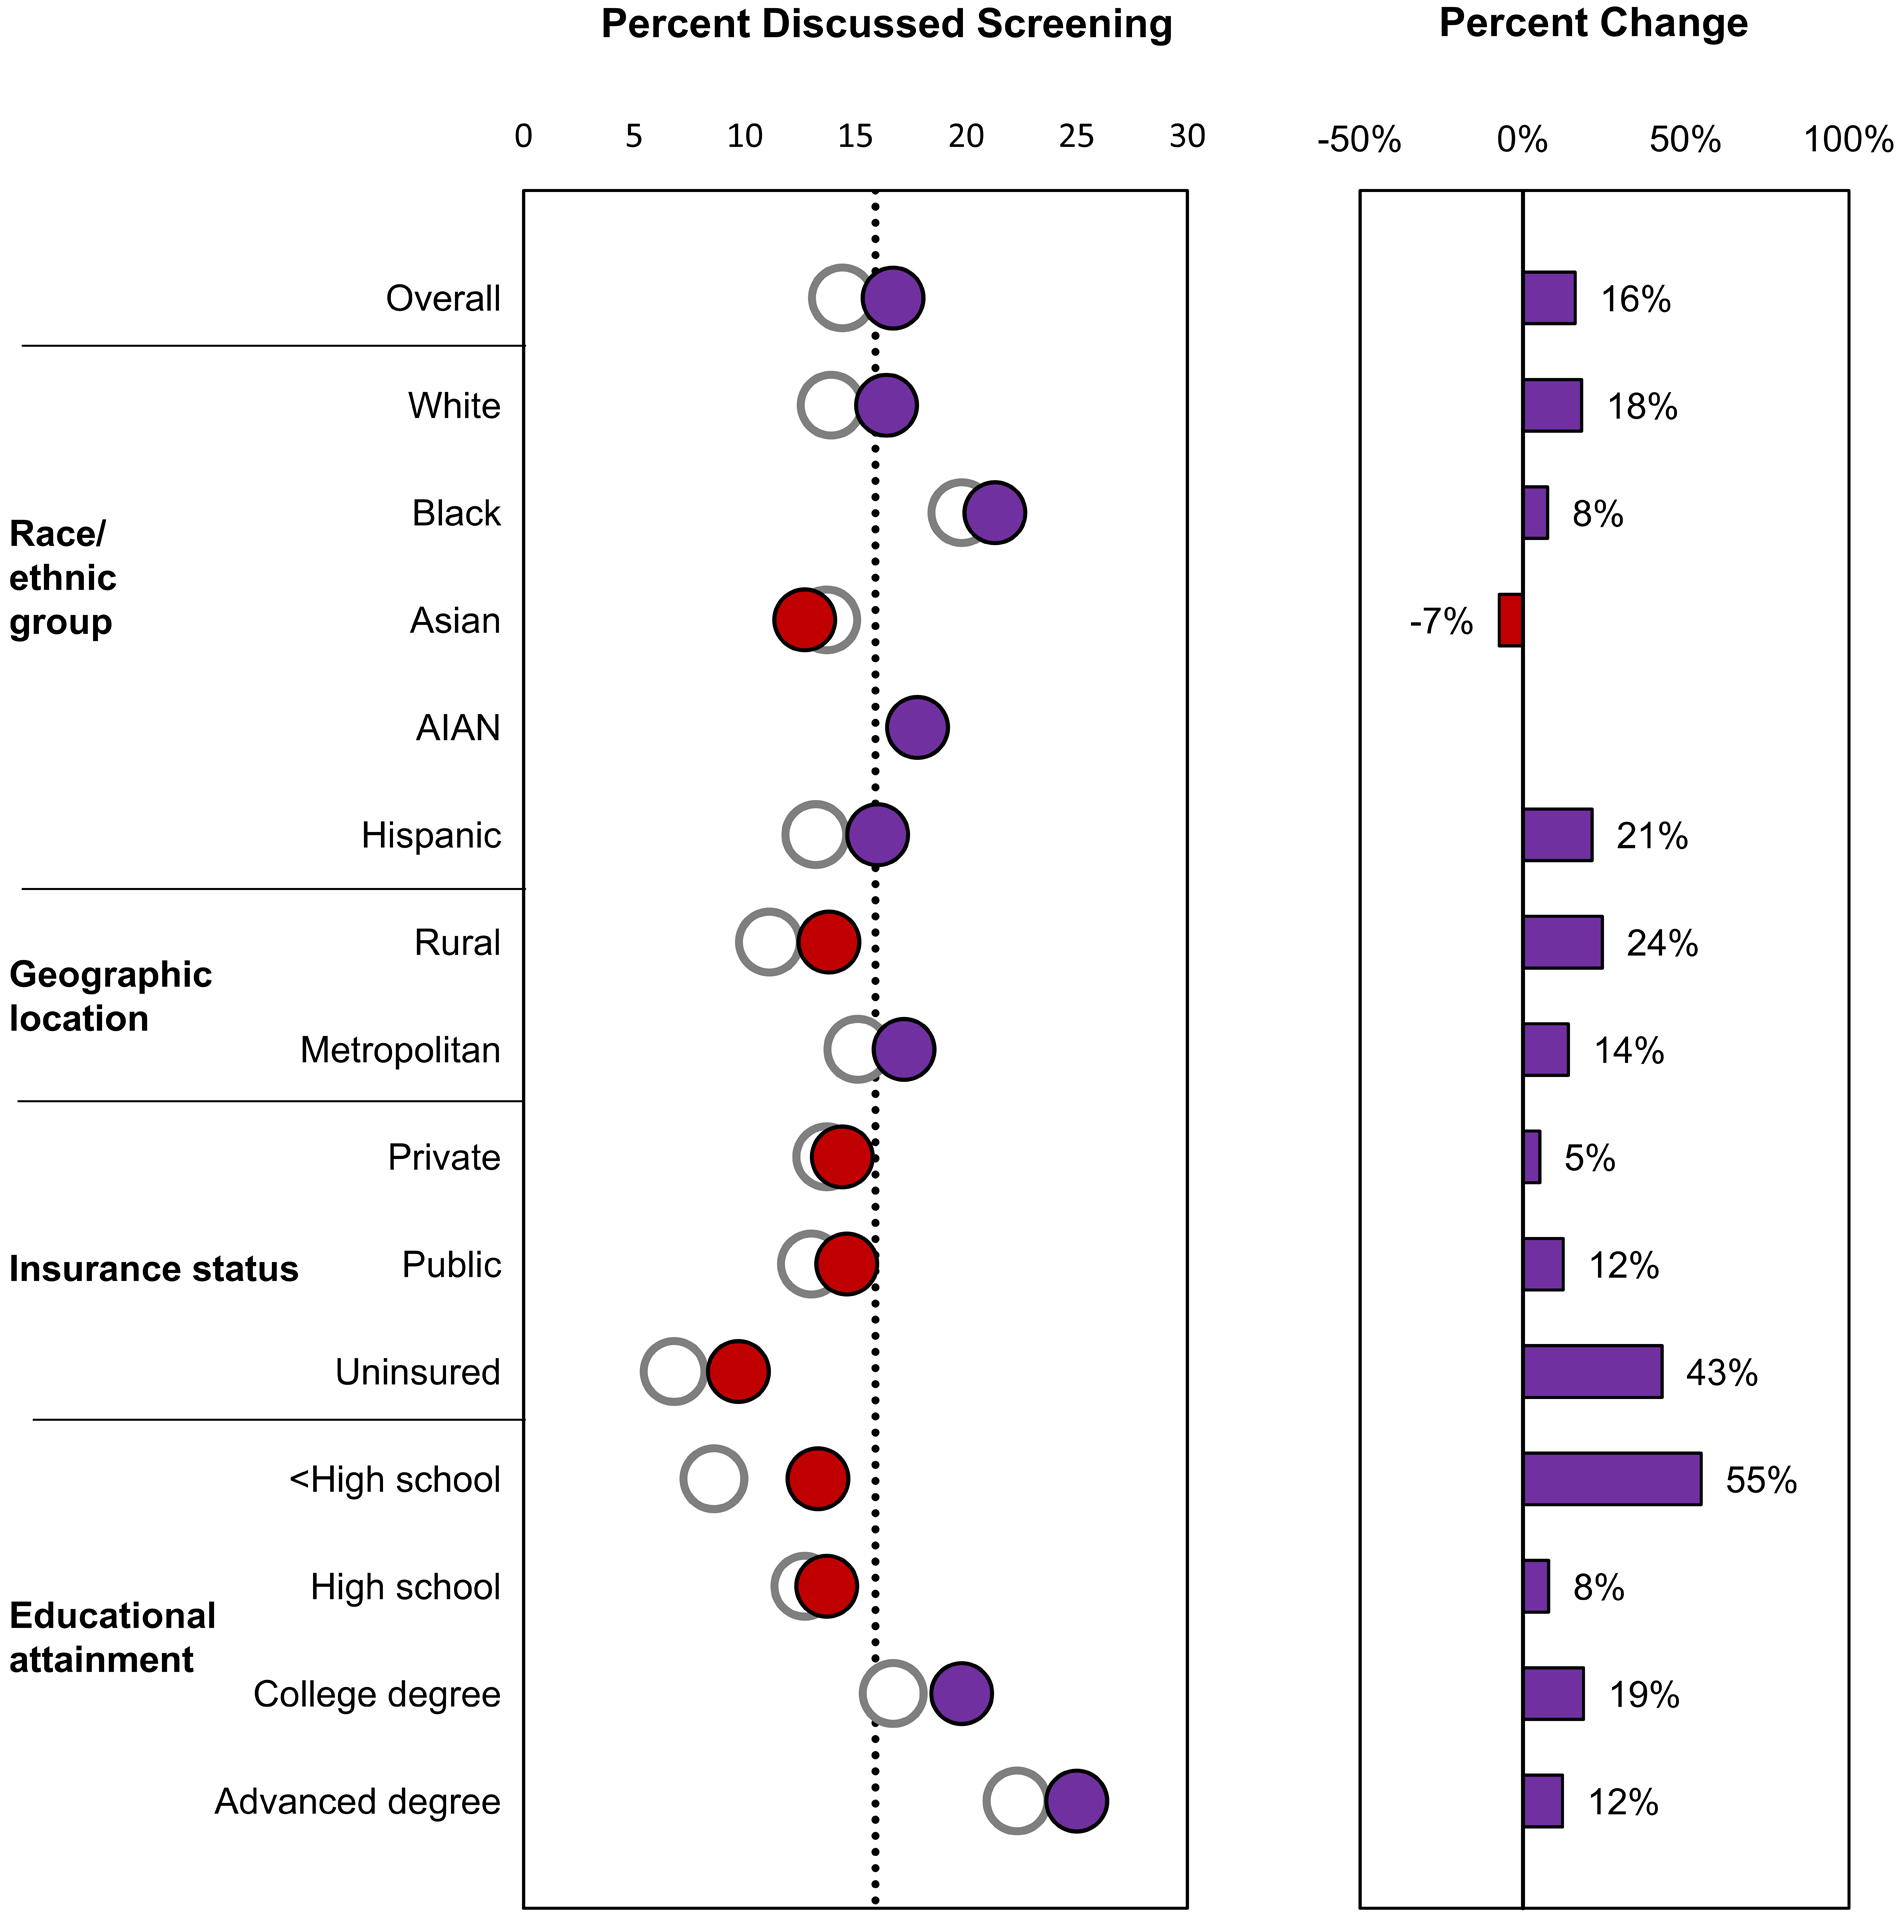
Healthy People 2020 objectives related to cancer screening are illustrated. Data are from the National Health Interview Survey; baseline values are from 2008 (except for lung cancer screening estimates, which are from 2010), and most recent estimates are from 2015. Healthy People 2020 targets are indicated by black dotted lines. The baseline value is indicated as a white circle, and the most recent estimate is indicated as a purple circle if the target was met and as a red circle if the target was not met. The percentage change from the baseline value to the most recent estimate is indicated as a purple bar if the percentage improvement target was met (or if the percentage change was in the indicated direction when a percentage improvement target was not specified) and as a red bar if the percentage improvement target was not met (or if the percentage change was not in the indicated direction when a percentage improvement target was not specified). The Healthy People 2020 targets are: (A) increase the proportion of adults aged 55 to 80 years at high risk of lung cancer based on smoking history who receive lung cancer screening based on the most recent US Preventive Services Task Force (USPSTF) recommendations (note that targets are not indicated because lung cancer screening was not included as a Healthy People 2020 objective); (B) increase the proportion of adults aged 50 to 75 years who receive colorectal cancer screening based on the most recent USPSTF recommendations from 52.1% in 2008 to 70.5% in 2020, a 30% improvement; (C) increase the proportion of women aged 50 to 74 years who receive breast cancer screening based on the most recent USPSTF recommendations from 73.7% in 2008 to 81.1% in 2020, a 10% improvement; and (D) increase the proportion of men aged ≥40 years who discuss the advantages and disadvantages of the prostate-specific antigen test to screen for prostate cancer with their health care provider from 14.4% in 2010 to 15.9% in 2020. AIAN indicates American Indian/Alaska Native; API, Asian or Pacific Islander.
The target colorectal cancer death rate (14.5 deaths per 100,000 persons) was met overall and in several sociodemographic groups, but not in males, blacks, or people in rural areas (Figure 2c). During 2007 to 2017, colorectal cancer death rates decreased 19% overall, with the largest decrease among blacks (–24%) and the smallest decrease among AIAN (–9%). Colorectal cancer screening did not reach the target (70.5%) in any group except those with advanced educational degrees. However, screening uptake increased from 52.1% in 2008 to 62.4% in 2017, and uptake increased by 35% or more in some groups (AIAN, Hispanic, and uninsured) (Figure 3b).
The target female breast cancer death rate (20.7 deaths per 100,000 persons) was met overall and in most groups except black women (26.9) (Figure 2d). From 2008 to 2015, breast cancer screening increased slightly among Hispanic women but declined among other groups, declining more than 10% in some groups, including Asians, women in rural areas, and those with public or no health insurance (Figure 3c). The target for breast cancer screening (81.1%) was not yet met in any group except those with advanced educational degrees. Breast cancer screening uptake was lowest among uninsured women (35.4%).
The target prostate cancer death rate (21.8 deaths per 100,000 persons) was met overall and in most groups (Figure 2e). The target was not met in black men (35.8), although they experienced the largest decrease (–34%) in rates. The objective for prostate cancer screening was to increase the proportion of men who had discussed prostate cancer screening with their clinician to 15.9%, which was met overall (16.7%) and in all race/ethnic groups except Asian, men in metropolitan areas, and men with a college or advanced educational degree (Figure 3d).
While cigarette smoking among adults decreased from 2008 to 2017 in all groups, the target (12%) was not yet met overall or in most groups (Figure 4a). Exceptions were Asians and those with a college or advanced degree who had already met the target in 2008 and Hispanics and those with private insurance who met the target by 2017. People in rural areas, those with public or no health insurance, and those with less than a high school education had the highest smoking prevalence as well as the smallest percentage improvement (<17%).
Figure 4.
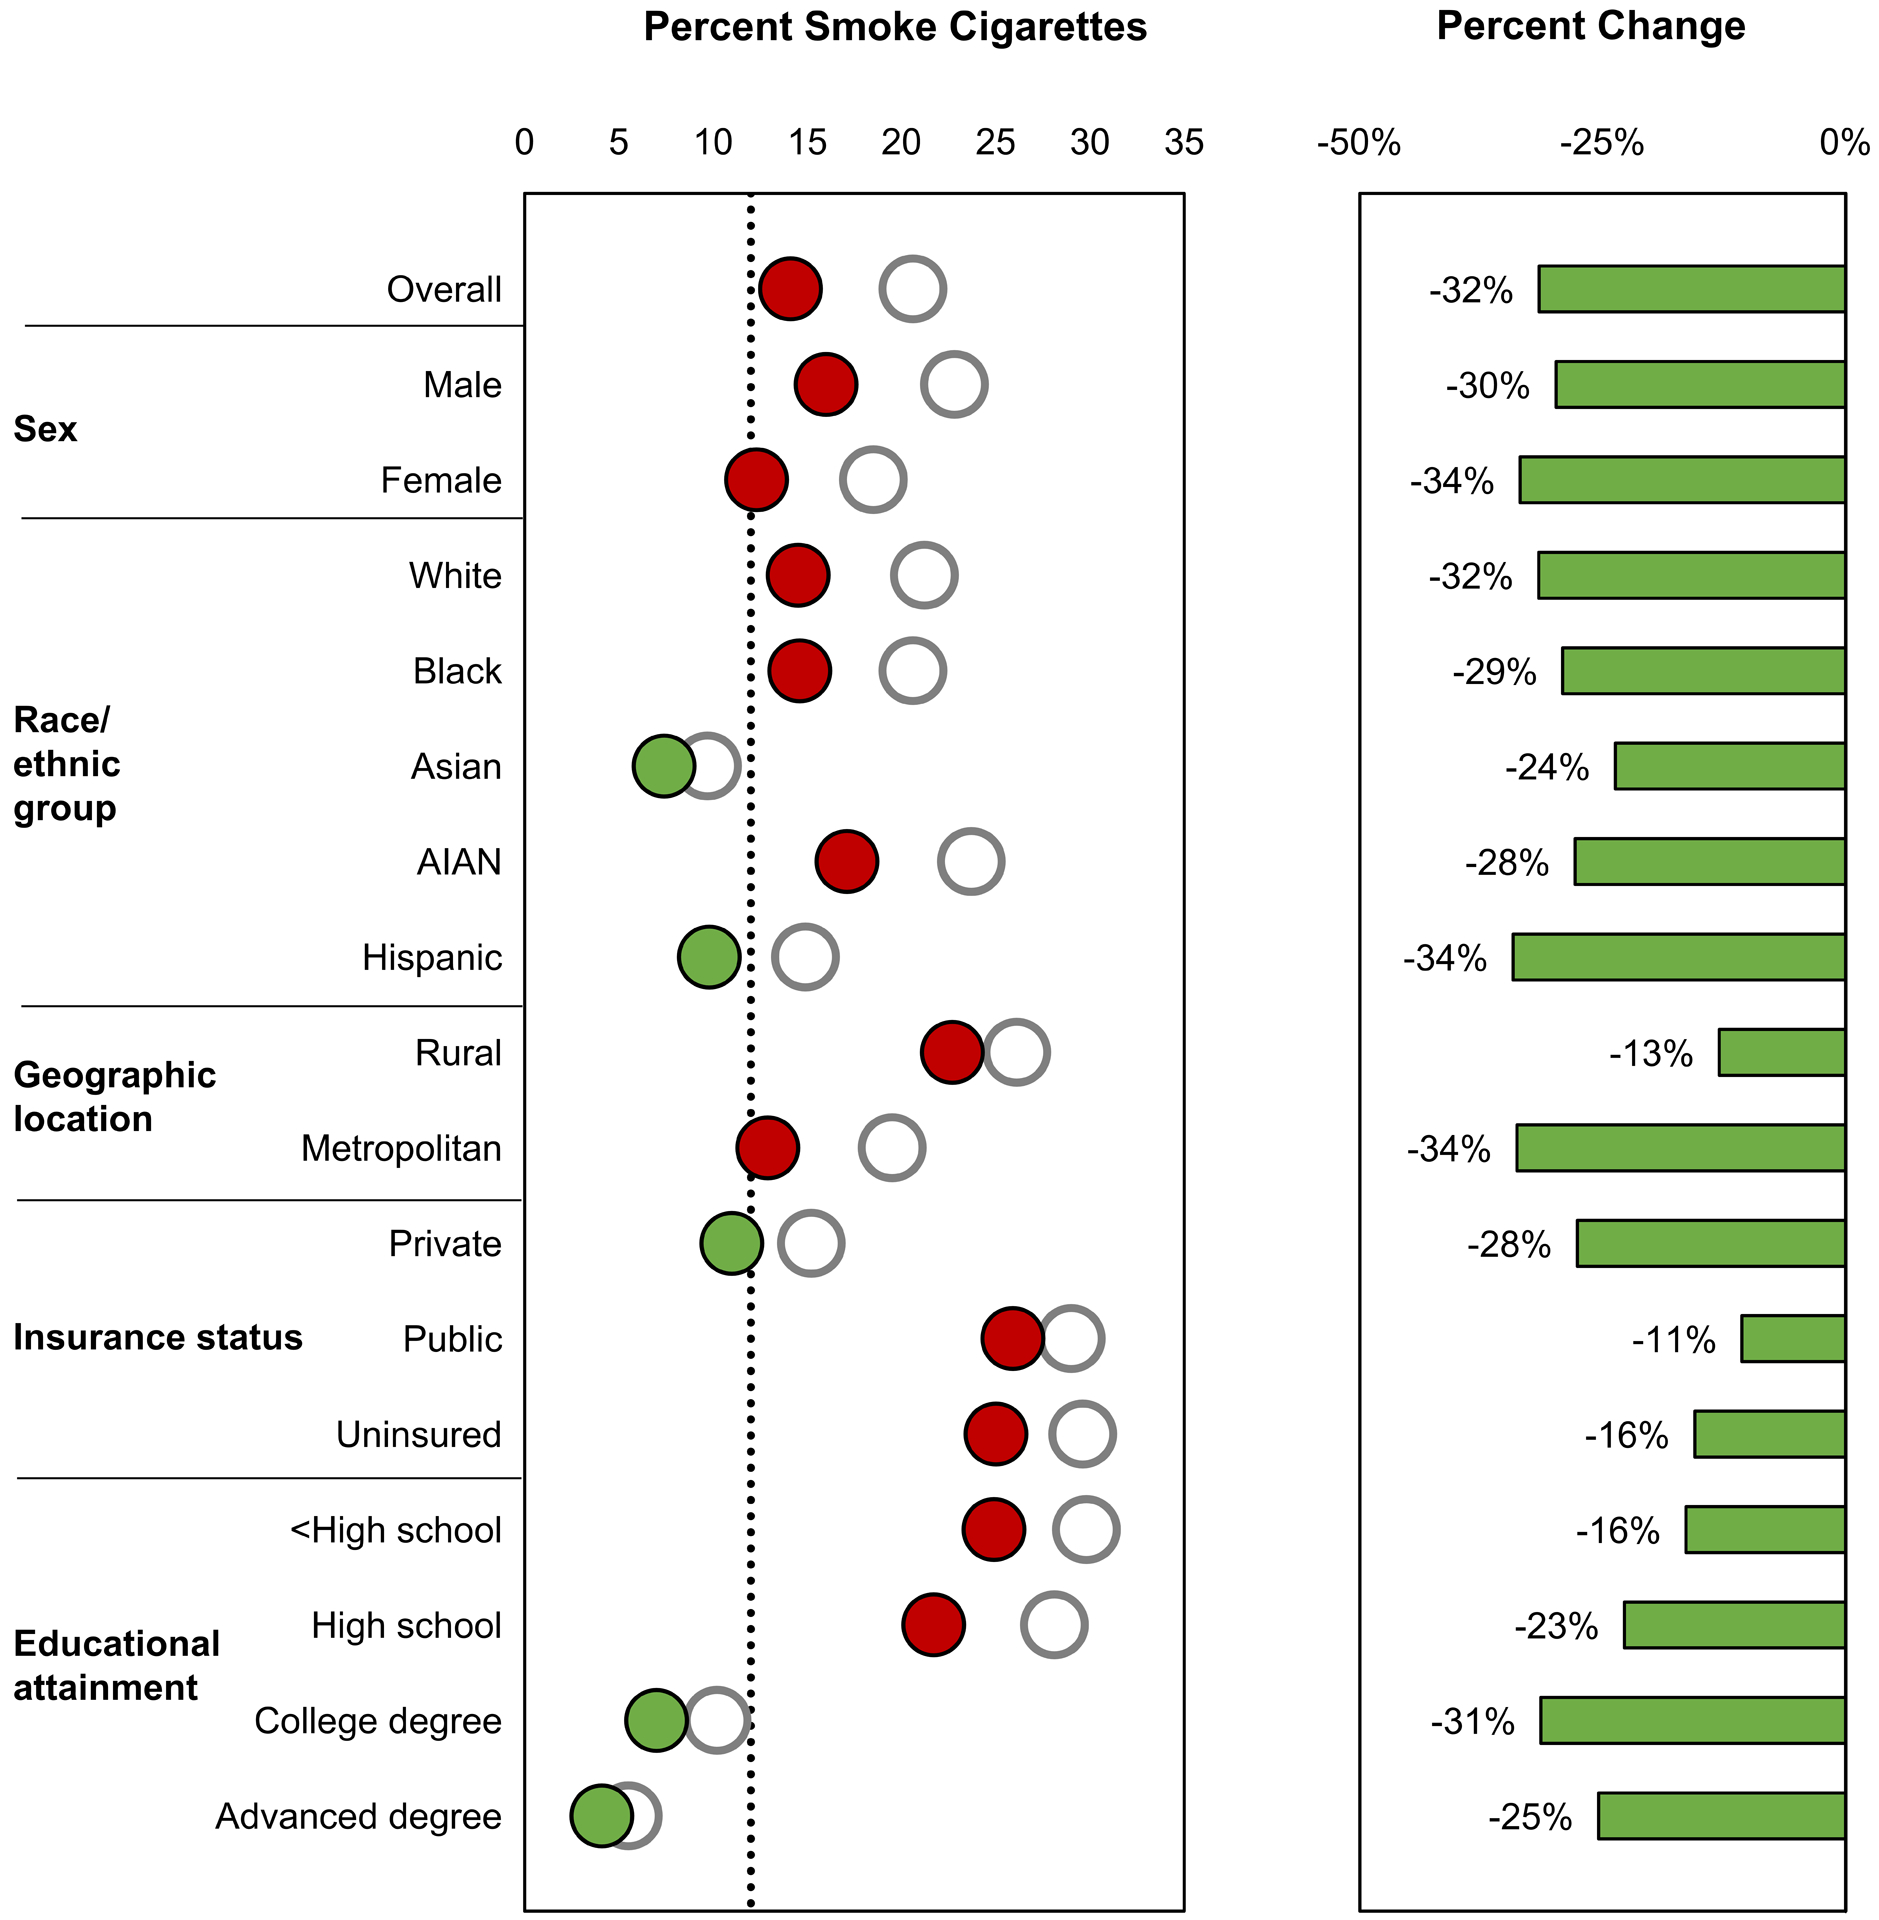
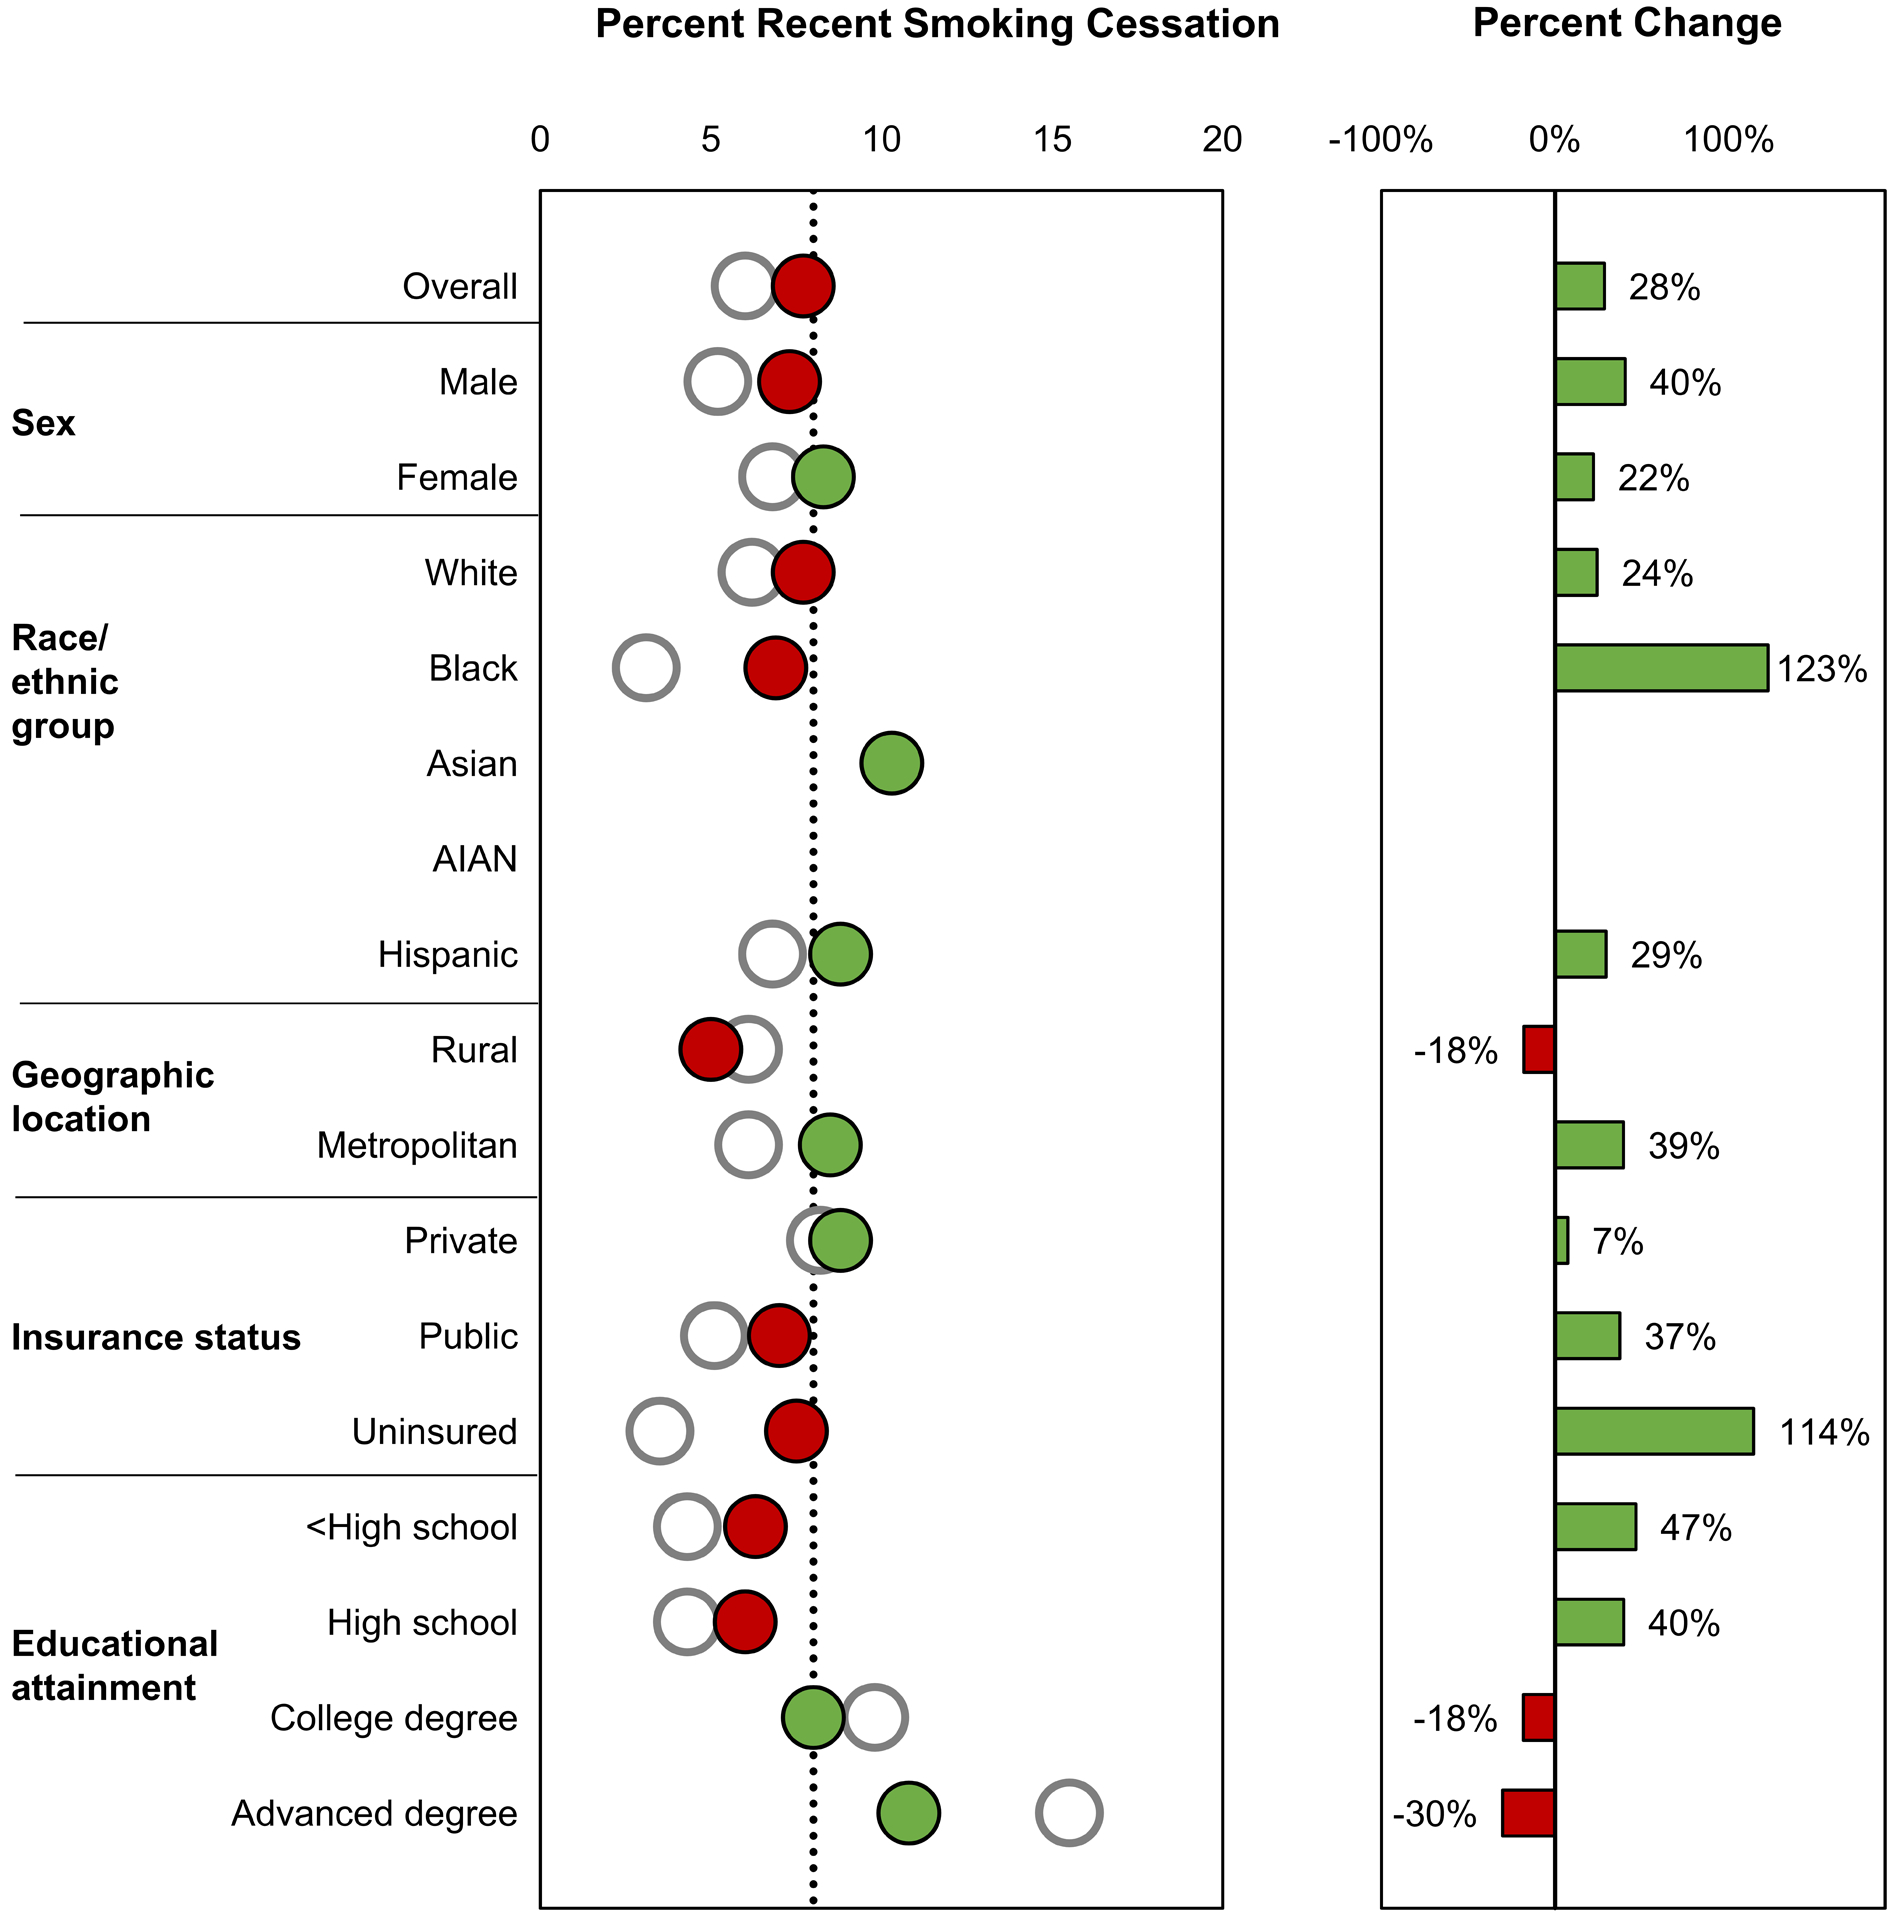
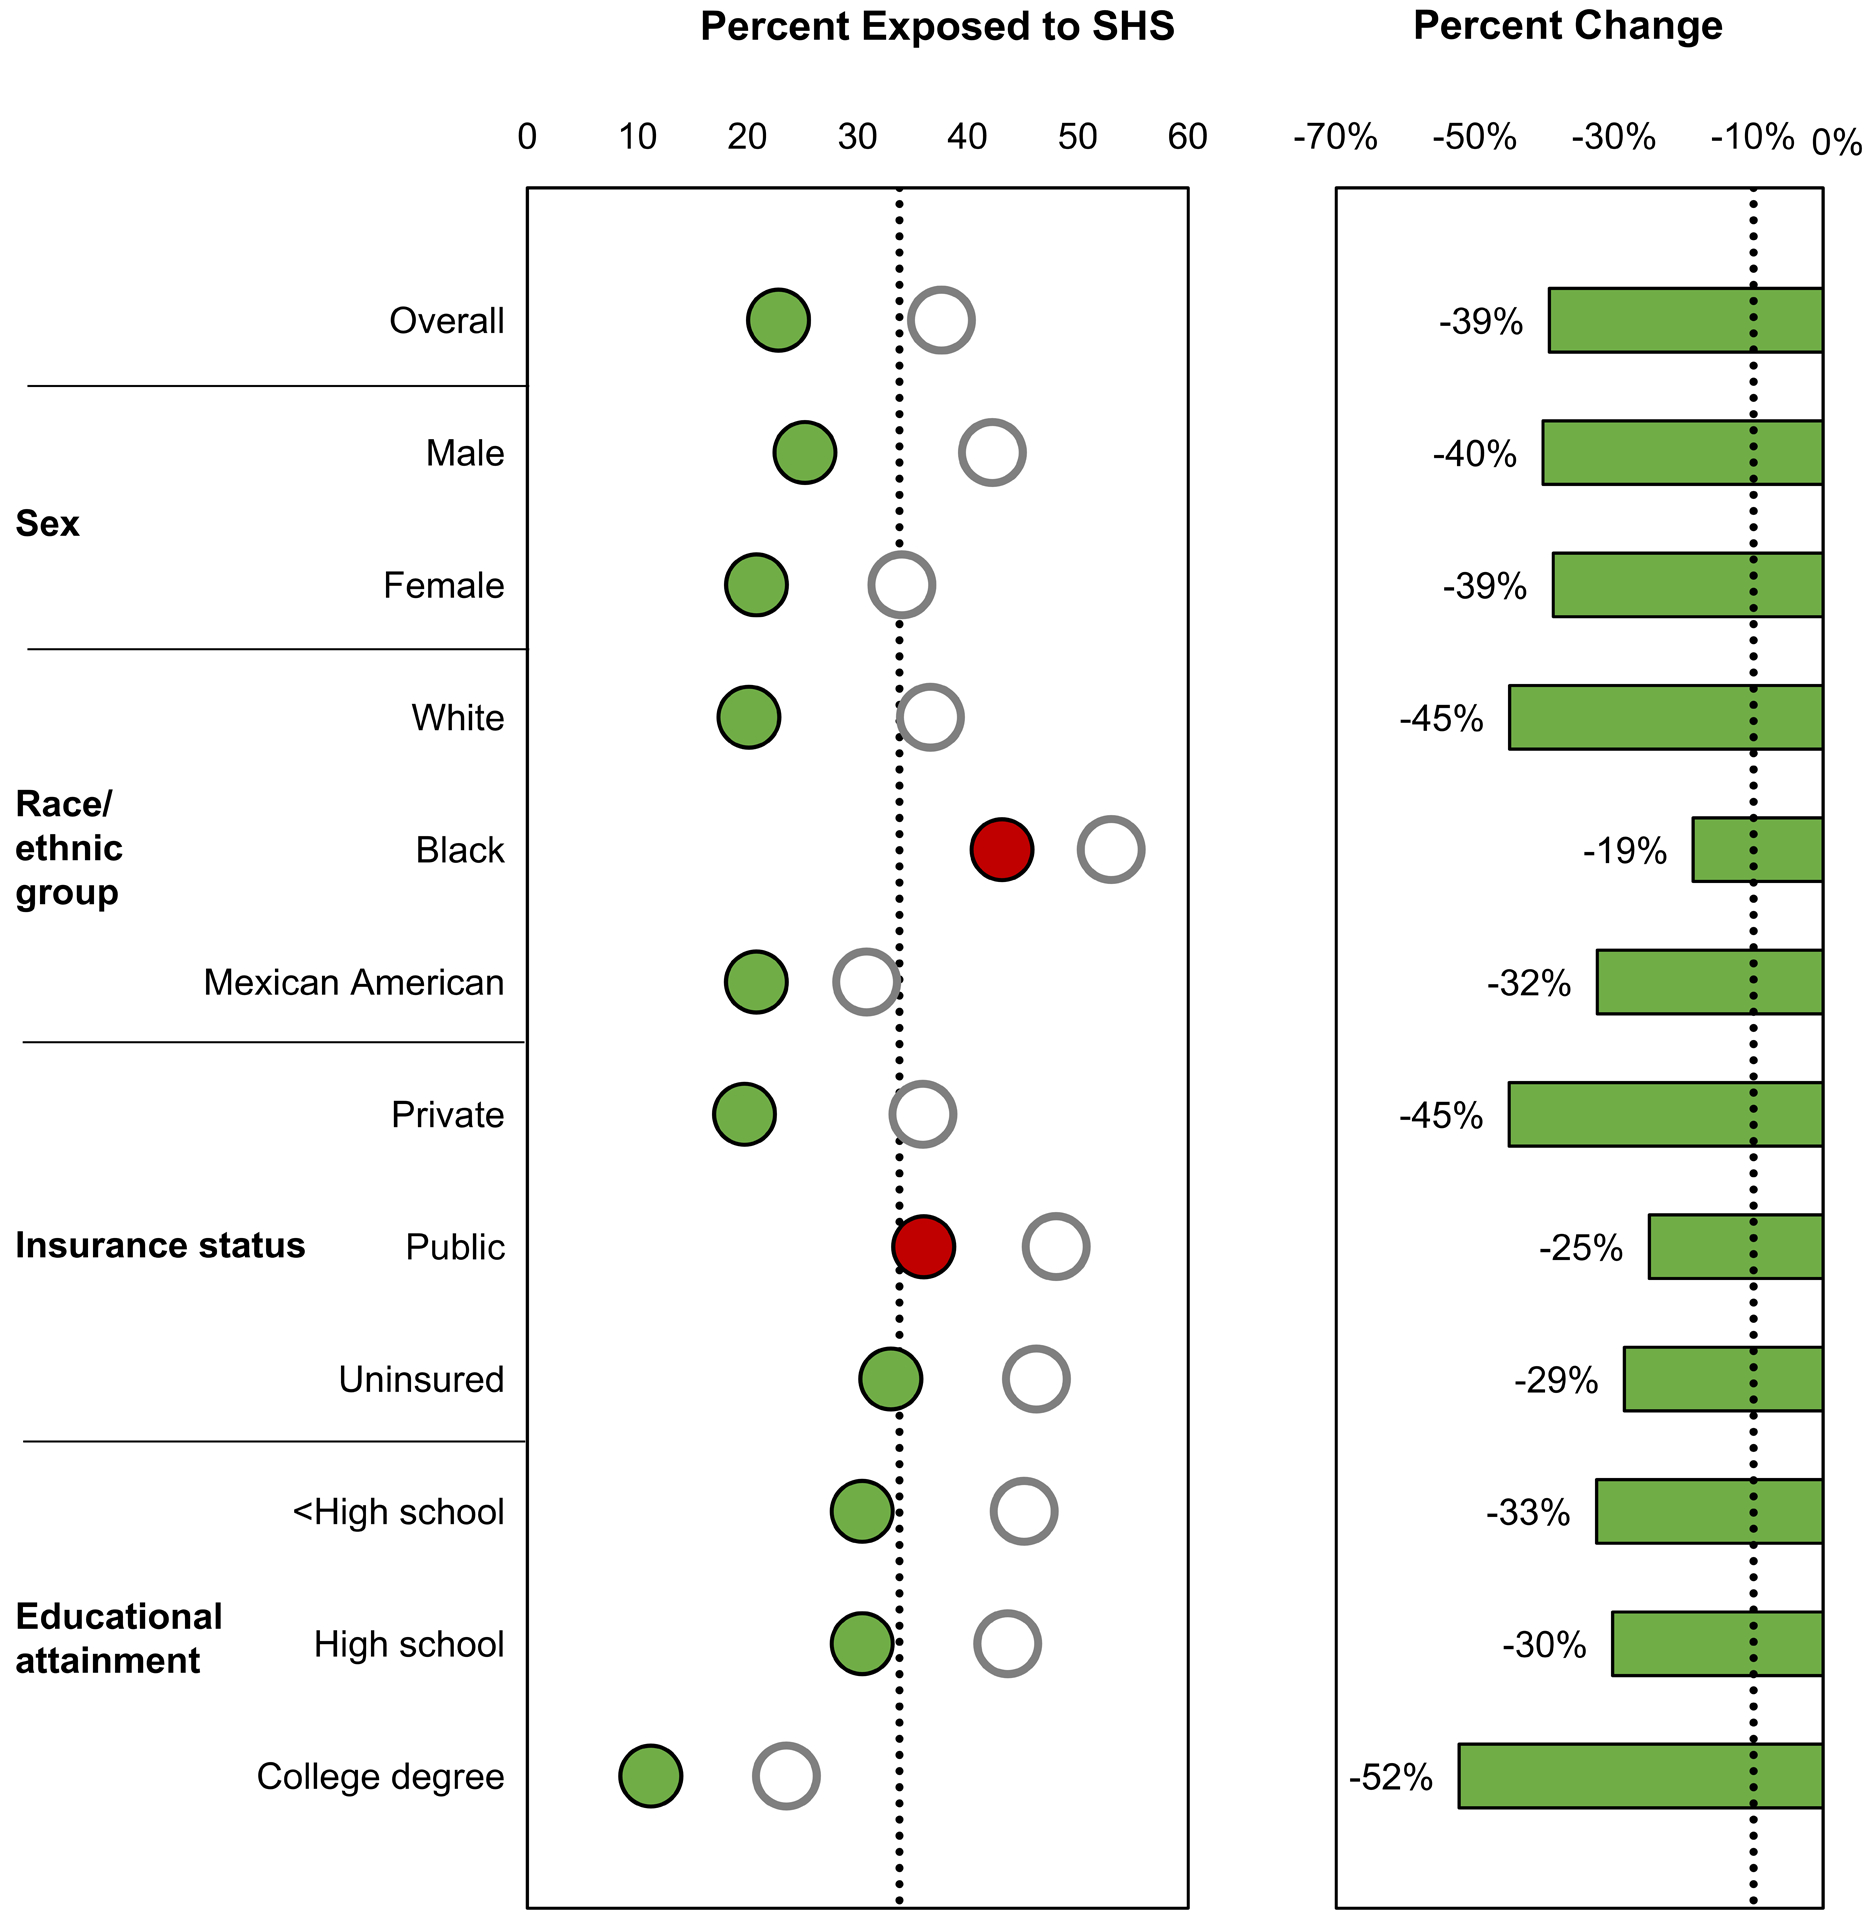
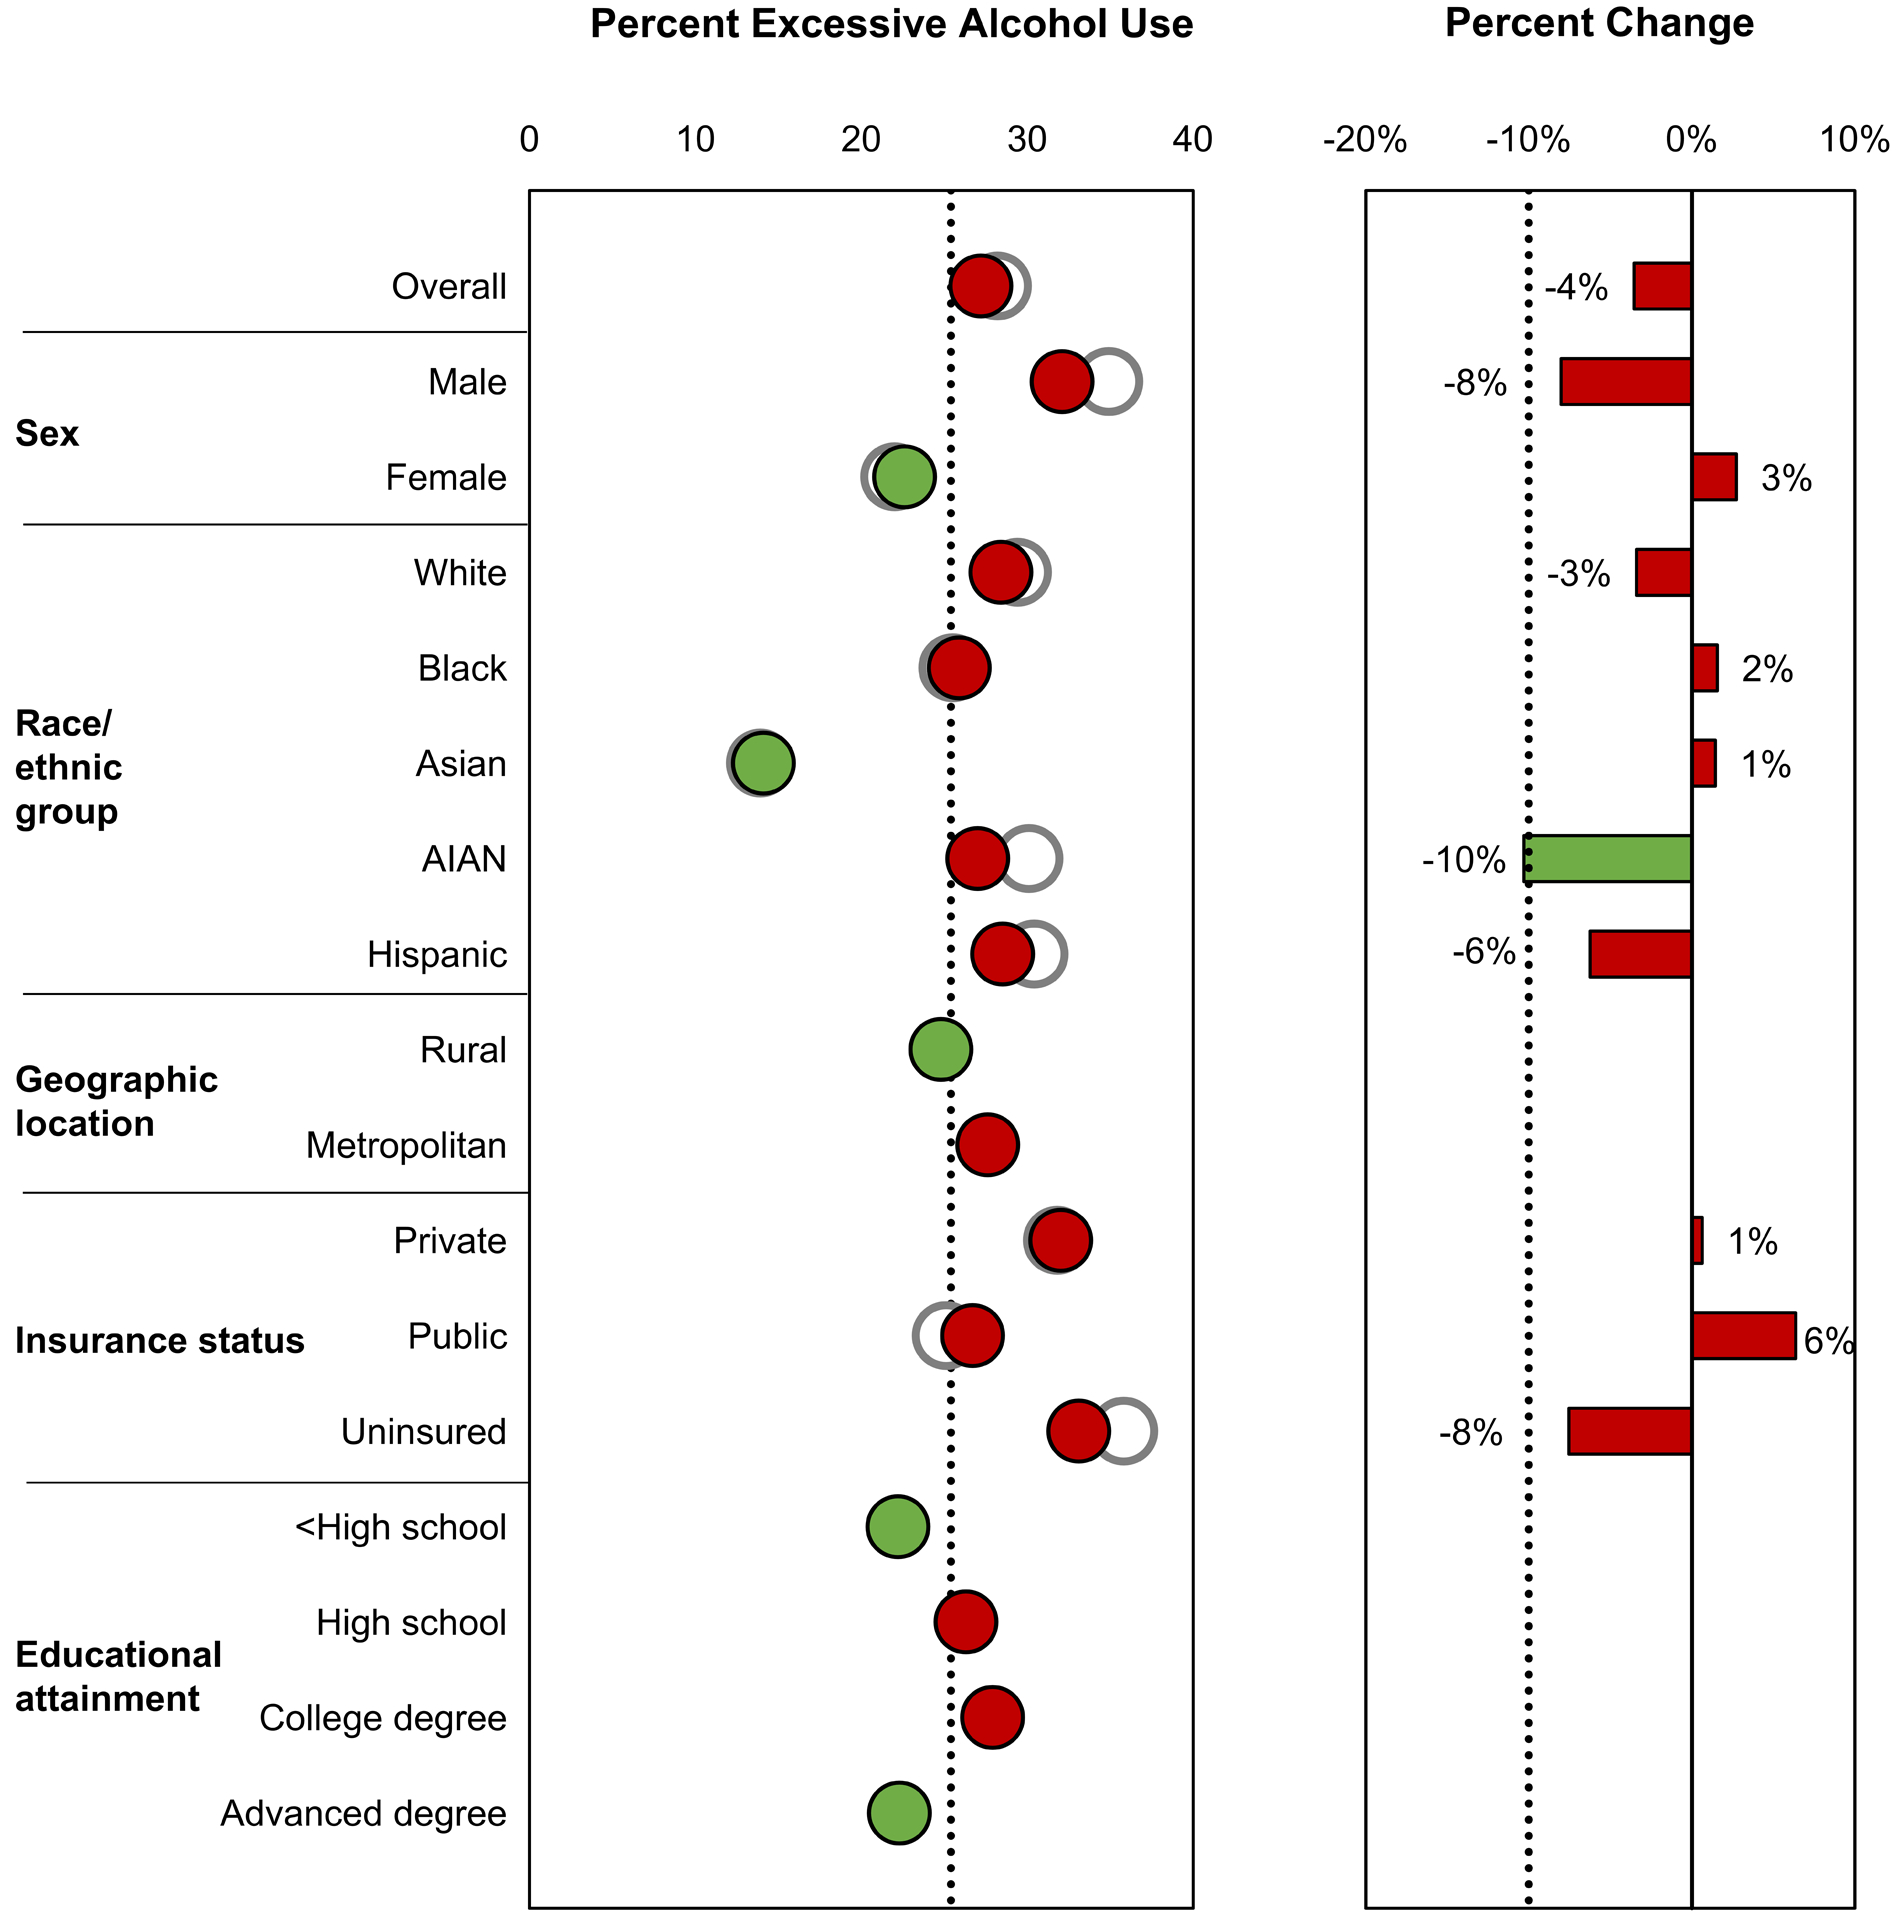
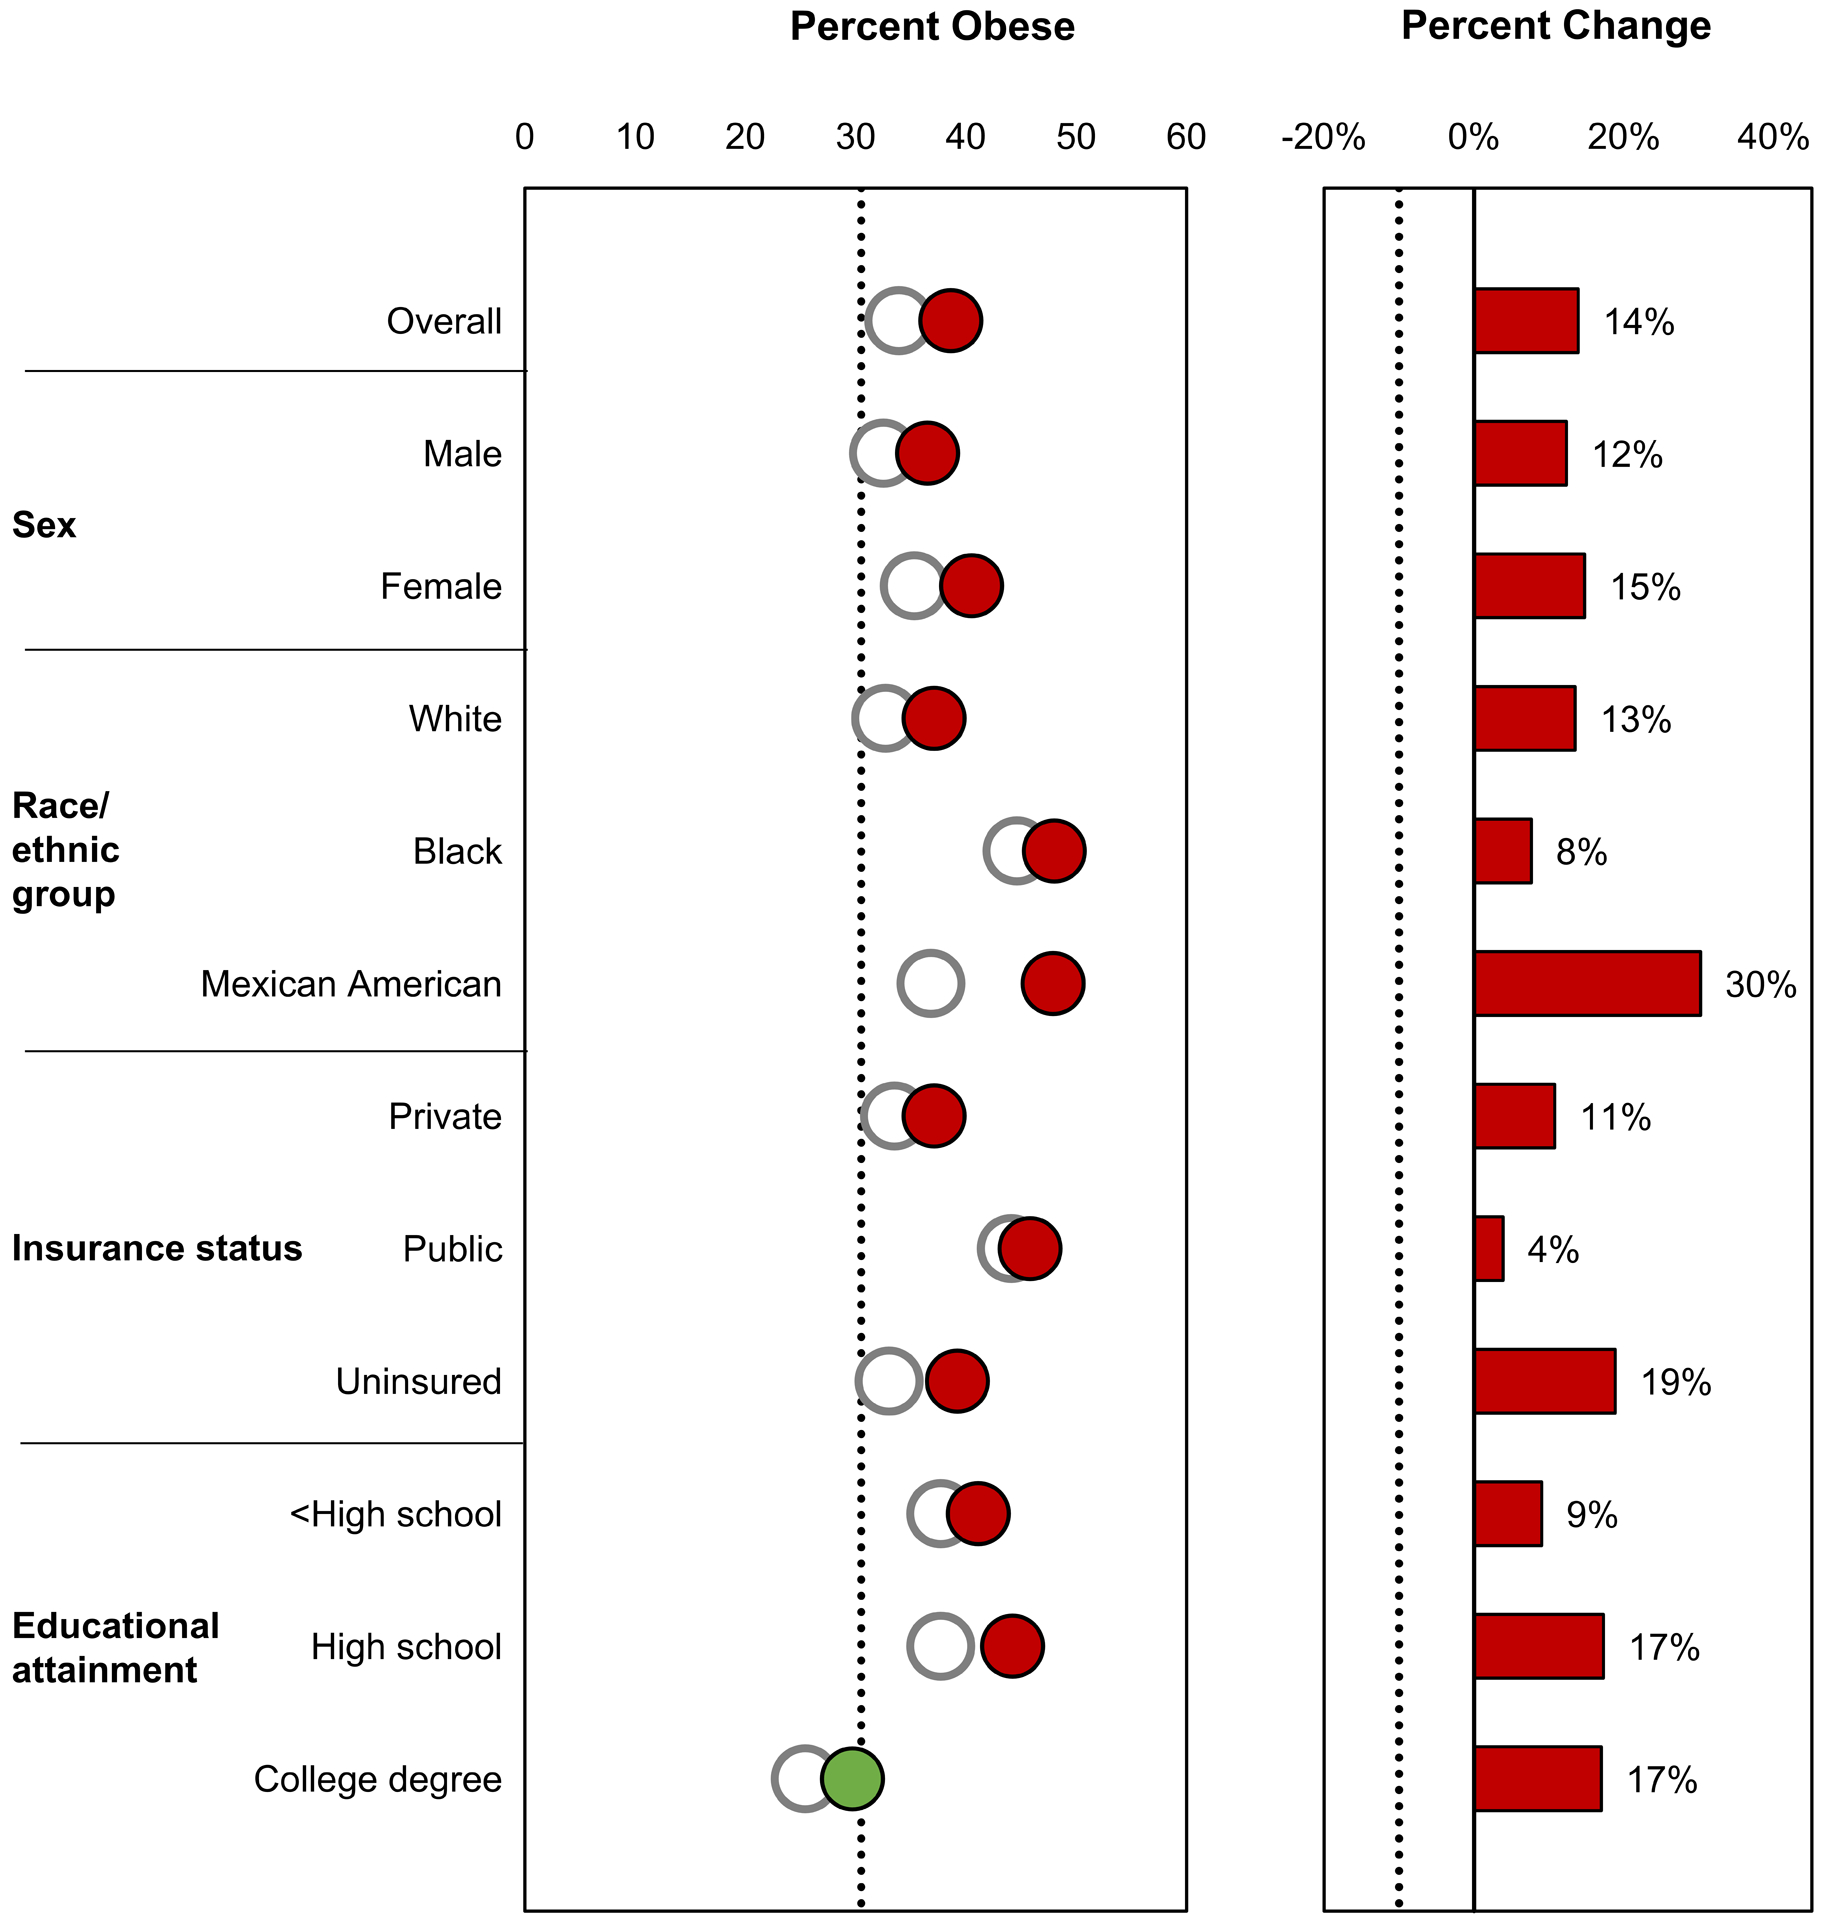
Healthy People 2020 objectives related to cancer risk factors are illustrated. Healthy People 2020 targets are indicated by black dotted lines. The baseline value is indicated as a white circle, and the most recent estimate is indicated as a green circle if the target was met and as a red circle if the target was not met. The percentage change from the baseline value to the most recent estimate is indicated as a green bar if the percentage improvement target was met (or if the percentage change was in the indicated direction when a percentage improvement target was not specified) and as a red bar if the percentage improvement target was not met (or if the percentage change was not in the indicated direction when a percentage improvement target was not specified). The Healthy People 2020 targets are: (A) reduce adult cigarette smoking prevalence from 20.6% in 2008 to 12.0% in 2020 (data are from the National Health Interview Survey; most recent estimates are from 2017); (B) increase recent smoking-cessation success among adult smokers from 6.0% in 2008 to 8.0% in 2020, a 2 percentage point improvement (data are from the National Health Interview Survey; most recent estimates are from 2017); (C) reduce the proportion of adults aged ≥18 years who are exposed to secondhand smoke from 37.6% in 2005 to 2008 to 33.8% in 2020, a 10% improvement (data are from the National Health and Nutrition Examination Survey; most recent estimates are from 2011–2014); (D) reduce the proportion of adults who drank alcohol excessively in the previous 30 days from 28.2% in 2008 to 25.4% in 2020, a 10% improvement (data are from the National Survey on Drug Use and Health; most recent estimates are from 2016; note that baseline values were not available by educational attainment); (E) reduce the proportion of adults who have obesity from 33.9% in 2005 to 2008 to 30.5% in 2020, a 10% improvement (data are from the National Health and Nutrition Examination Survey; most recent estimates are from 2013–2016); and (F) increase the proportion of adults who meet the objectives for aerobic physical activity and for muscle-strengthening activity from 18.2% in 2008 to 20.1% in 2020, a 10% improvement (data are from the National Health Interview Survey; most recent estimates are from 2017). AIAN indicates American Indian/Alaska Native; SHS, secondhand smoke.
The target for recent smoking cessation was not yet met overall (8%) or in many groups; exceptions were females, Asians, Hispanics, those in metropolitan areas, those with private insurance, and those with a college or advanced degree (Figure 4b). While blacks and those with no health insurance did not meet the smoking cessation target, the proportion who successfully quit in these groups increased more than 110% from 2008 to 2017. In contrast, while those with those with a college or advanced degree met the smoking cessation target in 2008 and 2017, the proportion decreased from 2008 to 2017.
Between 2005–2008 and 2011–2014, exposure to secondhand smoke decreased 39% overall, reaching the target (33.8%) in most groups; exceptions were blacks (43%) and those with public health insurance (36%), although exposure in those groups did decrease more than 10% (Figure 4c). Those with a college degree had the lowest proportion exposed to secondhand smoke and had already met the target in 2005–2008 as had Mexican/Americans.
The proportion of adults who drank alcohol excessively changed less than 10% during 2008 to 2016 among most groups, with the exception of AIAN (–10%) (Figure 4d). Most groups did not yet meet the target for reducing excessive alcohol use (25.4%); exceptions were females, Asians, those in rural areas, those with less than a high school education, and those with an advanced educational degree.
The objective for obesity was to reduce the proportion of adults who have obesity to 30.5%; however, the prevalence of obesity increased among all groups between 2005–2008 and 2013–2016 (Figure 4e). In 2013–2016, 39% of all adults had obesity.
The proportion of adults who met physical activity guidelines increased from 2008 to 2017 in all groups, and many groups met the target (20.1%) (Figure 4f). Exceptions were Hispanics, those in rural areas, those with public or no health insurance, and those with a high school degree or less; however, each of these groups exceeded a 10 percentage point improvement.
DISCUSSION
In the past few decades, advances in cancer research have led to great improvements in the prevention, early detection, and treatment of cancer. This progress has been reflected in a continuous decline in overall cancer death rates and gradual increases in cancer survival.25–28 However, cancer death rates have not declined at the same pace for all cancer types or in all sociodemographic groups, indicating that communities in the United States have not benefited equally from initiatives to reduce the cancer burden. This paper describes disparities in cancer risk factors and use of cancer screening tests which, if not effectively addressed, may result in persistent and widening disparities in cancer mortality over time. The discussion focuses on interventions to promote healthy behaviors and environments.
Tobacco
Since the inception of Healthy People, cigarette smoking has remained a priority area for the nation and is a leading health indicator—a high-priority topic area with actionable steps.2 Active cigarette smoking accounts for about 80% of the estimated 143,000 lung cancer deaths occurring each year, representing the largest number of preventable cancer deaths in the United States.9,22 This report showed that between 2007 and 2017, lung cancer death rates in the United States decreased by 28% overall and by at least 21% in each of the sociodemographic groups, far exceeding the 10% Healthy People 2020 target. This favorable trend reflects improvements in diagnosis and treatment as well as the steep decline in smoking prevalence over the past several decades,29,30 which is partly due to broad implementation of proven population-based tobacco control measures and increased awareness of the health hazards of cigarette smoking.9 The long-term health consequences of marijuana and novel tobacco products, such as e-cigarettes, are not yet well understood, but continued surveillance of cancer and other diseases may help provide insight into the health effects of using such products.30
While considerable progress in decreasing tobacco use has been made,31 our report shows that the overarching Healthy People 2020 targets for reducing adult smoking and increasing recent smoking cessation have not yet been achieved in all sociodemographic groups. Disparities in smoking prevalence can be reduced by ensuring that tobacco control policies reach and impact all population groups equally,32 and by implementing focused interventions in high-burden groups. For example, the FDA’s The Real Cost campaign uses extensive research to develop effective outreach strategies and messaging to reach susceptible youth audiences.33,34 Population-based tobacco control strategies include increasing the unit price of tobacco, regulation of all tobacco products, increasing the minimum purchasing age for tobacco products to 21 years, and lowering nicotine levels in combustible tobacco products to non-addictive levels.9,35,36 Achieving geographic health equity also depends on ensuring adequate funding for and capacity of state tobacco control programs.35
Tobacco dependence is a chronic, relapsing condition that often requires repeated intervention and long-term support.37 Individual, group, and telephone cessation counseling and US Food and Drug Administration (FDA)-approved cessation medications are effective in increasing quit rates; the combination of counseling and medication is even more effective than either treatment alone.37,38 Barriers to accessing these treatments include lack of health insurance, insurance that does not cover these treatments, and coverage barriers that make it difficult to access covered treatments (e.g., copayments, prior authorization, and limits on coverage for annual or lifetime cessation attempts).39 Comprehensive coverage of proven cessation treatments with no or minimal barriers can increase the number of people who use cessation treatments and succeed in quitting.37 Promoting cessation efforts among groups with high smoking prevalence40 or low quit rates41 can reduce disparities. For example, CDC supports a consortium of national organizations to reduce tobacco use in populations that experience tobacco-related health disparities.42 National media campaigns, such as CDC’s Tips From Former Smokers® (Tips®), are an important population-level strategy that can reach the overall population of people who smoke as well as specific population groups, such as those living with mental health conditions.43 Implementing health system changes, such as offering evidence‐based smoking cessation treatment to every patient who uses tobacco at every medical encounter, engaging all care team members in tobacco treatment delivery, or referring patients to a dedicated tobacco cessation counselor, can facilitate treatment and follow-up of patients.37 To identify feasible approaches for providing smoking cessation services in a variety of clinical settings, NCI awarded six grants to support research on the design and implementation of smoking cessation interventions in lung cancer screening settings.44 NCI also funds 42 NCI-designated cancer centers as part of the Cancer Center Cessation Initiative to integrate smoking cessation treatment into oncology care.45 Additionally, standardizing the clinical assessment of tobacco use and incorporating these fields in electronic health records can help identify patients who would benefit from tobacco use and dependence treatment.46
Recent studies estimate that 4,400 to 7,330 lung cancer deaths each year among never smokers in the United States can be attributed to secondhand smoke exposure.22,47 Our report shows that secondhand smoke exposure fell in the past decade, continuing declines beginning in the late 1980s, when almost 90% of the U.S. population was exposed.48 Much of this decline can be attributed to decreases in smoking prevalence and to policies that prohibit smoking in indoor workplaces and public places, including restaurants and bars.48 However, a substantial number of people who do not smoke continue to be exposed to secondhand smoke (58 million nonsmokers in 2013–2014).48 Further, considerable disparities in secondhand smoke exposure persist among several groups, defined by age, income, education, race, geography, home ownership, and other factors.48,49,50 For example, in 2013–2014, the proportion of nonsmokers exposed to secondhand smoke was 22% among nonsmoking adults compared with 38% among children ages 3–11 years, and 19% among those who owned their home compared with 39% among those who rented.48 In part to reduce secondhand smoke exposure among public housing residents, including 700,000 children, the U.S. Department of Housing and Urban Development adopted a rule requiring public housing authorities to make their residential units, indoor common areas, and administrative offices smoke-free by July 30, 2018.51
Studies have found that smoke-free policies are not equally applied in outdoor places52 or workplaces,53 which may contribute to disparities; for example, while 80% of U.S. indoor workers were covered by a workplace smoke-free policy, this proportion was lower among younger workers, males, Hispanics, and those with less education or income or who lived in the South.54 Enhancing equitable implementation of comprehensive smoke-free strategies in all workplaces, public places, homes, and vehicles can reduce secondhand smoke exposure.
Weight Status, Physical Activity, and Alcohol Use
Excess body weight has been associated with increased risk for many chronic diseases including at least 13 types of cancer, some of which are common types—colorectal, postmenopausal breast, and advanced-stage prostate cancer.13 Research found that excess weight is correlated with poorer survival among patients with breast, prostate, or colorectal cancer.55–57 About 8% of cancer cases and 7% of cancer deaths in the United States are attributable to excess body weight.22 While the Healthy People 2020 objective was to reduce adult obesity prevalence, prevalence increased 14% between 2003–2008 (33.9%) and 2013–2018 (38.6%), with substantial disparities by race-ethnicity, sex, and socioeconomic status. Today, more than two-thirds of American adults are overweight or have obesity, and 18.5% of children and adolescents have obesity.29 A recent study found that incidence rates for half of the obesity-related cancer types are increasing in young adults in the United States, with steeper increases in progressively younger ages and successively younger generations.58 The impact of the current obesity epidemic could potentially halt or reverse the progress achieved in cancer incidence and mortality reduction.59
Obesity is a complex problem caused by interactions among genetic background, individual behavior, and social and environmental factors, and increases in obesity have been observed in all sociodemographic groups. A multifaceted approach can curb the obesity epidemic, which requires decision-makers, state and local organizations, business and community leaders, schools, child care and health care professionals, and individuals working together to create an environment that supports healthy behaviors.60 Some evidence-based community strategies include making healthy food more accessible and affordable to communities, helping individuals recognize and make healthy food and beverage choices, creating safe communities that support physical activity, and encouraging communities to identify their assets and barriers to creating behavioral and environmental changes. Other recommended strategies include supporting organizational policies and programs that promote breastfeeding, promote early child care and school education on physical activity, limit sedentary activities among children and youth, support health services and clinical interventions to screen for obesity, and refer patients to comprehensive, intensive weight loss interventions.61,62 Although obesity exceeded the Healthy People 2020 target in all but one sociodemographic group, the highest prevalence of obesity was among blacks, Mexican Americans, individuals with public health insurance and those who had not completed a college degree. Multifactorial interventions focused on these populations may help achieve equity in obesity prevention.
Independent of obesity, about 3% of new cancer cases in the United States (46,300 cases in 2014) have been attributed to insufficient physical activity.22 The proportion of adults who met federal guidelines for aerobic physical activity and muscle-strengthening activity increased from 2008 to 2017 in all groups, and all groups met the target (20.1%) except Hispanics, those in rural areas, those with public or no health insurance, and those with a high school education or less. However, 4 in 5 adults in the United States do not get enough physical activity, indicating that all communities would benefit from behavioral interventions and environmental changes that support physical activity.
Barriers to physical activity include lack of time, inconvenience, functional limitations, and safety issues. To create social and physical environments that promote physical activity, the Community Preventive Services Task Force recommends strategies that address these barriers.63 For example, land use policies can include design components such as increased lighting and traffic-calming approaches that increase physical safety and support more walking and bicycling. The Rural Health Information Hub offers examples of how recommended strategies can be adapted to work in rural areas.64 CDC’s National Comprehensive Cancer Control Program helps support environmental approaches that promote physical activity options in communities.65 In a recent analysis of state cancer plans, all programs recognized the important role of physical activity in cancer prevention, and most plans included goals and strategies to address physical activity changes.66 Additionally, the disparity in physical activity by educational attainment indicates that improving health literacy and tailoring communication messages may be one way to decrease this disparity.67
Excessive alcohol use contributes to many acute and chronic conditions and has long been included as a Healthy People focus area.2 The most recent objectives are based on heavy drinking (more than two drinks per day on average for men or more than one drink per day on average for women) and binge drinking (5 or more drinks during a single occasion for men or 4 or more drinks during a single occasion for women). Similar to the data presented here, recent trends using data from the Behavioral Risk Factor Surveillance System indicate that while there has been no change in the proportion of adults who report consuming one drink in the past 30 days, there have been increases in heavy drinking and binge drinking, with greater increases in women than in men.68 The greater than 30% prevalence of excessive alcohol use among most sociodemographic groups suggests that greater application of evidence-based interventions could be broadly beneficial. Alcohol use is estimated to contribute to 6% of incident cancers and 4% of cancer deaths—third only to cigarette smoking and excess body weight—and risk increases with greater consumption.22 Evidence-based interventions for the general population have been shown to reduce excessive alcohol use,63 and data suggest that tailored interventions could help groups such as American Indians/Alaska Natives.69 Alcohol screening and brief intervention is effective in reducing excessive alcohol use70 and can be expanded to settings beyond primary care offices, such as community health centers.71 Studies suggest that both effective state alcohol control policies and alcohol screening and brief intervention are underutilized, and increasing their application may reduce the prevalence of heavy and binge drinking across population groups and in high-risk populations.72,73
Cancer Screening
Because the USPSTF did not recommend lung cancer screening until 2013, an objective was not included in Healthy People 2020, but will be in Healthy People 2030.74 We found that lung cancer screening use among individuals at high risk of lung cancer increased from 2010 to 2015 but was generally very low (<7%) across all groups, suggesting that a multi-pronged approach may be needed to improve adherence. First, health care systems may be able to improve lung cancer screening implementation using such strategies as: employing a multidisciplinary team approach; having a dedicated lung cancer screening coordinator who can handle eligibility determination, shared decision-making, and cessation counseling; using a standardized protocol for lung nodule tracking; and incorporating automated systems to ensure adherence to annual screening.75,76 Studies suggest that low referral to lung cancer screening may be improved by educating health care providers about screening recommendations, the recommended screening test (low-dose computed tomography), and the clinical benefits of screening, patient eligibility, as well as by implementing screening decision support tools, fully integrating smoking cessation interventions into screening programs, and Medicare reimbursement.77,78 Finally, educating people about the availability of lung cancer screening, its benefits and harms, insurance coverage of screening, and the location of accredited screening facilities may improve public awareness and increase screening utilization by those who could benefit. Identifying and reducing individual- and system-level barriers to screening and utilizing tailored educational materials may help ensure equity in lung cancer screening.79,80
The target colorectal cancer death rate (14.5 deaths per 100,000 persons) was met overall and in several sociodemographic groups, but not males, blacks, or people in rural areas. Screening has been shown to be effective in reducing colorectal cancer incidence and death rates.5 Overall, colorectal cancer screening increased from 52.1% in 2008 to 62.4% in 2015 but has yet to reach the Healthy People 2020 target (70.5%). In an analysis of 2015 NHIS data by age, the target percentage was reached among Medicare-eligible persons aged 65–75 years (71.8%) but not among persons aged 50–64 years (57.9%).81 Our report shows that there was a strong positive association between educational attainment and colorectal cancer screening uptake and that colorectal cancer screening was especially low among those who did not have health insurance. To promote screening among adults who are un- or under-insured, the CDC’s Colorectal Cancer Control Program82 supports 30 awardees to implement priority interventions shown to be effective by the Community Preventive Services Taskforce in increasing colorectal cancer screening. The goal of the National Colorectal Cancer Roundtable, established in 1997 by ACS and CDC, is to increase the use of recommended colorectal screening tests through focused community approaches and coordinated efforts to remove financial, operational, and policy barriers.83 A simulation study estimated that 277,000 colorectal cancer cases and 203,000 deaths could be averted by 2030 if screening uptake increased to 80%.83 Among persons at higher risk of colorectal cancer because of their family history, earlier and more frequent screening may be recommended, along with testing for inherited cancer syndromes.84
Breast cancer trends suggest that a little more than a third of the recent decrease in breast cancer mortality was due to mammography screening, with the remainder due to treatment advances.85 Despite the established benefits of breast cancer screening, the Healthy People 2020 target (81%) for mammography was not yet met in any group except women with advanced educational degrees, and breast cancer screening overall decreased between 2008 to 2015. Changes in USPSTF breast cancer screening recommendations in 2009, including narrowing the recommended age range to 50–74 years and screening every 2 years rather than every 1 to 2 years, may have contributed to the declines in mammography use among women age 50–74 observed in this report.86 Our report shows that mammography use declined more than 10% in some groups, including Asians, women in rural areas, and those with public or no insurance, indicating that focused intervention may be needed to boost screening uptake in these groups.
The Community Preventive Services Task Force recommends 24 multicomponent interventions to increase breast cancer screening, including education programs, small media, reminders (written, phone calls), patient navigators, provider assessment and feedback, and removal of structural barriers (e.g., screening hours, transportation, language translation).63 Tailored approaches that take culture and religion into consideration, as well as a role for female leaders similar to that of community health workers, may help increase screening uptake.87 We found that mammography screening was lowest among women without health insurance (35%). To improve mammography screening among women who are low-income, uninsured, or underinsured, CDC’s National Breast and Cervical Cancer Early Detection Program provides screening services; however, only a fraction of eligible women are served, so the program is expanding its scope to include population-based strategies to reach more women.88 Persons (men and women) who are at high risk of breast cancer because of their family history may benefit from earlier and more frequent screening, screening with more sophisticated technologies, and genetic testing.89 Healthy People 2020 includes an objective to increase the proportion of women with a family history of breast and/or ovarian cancer who receive genetic counseling but there weren’t enough available data to examine for this report.
As evidence-based recommendations have increased in number and complexity,90 so has the importance of provider-patient interactions.91 Healthy People first included an objective for counseling for prostate cancer screening in 2020.2 Despite changes in USPSTF recommendations for prostate cancer screening,92 the clinical considerations have consistently recommended a discussion of benefits and harms of prostate cancer screening and treatment before ordering a PSA test. Shared decision-making tools that use plain language free of medical jargon, with simple layouts, could decrease health disparities—by addressing gaps between groups who are health literate, educated, and of higher socioeconomic status and those who are not.93 Some studies have shown that shared decision-making tools can increase knowledge and self-efficacy in the short term, but few tailored resources are available, including for black men who have higher prostate cancer incidence and mortality than men in other race-ethnicity groups.94 Other results have shown that medical-system and practice-level factors may influence shared decision-making processes.95
Treatment
Declines in cancer death rates can be attributed, in part, to the recent rapid developments in and use of targeted therapies, immunotherapies, and precision medicine for a number of cancer types, including some with historically low survival. A good example is advanced melanoma. For years, little progress had been made—until in 2011 the FDA approved vemurafenib as targeted therapy and ipilimumab as immunotherapy. Now, more than 10 new treatment options have been added. These advances have substantially improved the three-year survival rates for about half of patients with late-stage melanoma96 and significantly reduced mortality rates for this group of patients.97 In the past several years, significant breakthroughs have also been made in lung cancer treatment, including use of histologic subtype and molecular testing to individualize treatment selection for non-small cell lung cancer patients, which has been shown to improve survival.98 However, access to such novel treatments may differ by age, proximity to care or to clinical trials, insurance coverage of treatment, and socioeconomic status.
Although great progress has been made in reducing mortality and improving survival for the most common cancer sites, there is still considerable variation by site. For years, less progress has been made for cancers such as esophagus, liver, and pancreas.25 These sites have few effective treatments available, which underscores the need for innovative therapeutic approaches.
In addition, observed disparities in survival improvement and mortality reduction among race-ethnicity groups and by socioeconomic status may be attributable to disparities in environmental health and in access to timely preventive, early detection, and treatment services.99 Ensuring equitable access to health care and dissemination of treatment advances may reduce disparities in survival and mortality.
Limitations
Race-ethnicity categories were not consistent across objectives. Targets were not factored into disparities calculations, but we examined and discussed them in this report. This report did not consider all available Healthy People objectives or sociodemographic characteristics.
The data presented in this report provide national estimates for cancer-related Healthy People 2020 objectives for broadly aggregated sociodemographic groups using national level data. While such data are useful in measuring progress at the national level, more detailed analysis may identify high-risk populations that would benefit from focused interventions. For example, marked regional variations have been observed in cancer incidence and death rates among AI/AN populations and among subgroups of Asian American and Hispanics defined by country of origin and socioeconomic characteristics.100–102
Conclusion and Public Health Impact
While interventions to reduce cancer risk factors and promote healthy behaviors and environments have been shown to work, they may need to be equitably applied or adapted to work well in all communities. Implementing cancer prevention and control interventions that are sustainable, focused, and culturally appropriate may boost success in communities with the greatest need, ensuring that all Americans can access a path to long, healthy, cancer-free lives.
ACKNOWLEDGMENTS
We gratefully acknowledge the contributions of the state and regional cancer registry staff and health department personnel for their work in collecting the data used in this report. In addition, we thank Rick Firth of Information Management Services, Inc. for assistance in compiling the data used in this report.
FUNDING
This work was supported by the American Cancer Society, the Centers for Disease Control and Prevention, the National Cancer Institute, and the North American Association of Central Cancer Registries. The American Cancer Society is a not-for-profit public health organization that receives support from the public through fundraising and direct contributions. The Society also receives a small portion of support from corporations and industry to support its mission programs and services.
Footnotes
Publisher's Disclaimer: DISCLAIMERS
Publisher's Disclaimer: The funders had no role in the design of the study; the collection, analysis or interpretation of the data; the writing of the manuscript; or the decision to submit the manuscript for publication. The findings and conclusions in this article are those of the authors and do not necessarily represent the official positions of the authors’ agencies (the American Cancer Society, the Centers for Disease Control and Prevention, the National Cancer Institute, or the North American Association of Central Cancer Registries).
CONFLICT OF INTEREST DISCLOSURES
The authors have no conflicts of interest related to this work to disclose.
REFERENCES
- 1.Koh HK, Blakey CR, Roper AY. Healthy People 2020: A report card on the health of the nation. JAMA 2014;311(24):2475–2476. 10.1001/jama.2014.6446 %J JAMA. [DOI] [PubMed] [Google Scholar]
- 2.U.S. Department of Health and Human Services. Healthy people 2020. 2019; https://www.healthypeople.gov/2020/topics-objectives. [accessed January 17, 2020].
- 3.Brown ML, Klabunde CN, Cronin KA, White MC, Richardson LC, McNeel TS. Challenges in meeting healthy people 2020 objectives for cancer-related preventive services, National Health Interview Survey, 2008 and 2010. Prev Chronic Dis 2014;11:E29 10.5888/pcd11.130174. [DOI] [PMC free article] [PubMed] [Google Scholar]
- 4.Siu AL. Screening for breast cancer: U.S. Preventive Services Task Force recommendation statement. Ann Intern Med 2016;164(4):279–296. 10.7326/M15-2886 %J Annals of Internal Medicine. [DOI] [PubMed] [Google Scholar]
- 5.Bibbins-Domingo K, Grossman DC, Curry SJ, et al. Screening for colorectal cancer: US Preventive Services Task Force recommendation statement. JAMA 2016;315(23):2564–2575. 10.1001/jama.2016.5989. [DOI] [PubMed] [Google Scholar]
- 6.Preventive US Services Task Force. Screening for cervical cancer: US Preventive Services Task Force recommendation statement. JAMA 2018;320(7):674–686. 10.1001/jama.2018.10897 %J JAMA. [DOI] [PubMed] [Google Scholar]
- 7.Moyer VA. Screening for lung cancer: U.S. Preventive Services Task Force recommendation statement. Ann Intern Med 2014;160(5):330–338. 10.7326/m13-2771. [DOI] [PubMed] [Google Scholar]
- 8.Moyer VA. Screening for prostate cancer: U.S. Preventive Services Task Force recommendation statement. Ann Intern Med 2012;157(2):120–134. 10.7326/0003-4819-157-2-201207170-00459. [DOI] [PubMed] [Google Scholar]
- 9.U.S. Department of Health and Human Services. The health consequences of smoking: 50 years of progress A report of the Surgeon General. Atlanta, GA: U.S. Department of Health and Human Services, Centers for Disease Control and Prevention, National Center for Chronic Disease Prevention and Health Promotion, Office on Smoking and Health; 2014. Available at: https://www.cdc.gov/tobacco/data_statistics/sgr/50th-anniversary/index.htm [accessed January 17, 2020]. [Google Scholar]
- 10.International Agency for Research on Cancer. IARC monographs on the evaluation of carcinogenic risks to humans: Volume 100E: Personal habits and indoor combustion. Lyon, France: International Agency for Research on Cancer; 2012. [Google Scholar]
- 11.International Agency for Research on Cancer. IARC Handbooks of cancer prevention, tobacco control, Vol. 11: Reversal of risk after quitting smoking. Lyon, France: International Agency for Research on Cancer; 2007. Available at: https://publications.iarc.fr/Book-And-Report-Series/Iarc-Handbooks-Of-Cancer-Prevention/Tobacco-Control-Reversal-Of-Risk-After-Quitting-Smoking-2007. [accessed January 17, 2020]. [Google Scholar]
- 12.International Agency for Research on Cancer. IARC monographs on the evaluation of carcinogenic risks to humans: Volume 83: Tobacco smoke and involuntary smoking. Lyon, France: International Agency for Research on Cancer; 2004. [PMC free article] [PubMed] [Google Scholar]
- 13.Lauby-Secretan B, Scoccianti C, Loomis D, Grosse Y, Bianchini F, Straif K. Body fatness and cancer--viewpoint of the IARC working group. N Engl J Med 2016;375(8):794–798. 10.1056/NEJMsr1606602. [DOI] [PMC free article] [PubMed] [Google Scholar]
- 14.World Cancer Research Fund / American Institute for Cancer Research. Diet, nutrition, physical activity and cancer: A global perspective. Continuous update project expert report 2018. 2018.
- 15.U.S. Department of Health and Human Services. Physical activity guidelines for Americans, 2nd edition Washington, DC: U.S. Department of Health and Human Services; 2018. [Google Scholar]
- 16.International Agency for Research on Cancer. IARC monographs on the evaluation of carcinogenic risks to humans: Volume 100E: Personal habits and indoor combustion: consumption of alcoholic beverages. Lyon, France: International Agency for Research on Cancer; 2012. [Google Scholar]
- 17.National Cancer Institute. Cancer trends progress report. Bethesda, MD: National Institutes of Health, National Cancer Institute; 2019. [Google Scholar]
- 18.Weir HK, Thompson TD, Soman A, Moller B, Leadbetter S, White MC. Meeting the Healthy People 2020 objectives to reduce cancer mortality. Prev Chronic Dis 2015;12:E104 10.5888/pcd12.140482. [DOI] [PMC free article] [PubMed] [Google Scholar]
- 19.Extramual Committee To Assess Measures of Progress Against Cancer. Measurement of progress against cancer J Natl Cancer Inst 1990;82(10):825–835. [PubMed] [Google Scholar]
- 20.National Center for Health Statistics. National Vital Statistics System. 2019. Available at: https://www.cdc.gov/nchs/nvss/deaths.htm. [accessed January 17, 2020].
- 21.National Center for Health Statistics. National Health Interview Survey, 2015. NHIS data, questionnaires and related documentation 2019. Available at: http://www.cdc.gov/nchs/nhis/quest_data_related_1997_forward.htm. [accessed January 17, 2020].
- 22.Islami F, Goding Sauer A, Miller KD, et al. Proportion and number of cancer cases and deaths attributable to potentially modifiable risk factors in the United States. CA Cancer J Clin 2018;68(1):31–54. 10.3322/caac.21440. [DOI] [PubMed] [Google Scholar]
- 23.National Center for Health Statistics. National Health and Nutrition Examination Survey Data. 2019. Available at: https://wwwn.cdc.gov/nchs/nhanes/default.aspx. [accessed January 17, 2020].
- 24.Office of Management and Budget TWH. Revised delineations of metropolitan statistical areas, micropolitan statistical areas, and combined statistical areas, and guidance on uses of the delineations of these areas. 2013. Available at: https://obamawhitehouse.archives.gov/sites/default/files/omb/bulletins/2013/b-13-01.pdf. [accessed January 17, 2020].
- 25.Ward E, Sherman RL, Henley SJ, et al. Annual report to the nation on the status of cancer, 1999–2015, featuring cancer in men and women ages 20–49. J Natl Cancer Inst 2019. 10.1093/jnci/djz106. [DOI] [PMC free article] [PubMed] [Google Scholar]
- 26.U.S. Cancer Statistics Working Group. U.S. Cancer Statistics data visualizations tool, based on November 2018 submission data (1999–2016). 2019. Available at: www.cdc.gov/cancer/dataviz. [accessed January 17, 2020].
- 27.Howlader N, Noone AM, Krapcho M, et al. SEER cancer statistics review 1975–2016. Bethesda, MD: National Cancer Institute; 2019. Available at: https://seer.cancer.gov/csr/1975_2016/. [accessed January 17, 2020]. [Google Scholar]
- 28.Siegel RL, Miller KD, Jemal A. Cancer statistics, 2019. CA Cancer J Clin 2019;69(1):7–34. 10.3322/caac.21551. [DOI] [PubMed] [Google Scholar]
- 29.National Center for Health Statistics. Health, United States, 2017: With special feature on mortality. Hyattsville, MD: 2018. Available at: https://www.cdc.gov/nchs/hus/index.htm. [accessed January 17, 2020]. [PubMed] [Google Scholar]
- 30.Schabath MB, Cote ML. Cancer Progress and priorities: lung cancer. Cancer Epidemiol Biomarkers Prev 2019;28(10):1563–1579. 10.1158/1055-9965.Epi-19-0221. [DOI] [PMC free article] [PubMed] [Google Scholar]
- 31.Wang TW, Asman K, Gentzke AS, et al. Tobacco product use among adults - United States, 2017. MMWR Morb Mortal Wkly Rep 2018;67(44):1225–1232. 10.15585/mmwr.mm6744a2. [DOI] [PMC free article] [PubMed] [Google Scholar]
- 32.Garrett BE, Dube SR, Babb S, McAfee T. Addressing the social determinants of health to reduce tobacco-related disparities. Nicotine Tob Res 2015;17(8):892–897. 10.1093/ntr/ntu266. [DOI] [PMC free article] [PubMed] [Google Scholar]
- 33.U.S. Food and Drug Administration. The Real Cost Campaign. 2019. Available at: https://www.fda.gov/tobacco-products/public-health-education-campaigns/real-cost-campaign [accessed January 17, 2020].
- 34.Duke JC, MacMonegle AJ, Nonnemaker JM, et al. Impact of The Real Cost media campaign on youth smoking initiation. Am J Prev Med 2019. 10.1016/j.amepre.2019.06.011. [DOI] [PubMed] [Google Scholar]
- 35.Centers for Disease Control and Prevention. State Tobacco Activities Tracking and Evaluation (STATE) System. 2019. Available at: https://www.cdc.gov/statesystem/. [accessed January 17, 2020].
- 36.U.S. Food and Drug Administration. FDA’s comprehensive plan for tobacco and nicotine regulation. 2019. Available at: https://www.fda.gov/tobacco-products/ctp-newsroom/fdas-comprehensive-plan-tobacco-and-nicotine-regulation. [accessed January 17, 2020].
- 37.U.S. Department of Health and Human Services. Treating tobacco use and dependence: 2008 update. Rockville (MD): U.S. Department of Health and Human Services, U.S. Public Health Service; 2008. Available at: https://www.ahrq.gov/professionals/clinicians-providers/guidelines-recommendations/tobacco/index.html. [accessed January 17, 2020]. [Google Scholar]
- 38.U.S. Preventive Services Task Force. Behavioral and pharmacotherapy interventions for tobacco smoking cessation in adults, including pregnant women: U.S. Preventive Services Task Force recommendation statement. Ann Intern Med 2015;163(8):622–634. 10.7326/M15-2023. [DOI] [PubMed] [Google Scholar]
- 39.DiGiulio A, Jump Z, Yu A, et al. State Medicaid coverage for tobacco cessation treatments and barriers to accessing treatments - United States, 2015–2017. MMWR Morbidity and mortality weekly report 2018;67(13):390–395. 10.15585/mmwr.mm6713a3. [DOI] [PMC free article] [PubMed] [Google Scholar]
- 40.Jamal A, Phillips E, Gentzke AS, et al. Current cigarette smoking among adults - United States, 2016. MMWR Morb Mortal Wkly Rep 2018;67(2):53–59. 10.15585/mmwr.mm6702a1. [DOI] [PMC free article] [PubMed] [Google Scholar]
- 41.Babb S, Malarcher A, Schauer G, Asman K, Jamal A. Quitting smoking among adults - United States, 2000–2015. MMWR Morb Mortal Wkly Rep 2017;65(52):1457–1464. 10.15585/mmwr.mm6552a1. [DOI] [PubMed] [Google Scholar]
- 42.Centers for Disease Control and Prevention. Networking2Save: CDC’s national network approach to preventing and controlling tobacco-related cancers in special populations. 2019. Available at: https://www.cdc.gov/tobacco/about/foa/national-networks-nofo/coop-agreement/index.html. [accessed January 17, 2020].
- 43.Prochaska JJ, Gates EF, Davis KC, Gutierrez K, Prutzman Y, Rodes R. The 2016 Tips From Former Smokers(R) Campaign: Associations With quit intentions and quit attempts among smokers with and without mental health conditions. Nicotine Tob Res 2019;21(5):576–583. 10.1093/ntr/nty241. [DOI] [PMC free article] [PubMed] [Google Scholar]
- 44.National Cancer Institute. Smoking cessation at lung examination: The SCALE collaboration 2018. Available at: https://cancercontrol.cancer.gov/brp/tcrb/scale-collaboration.html. [accessed January 17, 2020].
- 45.Croyle RT, Morgan GD, Fiore MC. Addressing a core gap in cancer care - The NCI Moonshot program to help oncology patients stop smoking. N Engl J Med 2019;380(6):512–515. 10.1056/NEJMp1813913. [DOI] [PMC free article] [PubMed] [Google Scholar]
- 46.Land SR, Marcus PM. Cancer screening and diagnosis: opportunities for smoking cessation intervention. J Clin Oncol 2015;33(15):1631–1632. 10.1200/jco.2015.61.2077. [DOI] [PubMed] [Google Scholar]
- 47.Max W, Sung HY, Shi Y. Deaths from secondhand smoke exposure in the United States: economic implications. Am J Public Health 2012;102(11):2173–2180. 10.2105/ajph.2012.300805. [DOI] [PMC free article] [PubMed] [Google Scholar]
- 48.Tsai J, Homa DM, Gentzke AS, et al. Exposure to secondhand smoke among nonsmokers - United States, 1988–2014. MMWR Morb Mortal Wkly Rep 2018;67(48):1342–1346. 10.15585/mmwr.mm6748a3. [DOI] [PMC free article] [PubMed] [Google Scholar]
- 49.Gan WQ, Mannino DM, Jemal A. Socioeconomic disparities in secondhand smoke exposure among US never-smoking adults: the National Health and Nutrition Examination Survey 1988–2010. Tob Control 2015;24(6):568–573. 10.1136/tobaccocontrol-2014-051660. [DOI] [PubMed] [Google Scholar]
- 50.King BA, Homa DM, Dube SR, Babb SD. Exposure to secondhand smoke and attitudes toward smoke-free workplaces among employed U.S. adults: findings from the National Adult Tobacco Survey. Nicotine Tob Res 2014;16(10):1307–1318. 10.1093/ntr/ntu069 %J Nicotine & Tobacco Research. [DOI] [PMC free article] [PubMed] [Google Scholar]
- 51.U.S. Department of Housing and Urban Development. Instituting smoke-free public housing. Final rule. 24 CFR parts 965–966. Fed Regist 2016;81(233). [Google Scholar]
- 52.Lowrie C, Pearson AL, Thomson G. Inequities in coverage of smokefree outdoor space policies within the United States: school grounds and playgrounds. BMC Public Health 2018;18(1):736 10.1186/s12889-018-5602-7. [DOI] [PMC free article] [PubMed] [Google Scholar]
- 53.Babb S, Liu B, Kenemer B, et al. Changes in self-reported smokefree workplace policy coverage among employed adults-United States, 2003 and 2010–2011. Nicotine Tob Res 2018;20(11):1327–1335. 10.1093/ntr/ntx202. [DOI] [PMC free article] [PubMed] [Google Scholar]
- 54.Syamlal G, King BA, Mazurek JM. Workplace smoke-free policies and cessation programs among U.S. working adults. Am J Prev Med 2019;56(4):548–562. 10.1016/j.amepre.2018.10.030. [DOI] [PMC free article] [PubMed] [Google Scholar]
- 55.Vidal AC, Howard LE, Sun SX, et al. Obesity and prostate cancer-specific mortality after radical prostatectomy: results from the Shared Equal Access Regional Cancer Hospital (SEARCH) database. Prostate cancer and prostatic diseases 2017;20(1):72–78. 10.1038/pcan.2016.47. [DOI] [PMC free article] [PubMed] [Google Scholar]
- 56.Chan DS, Vieira AR, Aune D, et al. Body mass index and survival in women with breast cancer-systematic literature review and meta-analysis of 82 follow-up studies. Ann Oncol 2014;25(10):1901–1914. 10.1093/annonc/mdu042. [DOI] [PMC free article] [PubMed] [Google Scholar]
- 57.Maskarinec G, Harmon BE, Little MA, et al. Excess body weight and colorectal cancer survival: the multiethnic cohort. Cancer Causes Control 2015;26(12):1709–1718. 10.1007/s10552-015-0664-7. [DOI] [PMC free article] [PubMed] [Google Scholar]
- 58.Sung H, Siegel RL, Rosenberg PS, Jemal A. Emerging cancer trends among young adults in the USA: analysis of a population-based cancer registry. The Lancet Public health 2019;4(3):e137–e147. 10.1016/s2468-2667(18)30267-6. [DOI] [PubMed] [Google Scholar]
- 59.Steele CB, Thomas CC, Henley SJ, et al. Vital Signs: Trends in incidence of cancers associated with overweight and obesity - United States, 2005–2014. MMWR Morb Mortal Wkly Rep 2017;66(39):1052–1058. 10.15585/mmwr.mm6639e1. [DOI] [PMC free article] [PubMed] [Google Scholar]
- 60.Eheman C, Henley SJ, Ballard-Barbash R, et al. Annual report to the nation on the status of cancer, 1975–2008, featuring cancers associated with excess weight and lack of sufficient physical activity. Cancer 2012;118(9):2338–2366. 10.1002/cncr.27514. [DOI] [PMC free article] [PubMed] [Google Scholar]
- 61.National Academies of Sciences, Engineering, and Medicine. A health equity approach to obesity efforts: Proceedings of a workshop in brief. Washington, DC: The National Academies Press; 2019. [PubMed] [Google Scholar]
- 62.Khan LK, Sobush K, Keener D, et al. Recommended community strategies and measurements to prevent obesity in the United States. MMWR Recomm Rep 2009;58(Rr-7):1–26. [PubMed] [Google Scholar]
- 63.Guide to Community Preventive Services. The guide to community preventive services 2019. Available at: https://www.thecommunityguide.org/. [accessed January 17, 2020].
- 64.Rural Health Information Hub. Rural health information hub 2019. Available at: https://www.ruralhealthinfo.org/. [accessed January 17, 2020].
- 65.Centers for Disease Control and Prevention. National Comprehensive Cancer Control Program. 2019; http://www.cdc.gov/cancer/ncccp/. [accessed January 17, 2020].
- 66.Puckett M, Neri A, Underwood JM, Stewart SL. Nutrition and physical activity strategies for cancer prevention in current National Comprehensive Cancer Control Program plans. J Community Health 2016;41(5):1013–1020. 10.1007/s10900-016-0184-8. [DOI] [PMC free article] [PubMed] [Google Scholar]
- 67.Davis TC, Williams MV, Marin E, Parker RM, Glass J. Health literacy and cancer communication. CA Cancer J Clin 2002;52(3):134–149. [DOI] [PubMed] [Google Scholar]
- 68.Dwyer-Lindgren L, Flaxman AD, Ng M, Hansen GM, Murray CJL, Mokdad AH. Drinking patterns in US Counties from 2002 to 2012. Am J Public Health 2015;105(6):1120–1127. 10.2105/AJPH.2014.302313. [DOI] [PMC free article] [PubMed] [Google Scholar]
- 69.Patterson Silver Wolf Adelv Unegv Waya DA, Duran B, Dulmus CN, Manning AR. Alcohol screening and brief intervention as standard practice: working with the American Indian/Native Alaskan Populations. J Hum Behav Soc Environ 2014;24(3):399–407. 10.1080/10911359.2014.875340. [DOI] [PMC free article] [PubMed] [Google Scholar]
- 70.Centers for Disease Control and Prevention. Planning and implementing screening and brief intervention for risky alcohol use: a step-by-step guide for primary care practices. Atlanta, GA: Centers for Disease Control and Prevention, National Center on Birth Defects and Developmental Disabilities; 2014. Available at: http://www.cdc.gov/ncbddd/fasd/documents/alcoholsbiimplementationguide.pdf. [accessed January 17, 2020]. [Google Scholar]
- 71.Mulia N, Schmidt LA, Ye Y, Greenfield TK. Preventing disparities in alcohol screening and brief intervention: the need to move beyond primary care. Alcohol Clin Exp Res 2011;35(9):1557–1560. 10.1111/j.1530-0277.2011.01501.x. [DOI] [PMC free article] [PubMed] [Google Scholar]
- 72.McKnight-Eily LR, Okoro CA, Mejia R, et al. Screening for excessive alcohol use and brief counseling of adults - 17 states and the District of Columbia, 2014. MMWR Morb Mortal Wkly Rep 2017;66(12):313–319. 10.15585/mmwr.mm6612a1. [DOI] [PMC free article] [PubMed] [Google Scholar]
- 73.Nelson TF, Xuan Z, Blanchette JG, Heeren TC, Naimi TS. Patterns of change in implementation of state alcohol control policies in the United States, 1999–2011. Addiction 2015;110(1):59–68. 10.1111/add.12706. [DOI] [PMC free article] [PubMed] [Google Scholar]
- 74.U.S. Department of Health & Human Services. Development of the National Health Promotion and Disease Prevention objectives for 2030. 2019. Available at: https://www.healthypeople.gov/2020/About-Healthy-People/Development-Healthy-People-2030. [accessed January 17, 2020].
- 75.National Academies of Sciences, Engineering, and Medicine. Implementation of lung cancer screening: Proceedings of a workshop. Washington, DC: National Academies Press; 2017. [PubMed] [Google Scholar]
- 76.Kinsinger LS, Anderson C, Kim J, et al. Implementation of lung cancer screening in the Veterans Health Administration. JAMA Intern Med 2017;177(3):399–406. 10.1001/jamainternmed.2016.9022. [DOI] [PubMed] [Google Scholar]
- 77.Eberth JM, McDonnell KK, Sercy E, et al. A national survey of primary care physicians: Perceptions and practices of low-dose CT lung cancer screening. Prev Med Rep 2018;11:93–99. 10.1016/j.pmedr.2018.05.013. [DOI] [PMC free article] [PubMed] [Google Scholar]
- 78.Raz DJ, Wu GX, Consunji M, et al. Perceptions and utilization of lung cancer screening among primary care physicians. J Thorac Oncol 2016;11(11):1856–1862. 10.1016/j.jtho.2016.06.010. [DOI] [PMC free article] [PubMed] [Google Scholar]
- 79.Jenkins WD, Matthews AK, Bailey A, et al. Rural areas are disproportionately impacted by smoking and lung cancer. Prev Med Rep 2018;10:200–203. 10.1016/j.pmedr.2018.03.011. [DOI] [PMC free article] [PubMed] [Google Scholar]
- 80.Cardarelli R, Roper KL, Cardarelli K, et al. Identifying community perspectives for a lung cancer screening awareness campaign in Appalachia Kentucky: The Terminate Lung Cancer (TLC) Study. 2017;32(1):125–134. 10.1007/s13187-015-0914-0. [DOI] [PMC free article] [PubMed] [Google Scholar]
- 81.White A, Thompson TD, White MC, et al. Cancer screening test use - United States, 2015. MMWR Morb Mortal Wkly Rep 2017;66(8):201–206. 10.15585/mmwr.mm6608a1. [DOI] [PMC free article] [PubMed] [Google Scholar]
- 82.Centers for Disease Control and Prevention. Colorectal Cancer Control Program 2019. Available at: http://www.cdc.gov/cancer/crccp/index.htm. [accessed January 17, 2020].
- 83.Meester RG, Doubeni CA, Zauber AG, et al. Public health impact of achieving 80% colorectal cancer screening rates in the United States by 2018. Cancer 2015;121(13):2281–2285. 10.1002/cncr.29336. [DOI] [PMC free article] [PubMed] [Google Scholar]
- 84.Levin B, Lieberman DA, McFarland B, et al. Screening and surveillance for the early detection of colorectal cancer and adenomatous polyps, 2008: a joint guideline from the American Cancer Society, the US Multi-Society Task Force on Colorectal Cancer, and the American College of Radiology. Gastroenterology 2008;134(5):1570–1595. 10.1053/j.gastro.2008.02.002. [DOI] [PubMed] [Google Scholar]
- 85.Plevritis SK, Munoz D, Kurian AW, et al. Association of screening and treatment with breast cancer mortality by molecular subtype in US Women, 2000–2012. JAMA 2018;319(2):154–164. 10.1001/jama.2017.19130. [DOI] [PMC free article] [PubMed] [Google Scholar]
- 86.Fedewa SA, de Moor JS, Ward EM, et al. Mammography use and physician recommendation after the 2009 U.S. Preventive Services Task Force breast cancer screening recommendations. Am J Prev Med 2016;50(5):e123–e131. 10.1016/j.amepre.2015.10.010. [DOI] [PubMed] [Google Scholar]
- 87.Islam N, Patel S, Brooks-Griffin Q, et al. Understanding barriers and facilitators to breast and cervical cancer screening among Muslim women in New York City: Perspectives from key informants. SM J Community Med 2017;3(1). [PMC free article] [PubMed] [Google Scholar]
- 88.Wong FL, Miller JW. Centers for Disease Control and Prevention’s National Breast and Cervical Cancer Early Detection Program: Increasing access to screening. Journal of women’s health (2002) 2019;28(4):427–431. 10.1089/jwh.2019.7726. [DOI] [PMC free article] [PubMed] [Google Scholar]
- 89.Smith RA, Andrews KS, Brooks D, et al. Cancer screening in the United States, 2019: A review of current American Cancer Society guidelines and current issues in cancer screening. CA Cancer J Clin 2019;69(3):184–210. 10.3322/caac.21557. [DOI] [PubMed] [Google Scholar]
- 90.U.S. Preventive Services Task Force. Published recommendations. 2019. Available at: https://www.uspreventiveservicestaskforce.org/BrowseRec/Index/browse-recommendations. [accessed January 17, 2020].
- 91.Peterson EB, Ostroff JS, DuHamel KN, et al. Impact of provider-patient communication on cancer screening adherence: A systematic review. Prev Med 2016;93:96–105. 10.1016/j.ypmed.2016.09.034. [DOI] [PMC free article] [PubMed] [Google Scholar]
- 92.Negoita S, Feuer EJ, Mariotto A, et al. Annual report to the nation on the status of cancer, part II: Recent changes in prostate cancer trends and disease characteristics. Cancer 2018;124(13):2801–2814. 10.1002/cncr.31549. [DOI] [PMC free article] [PubMed] [Google Scholar]
- 93.Durand M-A, Carpenter L, Dolan H, et al. Do interventions designed to support shared decision-making reduce health inequalities? A systematic review and meta-analysis. PLoS ONE 2014;9(4):e94670–e94670. 10.1371/journal.pone.0094670. [DOI] [PMC free article] [PubMed] [Google Scholar]
- 94.Sajid S, Kotwal AA, Dale W. Interventions to improve decision making and reduce racial and ethnic disparities in the management of prostate cancer: a systematic review. J Gen Intern Med 2012;27(8):1068–1078. 10.1007/s11606-012-2086-5. [DOI] [PMC free article] [PubMed] [Google Scholar]
- 95.Walker DM, McAlearney AS, Sova LN, Lin JJ, Abramson S, Bickell NA. Comparing prostate cancer treatment decision making in a resource-rich and a resource-poor environment: a tale of two hospitals. J Natl Med Assoc 2016;108(4):211–219. 10.1016/j.jnma.2016.08.002. [DOI] [PubMed] [Google Scholar]
- 96.Wolchok JD, Chiarion-Sileni V, Gonzalez R, et al. Overall survival with combined nivolumab and ipilimumab in advanced melanoma. N Engl J Med 2017;377(14):1345–1356. 10.1056/NEJMoa1709684. [DOI] [PMC free article] [PubMed] [Google Scholar]
- 97.Centers for Disease Control and Prevention. Melanoma incidence and mortality, United States—2012–2016, U.S. Cancer Statistics Data Briefs, No. 9. 2019. Available at: https://www.cdc.gov/cancer/uscs/about/data-briefs/no9-melanoma-incidence-mortality-UnitedStates-2012-2016.htm. [accessed January 17, 2020].
- 98.Reck M, Rabe KF. Precision diagnosis and treatment for advanced non-small-cell lung cancer. N Engl J Med 2017;377(9):849–861. 10.1056/NEJMra1703413. [DOI] [PubMed] [Google Scholar]
- 99.Parikh-Patel A, Morris CR, Kizer KW. Disparities in quality of cancer care: The role of health insurance and population demographics. Medicine (Baltimore) 2017;96(50):e9125 10.1097/md.0000000000009125. [DOI] [PMC free article] [PubMed] [Google Scholar]
- 100.Espey DK, Wu XC, Swan J, et al. Annual report to the nation on the status of cancer, 1975–2004, featuring cancer in American Indians and Alaska Natives. Cancer 2007;110(10):2119–2152. 10.1002/cncr.23044. [DOI] [PubMed] [Google Scholar]
- 101.Gomez SL, Noone AM, Lichtensztajn DY, et al. Cancer incidence trends among Asian American populations in the United States, 1990–2008. J Natl Cancer Inst 2013;105(15):1096–1110. 10.1093/jnci/djt157. [DOI] [PMC free article] [PubMed] [Google Scholar]
- 102.Martinez Tyson D, Medina-Ramirez P, Flores AM, Siegel R, Aguado Loi C. Unpacking Hispanic ethnicity-cancer mortality differentials among Hispanic subgroups in the United States, 2004–2014. Frontiers in public health 2018;6:219 10.3389/fpubh.2018.00219. [DOI] [PMC free article] [PubMed] [Google Scholar]


