

Abstract
Lewis acid-activation of carbonyl-containing substrates is broadly utilized in organic synthesis. In order to facilitate the development of novel reaction pathways and understand existing methods, it is necessary to determine the solution interactions between Lewis acids and Lewis bases. Herein, we report the application of in situ infrared spectroscopy and solution conductivity toward the identification of the solution structures formed when a range of carbonyl compounds are combined with catalytically active metal halide Lewis acids under synthetically relevant conditions. These data are consistent with formation of Lewis acid-dependent complexes, where metals of low relative Lewis acidity display no ground state interaction with carbonyls. Conversely, we observed the formation of polyligated complexes when stronger Lewis acids (SnCl4, TiCl4, ZrCl4, FeCl3, and AlCl3) were treated with ketones, aldehydes, and esters. This collection of observations is intended to assist the synthetic chemist in the design of new catalysts and the development of novel methods.
Graphical Abstract

INTRODUCTION
Since Lewis termed the acid as a “substance…which can employ a lone pair from another molecule,”1 synthetic chemists have used this defining property to modify electron density of carbonyls to facilitate organic reactions.2 Specifically, Lewis acids have been employed to catalyze Diels–Alder reactions,3 aldol reactions,4 ene reactions,5 photochemical reactions,6 and more recently to catalyze carbonyl-olefin metathesis.7 Because of these diverse applications, a multitude of efforts has been devoted to characterizing the interactions of Lewis acids and bases, historically relying on solid state infrared spectroscopy,2d,8 X-ray crystallography,9 as well as in situ NMR.2d,8a,b,10 While these techniques have provided foundational insights into their behavior under stoichiometric conditions, more discoveries continue to be made about the complexities of the interactions between carbonyls and Lewis acids in catalytic systems. Of particular interest to our lab are the interactions that facilitate Fe(III)-catalyzed carbonyl-olefin metathesis. This process developed by the Schindler lab11 has incited a plethora of synthetic developments with Lewis acids, expanding the reactivity facilitated by Fe(III),12 employing the properties of Ga(III),13 as well as BF3•OEt2,14 montmorillonite, and I2.15 Our previous efforts showed both the unexpected complexities of and the differences between the solution behavior of Fe(III) and Ga(III) (Figure 1).16 The Lewis acid-dependent behavior observed for FeCl3 and GaCl3 when combined with simple carbonyl compounds in solution has significant ramifications on catalyst behavior in carbonyl-olefin metathesis. Therefore, it is necessary to determine if these complex interactions are generally relevant to carbonyl-focused reactions catalyzed by metal halide Lewis acids. With this fundamental understanding of how the carbonyl specifically interacts with Lewis acids in solution, synthetic chemists will possess the mechanistic information crucial for developing efficient catalysts and high yielding procedures.
Figure 1.
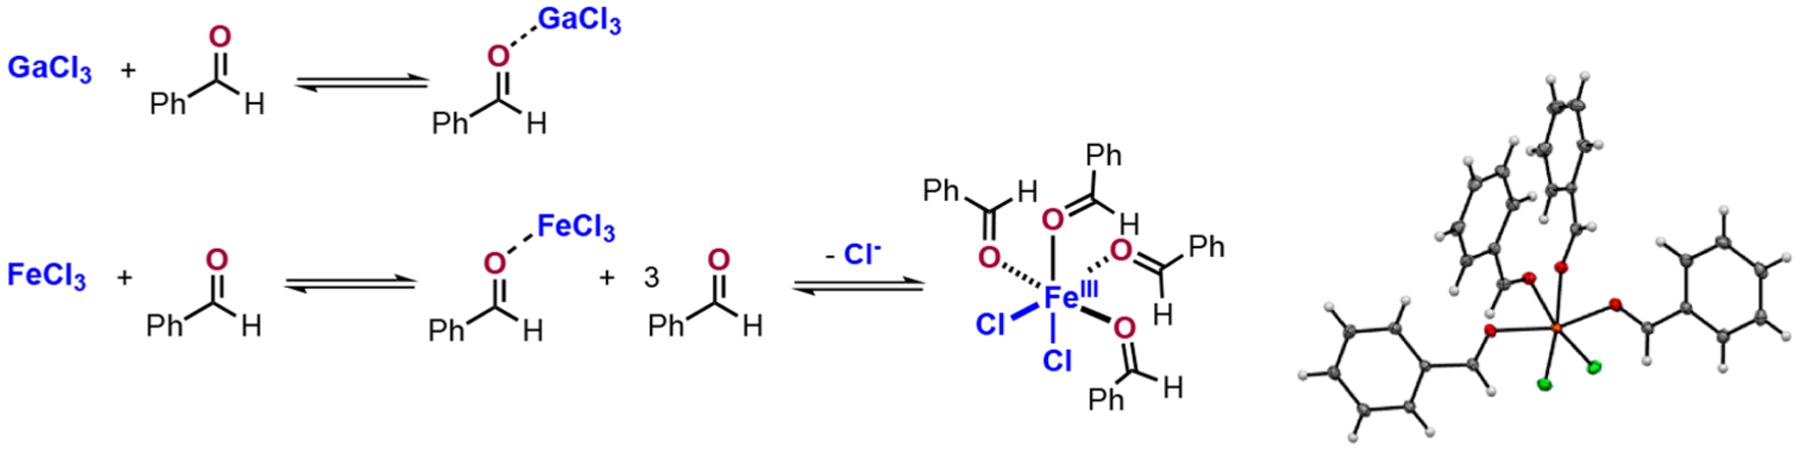
Solution behavior of GaCl3 and FeCl3 in the presence of benzaldehyde.16
In order to define the equilibria shown in Figure 1, we employed two observational techniques: (1) in situ infrared spectroscopy and (2) solution conductivity.17 With these detection methods, we performed titrations into DCE containing Lewis acid as either a homogeneous solution (GaCl3) or a heterogeneous slurry (FeCl3). These data allowed us to determine that GaCl3 and simple carbonyls like benzaldehyde produce high affinity Lewis pairs, whereas FeCl3 forms a Lewis pair under stoichiometric conditions but forms more highly ligated complexes in the presence of superstoichiometric carbonyl. Herein, we report the solution behavior of a range of simple Lewis acids with simple carbonyl compounds in the hopes that chemists can use these in situ observations to assist in reaction design and development. The application of these titration-based methods display Lewis acids that show no ground state complexation (ZnCl2, AgOTf, I2, and CeCl3), form classic Lewis pairs (BF3, BCl3, InCl3, and GaCl3), form 2:1 coordination complexes (TiCl4 and SnCl4), or showcase concentration-dependent complexes (ZrCl4, FeCl3, and AlCl3).
RESULTS AND DISCUSSION
Our efforts began with the examination of the solution interactions of various metal (pseudo)halide Lewis acids (ZnCl2, AgOTf, I2, CeCl3, GaCl3, FeCl3, InCl3, AlCl3, BCl3, BF3·OEt2, ZrCl4, TiCl4, and SnCl4) with simple carbonyls: acetone (1), acetophenone (2), benzaldehyde (3), and ethyl acetate (4). We created solutions/slurries of each Lewis acid in DCE, to which carbonyl was titrated incrementally. The equilibrium interactions were observed via real-time infrared spectroscopy (ReactIR) and through solution conductivity measurements.
ZnCl2, AgOTf, I2, and CeCl3.
Beginning with relatively weak Lewis acids, we employed ZnCl2, AgOTf, I2, and CeCl3. We prepared a heterogeneous mixture of ZnCl2 in anhydrous DCE. Upon titration of this slurry with 1, we only observe the presence of unbound 1 in solution (0–2 equiv 1 added with respect to ZnCl2). When we performed a similar titration on a slurry of AgOTf in DCE, we observed analogous behavior, where only unbound 1 is observable between 0 and 2 equiv 1. Addition of 1 to an I2 solution in DCE displayed only unbound 1. When we probed the interaction between 1 and a CeCl3 slurry, we again only observe unbound 1 between 0 and 2 equiv 1 added. Importantly, for the three heterogeneous Lewis acids in DCE, the systems remained as slurries throughout the entirety of the titration. These observations of negligible complexation are consistent with Lewis acid/carbonyl pairing being endergonic of the conditions examined in these titrations. The identification of the ground state of the system being located prior to complexation is important when performing computational transition state analysis, as well as when designing a transformation that requires a high affinity Lewis acid/base interaction.
BCl3, BF3, and InCl3.
We next prepared a solution of BCl318 in anhydrous DCE to which carbonyl was titrated incrementally. When we added 1 to the salt solution, we initially observe a signal at 1608 cm−1; however, once 0.25 equiv 1 is added, the signal intensity diminishes back to baseline with only free 1 observed.19 The temporary signal at 1608 cm−1 never reasserts, and no other signals appear in the carbonyl-region of the spectrum for the duration of the titration. Alternatively, when 2 is the titrant, we observe formation of a species with vibrations at 1563 and 1581 cm−1 (Figure 2A).20 These signals reach a maximum at 1 equiv 2 added; however, the solution forms a precipitate after 1 equiv 2 is achieved, so no further observations were collected. These vibrations are likely a result of the formation of 5. When an analogous titration is performed with 3, we observe exclusive formation of a species with vibrations at 1563 and 1589 cm−1 (Figure 2B). These signals continue to grow in intensity until 1 equiv 3 is present. These vibrations are likely a result of the formation of 6. Beyond 1 equiv 3, we observe the signals at 1563 and 1589 cm−1 decrease in intensity concomitant with the continual growth of free 3 at 1704 cm−1 (Figure 2C). The solution remains homogeneous throughout the titration. Interestingly, when an analogous titration is performed with 4, we observe exclusive formation of a species with a vibration at 1573 cm−1 (Figure 2D), consistent with reports by Lappert21 of coordination complex 7, that reaches a maximum intensity at 1 equiv 4 added. Beyond 1 equiv 4 added, we observe the signal at 1573 cm−1 stagnate in intensity concomitant with the growth of free 4.19
Figure 2.

Solution IR data for BCl3 (1 mmol in 6 mL 1:5 DCM/DCE) with 0–1 equiv 2 (A), 0–1 equiv 4 (B), 0–1 equiv 3 (C), as well as >1 equiv 3 (D). Titrations proceed from red to violet. [2] = 0, 0.021, 0.043, 0.064, and 0.085 M (A), [4] = 0, 0.017, 0.034, 0.051, 0.068, and 0.085 M (B), [3] = 0, 0.033, 0.065, 0.097, 0.129, and 0.177 M (C), and [3] = 0.177, 0.255, 0.332, 0.422, 0.482, and 0.628 M (D).19
When 0–6 equiv 1 is titrated to a solution of BF3·OEt2 in DCE, we observe formation of a signal at 1643 cm−1 and the presence of unbound 1 at1714 cm−1 (Figure 3A). Both signals grow for the duration of the experiment. When a similar titration is performed with 2, we observe signals at 1568 and 1596 cm−1 as well as unbound 2 at 1685 cm−1 (Figure 3B). Again, both signals grow for the duration of the experiment. When 3 is the titrant, we see signals at 1577, 1599, and 1626 cm−1 as well as free 3 at 1704 cm−1 (Figure 3C), all of which increase continuously over the course of the titration. The addition of 4 results in the continuous formation of a vibration at 1620 cm−1 and unbound 4 at 1734 cm−1 (Figure 3D). Several of these observations are consistent with literature reports in the solid state. In Figure 2A, the signal at 1643 cm−1 produced from the titration of BF3 with 1 is likely a result of the formation of 8, consistent with observations from the Susz22 and Seshadri laboratories.23 Similarly, they report 1:1 complex 9 in the solid state when 2 is combined with BF3.24 Because of these precedents combined with similar observations for the addition of 3 and 4 to BF3, the vibrations formed in Figure 2C,D are likely consistent with the formation of 1:1 coordination complexes 10 and 11.
Figure 3.

Solution IR data for BF3·OEt2 (2 mmol in 12 mL DCE) with 0–3 equiv 1 (A), 2 (B), 3 (C), and 4 (D). Titrations proceed from red to violet. Data observed at >3 equiv omitted for clarity. [1] = 0, 0.067, 0.134, 0.210, 0.319, and 0.499 M (A), [2] = 0, 0.071, 0.134, 0.216, 0.310, and 0.467 M (B), [3] = 0, 0.073, 0.145, 0.232, 0.339, and 0.548 M (C), and [4] = 0, 0.068, 0.135, 0.217, 0.315, and 0.489 M (D).19
When the titration analysis is applied to InCl3 in DCE, we see analogous results.25 When 0–6 equiv 1 are added to the slurry, we observe formation of a species with a vibration at 1673 cm−1 as well as unbound 1 at 1714 cm−1 (Figure 4A). When 2 is utilized as the titrant, the InCl3 system yields vibrations at 1573, 1596, and 1637 cm−1 as well as unbound 2 at 1685 cm−1 (Figure 4B). Titration of InCl3 with 3 provides signals at 1581, 1596, and 1638 cm−1 as well as unbound 3 at 1704 cm−1 (Figure 4C). When 4 is the titrant, we observe a precipitate, and no additional data were collected. Interestingly, InCl3 increases in homogeneity as increasing amounts of 1, 2, and 3 are added to the slurry. However, these mixtures never reach complete homogeneity. Conductance measurements show no change in solution conductivity over the course of the titration.19 Lappert and co-workers reported a neat 1:1 coordination complex between 4 and InCl3, which may be the identity of the precipitate we observe in this system.21 Further, if the analogous behavior we observed for BF3 holds, then we are likely forming 1:1 coordination complexes 12, 13, and 14 in Figure 4A–C.
Figure 4.

Solution IR data for InCl3 (2 mmol in 12 mL DCE) with 0–5 equiv 1 (A), 0–3 equiv 2 (B), and for InCl3 (1 mmol in 6 mL DCE) with 0–3 equiv 3 (C). Titrations proceed from red to violet. [1] = 0, 0.067, 0.134, 0.216, 0.308, 0.489, and 0.795 M (A), [2] = 0, 0.071, 0.134, 0.216, 0.310, and 0.486 M (B), and [3] = 0, 0.050, 0.145, 0.224, 0.347, and 0.497 M (C).19
GaCl3.
GaCl3 is highly soluble in DCE, and titrations were able to be performed into a homogeneous mixture.26 When 1 is added to the GaCl3 solution from 0 to 1 equiv, we observe exclusive formation of a signal at 1630 cm−1 (Figure 5A) and we observe no unbound 1. When a similar titration was performed with 2, we observe an exclusive species with vibrations at 1563, 1588, and 1603 cm−1 (Figure 5B). Once again, we observe no unbound carbonyl between 0 and 1 equiv 2 added. When 3 is the titrant, we observe a single species with absorbances at 1573, 1596, and 1610 cm−1 and no unbound 3 is present (Figure 5C). Lastly, a titration utilizing 4 as the titrant yields no free 4, but rather formation of a single species at 1602 cm−1 (Figure 5D). When titrations were extended beyond 1 equiv for 1, 2, 3, and 4, the only change to the spectra is the addition of unbound carbonyl.19 Importantly, no other increases or decreases in signal intensities are present. Conductance measurements show no change in solution conductivity over the course of the titration.19
Figure 5.

Solution IR data for GaCl3 (1 mmol in 6 mL DCE) with 0–1 equiv 1 (A), 2 (B), 3 (C),16 4 (D). Titrations proceed from red to violet. [1] = 0, 0.023, 0.045, 0.067, 0.112, 0.156 M (A), [2] = 0.0, 0.029, 0.057, 0.085, 0.113, 0.155 M (B), [3] = 0, 0.049, 0.081, 0.097, 0.129, 0.160 M (C), and [4] = 0, 0.018, 0.034, 0.051, 0.068, and 0.168 M (D).19
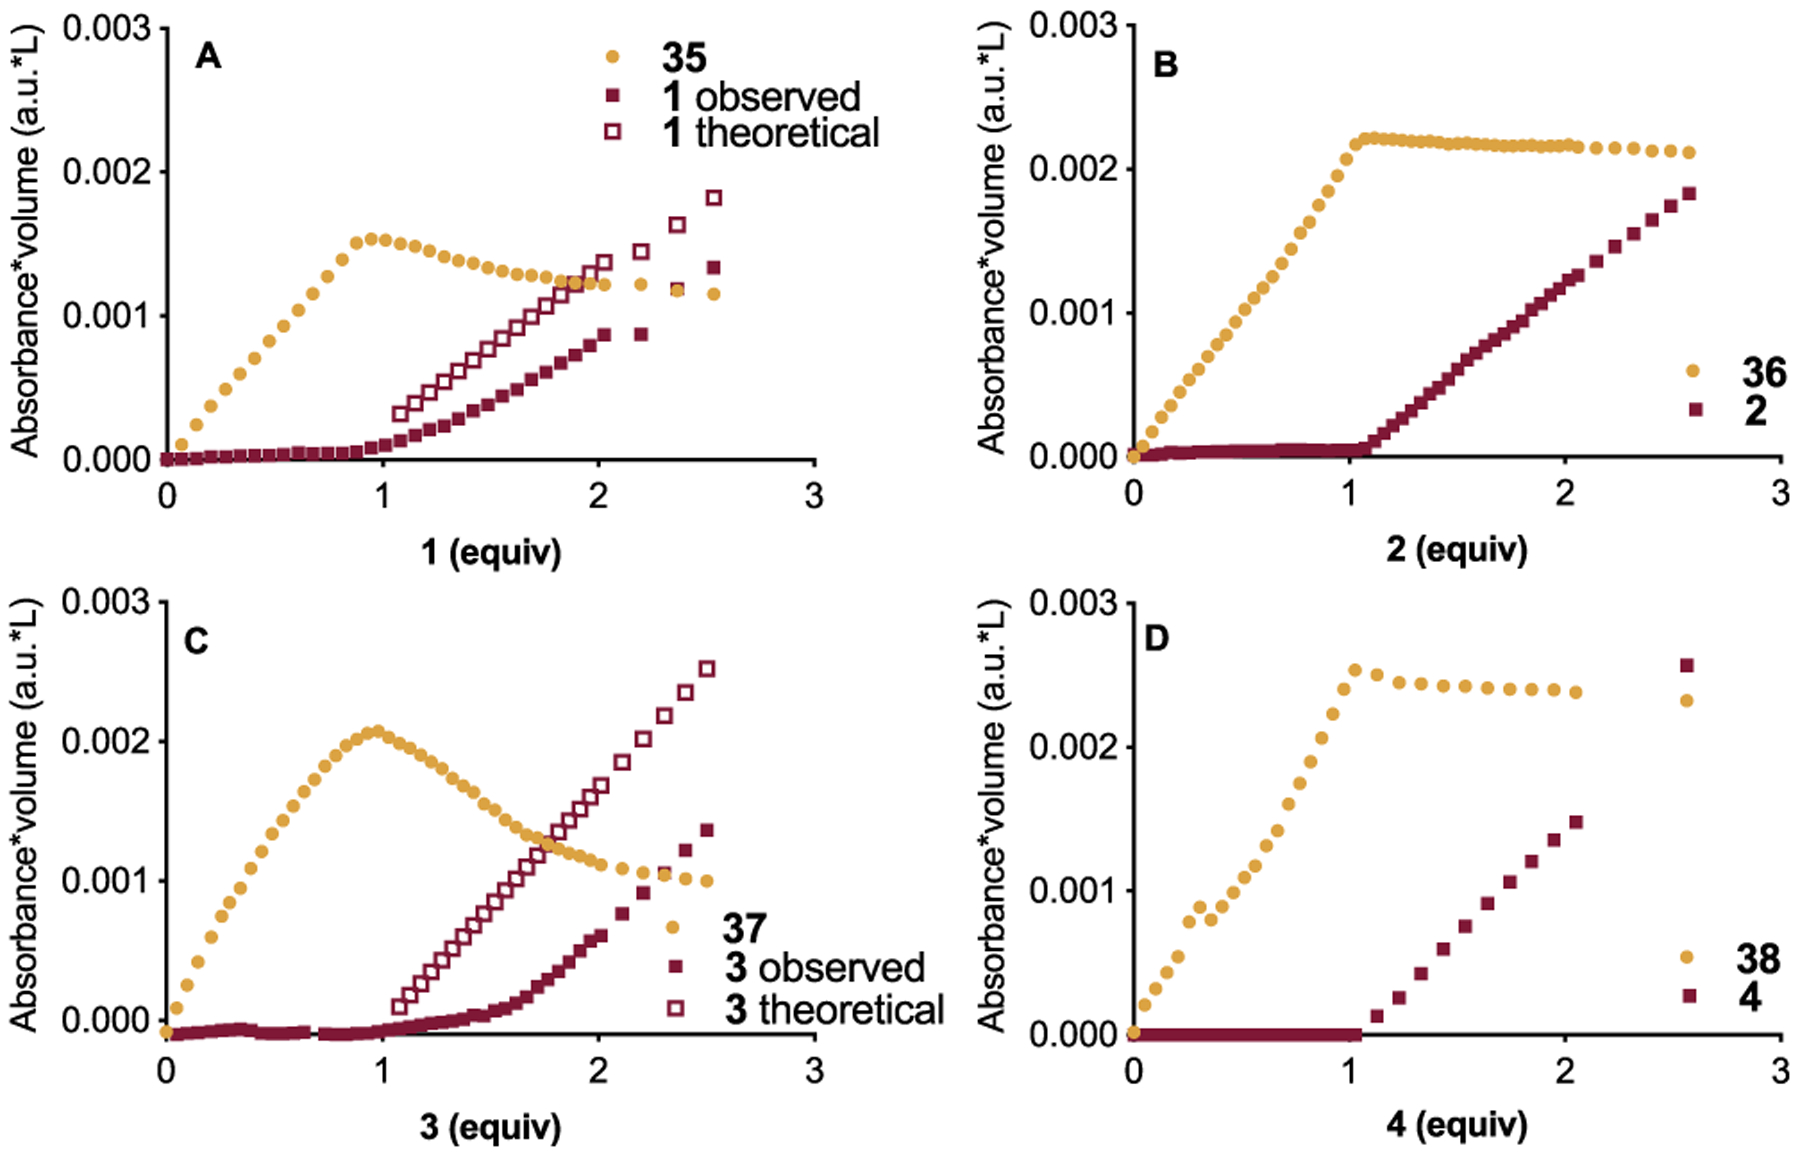
We next examined the amounts of each component present in solution with respect to the equivalents of carbonyl added. We accounted for the dilution factor caused by titration by normalizing the absorbance value of the λmax of each component by the volume of the solution when the spectrum was collected.17 When we consider the addition of 1 to GaCl3, we observe a linear increase in the signal for the initial species (15) between 0 and 1 equiv 1 added; however, once 1 equiv 1 is present, there is negligible change in 15 (Figure 6A). Concomitant with the cessation of signal change for 15, we observe growth of unbound 1. We observe analogous behavior when 2 (Figure 6B), 3 (Figure 6C), and 4 are added to GaCl3 (Figure 6D). These observations of the signals reaching a maximum at 1 equiv concomitant with the observation of free carbonyl beyond 1 equiv are consistent with 1:1 coordination complexes forming. Further, our observation of 1:1 coordination complex 18 is consistent with the report by Lappert and co-workers.21 The similar behavior we observed for 1, 2, and 3 is consistent with 1:1 coordination complexes 15, 16, and 17.
Figure 6.

Analysis of components: 1 and 15 (A), 2 and 16 (B), 3 and 17 (C),37 as well as 4 and 18 (D).19
TiCl4 and SnCl4.
Like GaCl3, TiCl4 is highly soluble in DCE, and titrations were able to be performed in a homogeneous mixture. When 0–1.5 equiv 1 are added to a TiCl4 solution, we observe formation of an exclusive vibration at 1665 cm−1 (Figure 7A). At about 1.5 equiv of added 1, we begin to observe unbound 1 in solution at 1714 cm−1. At 2 equiv 1, we observe the signal at 1665 cm−1 stop increasing and observe the signal intensity of unbound 1 grow.19 When 2 or 3 are the titrant, we observe a precipitate form before 1 equiv of either is present. When 0–2 equiv 4 are titrated, we observe formation of a species at 1626 cm−1 with a small shoulder at 1659 cm−1 that becomes detectable at 1.3 equiv 4 added (Figure 7B). Importantly, no unbound 4 is observed between 0 and 2 equiv. Beyond 2 equiv 4 added, we see the signal at 1626 cm−1 stop increasing, and we observe unbound 4.19 Conductance measurements show no change in solution conductivity over the course of the titration.19
Figure 7.

Solution IR data for TiCl4 (2 mmol in 12 mL DCE) with 0–1.5 equiv 1 (A) and 0–2 equiv 4 (B). Titrations proceed from red to violet. [1] = 0, 0.045, 0.090, 0.134, 0.178, and 0.222 M (A) and [4] = 0, 0.034, 0.067, 0.134, 0.217, and 0.331 M (B).19
When we consider the amounts of each component present in solution with respect to the equivalents of carbonyl added, specifically for the addition of 1 to TiCl4, we observe that 19 increases between 0 and 1.6 equiv 1 added; however, once 1.6 equiv 1 is present, there is negligible increase in 19 (Figure 8A). Concomitantly, we observe proportional growth of unbound 1 beyond 1 equiv 1 added. We observe analogous behavior when 4 is added to TiCl4, with an increase in 20 between 0 and 2 equiv 4 added (Figure 8B). Once again, when >2 equiv 4 are achieved, we observe negligible change in 20 with concomitant growth of free 4.
Figure 8.

Analysis of components: 1 and 19 (A) as well as 4 and 20 (B).19
The Susz group reported a 1:1 complex between 1 and TiCl4.27 Their observations are consistent with ours between 1 and TiCl4 (Figures 7A); however, if we take into account our component analysis, this signal reaches a maximum at approximately 2 equiv 1 added concomitant with rapid increase in free 1. These data suggest that a 2:1 coordination complex (19) forms between 1 and TiCl4. When we consider titration of 4 to TiCl4, the observations are more straightforward. We only observe unbound 4 once 2 equiv is added to a solution of TiCl4, suggesting that 2 equiv 4 is necessary to ligate 1 equiv TiCl4. These types of higher-order complexes are consistent with the Susz group’s report of 2:1 complexes between 3 and TiCl428 and SnCl4,29 as well as Denmark and co-workers’ reports of 2:1 complexes between aldehydes and SnCl4.9b,30
As with GaCl3 and TiCl4, SnCl4 is highly soluble in DCE, and titrations were able to be performed into a homogeneous mixture. When 0–3 equiv 1 are titrated to a solution of SnCl4, we observe formation of a signal at 1659 cm−1 as well as unbound 1 (Figure 9A). Both signals continue to grow in intensity until approximately 2.6 equiv added 1. At this point in the titration, the signal at 1659 cm−1 ceases to increase significantly; whereas, the signal for 1 continues to increase. When similar titrations were performed with 2 and 3, we observe formation of a precipitate before 1 equiv of either titrant is reached; therefore, solution IR could not be carried out on these systems. With 4 as the titrant, we observe formation of a vibration at 1629 cm−1 as well as trace amounts of unbound 4 between 0 and 2 equiv 4 added (Figure 9B). Beyond 2 equiv 4 added, we still observe the signal at 1629 cm−1 increase until 3.2 equiv 4 is added. Beyond 3.2 equiv 4 added, we observe negligible change in the signal intensity at 1629 cm−1 concomitant with a marked increase in free 4.19 Conductance measurements show no change in solution conductivity over the course of the titration.19
Figure 9.
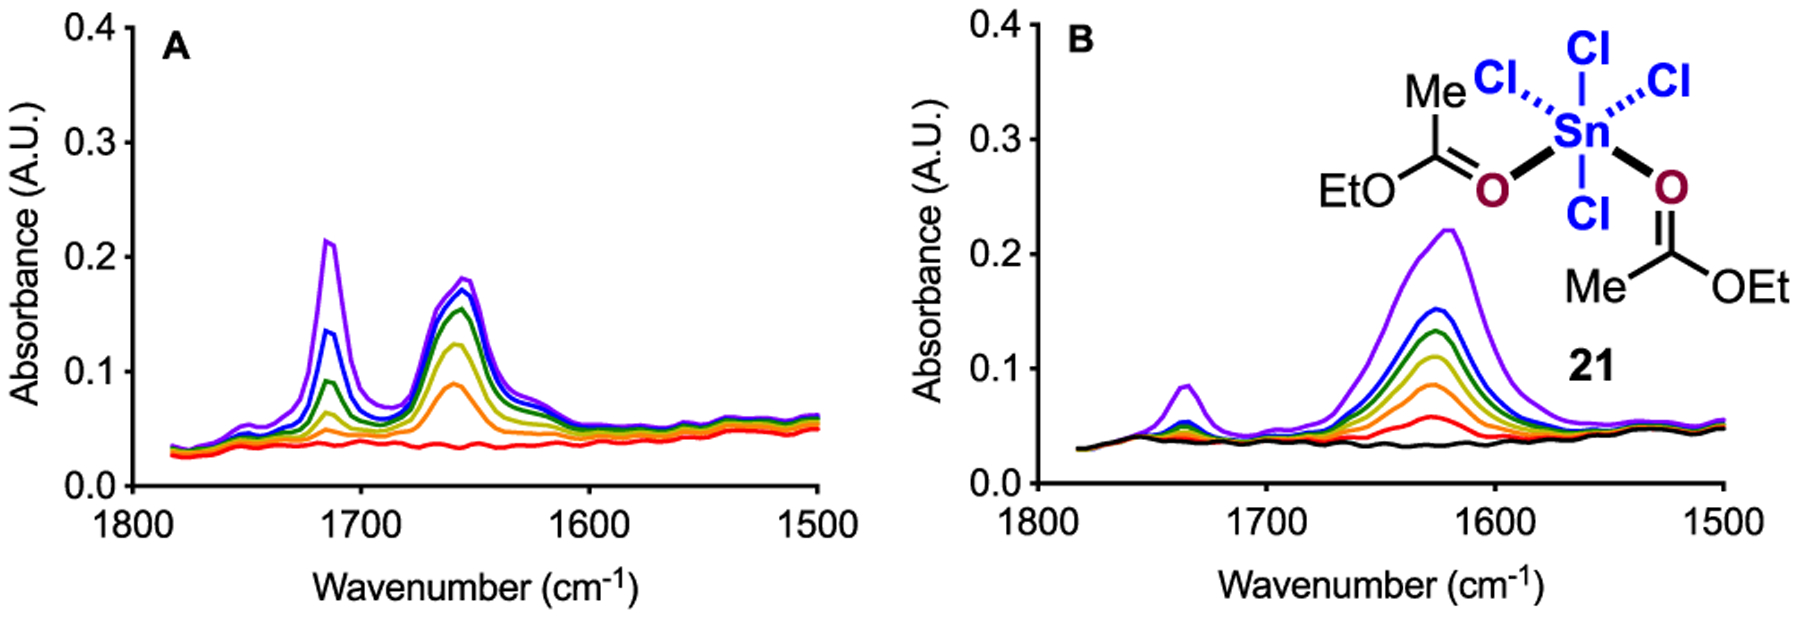
Solution IR data for SnCl4 (2 mmol in 12 mL DCE) with 0–3 equiv 1 (A) and 0–2 equiv 4 (B). Titrations proceed from red to violet. [1] = 0, 0.067, 0.134, 0.222, 0.330, 0.489 M (A) and [4] = 0, 0.026, 0.059, 0.093, 0.127, 0.160, and 0.315 M (B).19
Both the Denmark and Susz laboratories report 2:1 complexes between aromatic aldehydes and SnCl4.9b,29 Our observation of what appears to be 2:1 coordination complex 22 is consistent with these reports. With these precedents in mind, we next examined the amounts of each component present in solution with respect to the equivalents of carbonyl added. Importantly, when we consider the addition of 1 to SnCl4, we observe the signal at 1659 cm−1 increase between 0 and 2.6 equiv 1 added (Figure 10A). Beyond this amount of 1, we observe negligible increase in the signal at 1659 cm−1 and simultaneously observe free 1 increase linearly. We observe analogous behavior when we consider the addition of 4 to SnCl4 where we observe 22 increase until 3.2 equiv 4 is reached (Figure 10B). Beyond 3.2 equiv of added 4, we observe a linear increase in free 4 and negligible increase in 22. Because of the similarities between the data sets, it is likely that 1 also forms 2:1 coordination complex 22. However, when we consider our component analysis, we observe free 1 almost instantaneously. These data suggest that if coordination complex 22 is forming in solution, then 1 has a lower binding affinity for SnCl4 than 4. The addition of >2 equiv carbonyl to SnCl4 would result in displacement of a chloride from the metal center.16 However, our conductance measurements show no change in solution conductivity, which is inconsistent with the addition of more than 2 molecules of carbonyl to the Lewis acid.
Figure 10.

Analysis of components: 1 and the signal at 1659 cm−1 (A), as well as 4 and 21 (B).19
ZrCl4.
ZrCl4 is insoluble in DCE, so titrations were performed into a slurry.31 Titration of ZrCl4 with 1 results in the formation of a species with a vibration at 1637 cm−1 between 0 and 0.5 equiv 1 added (Figure 11A). No unbound 1 is detectable. However, beyond 0.5 equiv 1, a new signal at 1655 cm−1 grows in, while the intensity of the peak at 1637 cm−1 decreases (Figure 11E). We also observe an isosbestic point at 1645 cm−1. The signal at 1655 cm−1 continues to increase in intensity until ~1.5 equiv 1 is present. Importantly, free 1 is observed once 1.5 equiv 1 is added. The system never reaches homogeneity. When a similar titration is performed with 2, we initially observe signals at 1521 and 1585 cm−1 (Figure 11B); however, these signals shift to vibrations at 1551, 1585, and 1607 cm−1 once 2 is added beyond 0.6 equiv (Figure 11F). These signals continue to grow in intensity until 1.5 equiv 2 is added. Beyond 1.5 equiv, we observe free 2 and no change in the initial peaks.19 Once again, homogeneity is never reached. When 3 is the titrant, we observe formation of a species with vibrations at 1573, 1596, and 1614 cm−1 (Figure 11C). These signals continue to grow in intensity with the signal at 1614 cm−1 broadening until 1.2 equiv 3 is achieved (Figure 11G). Beyond 1.5 equiv 3, we observe the signals at 1573, 1596, and 1614 cm−1 stop increasing, concomitant with the observation of free 3 at 1704 cm−1. The system never reaches homogeneity. When the titration analysis is performed with 4, we observe a signal at 1603 cm−1 (Figure 11D) that continues to grow until 0.5 equiv 4 is added. Beyond 0.6 equiv 4, we observe formation of vibrations at 1610 and 1640 cm−1 which continue to grow until 1.2 equiv 4 is present, and we observe an isosbestic point at 1600 cm−1 (Figure 11H). Beyond 1.5 equiv 4, we observe the signals at 1610 and 1640 cm−1 stagnate, concomitant with free 4 at 1734 cm−1.19 Again, the slurry never transitions to a homogeneous system. The type of interactions we observe in Figure 11A–D are similar to what we observed between 0 and 1 equiv carbonyl added to a GaCl3 solution, likely indicating the formation of 1:1 coordination complexes 23, 24, 25, and 26. In Figure 11H, the signals at 1610 and 1640 cm−1 are consistent with 2:1 coordination complex 30 (Figure 12) reported by Lappert.21 The analogous behavior with the systems that contain 1, 2, and 3 are likely consistent with these systems forming 2:1 coordination complexes 27, 28, and 29, respectively. The obvious difference between the behavior of these signals reaching a maximum at ~1.5 equiv and what we observe for the TiCl4 and SnCl4 systems is that the latter begins as a homogeneous solution. When conductance studies were performed on these systems, we observe a negligible change in conductivity.19
Figure 11.

Solution IR data for ZrCl4 (2 mmol in 12 mL DCE) with 0–0.5 equiv 3 (A), 4 (B), 5 (C), and 6 (D), as well as 0.6–1.2 equiv 1 (E), 2 (F), 3 (G), and 4 (H). Titrations proceed from red to violet. [1] = 0, 0.011, 0.022, and 0.34 M (A), [2] = 0, 0.007, 0.014, 0.021, and 0.029 M (B), [3] = 0, 0.008, 0.016, 0.024, and 0.032 M (C), [4] = 0, 0.009, 0.026, 0.034, and 0.043 M (D), [1] = 0.056, 0.067, 0.090, and 0.101 M (E), [2] = 0.043, 0.050, 0.064, 0.071, and 0.085 M (F), [3] = 0.054, 0.082, 0.089, and 0.096 M (G), [4] = 0.059, 0.068, 0.076, 0.085, 0.093, and 0.101 M (H).19
Figure 12.

Proposed structures of ZrCl4 beyond 2 equiv carbonyl added.
FeCl3 and AlCl3.
We previously investigated the behavior of FeCl3 between 1, 2, and 3.16 FeCl3 is insoluble in DCE, so titrations are performed into a slurry.32 For addition of 1 to the FeCl3 mixture, we observe no unbound 1 at 1714 cm−1 between 0 and 1 equiv. In the carbonyl region of the spectrum, we observe formation of an exclusive species at 1633 cm−1 (Figure 13A). Importantly, the system remains heterogeneous until 1 equiv 1 is present. When a similar titration is performed with 2 as the titrant, we observe signals at 1558, 1589, and 1603 cm−1 (Figure 13B). We observe a transition to homogeneity upon the addition of 1 equiv 2. A signal at 1685 cm−1 is notably absent, consistent with no unbound 2. When 3 is added to the FeCl3 slurry, it yields a species with vibrations at 1569, 1592, and 1610 cm−1, and no unbound 3 is detected at 1704 cm−1 (Figure 13C). Once again, the mixture remains heterogeneous until 1 equiv 3 is added.
Figure 13.

Solution IR data for FeCl3 (2 mmol in 12 mL DCE) with 0–1 equiv 1 (A), 2 (B), 3 (C),16 4 (D), as well as >1 equiv 1 (E), 2 (F), 3 (G),16 and 4 (H). Titrations proceed from red to violet. [1] = 0, 0.034, 0.067, 0.101, 0.134, 0.178 M (A), [2] = 0, 0.021, 0.043, 0.071, 0.113, 0.168 M (B), [3] = 0, 0.033, 0.057, 0.081, 0.105, 0.129, and 0.161 M (C), [4] = 0, 0.034, 0.068, 0.101, 0.135, 0.168 M (D), [1] = 0.233, 0.265, 0.319, 0.383, 0.447, 0.593 M (E), [2] = 0.182, 0.263, 0.330, 0.460, 0.523, 0.586 M (F), [3] = 0.177, 0.224, 0.270, 0.316, 0.541, 0.824 M (G), and [4] = 0.168, 0.217, 0.266, 0.331, 0.488, 0.641 M (H).19
When 4 is the titrant, no unbound 4 is observed at 1734 cm−1, and the titration initially yields exclusive formation of a signal at 1600 cm−1 (Figure 13D). The system becomes homogeneous in the presence of 1 equiv 4. Our observations for titrations of FeCl3 with 1 and 2 are consistent with the findings of the Susz lab where they showed formation of complexes 31 and 32 in the solid state.41 Because of the analogous behavior of the titrations with 3 and 4, complexes 33 and 34 likely form when these carbonyls are added to FeCl3.
More complex behavior occurs when these titrations proceed beyond 1 equiv added carbonyl. When 1 is added in excess of 1 equiv, we observe an isosbestic point at 1648 cm−1, resulting from a decrease in the signal at 1633 cm−1, while a new signal at 1663 cm−1 forms (Figure 13E). In addition to this transition, we also observe unbound 1 at 1714 cm−1. When 2 is added beyond 1 equiv, the vibration for 32 at 1558 cm−1 decreases as free 2 is observed at 1685 cm−1 (Figure 13F). Further, the range between 1610 and 1670 cm−1 grows. We similarly observe an isosbestic point at 1566 cm−1. Super-stoichiometric addition of 3 also results in the signal at 1569 cm−1 decreasing, an isosbestic point at 1574 cm−1, and also 1577 and 1626 cm−1 growing (Figure 13G). Simultaneously, the intensity of the signal for unbound 3 grows at 1704 cm−1. When superstoichiometric amounts of 4 are titrated, we observe an isosbestic point at 1618 cm−1 (Figure 13H). Similar to the other titrations, we observe the signal at 1600 cm−1 decrease in intensity, while the range between 1620 and 1700 cm−1 increases, all concomitant with the observation of free 4 at 1734 cm−1.
When we perform a component analysis on the titrations of FeCl3 with the array of carbonyl compounds, we obtain the plots in Figure 14. Consideration of the addition of 1 to FeCl3 yields an increase in 31 between 0 and 1 equiv 1 added (Figure 14A). Beyond 1 equiv 1, we observe 31 decrease concomitant with a linear increase in free 1. We observe similar behavior for 32 and 2 (Figure 14B), 33 and 3 (Figure 14C), as well as 34 and 4 (Figure 14D). When we compare the values of carbonyl not detected (CND) with the difference between maximum complex (CMAX) and the observed complex (CCOORD), we observe a linear relationship for the systems containing FeCl3 (Figure 15).17 The relationship between 1 and 31 suggests that 3–4 equiv 1 are required to consume 1 equiv 1:1 coordination complex 31 (Figure 15A), 3–4 equiv 2 consume 1 equiv 32 (Figure 15B), approximately 3 equiv 3 are required to consume 1 equiv 33 (Figure 15C), and approximately 4 equiv 4 are required to consume 1 equiv 34 (Figure 15D). We simultaneously examined the conductivity of these FeCl3-carbonyl systems using concentrations identical to our IR investigation.19 We began our conductivity studies with FeCl3 and 1 and observe negligible conductivity between 0 and 1 equiv. At the equivalence point, we observe a conductivity of 96 μS cm−1. At 2 equiv 1, κ increases to 733 μS cm−1, which continues up to 1244 μS cm−1 at 5 equiv 1. Similarly, when 2 is the titrant, we observe a κ of 796 μS cm−1 at 2 equiv 2, which increases to 1223 μS cm−1 at 5 equiv added 2. When 3 is utilized, we see negligible conductivity between 0 and 1 equiv 3 and then a rapid increase to 1247 μS cm−1 at 2 equiv 3. When 4 is the titrant, we observe negligible conductivity between 0 and 1 equiv. Interestingly, we only observe a κ of 373 μS cm−1 at 6 equiv 4.19
Figure 14.

Analysis of components: 1, theoretical 1 after 1 equiv, and 31 (A), as well as 2, theoretical 2 after 1 equiv, and 32 (B), as well as 3, theoretical 3 after 1 equiv, and 33 (C),16 as well as 4, theoretical 4 after 1 equiv, and 34 (D).19
Figure 15.
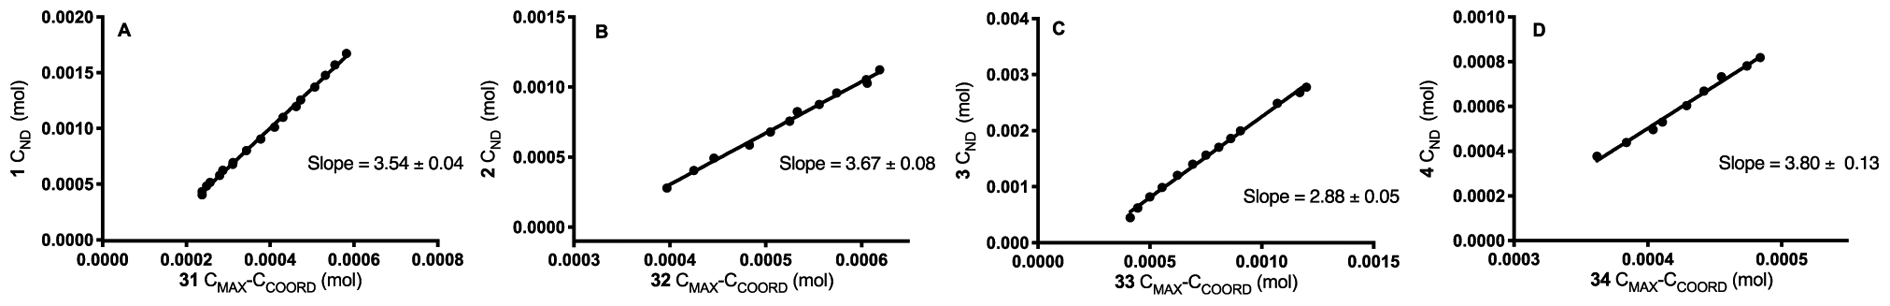
Undetected carbonyl (CND) versus consumed coordination complex (CMAX-CCOORD) for 1 and 31,16 2 and 32, 3 and 33, and 4 and 34.19
Like FeCl3, AlCl3 is insoluble in DCE, requiring carbonyl addition to a slurry. When our titration method is applied to AlCl3 with 0–1 equiv 1, we observe exclusive formation of a signal at 1640 cm−1 (Figure 16A). Similar titrations of the AlCl3 slurry with 2, 3, and 4 yield the following vibrations: 1560, 1588, and 1607 cm−1 for 2 (Figure 16B); 1568, 1596, and 1614 cm−1 for 3 (Figure 16C); and 1610 cm−1 for 4 (Figure 16D). All four titrations share two key features: (1) no unbound 1, 2, 3, or 4 is observed from 0 to 1 equiv added carbonyl, and (2) AlCl3 remains heterogeneous until 1 equiv carbonyl is present. Because of the analogous behavior observed in the titrations of AlCl3 with 1, 2, 3, and 4 to those of GaCl3 and FeCl3, the spectra are likely consistent with the formation of 35 (Figure 16A), 36 (Figure 16B), 37 (Figure 16C), and 38 (Figure 16D). The Susz lab reported a 1:1 complex between 2 and AlCl3, consistent with our observation of 36.33
Figure 16.

Solution IR data for AlCl3 (2 mmol in 12 mL DCE) with 0–1 equiv 1 (A), 2 (B), 3 (C), 4 (D), as well as >1 equiv 1 (E), 2 (F), 3 (G), and 4 (H). Titrations proceed from red to violet. [1] = 0, 0.022, 0.045, 0.067, 0.090, 0.112, and 0.145 M(A), [2] = 0, 0.036, 0.071, 0.106, 0.141, 0.175, and 0.196 M(B), [3] = 0, 0.043, 0.065, 0.089, 0.113, 0.137, and 0.153 M(C), [4] = 0 M, 0.011 M, 0.017 M, 0.026 M, 0.034 M, 0.043 M (D), [1] = 0.244, 0.308, 0.356, 0.436, 0.592, and 0.894 M (E), [2] = 0.203, 0.284, 0.396, 0.486, 0.611, and 0.672 M (F), [3] = 0.255, 0.339, 0.415, 0.489, and 0.635 M (G), and [4] = 0.200, 0.250, 0.299, 0.410, 0.488, and 0.565 M (H).19
The similarity to the titrations of FeCl3 continues beyond 1 equiv added 1 and 3 with respect to AlCl3. When beyond 1 equiv 3 is added, we observe the signal at 1640 cm−1 of 35 decrease in intensity, we observe an isosbestic point at 1650 cm−1, and we observe a species form at 1665 cm−1 as well as unbound 1 at 1714 cm−1 (Figure 16E). When 3 is similarly titrated, we observe a decrease in intensity of the signal at 1568 cm−1 of 37, growth at 1628 cm−1, as well as free 3 at 1704 cm−1 (Figure 16G). Unlike 1 and 3, the combination of carbonyls 2 and 4 with AlCl3 yields behavior analogous to GaCl3 (Figure 16F,H).
Because of this seemingly analogous behavior with FeCl3 for AlCl3 when combined with 1 and 3, as well as the similarity with GaCl3 for 2 and 4, we next examined the amounts of each component present in solution with respect to the equivalents of carbonyl added. When we consider the addition of 1 to AlCl3, we observe 35 increase between 0 and 1 equiv 1 added. Beyond 1 equiv 1, we observe 35 decrease concomitant with an increase in free 1 (Figure 17A). We observe similar behavior for 37 and 3 (Figure 17C). In both of these cases, the free carbonyl we observe is less than the amount being added beyond 1 equiv. Alternatively, when we consider the addition of 2 and 4 to AlCl3, we observe 36 and 38 increase from 0 to 1 equiv 2 (Figure 17B) and 4 (Figure 17D), respectively. Beyond 1 equiv 2 and 4, there is negligible decrease in 36 and 38, with rapid subsequent increase in the signals for 2 and 4, consistent with the amount added. Because the behavior of 1 and 3 with AlCl3 is similar to FeCl3, we examined if there was a correlation between the undetected carbonyl and the consumed Lewis pair. Interestingly, when we compare the values of 1 and 3 not detected (CND) with those of 35 and 37 being consumed (CMAX-CCOORD), we observe disparate behavior (Figure 18).
Figure 17.
Analysis of components: 1, theoretical 1 after 1 equiv, and 35 (A), 2 and 36 (B), 3, theoretical 3 after 1 equiv, and 37 (C), as well as 4 and 38 (D).19
Figure 18.

Undetected carbonyl (CND) vs consumed coordination complex (CMAX-CCOORD) for 1 and 35, 3 and 37.19
The linear relationship between 1 and 35 suggests that 2–3 equiv 1 are required to consume 1 equiv 1:1 coordination complex 35 (Figure 18A), whereas the relationship between 3 and 37 changes over the course of the titration (Figure 18B). At small amounts of 37 consumed (left side of plot), the slope is consistent with approximately 2–3 equiv 3 consuming 1 equiv 37. As more 37 is consumed (right side of plot), the slope decreases, suggesting less 3 is required to consume 37 (~1–2 equiv). Lastly, we examined the conductivity of the solutions that result from titration of the AlCl3 slurry with 1, 2, 3, and 4. Titrations with 2 and 4 do not display a change in solution conductance. The systems produced with 1 and 3, again, yield different results (Figure 19). Titration of AlCl3 with 1 displays no change in conductivity. The 3-mediated titration displays negligible conductance from 0 to 1 equiv, but then rapidly increases in conductivity beyond 1 equiv to a maximum of 700 μS cm−1 at 2 equiv added 3. Interestingly, the conductivity decreases to less than 400 μS cm−1 at 4 equiv added 3, suggesting significant changes in solution composition over the course of the titration.
Figure 19.

AlCl3 solution conductance for titration with 1 and 3.19
If we consider the structural ramifications of the correlations in Figure 15 and Figure 18 in concert with the conductance measurements, they provide insight into the solution behavior of FeCl3 and AlCl3 in the presence of carbonyls. When both FeCl3 and AlCl3 are exposed to a stoichiometric amount of carbonyl compound, the classical solution structures for Lewis-acid-mediated systems form, comprised of one molecule of Lewis acid and one molecule of carbonyl compound (Figure 20). However, in the presence of a superstoichiometric amount of carbonyl, complexes can form via the addition of further equivalents of carbonyl compound to the metal center. As a result, some population of carbonyl-ligated complexes will exist in solution with varying degrees of coordination by the carbonyl (x). When at least three additional equiv carbonyl are added to the 1:1 Lewis acid-carbonyl complex, structures will form where some number (y) of the chloride ligands are displaced to the outer sphere. Our data are consistent with the formation of solvent-separated ion pairs (x ≥ 3 and y ≥ 1, Figure 20) when FeCl3 is in the presence of 1, 2, 3, and 4. Further, we have reported a crystal structure for highly ligated complex 41 (Figure 21), where four molecules of 3 coordinate to the Fe(III) center.16
Figure 20.

Proposed solution behavior of FeCl3 and AlCl3 in the presence of 1, 2, 3, and 4. M = Fe(III) or Al(III).
Figure 21.

Proposed highly ligated complexes for FeCl3.
Because of this result, we analogously propose structure 39 for the addition of 1, 34 for the addition of 2, and 42 for the addition of 4 as likely forming in solution. However, the nonunity slopes observed in Figure 14 may be consistent with a distribution of complexes, and 41 might simply be the structure that crystallized under forcing conditions. Lastly, our ground state observations of the systems disclosed are inconsistent with the superelectrophilic homodimers reported by Schindler, Sigman, and Zimmerman.12e When the system contains 2 equiv FeCl3 and 1 equiv carbonyl, we only observe the formation of a 1:1 Lewis pair in the presence of solid FeCl3.
When we apply the same consideration to the systems containing AlCl3, our observations of negligible change in conductivity for addition of 1 are inconsistent with ion pair formation, suggesting a solution structure like 43 (Figure 22).
Figure 22.

Proposed highly ligated complexes for AlCl3.
When this analysis is applied to the addition of 3 to AlCl3, the system displays a rapid increase in solution conductivity up to 2 equiv 3, consistent with a structure like 44, where the displacement of a chloride occurs. However, the decrease in slope in Figure 18B and the decrease in solution conductivity in Figure 19 suggest a change in solution behavior. If we consider the equilibria illustrated in Scheme 1, our observations for AlCl3 and 3 between 1 and 2 equiv are most consistent with the stoichiometry required for pathway A, where 3 equiv 3 are required to consume 1 equiv 37. This pathway results in one ion pair for each equiv of 37. As the amount of 3 increases beyond 2 equiv, the dominant equilibrium may change to be most consistent with pathway B, where 2 equiv 3 are required to consume 2 equiv 37. This pathway results in one ion pair for two equiv 37, a decrease in the total number of ions. This type of ion pairing for Al/carbonyl interactions, which results in aluminate formation, was proposed by Evans for the interaction of an Al-centered Lewis acid with α,β-unsaturated N-acyloxazolidinones,34 observed by Castellino,35 and examined further by Houk and Gouverneur.19,36
Scheme 1.

Proposed Solution Behavior of AlCl 3 in the Presence of 3
Observed Trends.
Across the series of interactions we have observed, several trends resolve (Figure 23). For the weakest Lewis acids, ZnCl2, AgOTf, I2, and CeCl3, we observe no interaction in solution under the conditions probed. As Lewis acidity increases, we begin to see shifts in the C=O region for BCl3 (5–7), BF3·OEt2 (8–11), and InCl3 (12–14). Importantly, we see free carbonyl at all points during titrations of these Lewis acids, consistent with a modest binding interaction where the coordination complex and the pair of molecules exist in equilibrium. Because of this weak interaction, we know a complex is forming but cannot determine if more than one carbonyl is interacting with In(III).
Figure 23.

Summary of Lewis acid-carbonyl solution interactions. aBetween 0 and 0.5 equiv carbonyl added. bBetween 0 and 1 equiv carbonyl added. cHighly ligated AlCl3 complexes not observed with 2 and 4.
We also observe a series of 1:1 coordination complexes with high affinity interactions. GaCl3 (15–18), FeCl3 (31–34), and AlCl3 (35–38) all form tightly bound complexes with no observable unbound carbonyl present from 0 to 1 equiv added carbonyl. However, the addition of superstoichiometric carbonyl relative to the Lewis acid yields disparate behavior. Ga-based complexes 15, 16, 17, and 18 along with Al-based complexes 36 and 38 remain unchanged at higher equivalents of added carbonyl. Alternatively, Fe-based complexes 31, 32, 33, and 34 as well as Al-based complexes 35 and 37 are converted to more highly ligated complexes at higher equivalents of added carbonyl. Our IR and conductance data are consistent with AlCl3 and 1, yielding a neutral complex like 43, when 1 is present in excess. When these two methods of observations are applied to the FeCl3 systems, the data are consistent with in situ formation of structures like 39, 40, 41, and 42. We have corroborated ionic complex 41 by X-ray crystallography.16 When AlCl3 is combined with 3 beyond 1 equiv, this interaction yields results consistent with formation of ionic complex 44. The observed stoichiometry (3 carbonyl per 1 complex consumed) appears to be consistent with formation of a chloride anion for all five of these ionic complexes, but 44 appears to transition to an AlCl4− counterion at higher loadings of 3.
The last category we observe are the dimeric complexes, consisting of carbonyls and TiCl4, SnCl4, and ZrCl4. TiCl4 (19 and 20) and SnCl4 (21 and 22) appear to proceed directly to 2:1 complexes beginning at the onset of the titration. Alternatively, ZrCl4 appears to yield 1:1 complexes when ZrCl4 is present in excess (23–26). The system then proceeds to form 2:1 complexes when an equivalent amount of carbonyl is present (27–30).
CONCLUSION
The solution interactions of Lewis acids and simple carbonyl-containing compounds were investigated on the basis of spectroscopic and colligative experiments. Through the examination of concentration effects on the IR spectrum and solution conductivity, we were able to propose plausible ground state structures for these systems. Further, these data have given us insight into the wide range of reactivity observed for these Lewis acids in carbonyl-based reactions. We have examined Lewis acids that (1) display no significant interaction in solution (ZnCl2, CeCl3, I2, and AgOTf), (2) display interactions consistent with classical Lewis pair behavior (BCl3, BF3·OEt2, InCl3, and GaCl3), (3) display interactions consistent with formation of 2:1 carbonyl/Lewis acid complexes (TiCl4 and SnCl4), and (4) display concentration-dependent interactions, beginning with Lewis pairs and transitioning to more highly ligated metals (ZrCl4, FeCl3, and AlCl3). Awareness of these divergences in coordination behavior is not only important for catalyst design and reaction development but also for computational analysis of reaction intermediates and transition states. We recently reported byproduct inhibition for Fe(III)-catalyzed carbonyl-olefin metathesis that results from this solution behavior.16 Similarly, Schindler and co-workers used their observations of the solution behavior of FeCl312e to design a new catalyst system.37 We are currently using the information yielded from these observations to develop alternative protocols for substrates recalcitrant to current carbonyl-olefin metathesis methods. Because of the generality of these observations across the examined Lewis acids, we are exploring the impact of highly ligated metal centers on other carbonyl-based, Lewis acid-catalyzed reactions.
EXPERIMENTAL SECTION
General Information.
All moisture-sensitive reactions were performed under an atmosphere of argon in flame-dried round-bottom flasks or glass vials fitted with rubber septa. Stainless steel syringes were used to transfer air or moisture-sensitive liquids. All chemicals were purchased from Alfa Aesar, VWR, Matheson Coleman and Bell, Beantown Chemicals, or Acros. All ketones were dried over 3 Å molecular sieves and purified via distillation. Acetone was dried over K2CO3. DCE was dried and stored over 3 Å Molecular sieves. Infrared (IR) spectra were obtained using a Mettler Toledo ReactIR 15. IR data are represented as frequency of absorption (cm−1). Conductivity measurements were obtained using a VWR Portable Conductivity Meter. Conductivity data are represented as Microsie-mens per centimeter (μS cm−1).
General Procedure for IR Titrations.
Lewis acid (2.00 mmol) was added to a flame-dried 25 mL 2-neck round-bottom flask under inert atmosphere with a stir bar. The flask was sealed with septa, taken out of the glovebox, and an Ar balloon was inserted. The flask was placed in a water bath in a jacketed beaker connected to an electric circulator set to 30 °C. Anhydrous DCE was added (12 mL, 167.3 mM). The solution was stirred for 15 min to reach temperature. Carbonyl was added in 10 μL increments to the second equivalence point of carbonyl, then 20 μL increments were added until the fourth equivalence point was reached. Complexation was analyzed via real time infrared spectroscopy, using a Mettler Toledo ReactIR 15.
General Procedure for Conductivity Titrations.
VWR Portable Conductance Meter was calibrated with standard solutions of KCl (0.01 M and 0.5 mM) of known conductivity (1411 μS cm−1 and 74 μS cm−1, respectively). Then the probe was rinsed with water and finally with DCE several times before taking measurements. Before each experiment, the conductance meter was recalibrated with the standard solutions. In a glovebox, Lewis acid (2 mmol) was added to a flame-dried 20 mL scintillation vial charged with a stir bar. Anhydrous DCE was added (12 mL, 166 mM). The conductivity of the mixture was observed via a VWR Portable Conductance Meter. Carbonyl was incrementally titrated (0, 0.25, 0.5, 0.75, 1, 1.5, 2, 3, and 4 equiv) until at least 4 equiv of carbonyl were reached. Conductance after each addition of carbonyl was observed and recorded as an average of three measurements. Between each reading, the probe was rinsed with DCE.
Supplementary Material
ACKNOWLEDGMENTS
We thank Loyola University Chicago, Merck & Co., Inc., and the NIH/National Institute of General Medical Sciences (GM128126) for financial support. We are very grateful to Prof. Wei-Tsung Lee, Ms. Adriana Lugosan, Mrs. Loretta Devery, and Mr. James Devery for helpful discussions and suggestions.
Footnotes
Supporting Information
The Supporting Information is available free of charge at https://pubs.acs.org/doi/10.1021/acs.joc.9b02822.
IR titrations, component analysis, conductance analysis, and 27Al NMR spectra (PDF)
The authors declare no competing financial interest.
REFERENCES
- (1).Lewis GN Valence and the Structure of Atoms and Molecules; New York, The Chemical Catalog Company, Inc.: New York, 1923. [Google Scholar]
- (2).((a)) Lewis Acids in Organic Synthesis; Yamamoto H, Ed.; Wiley-VCH: Weinheim, 2000. [Google Scholar]; ((b) )Santelli M; Pons J-M Lewis Acids and Selectivity in Organic Synthesis; New Directions in Organic and Biological Chemistry; CRC Press: Boca Raton, 1996. [Google Scholar]; ((c) )NATO ASI Series, Ser. C: Mathematical and Physical Sciences: Selectivities in Lewis Acid Promoted Reactions. Schinzer D Series, Ed.; Kluwer, 1989; Vol. 289. [Google Scholar]; (d) Satchell DPN; Satchell RS Quantitative Aspects of the Lewis Acidity of Covalent Metal Halides and Their Organo Derivatives. Chem. Rev 1969, 69, 251–278. [Google Scholar]; (e) Trost BM; Jiang C Catalytic Enantioselective Construction of All-Carbon Quaternary Stereocenters. Synthesis 2006, 369–396. [Google Scholar]
- (3).Fochi M; Caruana L; Bernardi L Catalytic Asymmetric Aza-Diels–Alder Reactions: The Povarov Cycloaddition Reaction. Synthesis 2014, 46, 135–157. [Google Scholar]
- (4).(a) Mukaiyama T; Narasaka K; Banno K New Aldol Type Reaction. Chem. Lett 1973, 2, 1011–1014. [Google Scholar]; (b) Matsuo J; Murakami M The Mukaiyama Aldol Reaction: 40 Years of Continuous Development. Angew. Chem., Int. Ed 2013, 52, 9109–9118. [DOI] [PubMed] [Google Scholar]; (c) Gati W; Yamamoto H Second Generation of Aldol Reaction. Acc. Chem. Res 2016, 49, 1757–1768. [DOI] [PubMed] [Google Scholar]
- (5).(a) Hoffmann HMR The Ene Reaction. Angew. Chem., Int. Ed. Engl 1969, 8, 556–577. [Google Scholar]; (b) Carlos Dias L Chiral Lewis Acid Catalyzed Ene-Reactions. Curr. Org. Chem 2000, 4, 305–342. [Google Scholar]
- (6).(a) Brimioulle R; Lenhart D; Maturi MM; Bach T Enantioselective Catalysis of Photochemical Reactions. Angew. Chem., Int. Ed 2015, 54, 3872–3890. [DOI] [PubMed] [Google Scholar]; (b) Skubi KL; Blum TR; Yoon TP Dual Catalysis Strategies in Photochemical Synthesis. Chem. Rev 2016, 116, 10035–10074. [DOI] [PMC free article] [PubMed] [Google Scholar]
- (7).(a) Becker MR; Watson RB; Schindler CS Beyond Olefins: New Metathesis Directions for Synthesis. Chem. Soc. Rev 2018, 47, 7867–7881. [DOI] [PMC free article] [PubMed] [Google Scholar]; (b) Riehl PS; Schindler CS Lewis Acid-Catalyzed Carbonyl–Olefin Metathesis. Trends Chem. 2019, 1, 272–273. [DOI] [PMC free article] [PubMed] [Google Scholar]
- (8).(a) Mohammad A; Satchell DPN; Satchell RS Quantitative Aspects of Lewis Acidity. Part VIII. The Validity of Infrared Carbonyl Shifts as Measures of Lewis Acid Strength. The Interaction of Lewis Acids and Phenalen-1-One(Perinaphthenone). J. Chem. Soc. B 1967, 723–725. [Google Scholar]; (b) Satchell DPN; Satchell RS Quantitative Aspects of Lewis Acidity. Q. Rev., Chem. Soc 1971, 25, 171–199. [Google Scholar]; (c) Driessen WL; Groeneveld WL Complexes with Ligands Containing the Carbonyl Group. Part I: Complexes with Acetone of Some Divalent Metals Containing Tetrachloro-Ferrate-(III) and -Indate(III) Anions. Recl. Trav. Chim. Pays-Bas 1969, 88, 977–988. [Google Scholar]; (d) Driessen WL; Groeneveld WL Complexes with Ligands Containing the Carbonyl Group. Part III: Metal (II) Acetaldehyde, Propionaldehyde and Benzaldehyde Solvates. Recl. Trav. Chim. Pays-Bas 1971, 90, 87–96. [Google Scholar]; (e) Driessen WL; Groeneveld WL Complexes with Ligands Containing the Carbonyl Group. Part IV Metal(II) Butanone, Acetophenone, and Chloroace-tone Solvates. Recl. Trav. Chim. Pays-Bas 1971, 90, 258–264. [Google Scholar]
- (9).(a) Shambayati S; Crowe WE; Schreiber SL On the Conformation and Structure of Organometal Complexes in the Solid State: Two Studies Relevant to Chemical Synthesis. Angew. Chem., Int. Ed. Engl 1990, 29, 256–272. [Google Scholar]; (b) Denmark SE; Henke BR; Weber E SnCl4(4-Tert-BuC6H4CHO)2. X-Ray Crystal Structure, Solution NMR, and Implications for Reactions at Complexed Carbonyls. J. Am. Chem. Soc 1987, 109, 2512–2514. [Google Scholar]
- (10).(a) Childs RF; Mulholland DL; Nixon A The Lewis Acid Complexes of α,β-Unsaturated Carbonyl and Nitrile Compounds. A Nuclear Magnetic Resonance Study. Can. J. Chem 1982, 60, 801–808. [Google Scholar]; (b) Jensen WB The Lewis Acid-Base Definitions: A Status Report. Chem. Rev 1978, 78, 1–22. [Google Scholar]; ((c) )Jennings JJ; Wigman BW; Armstrong BM; Franz AK NMR Quantification of the Effects of Ligands and Counterions on Lewis Acid Catalysis. J. Org. Chem 2019, DOI: 10.1021/acs.joc.9b02107. [DOI] [PubMed] [Google Scholar]
- (11).Ludwig JR; Zimmerman PM; Gianino JB; Schindler CS Iron(III)-Catalysed Carbonyl–Olefin Metathesis. Nature 2016, 533, 374–379. [DOI] [PubMed] [Google Scholar]
- (12).(a) Ma L; Li W; Xi H; Bai X; Ma E; Yan X; Li Z FeCl3-Catalyzed Ring-Closing Carbonyl-Olefin Metathesis. Angew. Chem., Int. Ed 2016, 55, 10410–10413. [DOI] [PubMed] [Google Scholar]; (b) McAtee CC; Riehl PS; Schindler CS Polycyclic Aromatic Hydrocarbons via Iron(III)-Catalyzed Carbonyl–Olefin Metathesis. J. Am. Chem. Soc 2017, 139, 2960–2963. [DOI] [PMC free article] [PubMed] [Google Scholar]; (c) Groso EJ; Golonka AN; Harding RA; Alexander BW; Sodano TM; Schindler CS 3-Aryl-2,5-Dihydropyrroles via Catalytic Carbonyl-Olefin Metathesis. ACS Catal. 2018, 8, 2006–2011. [DOI] [PMC free article] [PubMed] [Google Scholar]; (d) Ludwig JR; Watson RB; Nasrallah DJ; Gianino JB; Zimmerman PM; Wiscons RA; Schindler CS Interrupted Carbonyl-Olefin Metathesis via Oxygen Atom Transfer. Science 2018, 361, 1363–1369. [DOI] [PMC free article] [PubMed] [Google Scholar]; (e) Albright H; Riehl PS; McAtee CC; Reid JP; Ludwig JR; Karp LA; Zimmerman PM; Sigman MS; Schindler CS Catalytic Carbonyl-Olefin Metathesis of Aliphatic Ketones: Iron(III) Homo-Dimers as Lewis Acidic Superelectrophiles. J. Am. Chem. Soc 2019, 141, 1690–1700. [DOI] [PMC free article] [PubMed] [Google Scholar]; (f) Riehl PS; Nasrallah DJ; Schindler CS Catalytic, Transannular Carbonyl-Olefin Metathesis Reactions. Chem. Sci 2019, 10, 10267. [DOI] [PMC free article] [PubMed] [Google Scholar]
- (13).(a) Albright H; Vonesh HL; Becker MR; Alexander BW; Ludwig JR; Wiscons RA; Schindler CS GaCl3-Catalyzed Ring-Opening Carbonyl–Olefin Metathesis. Org. Lett 2018, 20, 4954–4958. [DOI] [PMC free article] [PubMed] [Google Scholar]; (b) Djurovic A; Vayer M; Li Z; Guillot R; Baltaze J-P; Gandon V; Bour C Synthesis of Medium-Sized Carbocycles by Gallium-Catalyzed Tandem Carbonyl–Olefin Metathesis/Transfer Hydrogenation. Org. Lett 2019, 21, 8132–8137. [DOI] [PubMed] [Google Scholar]
- (14).Rivero-Crespo MÁ; Tejeda-Serrano M; Pérez-Sánchez H; Cerón-Carrasco JP; Leyva-Pérez A Intermolecular Carbonyl-Olefin Metathesis with Vinyl Ethers Catalyzed by Homogeneous and Solid Acids in Flow. Angew. Chem., Int. Ed 2019, DOI: 10.1002/anie.201909597. [DOI] [PubMed] [Google Scholar]
- (15).Tran UPN; Oss G; Breugst M; Detmar E; Pace DP; Liyanto K; Nguyen TV Carbonyl–Olefin Metathesis Catalyzed by Molecular Iodine. ACS Catal. 2019, 9, 912–919. [Google Scholar]
- (16).Hanson CS; Psaltakis MC; Cortes JJ; Devery JJ III Catalyst Behavior in Metal-Catalyzed Carbonyl-Olefin Metathesis. J. Am. Chem. Soc 2019, 141, 11870–11880. [DOI] [PMC free article] [PubMed] [Google Scholar]
- (17).Hanson CS; Devery JJ III Characterizing Lewis Pairs Using Titration Coupled with In Situ Infrared Spectroscopy J. Vis. Exp 2019, DOI: 10.3791/60745. [DOI] [PMC free article] [PubMed] [Google Scholar]
- (18).BCl3 is commercially available as a 1 M solution in DCM and was diluted to titration concentration (0.167 M) in DCE.
- (19). See Supporting Information for more details.
- (20). The IR spectrum of BCl3 features strong signals at 1428 and 1450 cm−1 that are present regardless of amount of carbonyl added, making observation of subtle features difficult. This part of the spectrum has been omitted for clarity and can be found in the Supporting Information.
- (21).Lappert MF 103. Co-Ordination Compounds Having Carboxylic Esters as Ligands. Part II. Relative Acceptor Strengths of Some Group III and IV Halides. J. Chem. Soc 1962, 542–548. [Google Scholar]
- (22).Chalandon P; Susz BP Etude de Composésd’ addition Des Acides de Lewis. VI Spectred’absorptionInfrarouge de l’acétone-Trifluorure de Bore; Spectred’absorption Infrarouge et Moment de Dipǒle Du Di-Propyl-Cétone-Trifluorure de Bore. Helv. Chim. Acta 1958, 41, 697–704. [Google Scholar]
- (23).Seshadri TR; Rao NVS; Subrahmanyam B Effect of Conjugation and Complex Formation on the Raman and I.R. Frequencies of the Carbonyl Group. Proc. - Indian Acad. Sci., Sect. A 1968, 68, 314–323. [Google Scholar]
- (24).(a) Susz BP; Chalandon P Etude de Composésd’Addition Des Acides de Lewis. IX. - Spectresd’AbsorptionInfrarougeDesComposésFormésPar La Benzophénone et l’Acétophénone Avec BF3, FeCl3, ZnCl2 et AlCl3 et Nature de La Liaison Oxygene-Métal. Helv. Chim. Acta 1958, 41, 1332–1341. [Google Scholar]; (b) Chalandon P; Susz BP Etude de Composésd’addition Des Acides de Lewis. VI Spectred’absorptionInfrarouge de l’acétone-Trifluorure de Bore; Spectred’absorption Infrarouge et Moment de Dipǒle Du Di-Propyl-Cétone-Trifluorure de Bore. Helv. Chim. Acta 1958, 41, 697–704. [Google Scholar]; (c) Gillespie RJ; Hartman JS Nuclear Magnetic Resonance Studies of Ketone.BF3 Complexes. II. The Boron Trifluoride Catalyzed Condensation of Acetone. Can. J. Chem 1968, 46, 3799–3811. [Google Scholar]
- (25).(a) Ranu BC Indium Metal and Its Halides in Organic Synthesis. Eur. J. Org. Chem 2000, 2000, 2347–2356. [Google Scholar]; (b) Augé J; Lubin-Germain N; Uziel J Recent Advances in Indium-Promoted Organic Reactions. Synthesis 2007, 2007, 1739–1764. [Google Scholar]
- (26).(a) Amemiya R; Yamaguchi M GaCl3 in Organic Synthesis. Eur. J. Org. Chem 2005, 2005, 5145–5150. [Google Scholar]; (b) Gupta MK; O’Sullivan TP Recent Applications of Gallium and Gallium Halides as Reagents in Organic Synthesis. RSC Adv. 2013, 3, 25498. [Google Scholar]
- (27).(a) Susz BP; Lachavanne A Etude de Composésd’addition Des Acides de Lewis. V. Absorption Infrarouge de Composésd’addition Formés Par Le Chlorure de Titane Avec La Benzophénone et l’acetophé none. Helv. Chim. Acta 1958, 41, 634–636. [Google Scholar]; (b) Cassimatis D; Susz BP Etude Des Composésd’addition Des Acides de LEWIS. XI. Spectred’absorption Infrarouge Du Composéd’addition CH3COCH3, TiCl4. Helv. Chim. Acta 1960, 43, 852–862. [Google Scholar]
- (28).Weber R; Susz BP Etude Des Composésd’addition Des Acides de Lewis XXX [1]. Note Préliminaire Sur Les Composésd’addition Entre Aldéhydes et TiCl4. Helv. Chim. Acta 1967, 50, 2226–2232. [Google Scholar]
- (29).Filippini F; Susz B-P Etude de Composésd’Additiond’acides de Lewis -XXXII [1]. Composésd’additiond’aldéhydesAliphatiques et Aromatiques et de Diverses Cétones. Helv. Chim. Acta 1971, 54, 835–845. [Google Scholar]
- (30).Denmark SE; Almstead NG Spectroscopic Studies on the Structure and Conformation of Lewis Acid-Aldehyde Complexes. J. Am. Chem. Soc 1993, 115, 3133–3139. [Google Scholar]
- (31).(a) Morandi B; Carreira EM Synthesis of Trifluoroethyl-Substituted Ketones from Aldehydes and Cyclohexanones. Angew. Chem., Int. Ed 2011, 50, 9085–9088. [DOI] [PubMed] [Google Scholar]; (b) Lundberg H; Tinnis F; Zhang J; Algarra AG; Himo F; Adolfsson H Mechanistic Elucidation of Zirconium-Catalyzed Direct Amidation. J. Am. Chem. Soc 2017, 139, 2286–2295. [DOI] [PubMed] [Google Scholar]
- (32).Bolm C; Legros J; Le Paih J; Zani L Iron-Catalyzed Reactions in Organic Synthesis. Chem. Rev 2004, 104, 6217–6254. [DOI] [PubMed] [Google Scholar]
- (33).Susz BP; Cooke I Etude Du SpectreInfrarouge de Complexes Formés Par Les Halogenuresd’ aluminium. I. Complexes de l’acétophénone et de La Benzophénone; Comparaison Avec Les Spectres de Divers ComposséOrganiques Présentant La Liaison Aluminium-Oxygène. Helv. Chim. Acta 1954, 37, 1273–1280. [Google Scholar]
- (34).Evans DA; Chapman KT; Bisaha J Asymmetric Diels-Alder Cycloaddition Reactions with Chiral Alpha, Beta.-Unsaturated N-Acyloxazolidinones. J. Am. Chem. Soc 1988, 110, 1238–1256. [Google Scholar]
- (35).Castellino S; Dwight WJ Diethylaluminum Chloride Complexes of an N-Acyloxazolidinone: NMR Investigation. J. Am. Chem. Soc 1993, 115, 2986–2987. [Google Scholar]
- (36).Lam Y; Cheong PH-Y; Blasco Mata JM; Stanway SJ; Gouverneur V; Houk KN Diels-Alder Exo Selectivity in Terminal-Substituted Dienes and Dienophiles: Experimental Discoveries and Computational Explanations. J. Am. Chem. Soc 2009, 131, 1947–1957. [DOI] [PMC free article] [PubMed] [Google Scholar]
- (37).Watson R; Davis AJ; Gomez-Lopez JL; Nasrallah D; Schindler C Superelectrophilic Aluminum(III)-Ion Pairs Promote a Distinct Reaction Path for Carbonyl-Olefin Metathesis of Medium-Sized Rings. ChemRxiv 2019, 10.26434/chemrxiv.9911783.v1. [DOI] [Google Scholar]
Associated Data
This section collects any data citations, data availability statements, or supplementary materials included in this article.