Abstract
Electrical impedance tomography (EIT) is used for bedside ventilation monitoring; cardiac related impedance changes represent a source of noise superimposed on the ventilation signal, commonly removed by low-pass filtering (LPF). We investigated if an alternative approach, based on an event-triggered averaging (ETA) process, is more effective at preserving the actual ventilation waveform. Ten paralyzed patients undergoing volume-controlled ventilation were studied; 30 breaths for each patient were identified to compare LPF and ETA. For ETA the identified breaths were temporally aligned on the beginning of inspiration; the values of the thirty curves at each time point were averaged. The analysis was conducted on the global EIT signal and on four ventral-to-dorsal regions of interest. Global tidal variations by ETA resulted higher than LPF (average difference 139 ± 88 arbitrary units, p = 0.004). Both for global and regional waveforms, minimum and maximum EIT slopes were steeper by ETA as compared to LPF (average difference respectively − 57 ± 60 mL/s and 144 ± 96 mL/s for global signal, p < 0.05); ventilator inspiratory peak airflow correlated with maximum slope measured by ETA (r = 0.902, p < 0.001), but not LPF (p = 0.319). Beginning of inspiration identified on the ventilator waveform and on the global EIT signal by ETA occurred simultaneously, (+ 0.04 ± 0.07 s, p = 0.081), while occurred earlier by LPF (− 0.26 ± 0.1 s, p < 0.001). Removal of cardiac related impedance changes by ETA results in a ventilation signal more similar to the waveforms recorded by the ventilator, particularly regarding the slope of impedance changes and time at the minimum values as compared to LPF.
Electronic supplementary material
The online version of this article (10.1007/s10877-019-00348-2) contains supplementary material, which is available to authorized users.
Keywords: Electrical impedance tomography, Cardiac related impedance changes removal, EIT filtering, Event-triggered average, Low-pass filter
Background
Electrical impedance tomography (EIT) is a noninvasive, bedside, radiation-free monitoring technique, which is gaining increased diffusion in the intensive care units, since it provides useful information regarding respiratory function of the ventilated patient (e.g. distribution of ventilation, modifications of end-expiratory lung volumes while changing ventilator settings) [1]. EIT waveform variations are mainly due to the movement of gas in and out of the lungs; however, since the recording belt is positioned at the mid-thorax level, impedance changes of one-order-magnitude smaller than the ventilation signal due to the movement of blood within the thorax are also recorded, commonly defined as cardiac related impedance changes [2]. Therefore, cardiac related impedance changes must be removed to study the EIT ventilation signal; a common method to achieve this goal is the application of a low-pass filter with a frequency set between the respiratory rate and the heart rate, which are usually well distinct [3]. The application of such a filter generates some modifications of the raw signal, introducing attenuations and possibly modifying clinically relevant data.
Hence, we reasoned that a different approach, based on an event-triggered waveform averaging process, could remove cardiac related impedance changes while better preserving the shape of the ventilation signal. Event-triggered averaging consists in the point by point averaging of waveforms, synchronized on a common trigger event; this approach has already been used for airflow waveforms averaging in the literature [4, 5]. Since heart and respiratory rates are out of phase, the waveform resulting after event-triggered (event being the beginning of inspiration) averaging should return the ventilation waveform. We hypothesized that average waveform characteristics after the application of a low-pass filter (i.e. amplitude, minimum and maximum values, minimum to maximum time) differ from the characteristics of the event-triggered averaged waveform and that the latter could return values closer to the waveforms recorded from the ventilator.
Methods
Patients’ recordings
We analyzed EIT traces from 10 patients enrolled in a previously published study conducted on critically ill patients undergoing volume-controlled ventilation and muscle paralysis [6]. Patients were ventilated with different PEEP levels, starting from the ARDS-Net suggested level; the aim of the study was the identification of the best PEEP level through EIT parameters (PulmoVista 500, Dräger Medical GmbH, Lübeck, Germany). The mechanical ventilator of each patient was connected to the EIT device for continuous recording of airway pressure, flow and volume data. Local ethical committee approved the original study.
Data analysis
Four ventral-to dorsal regions of interest of the same height were identified on the tomographic image (Draeger EIT Data Analysis tool 6.0); waveforms of the global EIT signal and of the four ROIs were imported into Labchart 7 (ADInstruments, Colorado Springs, CO, USA). The ventilator waveforms, synchronized with the EIT signal were imported as well. A set of 30 representative inspiratory breaths at the ARDS-Net PEEP level was identified. Two methods were applied for removing cardiac related impedance changes.
Low-pass method
A low-pass filter with 0.67 Hz (40/min) was applied. For each of the 30 selected breaths we collected a set of variables (see below) and the values were averaged for comparison with the alternative filtering method.
Event-triggered average method
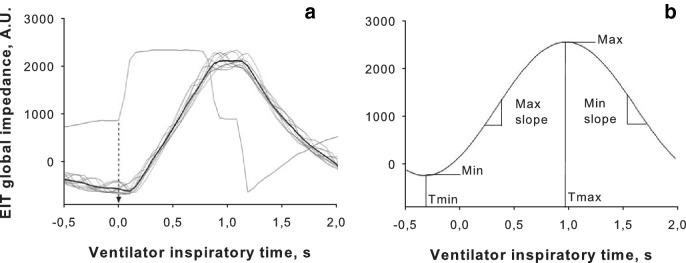
The beginning of inspiration (transition from negative to positive value of the airflow signal) was considered as the trigger event for each of the 30 identified breaths, which were temporally aligned using this marker. The values of the thirty curves at each time point were averaged (Scope view of the Labchart software, comment mode setting) leading to an averaged EIT waveform of the global signal (Fig. 1a and Online Resource 1) and of the 4 ROIs. Based on the averaged waveforms, we recorded the values described below.
Fig. 1.
a Example of event-triggered averaging of EIT global impedance waveforms. Positive airflow at the ventilator was identified as the trigger event (dashed arrow) for all the selected breaths (light black lines); the resulting averaged waveform is depicted as a thick black line. b Exemplary low-pass waveform where the study variables were identified: EIT Minimum and Maximum values (Min, Max); time of minimum and maximum (Tmin, Tmax); minimum and maximum slope (Min and Max slope)
To compare the low-pass filter and the triggered average methods, we recorded the following parameters both for the global EIT signal (Fig. 1b) as well as for the four ROI waveforms:
minimum and maximum value, expressed in EIT arbitrary units (A.U.)
minimum and maximum slope over a 50 ms time-frame, which mirror expiratory and inspiratory flow, respectively expressed in mL/s
time at minimum (Tmin) and maximum values (Tmax) as the temporal distance in seconds from the point of positive airflow as recorded by the ventilator, considered as reference for beginning of inspiration
global tidal variation, defined as maximum-minimum global EIT values, expressed in mL
EIT inspiratory time, defined as the difference between maximum and minimum global times (Tmaxglobal − Tminglobal)
The end of inspiration was defined at the point of negative airflow as recorded by the ventilator. To convert EIT impedance differences (ΔZ, expressed in arbitrary units, A.U.) in mL, for each patients two ΔZ/mL conversion factors were identified (EIT global tidal variation divided by the ventilator set tidal volume): one from low-pass filtered waveforms and another one from event-triggered averaged waveforms. These two conversion factors were used to express the respective EIT variations in mL.
Statistics
Differences in the recorded variables between the two filtering methods were analyzed by paired-samples t test. Difference between Tmin and ventilator beginning of inspiration were analyzed by a one-sample T test (under null hypothesis Tmin = 0 s). Correlation coefficients were expressed as Pearson’s r. A p < 0.05 was considered as significant. Artworks were realized by Sigmaplot 11.0 (Systat Software, San Jose, CA); statistics were performed by SPSS software version 17.0 (Chicago, IL).
Results
Minimum values measured with the event-triggered average method were higher than the low-pass method, both for the global EIT signal (average difference 73 ± 62 A.U., p = 0.005) and the 4 ROI waveforms (all p ≤ 0.028); maximum values were similarly higher (average difference for global signal 212 ± 143 A.U., all p ≤ 0.01, Figs. S1 and S2 of Online Resource 2). Correspondingly, global tidal variations were higher when measured by event-triggered averaging, both for the global EIT signal (139 ± 88 A.U., p = 0.004, corresponding approximately to 30 mL) and the 4 ROI waveforms (all p ≤ 0.005, Fig. S3 of Online Resource 2). ΔZ/mL conversion factors were higher by event-triggered averaging as compared to low-pass filtering (average difference 0.56 ± 0.27 A.U./mL, p < 0.001).
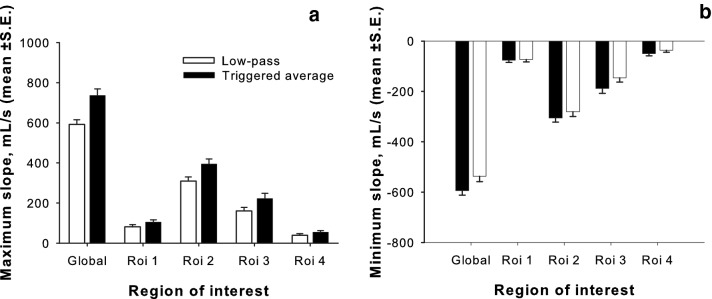
Maximum slope was higher when measured by event-triggered averaging, both for the global EIT signal (average difference 144 ± 96 mL/s, p = 0.001) and the 4 ROI waveforms (all p ≤ 0.005, Fig. 2a); likewise, minimum slopes were lower (average difference for global EIT signal − 57 ± 60 mL/s, all p ≤ 0.035 except ROI1, p = 0.561, Fig. 2b). Ventilator peak inspiratory airflow tightly correlated with maximum slope measured by event-triggered averaging (p < 0.001, r = 0.902), but not by low-pass filtering (p = 0.319, Fig. 3). Ventilator peak expiratory airflow moderately correlated with minimum slope measured by event-triggered averaging (p = 0.043, r = 0.646), but not low-pass filtering.
Fig. 2.
a Maximum slope (expressed in mL/s) of the global EIT signal and the 4 ROIs event-triggered averaging resulted higher than low-pass filtering (all p < 0.05). b Minimum slope (expressed in mL/s) of the global EIT signal and the 4 ROIs event-triggered averaging resulted lower than low-pass filtering (all p < 0.05 except ROI1)
Fig. 3.
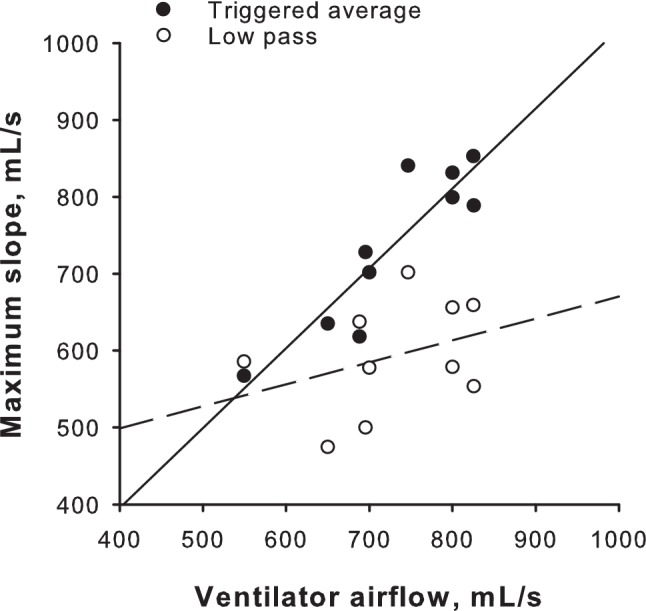
Ventilator inspiratory flow and maximum slope (expressed in mL/s) of the global EIT signal measured by event-triggered averaging were closely related (p = 0.004, r = 0.821), while no significant correlation was present with maximum slope measured by low-pass filtering
Tmin values were markedly different between the two methods, both for the global EIT signal (average difference 0.3 ± 0.09 s, p < 0.001) and the 4 ROI waveforms (all p ≤ 0.003, Fig. 4). While the event-triggered average method tended to be associated with Tmin occurring slightly later than the ventilator insufflation (+ 0.04 ± 0.07 s for the global EIT signal, p = 0.081), the low-pass filtering Tmin occurred earlier both in the global EIT signal (− 0.26 ± 0.1 s, p < 0.001) and the 4 ROIs. Tmax values did not differ between the two methods, except for ROI 3 (difference 0.07 ± 0.07 s, p = 0.012). EIT inspiratory time by event-triggered averaging was lower than low-pass filtering both for the global EIT signal (− 0.34 ± 0.14 s p < 0.001) and the 4 ROIs (all p ≤ 0.001). Ventilator inspiratory time closely correlated with EIT inspiratory time measured by event-triggered averaging (p < 0.001, r = 0.905), but not low-pass filtering (p = 0.08, Fig. 5).
Fig. 4.
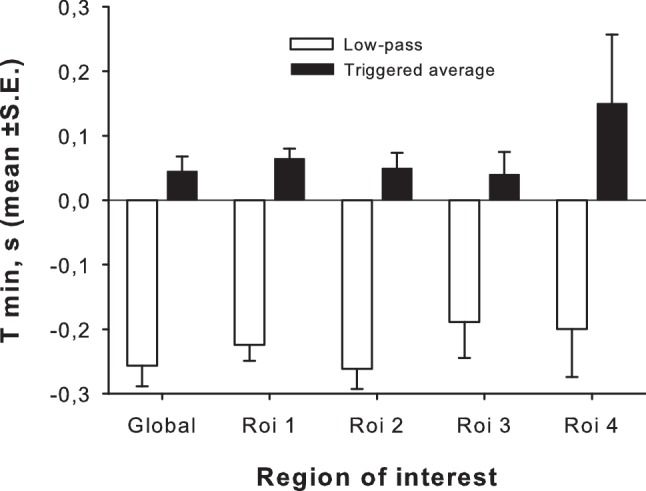
Time of the minimum values (Tmin) of the global EIT signal and the 4 ROIs event measured by low-pass filtering occurred earlier than event-triggered averaging and earlier than ventilator beginning of inspiration (zero reference line, all p < 0.05). Tmin by event-triggered averaging did not differ from ventilator beginning of inspiration
Fig. 5.
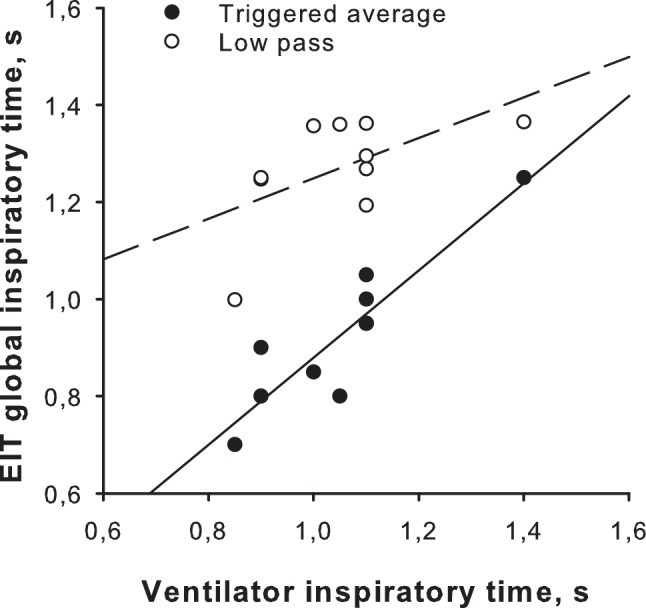
Ventilator inspiratory time showed a tight correlation with EIT inspiratory time of the global EIT signal measured by event-triggered averaging (p < 0.001, r = 0.905), while no significant correlation was present with EIT inspiratory time measured by low-pass filtering
Discussion
We compared event-triggered waveform averaging, applied to EIT waveforms for cardiac related impedance changes, with the standard method based on the application of a low-pass filter. We show that the two methods lead to significantly different results for minimum and maximum values, rate of volume change (i.e. flow) and Tmin values. Inspiratory time and inspiratory peak airflow at the ventilator were similar to the event-triggered average signals, but not to the low-pass filtered waveforms.
Removal of cardiac related impedance changes is required to analyze EIT waveforms, particularly when extracting data from ROIs. The classical method is the application of a low-pass filter, to preserve the respiratory signal and remove pulse noise. Application of a filter necessarily introduces distortions of the waveforms, possibly smoothing the original signal. Our hypothesis was that averaging the breaths on a common trigger event would remove cardiac artifacts while better preserving the ventilation signal as compared to standard filtering; we reasoned that the advantage of the event-triggered averaging process would be particularly relevant around the “sharp” changes of the signal, such as the beginning of inspiration, when low-pass filter tends to “smooth” the waveform. The event-trigger averaged processing led to a greater tidal amplitude variation than the filtering technique. This finding might not represent a relevant issue, because EIT variations (ΔZ) are expressed in arbitrary units and therefore the absolute values are poorly informative; moreover, a fixed ΔZ/ml unit conversion for all the patients does not exist, but every patient (and probably every EIT examination) exhibits a specific conversion factor. On the contrary, modifications of Tmin due to filtering might represent a relevant finding, since some EIT-derived variables reported in the literature, such as the regional ventilation delay, require an accurate calculation of this specific time point [7]. We showed that the event-triggered average method identifies Tmin much closer to the ventilator as compared to the standard low-pass filtering, reducing the error due to cardiac related impedance changes removal. Lung insufflation as detected on the low-pass filtering waveform begins 0.26 s before ventilator airflow; since the studied patients were paralyzed (i.e. no inspiratory activity was present), such a time-lag is not explained by physiology and is reasonably due to the low-pass filter which reduced amplitude, anticipated Tmin and lowered inspiratory slope. The use of event-trigger averaging appears therefore superior, if not mandatory, for detection of lung physiological processes which are lost with low-pass filtering such as the aforementioned regional ventilation delay.
Our findings were obtained in sedated and paralyzed patients, but the signal modifications introduced by low-pass filter are going to be present in actively breathing patients as well. An accurate measure of Tmin might be of interest during assisted ventilation (e.g. during the weaning phase) to detect regional phase-shifts due to uncoordinated respiratory muscles activation, possibly leading to ventilation inefficiency. Since assisted ventilation is characterized by higher variability than controlled ventilation, the event-trigger averaging process may be used to obtain a representative waveform of a given ventilation setting, overcoming the issue of variability. However, the precision of event-trigger averaged waveforms might tend to reduce while distancing in time from the triggering event, due to breath-to-breath differences (e.g. variable inspiratory rate or inspiratory time). In an alternative analysis of our dataset, no significant changes in Tmin or Tmax occurred when using the end of inspiration (instead of the beginning) as a triggering event. To obtain the maximum precision, we suggest to choose a triggering event close in time to the phenomenon to be studied, particularly when respiratory variability is high.
As a further support of the better preservation of the signal when using the event-triggered average, we showed that this method allowed an accurate calculation of the volume change in time (i.e. peak inspiratory flow), while this was not the case for the low-pass filter. The calculation was more precise during inspiration than during expiration, possibly because of the different airflow waveform shape in the two respiratory phases: the study subjects were ventilated with constant inspiratory flow, while expiration was passive with a decelerated-shape waveform. Further studies are needed to elucidate if a decelerated waveform could be better analyzed focusing on the average flow value rather than the peak value as we did.
This study has some limitations. The number of subjects is relatively small: however, we considered such a sample size adequate to the scope a proof-of-concept study, taking advantage of the repeated measure study design. All our patients were passively ventilated and, hence, all breaths were very similar: in the presence of an irregular pattern due to spontaneous activity, the event based averaging method would return an “average” breath. We chose a common filter setting equal to 40/min (0.67 Hz), which normally separates well respiratory from cardiac signal being half-way between a high limit respiratory rate and a low limit heart rate, in a range that should fit most of the patients. It should be noted that the application of the low-pass filter at a frequency higher than 0.67 Hz could produce a lower smoothing of the EIT signal, at price of a less efficient noise removal, particularly in patients with relatively low heart and high respiratory rates. The event-triggered averaging does not require any a priori selection in regard to frequency cutoffs, and it is totally independent from the actual heart or respiratory rates.
Conclusions
The common method of removing cardiac related impedance changes from ventilation EIT waveforms based of the application of a low-pass filter introduces relevant modifications. A different approach based on an event-triggered averaged waveform is feasible and appears more similar to the ventilator, particularly regarding the beginning of inspiration and the slope of impedance changes. Future studies focusing on such parameters should take into consideration the event-triggered averaging approach.
Electronic supplementary material
Below is the link to the electronic supplementary material.
Supplementary material 1 Animation showing the progressive averaging process while increasing the number of considered breaths. Note the similarity between the triggered averaged waveform and the volume waveform obtained from the ventilator (GIF 144 kb)
Supplementary material 2 PDF file containing supplementary figures S1 S2 S3 (PDF 214 kb)
Funding
Funding was provided by Department funds, University of Milan-Bicocca.
Compliance with ethical standards
Conflict of interest
GB and GF received lecturing fees from Draeger Medical. The other authors declare that they have no conflict of interest.
Ethical approval
All procedures performed in studies involving human participants were in accordance with the ethical standards of the institutional and/or national research committee and with the 1964 Helsinki declaration and its later amendments or comparable ethical standards.
Informed consent
Informed consent was obtained from all individual participants included in the study, according to the local Institutional Ethical Committee recommendations.
Footnotes
Publisher's Note
Springer Nature remains neutral with regard to jurisdictional claims in published maps and institutional affiliations.
Contributor Information
Andrea Coppadoro, Email: andrea.coppadoro@gmail.com.
Nilde Eronia, Email: nilderonia@gmail.com.
Giuseppe Foti, Email: giuseppe.foti@unimib.it.
Giacomo Bellani, Email: giacomo.bellani1@unimib.it.
References
- 1.Bellani G, Mauri T, Pesenti A. Imaging in acute lung injury and acute respiratory distress syndrome. Curr Opin Crit Care. 2012;18(1):29–34. doi: 10.1097/MCC.0b013e32834eb47d. [DOI] [PubMed] [Google Scholar]
- 2.Geddes LA, Baker LE. The specific resistance of biological material—a compendium of data for the biomedical engineer and physiologist. Med Biol Eng. 1967;5(3):271–293. doi: 10.1007/BF02474537. [DOI] [PubMed] [Google Scholar]
- 3.Frerichs I, Amato MB, van Kaam AH, Tingay DG, Zhao Z, Grychtol B, Bodenstein M, Gagnon H, Bohm SH, Teschner E, Stenqvist O, Mauri T, Torsani V, Camporota L, Schibler A, Wolf GK, Gommers D, Leonhardt S, Adler A. Chest electrical impedance tomography examination, data analysis, terminology, clinical use and recommendations: consensus statement of the TRanslational EIT developmeNt stuDy group. Thorax. 2017;72(1):83–93. doi: 10.1136/thoraxjnl-2016-208357. [DOI] [PMC free article] [PubMed] [Google Scholar]
- 4.Vann NC, Pham FD, Hayes JA, Kottick A, Del Negro CA. Transient suppression of Dbx1 PreBotzinger interneurons disrupts breathing in adult mice. PLoS ONE. 2016;11(9):e0162418. doi: 10.1371/journal.pone.0162418. [DOI] [PMC free article] [PubMed] [Google Scholar]
- 5.Oyama Y, Iigaya K, Minoura Y, Okabe T, Izumizaki M, Onimaru H. An in vitro experimental model for analysis of central control of sympathetic nerve activity. J Physiol Sci. 2017;67(5):629–635. doi: 10.1007/s12576-017-0549-5. [DOI] [PMC free article] [PubMed] [Google Scholar]
- 6.Eronia N, Mauri T, Maffezzini E, Gatti S, Bronco A, Alban L, Binda F, Sasso T, Marenghi C, Grasselli G, Foti G, Pesenti A, Bellani G. Bedside selection of positive end-expiratory pressure by electrical impedance tomography in hypoxemic patients: a feasibility study. Ann Intensive Care. 2017;7(1):76. doi: 10.1186/s13613-017-0299-9. [DOI] [PMC free article] [PubMed] [Google Scholar]
- 7.Wrigge H, Zinserling J, Muders T, Varelmann D, Gunther U, von der Groeben C, Magnusson A, Hedenstierna G, Putensen C. Electrical impedance tomography compared with thoracic computed tomography during a slow inflation maneuver in experimental models of lung injury. Crit Care Med. 2008;36(3):903–909. doi: 10.1097/ccm.0b013e3181652edd. [DOI] [PubMed] [Google Scholar]
Associated Data
This section collects any data citations, data availability statements, or supplementary materials included in this article.
Supplementary Materials
Supplementary material 1 Animation showing the progressive averaging process while increasing the number of considered breaths. Note the similarity between the triggered averaged waveform and the volume waveform obtained from the ventilator (GIF 144 kb)
Supplementary material 2 PDF file containing supplementary figures S1 S2 S3 (PDF 214 kb)


