

Abstract
Alcohol labels are one strategy for raising consumer awareness about the negative consequences of alcohol, but evidence to inform labels is limited. This quasi-experimental study sought to test the real-world impact of strengthening health messages on alcohol container labels on consumer attention, message processing (reading, thinking, and talking with others about labels), and self-reported drinking. Alcohol labels with a cancer warning, national drinking guidelines, and standard drink information were implemented in the intervention site, and usual labelling practices continued in the comparison site. Changes in key indicators of label effectiveness were assessed among a cohort of adult drinkers in both the intervention and comparison sites using three waves of surveys conducted before and at two time-points after the alcohol label intervention. Generalized Estimating Equations with difference-in-difference terms were used to examine the impact of the label intervention on changes in outcomes. Strengthening health messages on alcohol container labels significantly increased consumer attention to [Adjusted Odds Ratio (AOR)=17.2, 95%CI:8.2,36.2] and processing of labels (e.g., reading labels: AOR=2.6, 95%CI:1.8,3.7), and consumer reports of drinking less due to the labels (AOR=3.7, 95%CI:2.0,7.0). Strengthening health messages on alcohol containers can achieve their goal of attracting attention, deepening engagement, and enhancing motivation to reduce alcohol use. Strengthening alcohol labelling policies should be a priority for alcohol control globally.
Keywords: Alcohol warning labels, Alcohol policy, Alcohol, Population health intervention, Quasi-experiment
Introduction
Alcohol is the seventh leading cause of preventable death globally, accounting for nearly 3 million deaths per year. The risk of all-cause mortality, and of cancers specifically, rises with increasing levels of consumption (Global Burden of Disease 2016 Alcohol Collaborators, 2018). However, alcohol is generally perceived by the public as a benign substance that is comparatively less harmful than other substances, and now more than two billion people worldwide consume alcohol regularly (Cheeta et al., 2018; Global Burden of Disease 2016 Alcohol Collaborators, 2018). Given the prevalence of and health burden due to alcohol consumption, alcohol control policies focused on increasing public awareness of alcohol-related health harms and lowering overall population-level consumption are significant public health needs.
Alcohol warning labels are one strategy recommended as part of a comprehensive approach to curbing alcohol consumption at a population level. The World Health Organization recommends health warning labels to raise consumer awareness about the negative consequences of alcohol (World Health Organization, 2010, 2017, 2019). More than 47 countries have policies that require alcohol warning labels (Global Health Observatory Data Repository (European Region), 2019). Most mandate labels with vague statements of risk, or cautioning about the risk of drinking alcohol during pregnancy or when operating a motor vehicle. Two countries currently require labels with a cancer warning. Since 2017, alcohol manufacturers in South Korea are required to choose one of three messages, two of which cite cancer risk. Ireland passed legislation in late 2018 mandating cancer warnings on alcohol product labels, but enactment was delayed by industry lawsuits (Murray, 2017).
Evaluations of the effectiveness of alcohol warning labels to date are largely limited to the US label (Martin-Moreno et al., 2013). Mandatory alcohol warning labels on all alcohol containers for sale in the US were introduced in November 1989 (Electronic Code of Federal Regulations, 1990). The small inconspicuous text-only warning labels caution that alcohol consumption impairs the ability to drive a car or operate machinery and that alcohol should not be consumed during pregnancy because of the risk of birth defects and other general health risks. Population-based cross-sectional surveys conducted among a sample of US adult drinkers six-months before and after label implementation found that 21% noticed labels and recalled at least some of the label messages, and that labels initiated conversations about the risks of drinking and pregnancy but not the other label messages (Greenfield, Graves & Kaskutas, 1999; Kaskutas & Greenfield, 1992). Associations between the driving impairment message and precautionary behaviours (i.e., not drinking before driving or not driving after drinking) were observed and associations between this label message and collaterals’ efforts to intervene to prevent drink driving were also seen (Greenfield, 1997; Tam & Greenfield, 2010). However, evidence of the label’s overall impact on alcohol consumption was lacking, with most studies reporting no changes (Babor et al., 2003; Kaskutas & Greenfield, 1992; McKinnon, Nohre, Pentz & Stacy, 2000; Stockley, 2001). Experts presume the unimpressive results of the US warning label on actual alcohol consumption are due to its weak design (Babor et al., 2003; Greenfield et al., 1999; Hilton, 1993). Other smaller online studies evaluating the mandatory pregnancy pictogram on alcohol labels in France, and voluntary industry-sponsored labels in Australia and the UK, suggest the labels’ impacts on consumer attention and behaviours were small to non-existent, and recommend extensive improvements to label design and content (Blackwell, Drax, Attwood, Munafo & Maynard, 2018; Coomber, Martino, Barbour, Mayshak & Miller, 2015; Dossou, Gallopel-Morvan & Diouf, 2017).
Contrary to the limited effectiveness of alcohol labels to date, there is strong review evidence demonstrating the impact of tobacco warning labels on cigarette packages on cessation behaviours across a wide range of samples and cultural contexts (Brewer et al., 2016; Hammond, 2011). Recent evidence examining the psychological mechanisms underpinning how tobacco warning labels increase cessation indicate that labels exert their influence by keeping health messages vividly in consumers’ minds (Brewer et al., 2019; Nour et al., 2017). This finding is consistent with the Elaboration Likelihood Model and the recently developed Tobacco Warnings Model (Brewer et al., 2019; Petty & Cacioppo, 1986), which postulate that for a health message to have impact, a message must generate exposure, attract attention, and be processed by the target audience. Although knowledge is an outcome especially relevant to policymakers, it is not included in these models as it is rarely a motivator of behaviour change. Instead, these models propose that attention to and processing of the labels are early processes in the behaviour change process (Brewer et al., 2019; McGuire, 1989; Petty & Cacioppo, 1986). If a message is successful in those early stage processes, later-stage processes such as behaviour change may occur. Accordingly, affecting these early-stage processes is from a theoretical perspective, a prerequisite for behaviour change; in the absence of such processes, it is unlikely that label messages will have downstream population-level effects on behaviour. Studies examining fear appeals in public health communications more broadly also suggest that arousing fear in consumers is effective for increasing motivation to adopt the message’s recommendation, particularly when the message depicts relatively high amounts of fear and includes an efficacy statement that the recommended actions will result in desirable consequences (Tannenbaum et al., 2015). Applying this approach to alcohol, and building on recent lab-based alcohol labelling studies (Al-Hamdani, 2014; Al-Hamdani & Smith, 2015, 2017; Hobin et al., 2018; Martin-Moreno et al., 2013; Mays, Villanti, Niaura, Lindblom & Strasser, 2019; Pettigrew et al., 2016; Sillero-Rejon et al., 2018; Strahan et al., 2002; Thomson, Vandenberg & Fitzgerald, 2012; Vallance et al., 2018), it is proposed that strengthening alcohol labels by: (1) making the labels more visually prominent on alcohol containers by increasing the size of the label and using a bright yellow background and full colour; and, (2) adding new and rotating simple yet serious health messages, such as cancer risk, as well as direction or instruction based recommendations for reducing risk will increase attention to and processing of the labels, which will lead to increased conversations about the label messages. The deeper engagement with the labels together with the repeated exposure to the labels at the point-of-purchase and when pouring or handling the container keeps the messages in consumers’ minds, and increases motivation to reduce their drinking.
The purpose of the current paper is to examine the effects of strengthening alcohol labels on consumer attention and message processing, and a self-reported reduction in drinking due to the labels, as well as investigate whether consumer attention to and processing of the labels mediate the relationship between exposure to strengthened alcohol labels and a self-reported reduction in drinking. It is part of a large real-world study testing the impact of what was planned to be an eight-month alcohol label intervention that included three rotating complementary messages containing a cancer warning, national drinking guidelines, and standard drink information (Fig. 1a), relative to labels used for almost three decades in the intervention and comparison sites (Fig. 1b). This paper is an extension of a previously published paper showing the positive effects of the intervention labels on consumer attention and processing, and a self-reported reduction in drinking due to the labels after the intervention was implemented for only one month (Hobin et al., 2020). It expands on the previous paper by investigating the impact of the label intervention over its full duration, and specifically after the intervention was modified due to interference from Canada’s national alcohol industry. We hypothesize that strengthening health messages on alcohol container labels will increase consumer attention to and processing of labels, and will influence a self-reported reduction in drinking due to the labels in the intervention site relative to the comparison site over the full duration of the intervention. Additionally, we hypothesize that the longer-term effects of the labels on outcomes will be weaker relative to the initial effects after the intervention was implemented for the first month.
Fig. 1a.
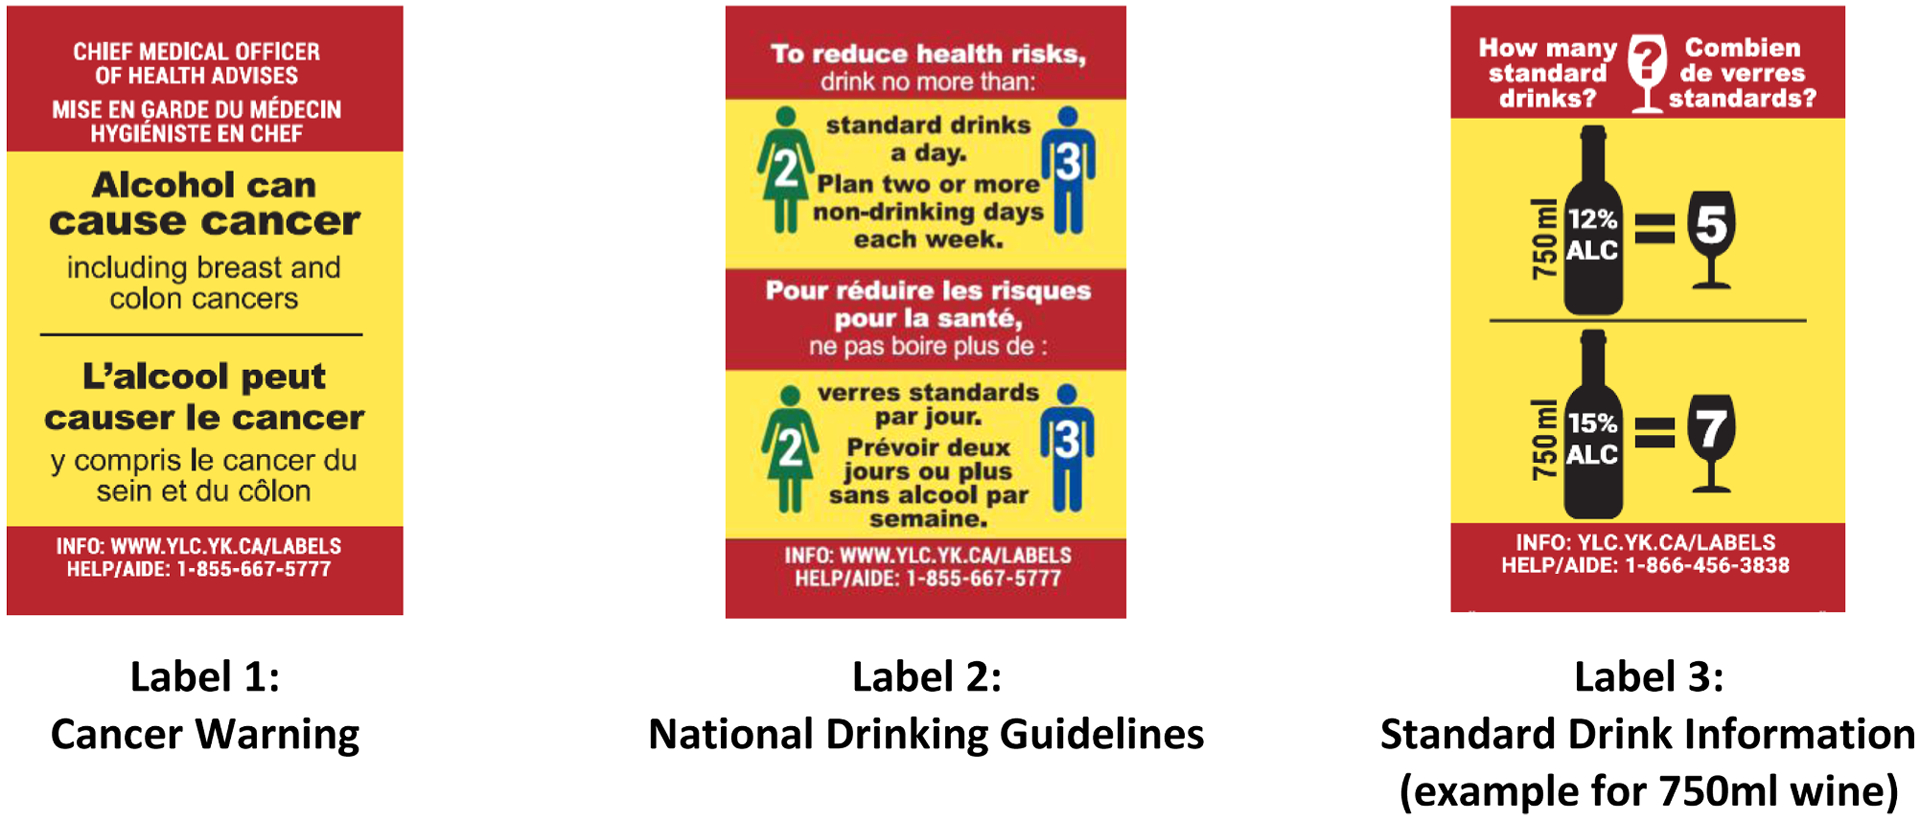
Intervention alcohol warning labels (Actual size 5.0 cm× 3.2 cm) Alcohol containers sold in the liquor store in the intervention site displayed only one of the labels at any one time.
Fig. 1b.
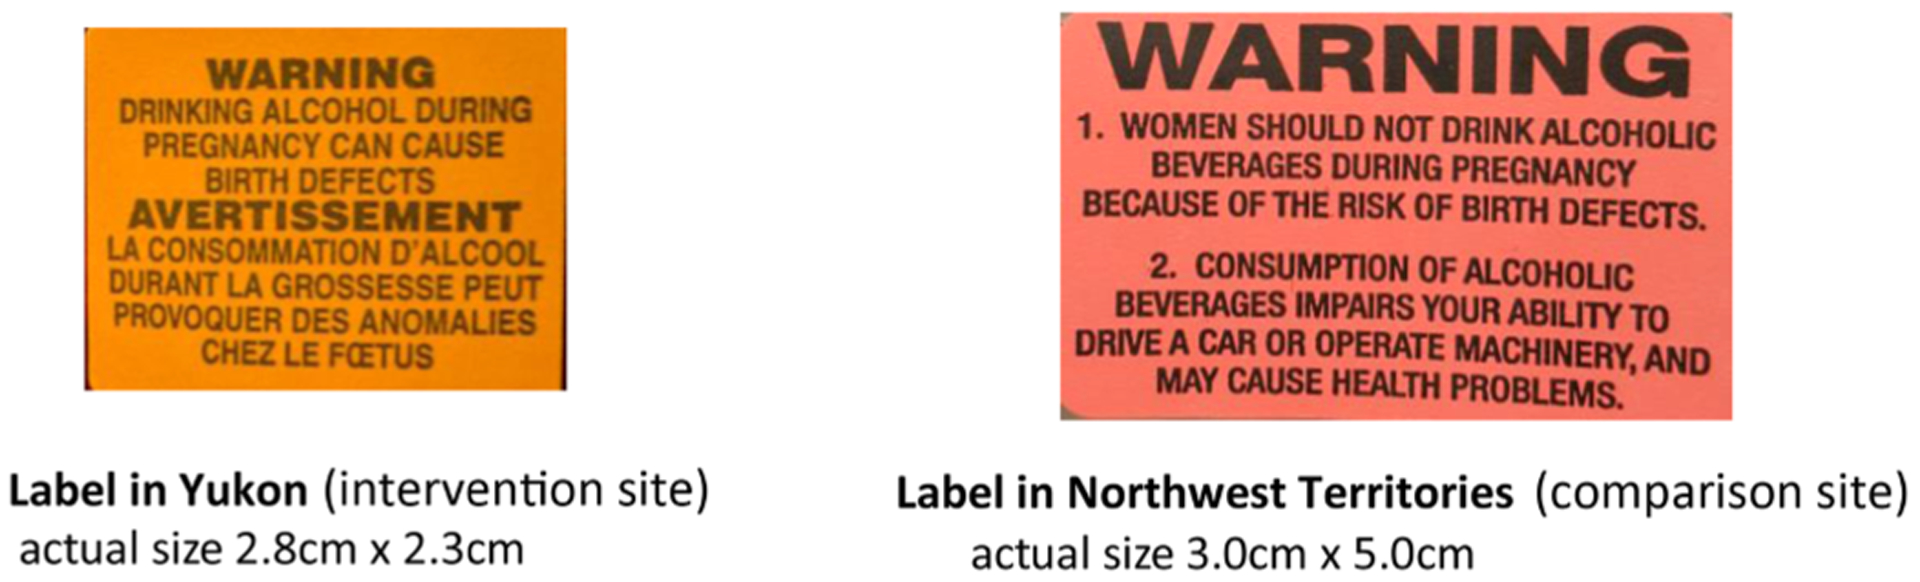
Comparison labels: Pre-intervention alcohol warning label in the intervention site, and the warning label in the comparison site..
Methods
Alcohol label intervention
The alcohol label intervention consisted of three rotating messages. As shown in Fig. 1a, the first label advises that alcohol can cause cancer (Global Burden of Disease 2016 Alcohol Collaborators, 2018; IARC Working Group on the Evaluation of Carcinogenic Risks to Humans, 2010, 2012; Loconte, Brewster, Kaur, Merrill & Alberg, 2018; Praud et al., 2016; World Health Organization, 2014), and mentions two types that are particularly prevalent in Canada, breast and colon (Canadian Cancer Statistics Advisory Committee, 2018). The second presents Canada’s national drinking guidelines (Butt, Beirness, Stockwell, Gliksman & Paradis, 2011), and a third gives consumers advice on how many Canadian standard drinks (a Canadian standard contains 13.45 g of pure alcohol) are contained in different sizes and strengths of alcoholic beverages. Label content, size, and format were informed by evidence as well as consultations with local and international health experts and community stakeholders (Al-Hamdani, 2014; Al-Hamdani & Smith, 2015, 2017; Hobin et al., 2018; Martin Moreno et al., 2013; Mays et al., 2019; Pettigrew et al., 2016; Sillero-Rejon, Maynard & Ibanez-Zapata, 2019; Strahan et al., 2002; Thomson et al., 2012; Vallance et al., 2018; Wettlaufer, 2018). The labels were relatively large in size to make them easily noticed and read, were full colour with a bright yellow background and red border so they stood out on the container, and had messages providing new information and were rotated to avoid wear out. Label messages were provided in Canada’s two official languages, English and French. Consistent with evidence for effective labelling (Hammond, 2011; Martin Moreno et al., 2013; Purmehdi, Legoux, Carrillat & Senecal, 2016), a parallel social marketing and awareness campaign was planned, including a media release, in-store signage and point-of-sale materials, a website, a toll-free helpline and radio spots to augment the labels.
The intervention site (Whitehorse, Yukon, Canada) was recruited to apply the intervention alcohol labels on all alcohol containers, except select local and single-serve beer and cider, in its one government owned liquor store for an eight month period (Fig. 2). The comparison site (Yellowknife, Northwest Territories, Canada) included its two government-owned liquor stores that continued usual labelling practices. These three stores are the only government monopoly liquor stores and account for approximately 50% of all legal off-premise alcohol sales in both cities (Government of Northwest Territories, 2017; Government of Yukon, 2017). Yukon and Northwest Territories were recruited to participate in this experiment as they are currently the only jurisdictions in Canada to require any kind of alcohol warning label. Since 1991 they have used after-market labels on alcohol containers to caution consumers about the risk of drinking while pregnant, with an additional warning in Northwest Territories about drinking and operating machinery and general health concerns (Fig. 1b) (Government of Northwest Territories, 2017; Government of Yukon, 2017). The labels in Northwest Territories do not include messages related to alcohol and cancer, national drinking guidelines, or standard drinks.
Fig. 2.
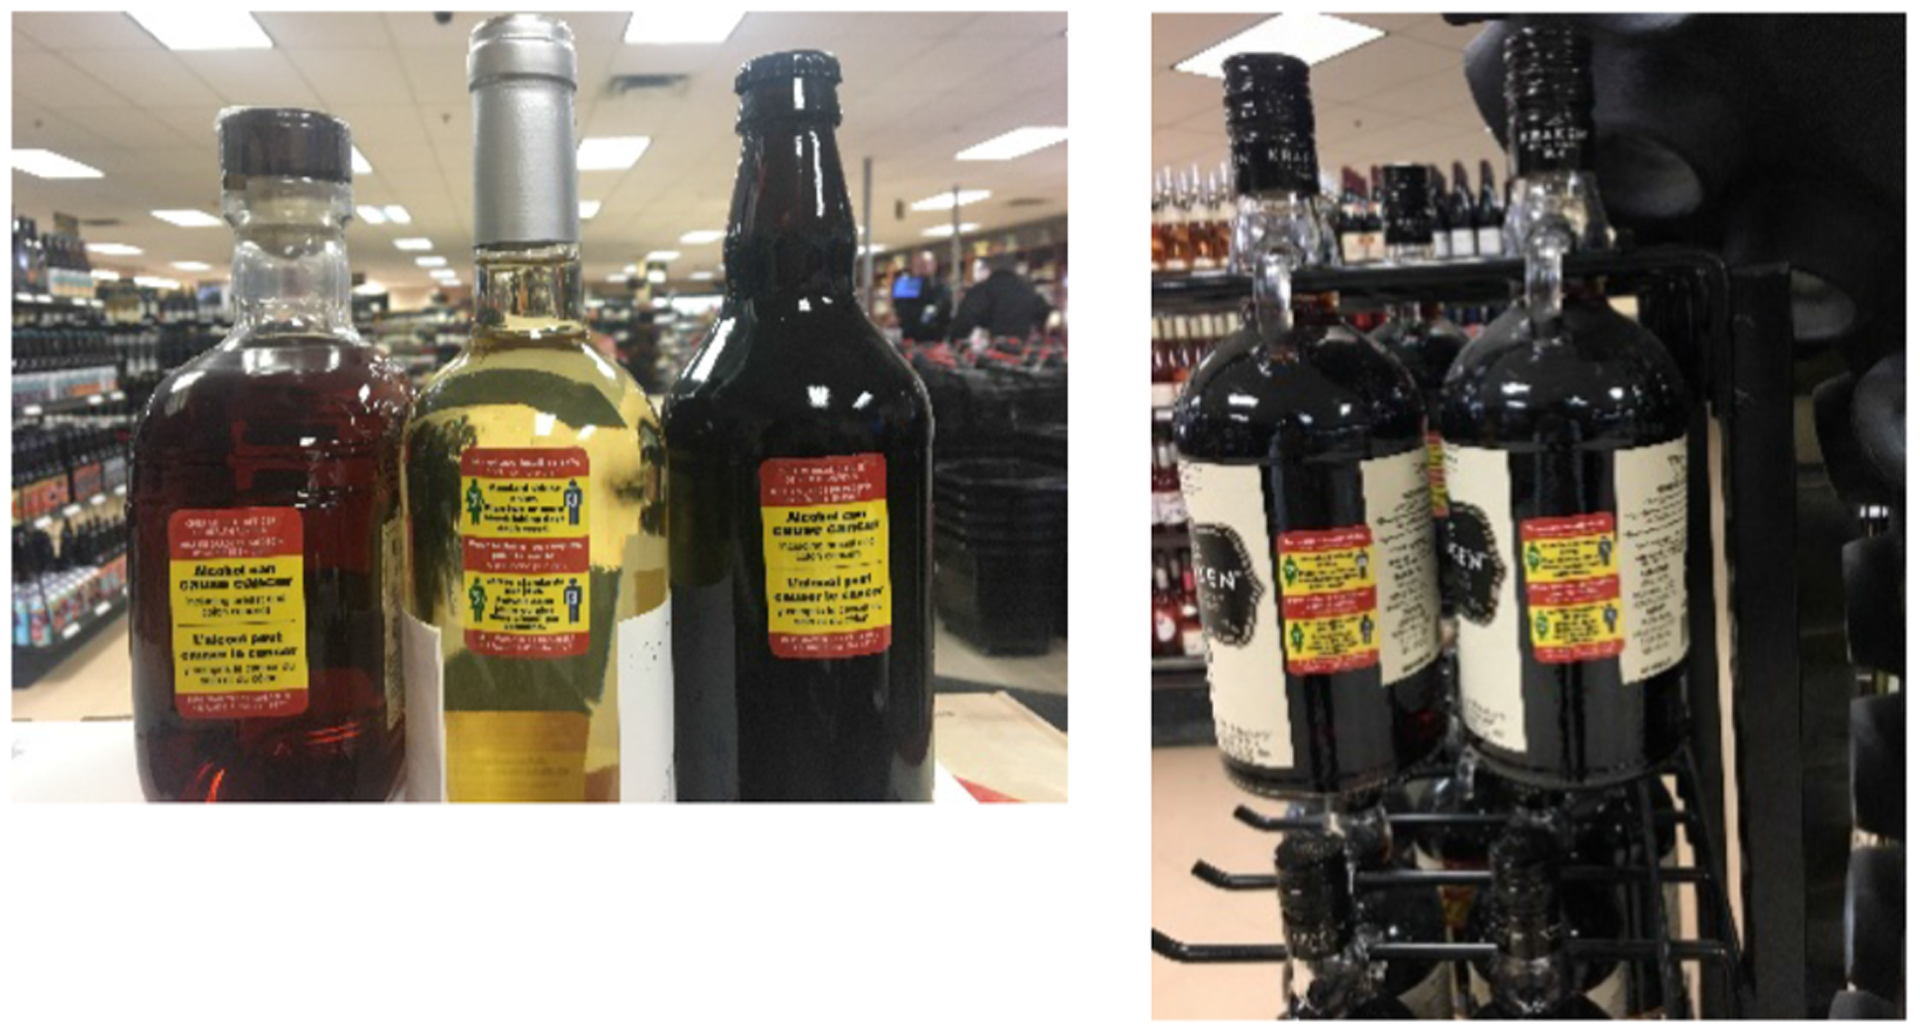
Images of intervention alcohol warning labels (actual size 5.0 cm × 3.2 cm) on alcohol containers in the intervention liquor store.
Study design and sample
This study used three waves of survey data conducted before and at two time-points after the alcohol label intervention with 2049 unique cohort participants. We followed TREND reporting guidelines for this quasi-experimental study (Jarlais, Lyles & Crepaz, 2004). Full details of the study including study protocols, survey development, and participant recruitment have been previously published (Vallance et al (2020)). Other papers using this dataset have explored the impact of the alcohol label intervention on consumer knowledge of alcohol-related cancer and national drinking guidelines, as well as per capita alcohol consumption ((Hobin et al., 2020); (Schoueri-Mychasiw et al., 2020); (Zhao, Stockwell, Vallance, & Hobin, 2020)). Participants were systematically recruited by trained research assistants as they exited government-owned liquor stores in the intervention and comparison sites using a standard intercept technique of approaching every person that passed a pre-identified landmark in the liquor store. At time of recruitment, participants were of legal drinking age 19+, current drinkers, living in the intervention or comparison cities, bought alcohol at the liquor store, and did not self-report being pregnant or breast-feeding. Wave 1 surveys were conducted in both sites over a six-week period starting May 2017, approximately four months before the labels were implemented in the intervention site. Starting November 20, 2017, two of the intervention labels, the cancer warning and national drinking guidelines, were applied to alcohol containers in the liquor store in the intervention site. The standard drink labels were to be introduced shortly thereafter. However, only one month into the eight month alcohol label intervention period, the government for the intervention site halted their participation in the study due to significant pressure from representatives of Canada’s national alcohol producers and stopped applying labels (Austen, 2018). Based on remaining label stock, approximately 47,000 cancer warning labels and 53,000 national drinking guidelines labels were applied to alcohol containers within the one-month period. As a result of the unexpected interruption, the Wave 2 surveys were conducted starting February 2018 with the purpose of capturing any effects of the labels with the cancer warning and national drinking guidelines. The government for the intervention site decided to resume their participation in the study starting April 2018, on the condition that the cancer warning label be omitted. Thus, the labels containing the national drinking guidelines were reinstated on alcohol containers in the liquor store in the intervention site starting April 12, 2018, and the label with standard drink information was added to the rotation starting May 28, 2018, up to the end of July 31, 2018, for a total of more than 200,000 labels. Wave 3 surveys were conducted starting June 2018 to the end of the intervention period in July 2018, to assess the impact of the two labels with drinking guidelines and standard drink information as well as the potential continued effect of the omitted cancer warning label. In Waves 2 and 3, participants who provided their contact information were emailed survey instructions, a unique survey link, and an INTERAC e-transfer as remuneration. Additionally, due to attrition in Waves 2 and 3, the sample was replenished using Wave 1 recruitment and survey procedures in the liquor stores in both the intervention and comparison sites. All survey periods continued for six weeks, the survey was approximately 18 min in length, and survey measures were consistent across waves and sites. A media release and a project website containing information about the national drinking guidelines and the concept of a standard drink as well as a toll-free helpline number were implemented in November 2017, at the time of the original intervention launch; however, implementation of in-store posters, point-of-sale materials, and radio spots were not implemented due to the industry interference. Study procedures were approved by the Research Ethics Boards at Public Health Ontario (ID 2017–010.04) and the University of Victoria (Protocol 17–161).
Measures
Survey items were adapted from indicators used to assess health warning effectiveness on alcohol and tobacco (Greenfield et al., 1999; Hammond, 2011; Hobin et al., 2018). Unless otherwise stated, Wave 1 measures were anchored with six months prior to baseline, Wave 2 measures from the November prior to follow-up, and Wave 3 measures from the April prior to follow-up.
To assess if consumers noticed changes to the warning labels on alcohol containers, participants were first asked if they had seen any warning labels on bottles or cans of beer, wine, hard liquor, coolers or ciders (yes/no/don’t know/prefer not to say). Those who reported seeing warning labels were asked if they had noticed any changes to warning labels on bottles or cans of beer, wine, hard liquor, coolers or ciders (yes vs no/don’t know).
Cognitive processing, the extent to which information is processed or elaborated upon, is the most important determinant of memory and attitude change in response to new information (Cantrell et al., 2013). Depth of processing was assessed using three items, including the frequency with which drinkers attended to the labels (“How often have you read or looked closely at the warning labels on bottles and cans of beer, wine, hard liquor, coolers, or ciders?”), and reflected on the labels (“How often have you thought about the warning labels on bottles and cans of beer, wine, hard liquor, coolers, or ciders?”). A more distal measure of cognitive processing captured the frequency with which participants talk about the labels with others (“How often have you talked about the warning labels on bottles or cans of beer, wine, hard liquor, coolers, or ciders with others?). Responses were given on a five-point Likert scale, included ‘don’t know’ and ‘prefer not to say’ as options, and dichotomized as 1=never , 2=rarely, and ‘don’t know’ versus 3=sometimes, 4=often, and 5=very often.
To assess self-reported impact of the labels on drinking, participants were asked, “Has the amount of alcohol you are drinking changed as a result of the warning labels on bottles or cans of beer, wine, hard liquor, coolers, or ciders? Responses included “less” compared to “same amount”, “more”, and “don’t know” and “prefer not to say”.
Socio-demographic measures included age, sex, ethnicity, education [low (completed high school or less), medium (completed trades or college certificate, some university or university certificate below Bachelor’s), high (university degree or post-graduation), and unknown (don’t know/prefer not to say/missing)], and annual income [low (< $30,000), medium ($30,000-$59,999), high (≥$60,000), and unknown (don’t know/prefer not to say/ missing)].
Other covariates measured in this study included health literacy, alcohol use, and time-in-sample. Health literacy was assessed using the Newest Vital Sign assessment tool and responses were categorized as: limited (≤1 correct responses), possibility of limited (2–3 correct responses), adequate literacy (4–6 correct responses), and unknown (don’t know/prefer not to say/missing) (Weiss et al., 2005). Alcohol use was measured using the quantity/frequency method (Heeb & Gmel, 2005). Participants were asked to indicate how often they drank alcohol beverages in the past 6 months, and how many drinks they usually drank per occasion. Responses were combined to provide a mean number of drinks per week and categorized using Canada’s national drinking guidelines: low (≤10 for females/15 for males per week), risky (11–19/16–29 per week), high (>20/30 per week) (Butt et al., 2011), and unknown (don’t know/prefer not to say/ missing). Lastly, a time-in-sample variable was created to adjust for participants who participated in one, two, or all three survey waves.
Statistical analysis
A Generalized Estimating Equation (GEE) model using a binomial distribution with logit link function was applied to examine the impact of the labels on the five outcomes (Pepe, 2003). GEE models can account for a mix of within-subject correlation that arises from the cohort participants being asked the same questions over multiple survey waves plus the replenishment sample. Difference-in-difference (DID) terms were added to each model to assess whether the pattern of change over time in the intervention site was significantly different form the comparison site. Socio-demographic variables and covariates were included in all models, with ethnicity defined as White vs. other (Aboriginal/ other/do not know/prefer not to say/missing). Education, income, and health literacy were found to be correlated; thus to improve the stability of the models, only education was used. Furthermore, consumer attention to and processing of label messages were also examined as mediators of the relationship between alcohol warning labels and self-reported drinking using an iterative four-step model building process suggested by Baron and Kenny (Baron & Kenny, 1986). In Step 1, the effect of alcohol labels on self-reported drinking was examined; the effect of alcohol labels on consumer attention to and processing of the labels was examined in Step 2; the effect of consumer attention to and processing of the labels on self-reported drinking was examined in Step 3; and the effect of alcohol labels and consumer attention to and processing of the labels on self-reported drinking was examined in Step 4. If the effect of the alcohol labels on self-reported drinking was no longer significant or reduced after adjusting for consumer attention to and processing of the labels, complete or partial mediation was concluded, respectively. ‘Prefer not to say/missing’ responses were excluded from the outcome measures in all of the models. All analyses were conducted using SAS 9.3 (SAS Institute Inc., 2013).
Results
Table 1 presents the sample characteristics by site at time of recruitment. In total, 2049 unique participants completed at least one survey across the three waves, providing 3277 observations. According to AAPOR #4, response rates were 8.9% in the intervention and 8.0% in the comparison sites (American Association for Public Opinion Research, 2011). Overall, 53.2% participants were retained at Wave 2, and 47.5% at Wave 3.
Table 1.
Sample characteristics (at recruitment) by experimental condition.
| Intervention Site (n = 1233) n (%) | Comparison Site (n = 816) n (%) | |
|---|---|---|
| Wave of recruitment | ||
| 1 | 505 (41.0) | 331 (40.6) |
| 2 | 491 (39.8) | 320 (39.2) |
| 3 | 237 (19.2) | 165 (20.2) |
| Age [Mean(SD)]*** | 47.4 (14.6) | 41.2 (13.7) |
| Age Categories*** | ||
| 19–24 | 77 (6.2) | 100 (12.3) |
| 25–44 | 436 (35.4) | 379 (46.5) |
| 45 + | 720 (58.4) | 337 (41.3) |
| Ethnicity*** | ||
| White | 891 (72.3) | 481 (59.0) |
| Aboriginal | 219 (17.8) | 198 (24.3) |
| Other | 123 (10.0) | 137 (16.8) |
| Sex* | ||
| Female (vs. Male) | 625 (50.7) | 368 (45.1) |
| Education Levels* | ||
| Low (Completed high school or less) | 250 (25.3) | 184 (22.6) |
| Medium (Trades or college certificate, some university or university certificate below Bachelor) | 437 (35.4) | 292 (35.8) |
| High (Bachelor degree or higher) | 490 (39.7) | 285 (34.9) |
| Unknown (DK, PNS, Missing) | 56 (4.5) | 55 (6.7) |
| Income Levels** | ||
| Low (<$30,000) | 197 (16.0) | 87 (10.7) |
| Medium ($30,000 to <$60,000) | 222 (18.0) | 128 (15.7) |
| High (>$60,000) | 698 (56.6) | 489 (59.9) |
| Unknown (DK, PNS, Missing) | 116 (9.4) | 112 (13.7) |
| Alcohol Use Levels** | ||
| Low volume <10 for females/15 for males per week | 912 (74.0) | 555 (68.0) |
| Risky volume 11–19/16–29 per week | 96 (7.8) | 50 (6.1) |
| High volume >20/30 per week | 121 (9.8) | 105 (12.9) |
| Unknown (DK, PNS, Missing) | 104 (8.4) | 106 (13.0) |
| Health Literacy Levels*** | ||
| Limited literacy (score <=1) | 369 (29.9) | 287 (35.2) |
| Possibility of limited literacy (score | 240 (19.5) | 160 (19.6) |
| 2–3) | ||
| Adequate literacy (score 4–6) | 563 (45.7) | 299 (36.6) |
| Unknown (DK, PNS, Missing) | 61 (5.0) | 70 (8.6) |
Note.
Pearson X2 test, p < 0.05,
Pearson X2 test, p < 0.01,
Pearson X2 test, p < 0.001,
DK = Don’t know, PNS = Prefer not to say.
Noticing changes to alcohol labels on containers in liquor stores increased to a greater extent overall between Waves 1 and 3 in the intervention versus comparison site [+31.1% vs −3.4%, Adjusted Odds Ratio (AOR) = 17.2, 95%CI = 8.2, 36.2], and between Waves 1 and 2 (+38.8% vs −1.6%, AOR = 17.0, 95%CI=8.7, 33.1) but not between Waves 2 and 3 (−7.7% vs −1.8%, AOR = 1.0, 95%CI = 0.5,1.9) (Table 2; Fig. 3a).
Table 2.
Results of Generalized Estimating Equation (GEE) models for label outcomes – key comparisons.
| Measure | Comparison | AOR | 95% CI |
|---|---|---|---|
| Notice Changes to Labels in Store (N = 3264) | Wave 1: Treatment vs Comparison site | 0.8 | 0.5, 1.4 |
| Wave 2: Treatment vs Comparison site | 14.2 | 9.5,21.3 | |
| Wave 3: Treatment vs Comparison site | 14.4 | 8.7,23.8 | |
| Treatment site: Wave 3 vs Wave 1 | 9.3 | 6.3, 14.0 | |
| Treatment site: Wave 2 vs Wave 1 | 13.7 | 9.2,20.4 | |
| Treatment site: Wave 3 vs Wave 2 | 0.7 | 0.6,0.8 | |
| Comparison site: Wave 3 vs Wave 1 | 0.5 | 0.3,1.0 | |
| Comparison site: Wave 2 vs Wave 1 | 0.8 | 0.5,1.4 | |
| Comparison site: Wave 3 vs Wave 2 | 0.7 | 0.4,1.2 | |
| Treatment vs Comparison site: Wave 3 vs Wave 1 | 17.2 | 8.2,36.2 | |
| Treatment vs Comparison site: Wave 2 vs Wave 1 | 17.0 | 8.7,33.1 | |
| Treatment vs Comparison site: Wave 3 vs Wave 2 | 1.0 | 0.5,1.9 | |
| Reading Labels (N=3276) | Wave 1: Treatment vs Comparison site | 0.8 | 0.6,1.0 |
| Wave 2: Treatment vs Comparison site | 1.5 | 1.2,1.9 | |
| Wave 3: Treatment vs Comparison site | 2.0 | 1.6,2.6 | |
| Treatment site: Wave 3 vs Wave 1 | 1.3 | 1.1,1.6 | |
| Treatment site: Wave 2 vs Wave 1 | 1.3 | 1.1,1.6 | |
| Treatment site: Wave 3 vs Wave 2 | 1.0 | 0.8,1.2 | |
| Comparison site: Wave 3 vs Wave 1 | 0.5 | 0.4,0.7 | |
| Comparison site: Wave 2 vs Wave 1 | 0.7 | 0.5,0.9 | |
| Comparison site: Wave 3 vs Wave 2 | 0.7 | 0.6,0.9 | |
| Treatment vs Comparison site: Wave 3 vs Wave 1 | 2.6 | 1.8,3.7 | |
| Treatment vs Comparison site: Wave 2 vs Wave 1 | 1.9 | 1.4,2.7 | |
| Treatment vs Comparison site: Wave 3 vs Wave 2 | 1.4 | 1.0,1.8 | |
| Thinking about Labels (N = 3271) | Wave 1: Treatment vs Comparison site | 0.8 | 0.6,1.1 |
| Wave 2: Treatment vs Comparison site | 1.7 | 1.3,2.2 | |
| Wave 3: Treatment vs Comparison site | 2.3 | 1.7,3.0 | |
| Treatment site: Wave 3 vs Wave 1 | 1.9 | 1.5,2.4 | |
| Treatment site: Wave 2 vs Wave 1 | 2.0 | 1.5,2.5 | |
| Treatment site: Wave 3 vs Wave 2 | 1.0 | 0.8,1.2 | |
| Comparison site: Wave 3 vs Wave 1 | 0.7 | 0.5,1.0 | |
| Comparison site: Wave 2 vs Wave 1 | 0.9 | 0.7,1.3 | |
| Comparison site: Wave 3 vs Wave 2 | 0.7 | 0.6,1.0 | |
| Treatment vs Comparison site: Wave 3 vs Wave 1 | 2.7 | 1.8,4.0 | |
| Treatment vs Comparison site: Wave 2 vs Wave 1 | 2.1 | 1.4,3.0 | |
| Treatment vs Comparison site: Wave 3 vs Wave 2 | 1.3 | 0.9,1.8 | |
| Talking with Others about Labels (N = 3264) | Wave 1: Treatment vs Comparison site | 1.0 | 0.7,1.6 |
| Wave 2: Treatment vs Comparison site | 2.3 | 1.7,3.2 | |
| Wave 3: Treatment vs Comparison site | 3.5 | 2.4,5.2 | |
| Treatment site: Wave 3 vs Wave 1 | 2.2 | 1.6,3.1 | |
| Treatment site: Wave 2 vs Wave 1 | 2.6 | 1.9,3.6 | |
| Treatment site: Wave 3 vs Wave 2 | 0.9 | 0.7,1.1 | |
| Comparison site: Wave 3 vs Wave 1 | 0.7 | 0.4,1.0 | |
| Comparison site: Wave 2 vs Wave 1 | 1.1 | 0.8,1.7 | |
| Comparison site: Wave 3 vs Wave 2 | 0.6 | 0.4,0.9 | |
| Treatment vs Comparison site: Wave 3 vs Wave 1 | 3.4 | 1.9,5.9 | |
| Treatment vs Comparison site: Wave 2 vs Wave 1 | 2.2 | 1.3,3.8 | |
| Treatment vs Comparison site: Wave 3 vs Wave 2 | 1.5 | 0.9,2.4 | |
| Drinking Less Due to Labels (N = 3251) | Wave 1: Treatment vs Comparison site | 0.4 | 0.2,0.6 |
| Wave 2: Treatment vs Comparison site | 0.9 | 0.6,1.3 | |
| Wave 3: Treatment vs Comparison site | 1.4 | 0.9,2.2 | |
| Treatment site: Wave 3 vs Wave 1 | 1.8 | 1.1,2.7 | |
| Treatment site: Wave 2 vs Wave 1 | 1.8 | 1.2,2.9 | |
| Treatment site: Wave 3 vs Wave 2 | 1.0 | 0.7,1.3 | |
| Comparison site: Wave 3 vs Wave 1 | 0.5 | 0.3,0.7 | |
| Comparison site: Wave 2 vs Wave 1 | 0.8 | 0.5,1.2 | |
| Comparison site: Wave 3 vs Wave 2 | 0.6 | 0.4,1.0 | |
| Treatment vs Comparison site: Wave 3 vs Wave 1 | 3.7 | 2.0,7.0 | |
| Treatment vs Comparison site: Wave 2 vs Wave 1 | 2.4 | 1.3,4.3 | |
| Treatment vs Comparison site: Wave 3 vs Wave 2 | 1.6 | 0.9,2.7 |
Note. AOR – adjusted odds ratio. N – number of observations. aAll models adjusted for age, ethnicity, sex, education, time-in-sample, and alcohol use. bSeparate logistic models were estimated using GEE for each of the individual measures of warning label effectiveness.
Fig. 3.
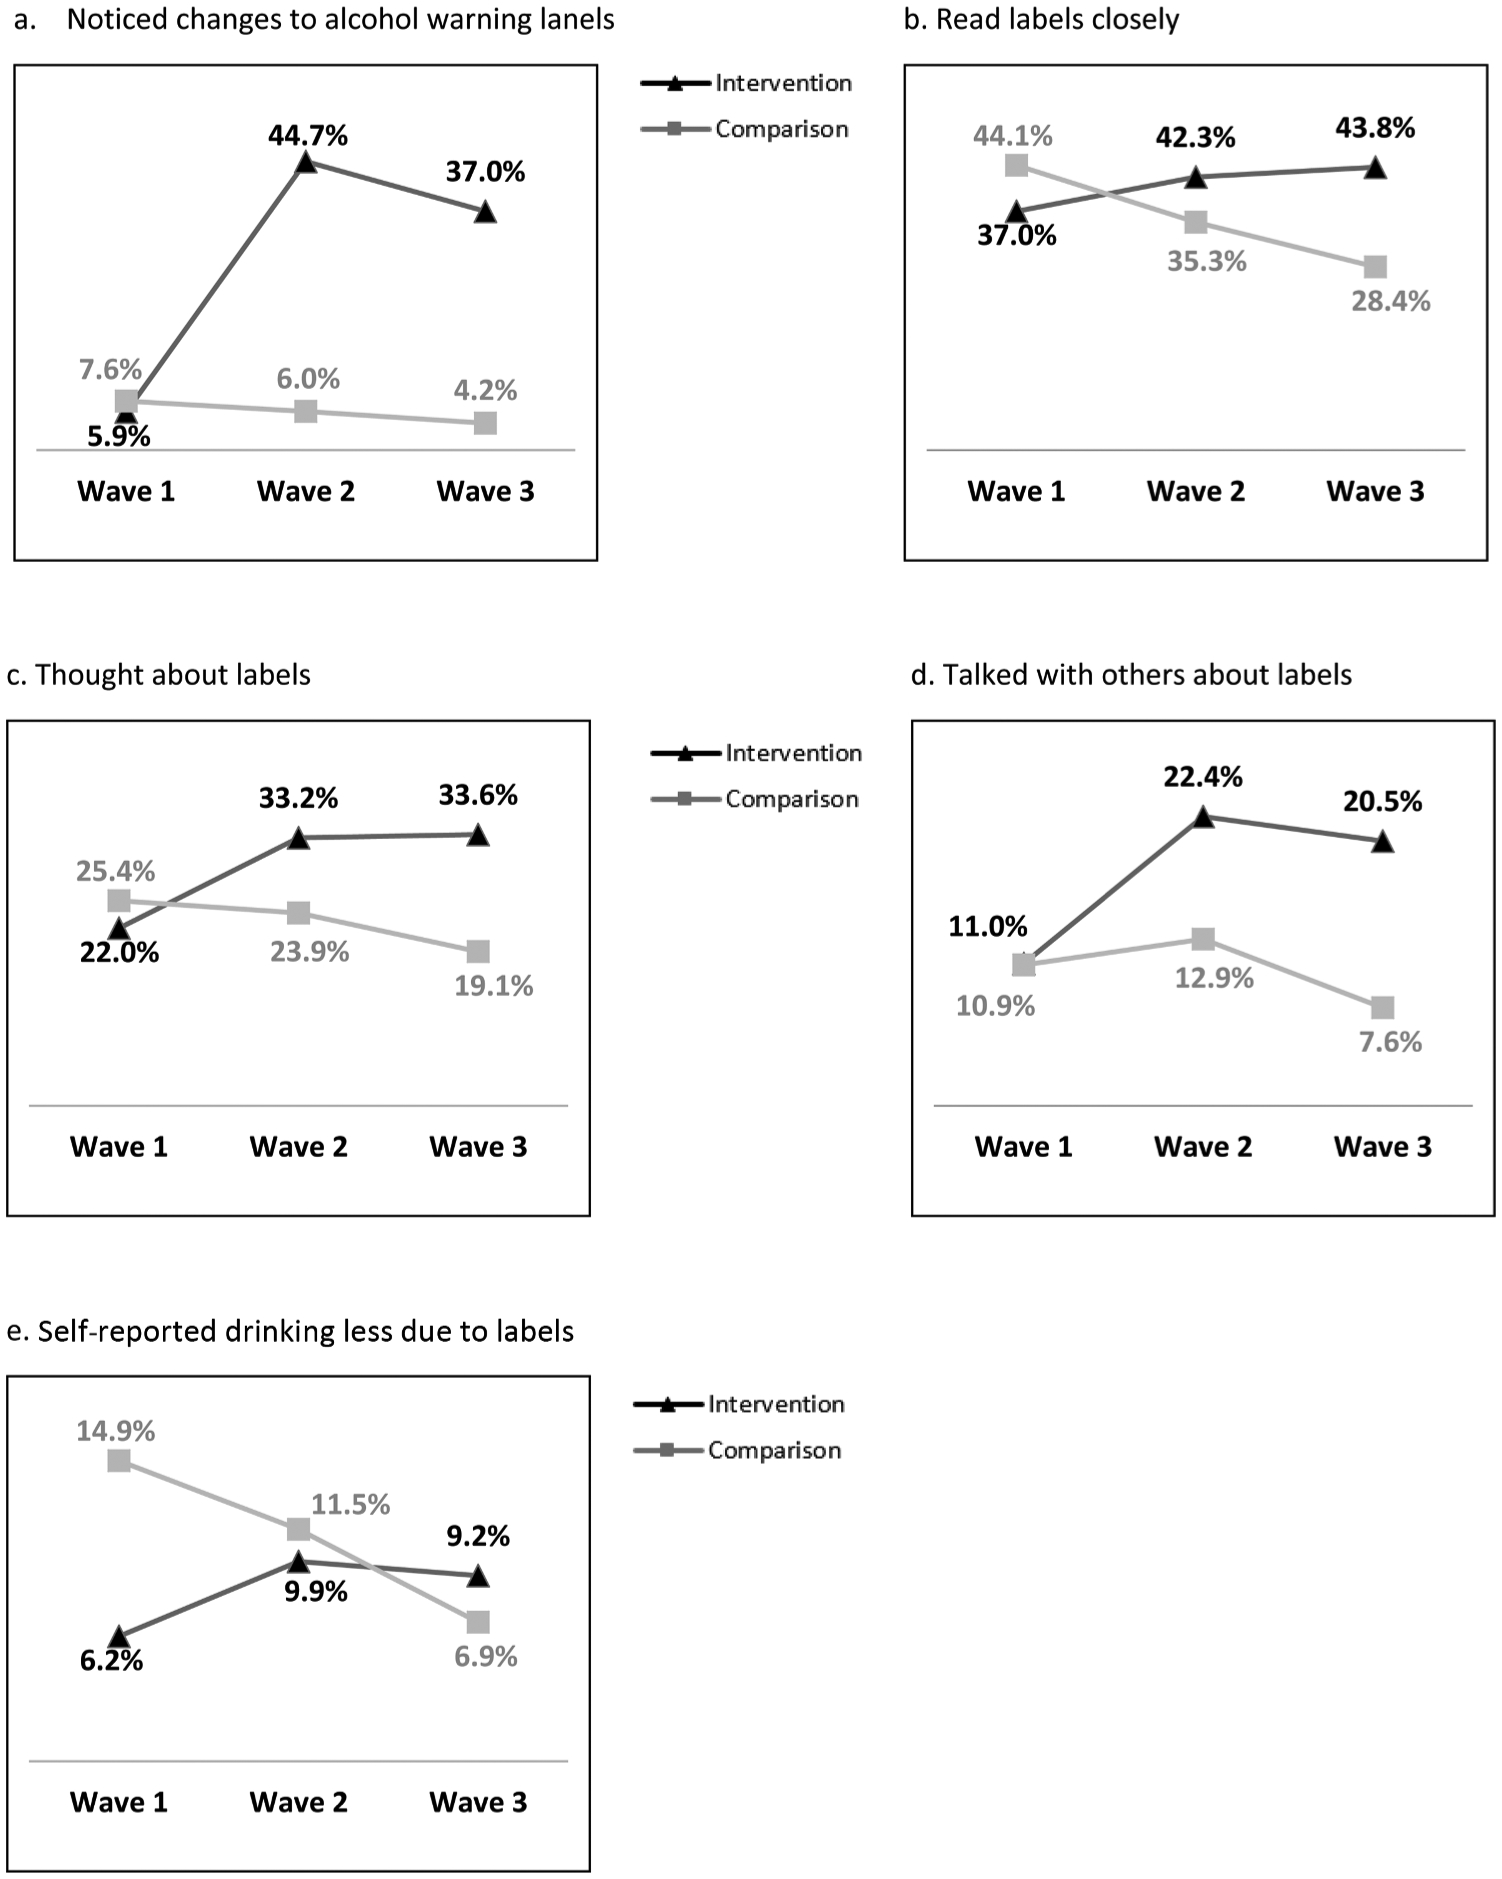
(a–e). Impact of alcohol warning labels on label outcomes in intervention and comparison sites.
Reading labels closely increased to a greater extent overall between Waves 1 and 3 in the intervention versus comparison site (+6.8% vs −15.7%, AOR = 2.6, 95%CI = 1.8, 3.7), as well as between Waves 1 and 2 (+5.3% vs −8.8%, AOR = 1.9, 95%CI = 1.4, 2.7) and between Waves 2 and 3 (+1.5% vs −6.9%, AOR = 1.4, 95%CI = 1.0, 1.8) (Table 2; Fig. 3b).
Thinking about labels increased to a greater extent overall between Waves 1 and 3 in the intervention versus comparison site (+11.6% vs −6.3%, AOR = 2.7, 95%CI = 1.8, 4.0), as well as between Waves 1 and 2 (+11.2% vs −1.5%, AOR = 2.1, 95%CI = 1.4, 3.0) but to a lesser extent between Waves 2 and 3 (+0.4% vs −4.8%, AOR = 1.3, 95%CI = 0.9, 1.8) (Table 2; Fig. 3c).
Talking with others increased to a greater extent overall between Waves 1 and 3 in the intervention versus comparison site (+9.5% vs −3.3%, AOR = 3.4, 95%CI = 1.9, 5.9), and between Waves 1 and 2 (+11.4% vs +2.0%, AOR = 2.2, 95%CI = 1.3, 3.8) but to a lesser extent between Waves 2 and 3 (−1.9% vs −5.3%, AOR = 1.5, 95%CI = 0.9, 2.4) (Table 2; Fig. 3d).
The percentage of participants reporting drinking less alcohol due to the labels increased to a greater extent overall between Waves 1 and 3 in the intervention versus comparison site (+3.0% vs −8.0%, AOR = 3.7, 95%CI = 2.0, 7.0), and between Waves 1 and 2 (+3.7% vs −3.4%, AOR = 2.4, 95%CI = 1.3, 4.3) but to a lesser extent between Waves 2 and 3 (−0.7% vs −4.6%, AOR = 1.6, 95%CI = 0.9, 2.7) (Table 2; Fig. 3e).
Table 3 summarizes the mediation effect of consumer attention to and processing of label messages on exposure to strengthened alcohol warning labels and a self-reported reduction in drinking due to the labels. The effects of alcohol labels on self-reported drinking (β = –0.97, p < 0.0001), alcohol labels on consumer attention to and processing of the labels (β = –0.28, p = 0.05), and consumer attention to and processing of the labels on self-reported drinking (β = 1.09, p < 0.0001) were all significant. The effect of alcohol labels (β = −0.91, p = 0.0003) and consumer attention to and processing of the labels (β = 1.08, p < 0.0001) were simultaneous predictors of a self-reported reduction in drinking, indicating the relationship between exposure to strengthened alcohol warning labels and self-reported drinking behaviours is partially mediated by consumer attention to and processing of label messages.
Table 3.
Mediation Analysis using Baron and Kenny method.
| Step | Outcome | Predictor | β | Standard Error | p-value |
|---|---|---|---|---|---|
| 1 | Self-reported reduction in drinking | Alcohol warning labels | −0.97 | 0.25 | <0.0001 |
| 2 | Consumer attention to and processing of the labels | Alcohol warning labels | −0.28 | 0.14 | 0.05 |
| 3 | Self-reported reduction in drinking | Consumer attention to and processing of the labels | 1.09 | 0.14 | <0.0001 |
| 4 | Self-reported reduction in drinking | Alcohol warning labels | −0.91 | 0.25 | 0.0003 |
| Consumer attention to and processing of the labels | 1.08 | 0.14 | <0.0001 |
Discussion
The findings in this study strongly suggest that the way in which we communicate with drinkers about the health risks of alcohol is con-sequential; that is, strengthening health messages on alcohol container labels appears to change the way in which drinkers attend to, process, and behaviourally respond to the information on the labels. Generally, the results show statistically significant increases across the intervention period in all five key indicators among those exposed versus unexposed to the alcohol label intervention. Label effects were strong immediately following the introduction of the intervention and continued over the full duration of the intervention. Moreover, consumer attention to and processing of label messages partially mediated the relationship between the enhanced alcohol warning labels and self-reported drinking less because of the labels, which is consistent with the hypothesis that strengthening alcohol warning label messages and design will improve their effectiveness for shifting alcohol drinking behaviours because the enhanced labels draw consumer attention to and increase processing of the labels. This deeper engagement with the labels, after repeated exposure over time, increases the impact of the labels on consumer drinking behaviours. Further naturalistic studies are needed to confirm features of optimum labels in busy alcohol retail environments, yet this study suggests the cumulative effect of including a health message, national drinking guidelines, and standard drink information improves label salience, and cognitive and behavioural outcomes among drinkers relative to alcohol labels with vague risk statements.
A key first goal of any health message is to gain attention, as message exposure is critical for garnering effects (Brewer et al., 2019; McGuire, 1989; Nour et al., 2017; Petty & Cacioppo, 1986). Our results demonstrate that strengthening alcohol warning labels by making labels more visually prominent on alcohol containers increases consumer attention as the new intervention labels had a large effect on consumers noticing changes to the labels on containers in the liquor store. Previous research suggests the fairly dramatic intervention effects following the implementation of the new labels could be due to a “novelty effect”, as previous alcohol warning labels in the intervention and comparison sites remained unchanged for 27 years and their effectiveness for some outcomes were low at the start of the study (Borland et al., 2009; Hammond et al., 2007). It is not known if the previous labels experienced wear-out effects before the study began, or if they had ever reached higher levels of engagement in the first place. Moreover, the design differences between the old and new warning labels are substantial. The old labels were small, black and orange labels cautioning about drinking while pregnant, information that is widely understood amongst consumers (Government of Yukon, 2017). Whereas, the new labels were relatively large in size with a bright yellow background and red border, and provide information that is largely unknown among consumers and relevant to a broader population. Overall, revising or updating alcohol warning labels and rotating in a new set of personally-relevant messages periodically are recommended approaches for keeping consumers’ attention to labels and reducing “wear out” (Hitchman, Driezen, Logel, Hammond & Fong, 2014).
Furthermore, the intervention labels also stimulated message processing. Results show the label intervention significantly increased cognitive elaboration, which refers to consumers’ reading, thinking about, and talking with others about the label messages. Deep engagement with the labels is a believed to be the strongest predictor of motivating consumers to change their behaviour (Brewer et al., 2019). We observed the impact of the enhanced alcohol labels on self-reported reductions in drinking due to the labels, illustrating the value that consumers themselves see in alcohol warning labels. These positive results are consistent with the cognitive elaboration findings in review evidence examining the effectiveness of pictorial cigarette pack warnings (Brewer et al., 2016). Pictorial health warnings on tobacco packages are shown to be a powerful intervention for increasing thoughts and motivations to quit smoking amongst smokers in many countries, and are seen as a prominent and credible source of information about the harms of tobacco use (Brewer et al., 2016; Hammond, 2011). Recent lab-based studies examining elements of alcohol warning labels also suggest that simple yet serious health warning messages, using either text or full colour images plus text, can increase motivation to drink less and reduce the speed of consumption (Al-Hamdani & Smith, 2015, 2017; Sillero-Rejon et al., 2018; Stafford & Salmon, 2017). As alcohol warning labels are newly implemented or improved by increasing label size, strengthening label message content, or adding full colour and images, evaluations are needed to build the base of evidence elucidating the potential power of well-designed alcohol warning labels and what could be achieved if strong alcohol labels were widely implemented in jurisdictions around the world.
This study has a number of important strengths, including the quasi-experimental study design with a comparison site and three waves of data among cohort participants. Moreover, this is the first study internationally to experimentally test the impact of evidence-informed alcohol warning labels in a real-world setting. There are also a number of limitations to consider. First, the alcohol label intervention was halted by Canada’s alcohol industry only one month into the planned eight-month intervention period (Austen, 2018); however, a modified version of the intervention that excluded the cancer warning label restarted a few months later, for a total intervention period of four and half months. This compromised and briefer-than-intended intervention period may have attenuated the labels’ influence on outcomes; nevertheless, a labelling effect was detected for all five outcomes in this study. Next, the study cannot provide representative estimates of the population as participants were recruited from liquor stores in city centres using systematic recruitment methods. Nonetheless, given the stores from which the customers were recruited are virtual monopolies for the off-premise sale of alcohol in both experimental sites (Government of Northwest Territories, 2017; Government of Yukon, 2017), they will have been broadly representative of persons purchasing alcohol in those cities. The sample in this study includes a large percentage of participants who self-reported low levels of alcohol consumption, a population shown to be less defensive to health warning messages relative to higher level consumers (Brown & Locker, 2009). Lastly, the measures used were self-reported, which may be subject to response bias. Nevertheless, the extent of this bias would be constant across conditions and would not account for differences between experimental conditions over time.
Implications for global alcohol labeling policy
Our findings suggest that strengthening alcohol labelling policies should be a priority for alcohol control globally. While at least 47 countries have implemented alcohol warning labels, the label content, format, and size are largely inconsistent with best practices for product warning labels (Global Health Observatory Data Repository (European Region), 2019). Governments should consider strengthening alcohol label regulations as the delay in implementing strong labels constitutes a lost opportunity for increasing awareness of alcohol-related health risks, motivating drinkers to reduce their alcohol intake, and thereby decreasing alcohol-related harms and costs.
Conclusions
Strong alcohol labels designed according to best practices are an important global alcohol control policy. This study suggests that strengthening health messages on alcohol container labels increases attention to labels, processing of label messages, and self-reported reductions in drinking due to the labels. Strengthening alcohol labels should be a priority for alcohol control globally, including in Canada where federal law only requires alcohol manufacturers to list percentage alcohol by volume information on containers (Canadian Food Inspection Agency, 2019).
Acknowledgments
The authors would like to acknowledge all the Research Assistants that helped collect the data, as well as the liquor control boards, health and social services, and community partners in Yukon and Northwest Territories for their commitment and support in developing and executing this research. Special thanks also go to Mark Petticrew and Melanie Wakefield for their expertise and guidance. This research was supported by a Health Canada Substance Use and Addictions Program grant (No. 1718-HQ-000003). TKG was supported by a NIAAA grant (No. P50 AA005595).
Footnotes
Declaration of Competing Interest
The authors declare that they have no competing interests with the exception of Tim Stockwell, who received research funds and travel expenses from both the Swedish (Systembolaget) and Finnish (ALKO) government retail alcohol monopolies for the conduct of research into the impacts of their policies on alcohol consumption and related harm, Thomas K. Greenfield whose research has been partially supported by the National Alcohol Beverage Control Association (NABCA), and Catherine Paradis who received funds from Educ’alcool from 2008–2014. The funders had no role in the design of the study; in the collection, analyses, or interpretation of data; in the writing of the manuscript; or, in the decision to publish the results.
Supplementary materials
Supplementary material associated with this article can be found, in the online version, at doi:10.1016/j.drugpo.2020.102666.
References
- Al-Hamdani M (2014). The case for stringent alcohol warning labels: Lessons from to-bacco control experience. Journal of Public Health Policy, 35, 65–74. 10.1057/jphp.2013.47. [DOI] [PubMed] [Google Scholar]
- Al-Hamdani M, & Smith SM (2017). Alcohol warning label perceptions: Do warning sizes and plain packaging matter. Journal of Studies on Alcohol and Drugs, 78(1), 79–87. 10.15288/jsad.2017.78.79. [DOI] [PubMed] [Google Scholar]
- Al-Hamdani M, & Smith S (2015). Alcohol warning label perceptions: Emerging evidence for alcohol policy. Canadian Journal of Public Health, 106(6), e395–e400. 10.17269/cjph.106.5116. [DOI] [PMC free article] [PubMed] [Google Scholar]
- American Association for Public Opinion Research. (2011). Standard definitions: Final dispositions of case codes and outcome rates for surveys (7th ed.). Ann Arbor, MI: American Association for Public Opinion Research; Retrieved 15 August 2019 from https://www.esomar.org/uploads/public/knowledge-and-standards/codes-andguidelines/ESOMAR_Standard-Definitions-Final-Dispositions-of-Case-Codes-andOutcome-Rates-for-Surveys.pdf. [Google Scholar]
- Austen I (2018, January 6). Yukon government gives in to liquor industry on warning label experiment The New York Times. Retrieved 15 August 2019 from https://www.nytimes.com/2018/01/06/world/canada/yukon-liquor-alcohol-warnings.html. [Google Scholar]
- Babor T, Caetano R, Casswell S, Edwards G, Giesbrecht N, Hill L, et al. (2003). Alcohol: No ordinary commodity – Research and public policy. Oxford: Oxford University Press. [Google Scholar]
- Baron RM, & Kenny DA (1986). The moderator–mediator variable distinction in social psychological research: Conceptual, strategic, and statistical considerations. Journal of Personality and Social Psychology, 51(6), 1173–1182. 10.1037/0022-3514.51.6.1173. [DOI] [PubMed] [Google Scholar]
- Blackwell AK, Drax K, Attwood AS, Munafo MR, & Maynard OM (2018). Informing drinkers: Can current UK alcohol labels be improved? Drug and Alcohol Dependence, 192, 163–170. 10.1016/j.drugalcdep.2018.07.032. [DOI] [PMC free article] [PubMed] [Google Scholar]
- Borland R, Wilson N, Fong G, Hammond D, Cummings K, Yong H−H, et al. (2009). Impact of graphic and text warnings on cigarette packs: Findings from four countries over five years. Tobacco Control, 18, 358–364. 10.1136/tc.2008.028043. [DOI] [PMC free article] [PubMed] [Google Scholar]
- Brewer NT, Hall MG, Noar SM, Parada H, Stein-Seroussi A, Bach LE, et al. (2016). Effect of pictorial cigarette pack warnings on changes in smoking behaviour: A randomized clinical trial. JAMA Internal Medicine, 176, 905–912. 10.1001/jamainternmed.2016.2621. [DOI] [PMC free article] [PubMed] [Google Scholar]
- Brewer NT, Parada H, Hall MG, Boynton MH, Noar SM, & Ribisl KM (2019). Understanding why pictorial cigarette pack warnings increase quit attempts. Annals of Behavioral Medicine, 53, 232–243. 10.1093/abm/kay032. [DOI] [PMC free article] [PubMed] [Google Scholar]
- Brown S, & Locker E (2009). Defensive responses to an emotive anti-alcohol message. Psychology & Health, 24(5), 517–528. 10.1080/08870440801911130. [DOI] [PubMed] [Google Scholar]
- Butt P, Beirness D, Stockwell T, Gliksman L, & Paradis C (2011). Alcohol and health in Canada: A summary of evidence and guidelines for low-risk drinking. Ottawa: Canadian Centre on Substance Abuse; Retrieved 15 August 2019 from http://www.ccsa.ca/Resource%20Library/2011-Summary-of-Evidence-and-Guidelines-for-Low-Risk%20Drinking-en.pdf. [Google Scholar]
- Canadian Cancer Statistics Advisory Committee. (2018). Canadian cancer statistics: A 2018 special report on cancer incidence by stage. Toronto: Government of Canada; Retrieved 15 August 2019 from http://www.cancer.ca/~/media/cancer.ca/CW/cancer%20information/cancer%20101/Canadian%20cancer%20statistics/CanadianCancer-Statistics-2018-EN.pdf?la=en. [Google Scholar]
- Canadian Food Inspection Agency. (2019). Labelling requirements for alcoholic beverages. Retrieved 15 August 2019 from http://www.inspection.gc.ca/food/requirements-and-guidance/labelling/industry/alcohol/eng/1392909001375/1392909133296?chap=0#c6. [Google Scholar]
- Cantrell J, Vallone DM, Thrasher JF, Nagler RH, Feirman SP, Muenz LR, et al. (2013). Impact of tobacco-related health warning labels across socioeconomic, race, and ethnic groups: Results from a randomized web-based experiment. PloS One, 8, e52206 10.1371/journal.pone.0052206. [DOI] [PMC free article] [PubMed] [Google Scholar]
- Cheeta S, Halil A, Kenny M, Sheehan E, Zamyadi R, Williams AL, et al. (2018). Does perception of drug-related harm change with age? A cross-sectional online survey of young and older people. BMJ Open, 8(11), e021109 10.1136/bmjopen-2017-021109. [DOI] [PMC free article] [PubMed] [Google Scholar]
- Coomber K, Martino F, Barbour IR, Mayshak R, & Miller PG (2015). Do consumers ‘Get the facts’? A survey of alcohol warning label recognition in australia. BMC Public Health, 15, 816 10.1186/s12889-015-2160-0. [DOI] [PMC free article] [PubMed] [Google Scholar]
- Dossou G, Gallopel-Morvan K, & Diouf JF (2017). The effectiveness of current French health warnings displayed on alcohol advertisements and alcoholic beverages. European Journal of Public Health, 27, 699–704. 10.1093/eurpub/ckw263. [DOI] [PMC free article] [PubMed] [Google Scholar]
- Electronic Code of Federal Regulations. (1990). Title 27: Alcohol, tobacco products, and firearms Part 16-Alcoholic beverage health warning statement. Retrieved 14 August 2019 from http://www.ecfr.gov/cgi-bin/text-idx?c=ecfr;sid=33fc0c0194b58b6fe95208945b5c637a;rgn=div5;view=text;node=27%3A1.0.1.1.12;idno=27;cc=ecfr. [Google Scholar]
- Global Burden of Disease 2016 Alcohol Collaborators. (2018). Alcohol use and burden for 195 countries and territories, 1990–2016: A systematic analysis for the global burden of disease study 2016 Lancet (London, England), 392, 1015–1035. [DOI] [PMC free article] [PubMed] [Google Scholar]
- Global Health Observatory Data Repository (European Region). (2019). Health warning labels on alcohol containers by country. Retrieved 14 August 2019 from http://apps.who.int/gho/data/node.main-euro.A1193?lang=en&showonly=GISAH. [Google Scholar]
- Government of Northwest Territories. (2017). Northwest territories liquor commission 2016–2017: 63rd annual report. Hay River: Government of Northwest Territories; 2017. Retrieved 15 August 2019 from http://library.assembly.gov.nt.ca/2017/F/a373811_td_451-182_Northwest_Territories_Liquor_Commission_63rd_annual_report.pdf. [Google Scholar]
- Government of Yukon. (2017). Annual report: April 1, 2016 to March 31, 2017 Whitehorse: Yukon Liquor Corporation; Retrieved 15 August 2019 from http://www.ylc.yk.ca/pdf/YLC_annual_report_2016_17_WEB.pdf. [Google Scholar]
- Greenfield TK, Graves KL, & Kaskutas LA (1999). Long-term effects of alcohol warning labels: Findings from a comparison of the United States, Ontario and Canada. Psychology and Marketing, 16, 261–282. 10.1002/(sici)1520-6793(199905)16:3<261:Aid-mar5>3.0.co;2-z. [DOI] [Google Scholar]
- Greenfield TK (1997). Warning labels: Evidence of harm reduction from long-term American surveys In Plant M, Single E, & Stockwell T (Eds.). Alcohol: Minimizing the harm (pp. 105–125). London: Free Association Books. [Google Scholar]
- Hammond D (2011). Health warning messages on tobacco products: A review TobaccoControl, 20, 327–337. 10.1136/tc.2010.037630. [DOI] [PubMed] [Google Scholar]
- Hammond D, Fong GT, Borland R, Cummings KM, Mcneill A, & Driezen P(2007). Text and graphic warnings on cigarette packages: Findings from the international tobacco control four country study. American Journal of Preventive Medicine, 32, 202–209. 10.1016/j.amepre.2006.11.011. [DOI] [PMC free article] [PubMed] [Google Scholar]
- Heeb J−L, & Gmel G. (2005). Measuring alcohol consumption: A comparison of graduated frequency, quantity frequency, and weekly recall diary methods in a general population survey. Addictive Behaviors, 30, 403–413. 10.1016/j.addbeh.2004.04.022. [DOI] [PubMed] [Google Scholar]
- Hilton ME (1993). An overview of recent findings on alcoholic beverage warning labels. Journal of Public Policy & Marketing, 12, 1–9. 10.1177/074391569501200101. [DOI] [Google Scholar]
- Hitchman SC, Driezen P, Logel C, Hammond D, & Fong GT (2014). Changes in effectiveness of cigarette health warnings over time in Canada and the United States, 2002–2011. Nicotine & Tobacco Research, 16, 536–543. 10.1093/ntr/ntt196. [DOI] [PMC free article] [PubMed] [Google Scholar]
- Hobin E, Shokar S, Vallance K, Hammond D, McGavock J, Greenfield T, et al. (2020). Communicating risks to drinkers: Testing alcohol labels with a cancer warning and national drinking guidelines in Canada. Manuscript submitted for publication. [DOI] [PMC free article] [PubMed] [Google Scholar]
- Hobin E, Vallance K, Zuo F, Stockwell T, Rosella L, Simniceanu A, et al. (2018). Testing the efficacy of alcohol labels with standard drink information and national drinking guidelines on consumers’ ability to estimate alcohol consumption. Alcohol and Alcoholism, 53, 3–11. 10.1093/alcalc/agx052. [DOI] [PubMed] [Google Scholar]
- Hobin E, Weerasinghe A, Vallance K, Hammond D, McGavock J, Greenfield TK, Schoueri-Mychasiw N, Paradis C, & Stockwell T (2020). Testing alcohol labels as a tool to communicate cancer risk to drinkers: a real-world quasi-experimental study. JSAD Submitted for publication. [DOI] [PMC free article] [PubMed] [Google Scholar]
- IARC Working Group on the Evaluation of Carcinogenic Risks to Humans (2010). Alcohol consumption and ethyl carbamate. IARC monograph on the evaluation of carcinogenic risks to humans, 96, 3–1383. [PMC free article] [PubMed] [Google Scholar]
- IARC Working Group on the Evaluation of Carcinogenic Risks to Humans (2012). Personal habits and indoor combustions. IARC monograph on the evaluation of carcinogenic risks to humans, 100, 1–538. [PMC free article] [PubMed] [Google Scholar]
- Jarlais DCD, Lyles C, & Crepaz N (2004). Improving the reporting quality of nonrandomized evaluations of behavioral and public health interventions: The trend statement. American Journal of Public Health, 94, 361–366. 10.2105/ajph.94.3.361. [DOI] [PMC free article] [PubMed] [Google Scholar]
- Kaskutas L, & Greenfield TK (1992). First effects of warning labels on alcohol beverage containers. Drug and Alcohol Dependence, 31, 1–14. 10.1016/0376-8716(92)90002-t. [DOI] [PubMed] [Google Scholar]
- Loconte NK, Brewster AM, Kaur JS, Merrill JK, & Alberg AJ (2018). Alcohol and cancer: A statement of the American Society of Clinical Oncology. Journal of Clinical Oncology, 36, 83–93. 10.1200/jco.2017.76.1155. [DOI] [PubMed] [Google Scholar]
- Martin-Moreno JM, Harris ME, Breda J, Moller L, Alfonso-Sanchez JL, &Gorgojo L. (2013). Enhanced labelling on alcoholic drinks: Reviewing the evidence to guide alcohol policy. European Journal of Public Health, 23, 1082–1087. 10.1093/eurpub/ckt046 [DOI] [PubMed] [Google Scholar]
- Mays D, Villanti A, Niaura RS, Lindblom EN, & Strasser AA (2019). The effects of varying electronic cigarette warning label design features on attention, recall and product perceptions among young adults. Health Communication, 34(3), 317–324. 10.1080/10410236.2017.1372050. [DOI] [PMC free article] [PubMed] [Google Scholar]
- McGuire W (1989). Theoretical foundations of campaigns In Rice RE, & Atkin C (Eds.). Public communication campaigns (pp. 43–67). Newbury Park: SAGE. [Google Scholar]
- McKinnon D, Nohre L, Pentz M, & Stacy A (2000). The alcohol warning and adolescents: 5-year effects. American Journal of Public Health, 90, 1589–1594. 10.2105/ajph.90.10.1589. [DOI] [PMC free article] [PubMed] [Google Scholar]
- Murray F (2017). Ireland’s public health bill: Crucial to reduce alcohol harm. Lancet (London, England), 390, 2222–2223. 10.1016/s0140-6736(17)32759-9. [DOI] [PubMed] [Google Scholar]
- Nour SM, Francis DB, Bridges C, Sontag JM, Brewer NT, & Ribisl KM (2017). Effects of strengthening cigarette pack warnings on attention and message processing: A systematic review. Journalism & Mass Communication Quarterly, 94, 416–442. 10.1177/1077699016674188. [DOI] [PMC free article] [PubMed] [Google Scholar]
- Pepe MS (2003). The statistical evaluation of medical tests for classification and prediction. Oxford: Oxford University Press; 35–64. [Google Scholar]
- Pettigrew S, Jongenelis MI, Glance D, Chikritzhs T, Pratt IS, Slevin T, et al. (2016). The effect of cancer warning statements on alcohol consumption intentions. Health Education Research, 31, 60–69. 10.1093/her/cyv067. [DOI] [PMC free article] [PubMed] [Google Scholar]
- Petty RE, & Cacioppo JT (1986). The elaboration likelihood model of persuasion. Advances in Experimental Social Psychology, 19, 123–205. 10.1016/s0065-2601(08)60214-2. [DOI] [Google Scholar]
- Praud D, Rota M, Rehm J, Shield K, Zatoński W, Hashibe M, et al. (2016). Cancer incidence and mortality attributable to alcohol consumption. International Journal of Cancer, 138, 1380–1387. 10.1002/ijc.29890. [DOI] [PubMed] [Google Scholar]
- Purmehdi M, Legoux R, Carrillat F, & Senecal S (2016). The effectiveness of warning labels for consumers: A meta-analytic investigation into their underlying process and contingencies. Journal of Public Policy & Marketing, 36, 36–53. 10.1509/jppm.14.047. [DOI] [Google Scholar]
- Schoueri-Mychasiw N, Weerasinghe A, Vallance K, Hammond D, McGavock J,Greenfield TK et al. (2020). Examining the impact of alcohol labels on awareness and knowledge of national drinking guidelines: a real-world study in Yukon, Canada. JSAD Accepted for publication. [DOI] [PMC free article] [PubMed] [Google Scholar]
- Sillero-Rejon C, Attwood AS, Blackwell AKM, Ibáñez-Zapata J−A, Munafò MR, & Maynard OM. (2018). Alcohol pictorial health warning labels: The impact of self-affirmation and health warning severity. BMC Public Health, 18, 1403. [DOI] [PMC free article] [PubMed] [Google Scholar]
- Sillero-Rejon C, Maynard O, & Ibanez-Zapata J (2019). Visual attention to alcohol labels: An exploratory eye-tracking experiment. Adicciones, 0(0), 1207. [DOI] [PubMed] [Google Scholar]
- Stafford LD, & Salmon J (2017). Alcohol health warnings can influence the speed of consumption. Journal of Public Health, 25, 147–154. 10.1007/s10389-016-0770-3. [DOI] [PMC free article] [PubMed] [Google Scholar]
- Stockley CS (2001). The effectiveness of strategies such as health warning labels to reduce alcohol-related harms – an Australian perspective. International Journal of Drug Policy, 12, 153–166. 10.1016/s0955-3959(01)00077-9. [DOI] [PubMed] [Google Scholar]
- Strahan EJ, White K, Fong GT, Fabrigar LR, Zanna MP, & Cameron R (2002). Enhancing the effectiveness of tobacco package warning labels: A social psychological perspective. Tobacco Control, 11, 183–190. 10.1136/tc.11.3.183. [DOI] [PMC free article] [PubMed] [Google Scholar]
- Tam TW, & Greenfield TK (2010). Do alcohol warning labels influence men’s and women’s attempts to deter others from driving when intoxicated? Human Factors and Ergonomics in Manufacturing & Service Industries, 20, 538–546. 10.1002/hfm.20239. [DOI] [PMC free article] [PubMed] [Google Scholar]
- Tannenbaum MB, Hepler J, Zimmerman RS, Saul L, Jacobs S, Wilson K, et al. (2015). Appealing to fear: A meta-analysis of fear appeal effectiveness and theories. Psychological Bulletin, 141(6), 1178–1204. [DOI] [PMC free article] [PubMed] [Google Scholar]
- Thomson LM, Vandenberg B, & Fitzgerald JL (2012). An exploratory study of drinkers views of health information and warning labels on alcohol containers. Drug and Alcohol Review, 31, 240–247. 10.1111/j.1465-3362.2011.00343.x. [DOI] [PubMed] [Google Scholar]
- Vallance K, Romanovska I, Stockwell T, Hammond D, Rosella L, & Hobin E(2018). “We have a right to know”: Exploring consumer opinions on content, design and acceptability of enhanced alcohol labels. Alcohol and Alcoholism, 53, 20–25. 10.1093/alcalc/agx068. [DOI] [PubMed] [Google Scholar]
- Vallance K, Stockwell T, Hammond D, Shokar S, Schoueri-Mychasiw N, Greenfield TK, et al. (2020). Testing the effectiveness of enhanced alcohol warning labels and modifications resulting from alcohol industry interference in Yukon, Canada: protocol for a pre-post quasi-experimental study. JMIR Research Protocols, 9(1): January. [DOI] [PMC free article] [PubMed] [Google Scholar]
- Weiss BD, Mays MZ, Martz W, Castro KM, DeWalt DA, Pignone MP, et al. (2005). Quick assessment of literacy in primary care: The newest vital sign. The Annals of Family Medicine, 3, 514–522. 10.1370/afm.405. [DOI] [PMC free article] [PubMed] [Google Scholar]
- Wettlaufer A (2018). Can a label help me drink in moderation? a review of the evidence on standard drink labelling. Substance Use & Misuse, 53, 585–595. 10.1080/10826084.2017.1349798. [DOI] [PubMed] [Google Scholar]
- World Health Organization; (2010). Global strategy to reduce the harmful use of alcohol Geneva: World Health Organization. Retrieved 15 August 2019 from https://www.who.int/substance_abuse/msbalcstragegy.pdf. [DOI] [PMC free article] [PubMed] [Google Scholar]
- World Health Organization. (2014). Global status report on non-communicable diseases. Geneva: World Health Organization; Retrieved 15 August 2019 from https://apps.who.int/iris/bitstream/handle/10665/148114/9789241564854_eng.pdf;jsessionid=D3FC185F96DD242E850EDF1AA575107C?sequence=1. [Google Scholar]
- World Health Organization. (2017). Alcohol labelling: A discussion document on policy options. Copenhagen: WHO Regional Office for Europe; Retrieved 15 August 2019 from http://www.euro.who.int/__data/assets/pdf_file/0006/343806/WH07_Alcohol_Labelling_full_v3.pdf. [Google Scholar]
- World Health Organization; (2019). 10 areas governments could work with to reduce the harmful use of alcohol. Retrieved 15 August 2019 from https://www.who.int/newsroom/feature-stories/detail/10-areas-for-national-action-on-alcohol. [Google Scholar]
- Zhao J, Stockwell T, Vallance K, & Hobin E (2020). The effects of alcohol warning labels on population alcohol consumption: An interrupted time-series analysis of alcohol sales in Yukon, Canada. JSAD Submitted for publication. [PubMed] [Google Scholar]