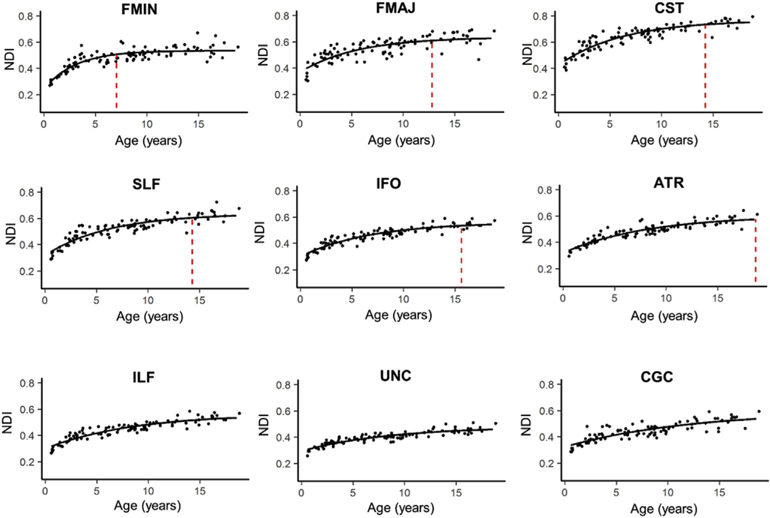
Fig. 3. Age-related NDI increases in major white matter tracts with exponential fits.
NDI values are averaged across the left and right hemispheres for each tract. Maximum NDI plateau of each tract are marked by the vertical dotted red lines and plots are ordered according to how quickly the tract reaches the NDI plateau. The ILF, UNC and CGC are not marked because these tracts reach the NDI plateau outside the age range explored. Parameters for the exponential fits for each tract are presented in Table 1.

