Abstract
Purpose:
To assess short-term and long-term variability on standard automated perimetry (SAP) and spectral domain optical coherence tomography (SD-OCT) in glaucoma.
Design:
Prospective cohort.
Methods:
Ordinary least squares linear regression of SAP mean deviation (MD) and SD-OCT global retinal nerve fiber layer (RNFL) thickness were fitted over time for sequential tests conducted within 5 weeks (short-term testing) and annually (long-term testing). Residuals were obtained by subtracting the predicted and observed values and each patient’s standard deviation (SD) of the residuals was used as a measure of variability. Wilcoxon signed-rank test was performed to test the hypothesis of equality between short-term and long-term variability.
Results:
Forty-three eyes of 43 glaucoma subjects were included. Subjects had (mean ± SD) 4.5 ± 0.8 SAP and OCT tests for short-term variability assessment. For long-term variability the same number of tests was performed and annually collected over an average of 4.0 ± 0.8 years. The average SD of the residuals was significantly higher in the long-term vs. short-term period for both tests: 1.05 ± 0.70 dB vs. 0.61 ± 0.34 dB (P<0.001) for SAP MD and 1.95 ± 1.86 μm vs. 0.81 ± 0.56 μm (P<0.001) for SD-OCT RNFL thickness.
Conclusion:
Long-term variability was higher than short-term variability on SD-OCT and SAP. Since current event-based algorithms for detection of glaucoma progression on SAP and SD-OCT have relied on short-term variability data to establish their normative databases, these algorithms may be underestimating the variability in the long-term and thus may overestimate progression over time.
TABLE OF CONTENTS
This was a prospective longitudinal study to assess short- and long-term variability on spectral domain optical coherence tomography and standard automated perimetry. The results showed that long-term variability was higher than short-term variability on both tests. These findings suggest that event-based algorithms for detection of glaucoma progression that rely on short-term variability to establish normative databases may overestimate progression over time.
INTRODUCTION
Glaucoma is characterized by a progressive optic neuropathy with corresponding patterns of visual field loss.1 Monitoring and detection of glaucoma progression over time is paramount in management and clinical decision making, such as when to initiate or escalate therapy.2 However, despite the availability of numerous functional and structural tests for monitoring glaucoma, such as standard automated perimetry (SAP) and optical coherence tomography (OCT), detection of progression remains a very challenging aspect of clinical practice.
Effective detection of progression depends fundamentally on the ability to differentiate true change from test-retest variability. Since glaucoma is usually a slowly progressive disease, true changes are not expected to occur over relatively short time frames. This has been used as the basis for establishing normative databases of variability by conducting repeated testing over short periods of time in glaucomatous eyes, usually within a few weeks, and calculating confidence limits or tolerance intervals of variability.3 If a patient subsequently is found to have a change that is greater than those confidence limits, this patient is deemed to have progressed. Such approach has been used by the so-called event-based algorithms for detecting progression such as the Guided Progression Analysis (GPA software [Carl Zeiss Meditec, Dublin CA]) for SAP.4 In the GPA, follow-up tests are compared to baseline ones and if a number of points show a change that exceeds the expected variability, the eye is declared as likely progressing. The GPA has been widely used in clinical practice and clinical trials and has also been recently extended for detecting structural progression on OCT.4, 5
Establishing normative levels of variability based on short-term test-retest may, however, be problematic. Glaucoma patients and those suspected of having the disease are monitored over the course of many years and there are reasons to believe that the long-term variability may be different than the short-term one. Short-term studies of variability tend to enroll well-experienced patients that not uncommonly have participated in other studies and are thus usually highly cooperative and motivated.6 Also, technicians tend to be skilled and remain the same throughout the study. In contrast, in “real-world” long-term monitoring, we are likely to encounter much less motivated patients who may also have intercurrent conditions affecting test quality. Long-term testing is likely to be done by different technicians showing a variety of degrees of training and expertise. If long-term variability is significantly different than the short-term one, then the algorithms for detection of progression that rely on confidence limits of variability from short-term test-retest may provide spurious assessment of whether true change has occurred or not.
In this study, we compared the test-retest estimates of short- and long-term variability of SAP and spectral domain OCT measurements in a cohort of glaucoma patients followed over time.
METHODS
Participants from this study were consecutively recruited from the clinic and were enrolled in a prospective longitudinal study designed to evaluate functional impairment in glaucoma. The Institutional Review Board approved all methods, and written informed consent was obtained from all participants. The methodology complied with the Declaration of Helsinki guidelines for human subject research, and this study adhered to the laws of the Health Insurance Portability and Accountability Act.
Patients underwent a comprehensive ophthalmologic examination, including review of medical history, visual acuity, slit-lamp biomicroscopy, intraocular pressure (IOP) measurement using Goldmann applanation tonometer, gonioscopy and dilated fundoscopy using a 78-diopter lens every six months. In addition, all patients included in this study were required to have open angles, visual acuity ≥ 20/40, and spherical equivalent < 3.0 diopters throughout the study. Subjects with coexisting retinal disease, uveitis, or any systemic disease that could affect the optic nerve head or the visual field were excluded. Subjects that had undergone cataract surgery during the follow-up period were also excluded.
All patients underwent SAP tests using the 24–2 Swedish Interactive Threshold Algorithm (SITA) standard of the Humphrey Field Analyzer II (Carl Zeiss Meditec, Inc, Dublin, CA). Only reliable visual fields with less than 15% false positives and less than 33% fixation losses were included, and the first 2 reliable exams were excluded in order to avoid learning effects. SAP exams with the presence of eyelid artifacts, rim artifacts, or other evidence of artifactual visual field defects not related to glaucoma were also excluded.
Patients also had testing with the Spectralis spectral domain-OCT (SD-OCT) (software version 5.4.7.0; Heidelberg Engineering, Heidelberg, Germany) to measure the peripapillary retinal nerve fiber layer (RNFL) thickness. For SD-OCT, axial length and corneal curvature measurements were entered into the instrument software to ensure accurate scaling of all measurements, and the device’s eye-tracking capability was used during image acquisition to ensure that the same location of the retina was scanned over time. Images were excluded if the signal strength was < 15 dB, or if they were inverted or clipped. The global circumpapillary RNFL thickness was used as the study metric and corresponded to the 360° average measure of the 1,535 A-scan points acquired from a circle of 3.45 mm centered on the optic disc, which was automatically calculated by the SD-OCT software. In this study, the pool of technicians performing perimetry and SD-OCT consisted of 5 experienced and trained technicians. However, each subject was not necessarily tested by the same technician over the course of the study.
Glaucoma diagnosis was defined as the presence of at least two consecutive reliable SAP tests with abnormalities at baseline (pattern standard deviation with P<0.05 and/or glaucoma hemifield test results outside normal limits) with corresponding optic nerve damage (i.e., neuroretinal rim thinning, cupping, notching, or characteristic RNFL defects). Only patients with open angle glaucoma in at least one eye were included in the study. If both eyes of the same patient met the criteria, one eye was randomly chosen for the analysis.
Estimation of Long-Term and Short-term Variability
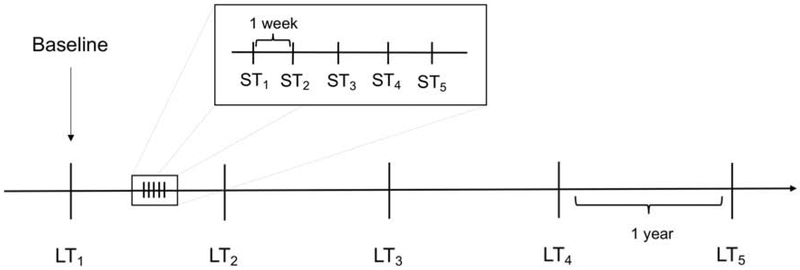
Figure 1 illustrates the timeline of the visits included in the determination of long-term and short-term variabilities. Annual SAP and SD-OCT visits were used to estimate long-term variability. To estimate short-term variability, subjects were invited to perform a sequence of 5 additional weekly visits at some point during follow-up. The number of short-term and long-term visits were matched for each subject. The same method was used to estimate variability for both the long-term as well as short-term testing, consisting of fitting ordinary least squares (OLS) linear regression models of the parameter of interest over time and then using the standard deviation (SD) of the residuals of the OLS model as an estimate of variability. This approach has been previously described7–14 and was applied in the current study for SAP MD as well as for SD-OCT global RNFL thickness. The SD of residuals was used to determine short- and long-term variability as it gives a measure of variability that is less affected by the possibility of progression over time, assuming that any progression within the observed period would be linear. For the long-term variability, only the annual visits were used for the OLS model. For the short-term variability, only the weekly visits were used.
Figure 1.
Timeline illustrating an example of short-term and long-term visits typical of the study patients. In the example represented below, five short-term tests (weekly) were compared with five long-term tests (annually) of the same eye. ST = short-term visit. LT = long-term visit. Long-term visits were selected to match the number of short-term visits.
Statistical Analysis
To test the hypothesis that long-term and short-term variability are different, we analyzed the difference in the SD of the residuals over long-term and short-term visits for both SAP MD and SD-OCT RNFL thickness. To make this comparison we used the Wilcoxon signed-rank test, because the data was paired and not normally distributed (confirmed by a Shapiro-Wilk test).
We investigated the relationship between the differences in SD of residuals for long- and short-term variability and disease severity for each test. Since the relationships were not linear, a quadratic curve was fit. In addition, we used Spearman’s rank correlation to analyze the correlation between long- and short- term variability for all eyes and the correlation of the difference between long- and short-term variability and age. All statistical analyses were performed using Stata (version 15.1, StataCorp, College Station, TX). The α level (type I error) was set at 0.05.
RESULTS
The study included 43 eyes of 43 subjects with a mean age of 71.2 ± 9.7 years and an average follow-up time of 4.0 ± 0.8 years. Subjects had (mean ± SD) 4.5 ± 0.8 short-term visits matched with the same number of long-term visits during the study period. Demographic and clinical characteristics of the enrolled subjects are displayed in Table 1.
Table 1.
Demographic and clinical characteristics of the study patients at baseline.
| Variable | 43 subjects (43 eyes) |
|---|---|
| Age (years) | 71.2 ± 9.7 |
| Gender (female, %) | 19 (44) |
| Race | |
| (Caucasian, %) | 24 (56) |
| (African-American descendent, %) | 14 (32) |
| (Asian, %) | 4 (9) |
| (American Indian or Alaska Native, %) | 1 (2) |
| IOP (mmHg) | 14.9 ± 4.9 |
| SAP 24–2 baseline MD, dB | −8.4 [−25.1, 0.3]a |
| RNFL global thickness at baseline (μm) | 69.8 ± 20.8 |
Values are presented as mean ± standard deviation, unless otherwise noted.
IOP: intraocular pressure; SAP: standard automated perimetry; MD: mean deviation; RNFL: retinal nerve fiber layer.
Values given as median [interquartile range]
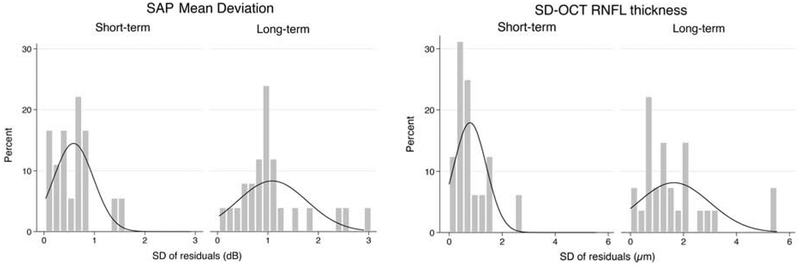
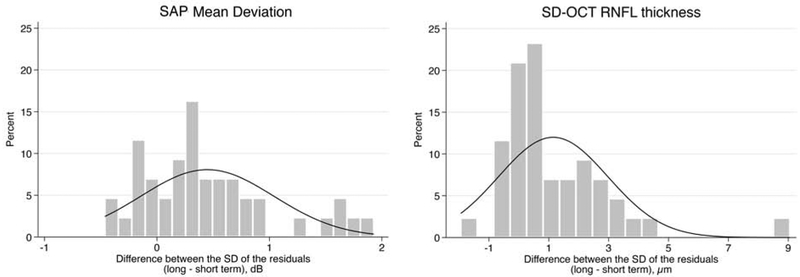
Results for short- and long-term variability for each test are summarized on Table 2. The average SD of the residuals was significantly greater in the long-term testing compared to the short-term testing for both SAP MD (1.05 ± 0.70 dB vs. 0.61 ± 0.34 dB; mean difference, 0.44 dB; 95% CI, 0.26 – 0.63, P < 0.001) and SD-OCT global RNFL thickness (1.95 ± 1.86 μm vs. 0.81 ± 0.56 μm; mean difference, 1.15 μm; 95% CI, 0.58 – 1.71, P < 0.001). Figure 2 illustrates the distribution of the SD of the residuals for both short-term and long-term testing in both modalities. There was a greater spread in the distribution of the SD of residuals in the long-term testing compared to the short-term testing for both SAP and SD-OCT. Figure 3 illustrates the distributions of the differences in the long- and short-term SD of the residuals for SAP MD and SD-OCT. There was a moderate correlation between short- and long-term SD of residuals for SAP MD (rho = 0.39, P = 0.009), but a weak correlation for SD-OCT global RNFL thickness (rho = 0.28, P = 0.064).
Table 2.
Comparison of short-term and long-term variability for standard automated perimetry (SAP) and spectral-domain optical coherence tomography (SD-OCT).
| SD of residuals Short-term | SD of residuals Long-term | P-value | |
|---|---|---|---|
| SAP MD (dB) | 0.61 ± 0.34 | 1.05 ± 0.70 | <0.001a |
| SD-OCT global RNFL thickness (μm) | 0.81 ± 0.56 | 1.95 ± 1.86 | <0.001a |
Values are presented as mean ± standard deviation
SD: Standard Deviation; MD: Mean Deviation; RNFL: Retinal Nerve Fiber Layer
Wilcoxon signed-rank test.
Figure 2.
Distribution of the standard deviation of the residuals for both short-term and long-term visits of standard automated perimetry (SAP) mean deviation (Left) and spectral-domain optical coherence tomography (SD-OCT) retinal nerve fiber layer thickness (Right).
Figure 3.
Distribution of the difference over long-term and short-term visits in the standard deviation (SD) of the residuals for both standard automated perimetry (SAP) mean deviation (Left) and spectral-domain optical coherence tomography (SD-OCT) retinal nerve fiber layer (RNFL) thickness (Right).
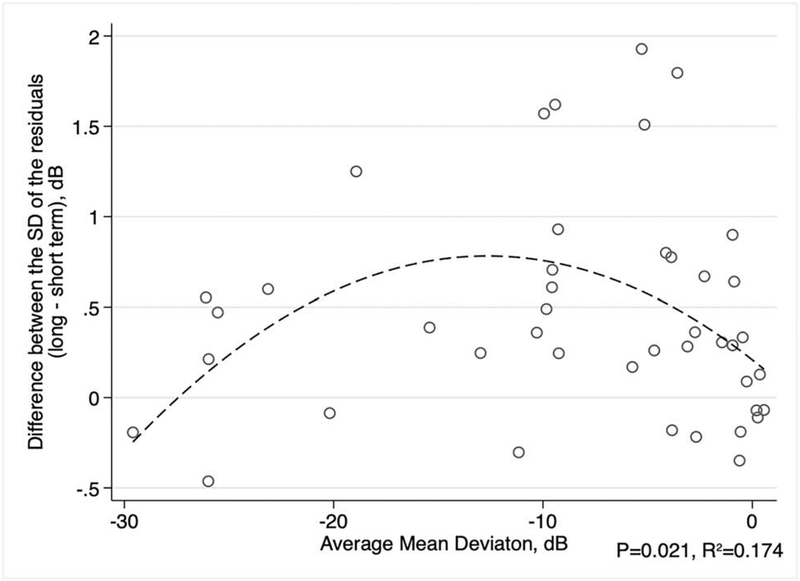
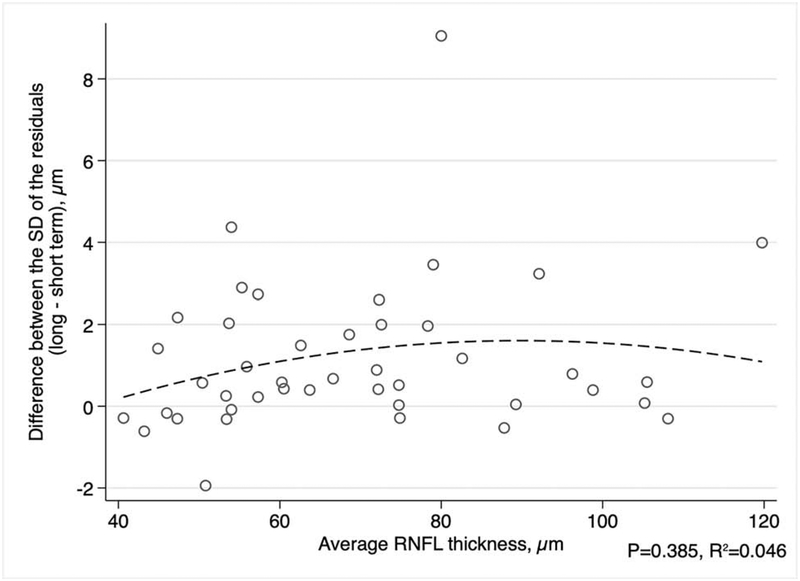
We next investigated the relationship between differences in short- and long-term variability and disease severity. A quadratic model was used to describe the relationship between the difference of the SD of residuals and either the average of all MDs or the average of all RNFL thickness measurements for each eye, since these relationships were not linear (Figures 4 and 5). There was a significant relationship between the difference in short- and long-term SD of residuals and average MD (R2 = 0.174, P = 0.021). The difference in the SD of the residuals appeared to be greatest for eyes with average MD around −12 dB (Figure 4). For SD-OCT, the difference in the SD of the residuals in long-term and short-term testing did not significantly vary with the average global RNFL thickness (R2 = 0.046, P = 0.385; Figure 5). In addition, we studied the correlation of the difference in long- and short-term variability and the subjects’ average age during the study period. We found that the difference in long- and short-term SD of the residuals had a weak correlation with age for SAP MD (rho = 0.24, P = 0.033) and a moderate correlation with RNFL thickness (rho = 0.45, P = 0.014).
Figure 4.
Scatterplot between the average standard automated perimetry (SAP) mean deviation (MD) for each eye and the average difference in the standard deviation (SD) of the residuals (long-term minus short-term variability). The dashed line represents a quadratic fit.
Figure 5.
Scatterplot between the average RNFL (retinal nerve fiber layer) thickness for each eye and the average difference in the standard deviation (SD) of the residuals (long-term minus short-term variability). The dashed line represents a quadratic fit.
DISCUSSION
Since glaucoma is usually a slowly progressive disease, short-term testing has been used to help clinicians to identify thresholds of expected normal variability.15, 16 In this study, we showed that the structural and functional variability seen in measurements acquired during long-term testing is significantly greater than the variability seen in measurements taken during short-term follow-up. This may have significant implications to determine whether true progression has occurred or not when using event-based algorithms to assess progression. To our knowledge, this is the first study to evaluate the differences in long-term and short-term variability for both SAP and SD-OCT in glaucoma patients.
In this study, long-term variability was 1.7 and 2.4 times higher than short-term variability for SAP and SD-OCT, respectively. A previous study using computer simulations of MD variability over time suggested that the SAP variability must be reduced by approximately 20% for a clinically appreciable improvement in detection of visual field change.17 Therefore, using a similar reasoning, an increase of 70% in variability would likely result in a clinically appreciable worsening in the ability to detect visual field change in the long-term. For SD-OCT, it is likely that a variability that is over two times when assessed in the long versus the short-term is also likely to be impactful in the ability to detect change with this instrument.
Our findings confirm that the difference between long- and short- term variability of SAP MD tends to increase as MD values worsen, although not in a linear way.9, 18 Figure 4 illustrates that the differences in long- and short-term variability increased with increasing visual field loss, peaking at values around −12dB and then declining as visual field damage becomes more severe and gets closer to the floor level. For SD-OCT, although the difference in short- and long-term variability peaked around 90μm, the relationship with disease severity was not statistically significant. The factors explaining differences between long- and short-term variability according to levels of damage are likely to be related to the precision of the instruments at different levels of disease and the dynamic range of the tests.
Previous studies have similarly found that long-term variability exceeds short-term variability, but they have used different approaches and instruments. Medeiros et al. evaluated the estimates of long-term variability in stable glaucoma patients using a different instrument (GDx VCC) to measure RNFL thickness.19 Long-term variability was calculated as 1.96 times the inter-visit SD and the short-term variability as 1.96 times the intra-visit SD. The long-term variability estimates ranged from 3.21 to 4.97μm whereas the short-term ranged from 2.45 to 3.89μm. Our results for long-term variability are comparable to what Gardiner et al. have reported.7 They studied the longitudinal signal-to-noise ratios in structural and functional tests using the SD of the residuals from the OLS over time to measure the long-term variability of RNFL thickness on Spectralis SD-OCT and SAP MD. Short-term variability was not studied, though. For RNFL thickness the SD of the residuals was 1.76 μm and for SAP MD it was 0.58 dB. However, they used a shorter testing interval of 6 months rather than 12 months, which may explain why the long-term variability is slightly smaller in their study compared to ours. In another study, Katz et al. have found that for normal eyes, visual field tests acquired with longer intervals also had greater variability compared to tests taken only one week apart.20 However, their results cannot be directly compared to ours since they tested only healthy subjects.
Regardless of the data modality studied for progression detection, structural or functional, our study showed that long-term and short-term variabilities are different. The reasons for this are likely multifactorial.21 Subjects enrolled in studies that undergo visual field and imaging testing in short periods of time are likely to be better test takers than patients routinely followed in clinical practice.3, 22 Furthermore, it is likely that multiple technicians with different skills, experience and supervision will perform the tests in the long-term. Subjects followed in the long-term may be less motivated to undergo routine exams and are more likely to be tested under different conditions that can affect test performance and increase variability. For example, changes in environmental and ocular conditions (e.g. media opacities due to dry eyes), psychological factors and physical ability (e.g. difficulty to properly position themselves without tilting the head during the test) are all likely to affect test performance in the long run.14, 21, 23–25. Even though we have only included subjects with visual acuity better than 20/40 throughout the study period, it is possible - and expected - that some of these eyes might have developed cataract during the follow-up. This could play a role in the larger variability found in the long compared to the short-term. However, this replicates the clinical practice scenario as patients are being followed over time.
Our study has limitations. We used the residuals of OLS regression to estimate variability. This assumes that any progression, if occurring, would be linear. This may not be strictly true, especially for SAP MD.26 However, although changes over the full course of the disease are unlikely to be truly linear, the assumption of linearity is a very sensible one for periods encompassing just a few years27, as in the current study. Of note, clinical management decisions are usually made taking into account tests collected over similar periods of time in clinical practice. As another limitation, we did not analyze SAP pointwise sensitivities or sectoral RNFL changes, as done in many event-based algorithms.3, 4, 28, 29 However, it is likely that differences in short- and long-term variability would be even greater if we were to look at localized sectors, as these have been shown overall to have greater variability.30, 31
In conclusion, this study showed that long-term variability is significantly greater than short-term variability for both structural and functional tests in glaucoma. Our results underscore the importance of accounting for the greater variability that occurs during long-term testing when developing algorithms that detect progression in glaucoma, since algorithms that use short-term testing to establish normative levels of variability will tend to overestimate progression over time and could lead to inappropriate escalation of therapy in patients with clinically stable disease.
Supplementary Material
ACKNOWLEDGMENTS/DISCLOSURE:
a. Funding/Support: This work was supported in part by the National Institutes of Health / National Eye Institute [grant numbers EY029885 (F.A.M.), EY027651 (F.A.M.) and EY021818 (F.A.M.)].
b. Financial Disclosures: Felipe A. Medeiros: Alcon Laboratories (C, L, S), Allergan (C, L), Bausch&Lomb (F), Carl Zeiss Meditec (C, L, S), Heidelberg Engineering (L), Merck (L), nGoggle Inc. (P), Sensimed (C), Topcon (C), Reichert (C, S), National Institutes of Health/National Eye Institute (S). The following authors have no financial disclosures: Carla N. Urata, Eduardo B. Mariottoni, Alessandro A. Jammal, Nara G. Ogata, Atalie C. Thompson, Samuel I. Berchuck, Tais Estrela.
BIOSKETCH
Carla N Urata, MD is a research fellow at the Vision, Imaging and Performance Laboratory at Duke Eye Center, Duke University, USA. She is an ophthalmologist and clinical researcher that completed her residency and clinical and surgical glaucoma fellowship at Santa Casa of São Paulo, Brazil. Her current research interests include variability in glaucoma, visual function, quality of life and glaucoma.
Footnotes
Publisher's Disclaimer: This is a PDF file of an unedited manuscript that has been accepted for publication. As a service to our customers we are providing this early version of the manuscript. The manuscript will undergo copyediting, typesetting, and review of the resulting proof before it is published in its final form. Please note that during the production process errors may be discovered which could affect the content, and all legal disclaimers that apply to the journal pertain.
REFERENCES
- 1.Weinreb RN, Aung T, Medeiros FA. The pathophysiology and treatment of glaucoma: a review. JAMA 2014;311(18):1901–11. [DOI] [PMC free article] [PubMed] [Google Scholar]
- 2.Prum BE Jr., Lim MC, Mansberger SL, et al. Primary Open-Angle Glaucoma Suspect Preferred Practice Pattern((R)) Guidelines. Ophthalmology 2016;123(1):P112–51. [DOI] [PubMed] [Google Scholar]
- 3.Artes PH, O’Leary N, Nicolela MT, Chauhan BC, Crabb DP. Visual field progression in glaucoma: what is the specificity of the Guided Progression Analysis? Ophthalmology 2014;121(10):2023–7. [DOI] [PubMed] [Google Scholar]
- 4.Arnalich-Montiel F, Casas-Llera P, Munoz-Negrete FJ, Rebolleda G. Performance of glaucoma progression analysis software in a glaucoma population. Graefes Arch Clin Exp Ophthalmol 2009;247(3):391–7. [DOI] [PubMed] [Google Scholar]
- 5.Lee EJ, Kim TW, Weinreb RN, Park KH, Kim SH, Kim DM. Trend-based analysis of retinal nerve fiber layer thickness measured by optical coherence tomography in eyes with localized nerve fiber layer defects. Invest Ophthalmol Vis Sci 2011;52(2):1138–44. [DOI] [PubMed] [Google Scholar]
- 6.Chauhan BC, Johnson CA. Test-retest variability of frequency-doubling perimetry and conventional perimetry in glaucoma patients and normal subjects. Invest Ophthalmol Vis Sci 1999;40(3):648–56. [PubMed] [Google Scholar]
- 7.Gardiner SK, Fortune B, Demirel S. Signal-to-Noise Ratios for Structural and Functional Tests in Glaucoma. Transl Vis Sci Technol 2013;2(6):3. [DOI] [PMC free article] [PubMed] [Google Scholar]
- 8.Wu Z, Medeiros FA. Impact of Different Visual Field Testing Paradigms on Sample Size Requirements for Glaucoma Clinical Trials. Sci Rep 2018;8(1):4889. [DOI] [PMC free article] [PubMed] [Google Scholar]
- 9.Wu Z, Medeiros FA. Development of a Visual Field Simulation Model of Longitudinal Point-Wise Sensitivity Changes From a Clinical Glaucoma Cohort. Transl Vis Sci Technol 2018;7(3):22. [DOI] [PMC free article] [PubMed] [Google Scholar]
- 10.Gracitelli CPB, Zangwill LM, Diniz-Filho A, et al. Detection of Glaucoma Progression in Individuals of African Descent Compared With Those of European Descent. JAMA Ophthalmol 2018;136(4):329–35. [DOI] [PMC free article] [PubMed] [Google Scholar]
- 11.Strouthidis NG, Scott A, Peter NM, Garway-Heath DF. Optic disc and visual field progression in ocular hypertensive subjects: detection rates, specificity, and agreement. Invest Ophthalmol Vis Sci 2006;47(7):2904–10. [DOI] [PubMed] [Google Scholar]
- 12.Howard CL, Wallace C, Abbas J, Stokic DS. Residual standard deviation: Validation of a new measure of dual-task cost in below-knee prosthesis users. Gait Posture 2017;51:91–96. [DOI] [PubMed] [Google Scholar]
- 13.Ledolter J, Kardon RH. Assessing Trends in Functional and Structural Characteristics: A Survey of Statistical Methods With an Example From Ophthalmology. Transl Vis Sci Technol 2018;7(5):34. [DOI] [PMC free article] [PubMed] [Google Scholar]
- 14.Diniz-Filho A, Delano-Wood L, Daga FB, Cronemberger S, Medeiros FA. Association Between Neurocognitive Decline and Visual Field Variability in Glaucoma. JAMA Ophthalmol 2017;135(7):734–9. [DOI] [PMC free article] [PubMed] [Google Scholar]
- 15.Artes PH, Hutchison DM, Nicolela MT, LeBlanc RP, Chauhan BC. Threshold and variability properties of matrix frequency-doubling technology and standard automated perimetry in glaucoma. Invest Ophthalmol Vis Sci 2005;46(7):2451–7. [DOI] [PubMed] [Google Scholar]
- 16.Wadhwani M, Bali SJ, Satyapal R, et al. Test-retest variability of retinal nerve fiber layer thickness and macular ganglion cell-inner plexiform layer thickness measurements using spectral-domain optical coherence tomography. J Glaucoma 2015;24(5):e109–15. [DOI] [PubMed] [Google Scholar]
- 17.Turpin A, McKendrick AM. What reduction in standard automated perimetry variability would improve the detection of visual field progression? Invest Ophthalmol Vis Sci 2011;52(6):3237–45. [DOI] [PubMed] [Google Scholar]
- 18.Russell RA, Garway-Heath DF, Crabb DP. New Insights into Measurement Variability in Glaucomatous Visual Fields from Computer Modelling. Plos One 2013;8(12):e83595. [DOI] [PMC free article] [PubMed] [Google Scholar]
- 19.Medeiros FA, Doshi R, Zangwill LM, Vasile C, Weinreb RN. Long-term variability of GDx VCC retinal nerve fiber layer thickness measurements. J Glaucoma 2007;16(3):277–81. [DOI] [PubMed] [Google Scholar]
- 20.Katz J, Sommer A. A Longitudinal-Study of the Age-Adjusted Variability of Automated Visual-Fields. Archives of Ophthalmology 1987;105(8):1083–6. [DOI] [PubMed] [Google Scholar]
- 21.Montolio FGJ, Wesselink C, Gordijn M, Jansonius NM. Factors That Influence Standard Automated Perimetry Test Results in Glaucoma: Test Reliability, Technician Experience, Time of Day, and Season. Invest Ophthalmol Vis Sci 2012;53(11):7010–7017. [DOI] [PubMed] [Google Scholar]
- 22.Wu Z, Medeiros FA. Comparison of Visual Field Point-Wise Event-Based and Global Trend-Based Analysis for Detecting Glaucomatous Progression. Transl Vis Sci Technol 2018;7(4):20. [DOI] [PMC free article] [PubMed] [Google Scholar]
- 23.Henson DB, Emuh T. Monitoring vigilance during perimetry by using pupillography. Invest Ophthalmol Vis Sci 2010;51(7):3540–3. [DOI] [PubMed] [Google Scholar]
- 24.Kocabeyoglu S, Mocan MC, Bozkurt B, Irkec M. Effect of artificial tears on automated visual field testing in patients with glaucoma and dry eye. Can J Ophthalmol 2013;48(2):110–4. [DOI] [PubMed] [Google Scholar]
- 25.Rozanski C, Haythornthwaite JA, Dagnelie G, Bittner AK. Applying theories and interventions from behavioral medicine to understand and reduce visual field variability in patients with vision loss. Med Hypotheses 2014;83(2):190–5. [DOI] [PMC free article] [PubMed] [Google Scholar]
- 26.Pathak M, Demirel S, Gardiner SK. Nonlinear, multilevel mixed-effects approach for modeling longitudinal standard automated perimetry data in glaucoma. Invest Ophthalmol Vis Sci 2013;54(8):5505–13. [DOI] [PMC free article] [PubMed] [Google Scholar]
- 27.Gardiner SK, Demirel S, De Moraes CG, et al. Series length used during trend analysis affects sensitivity to changes in progression rate in the ocular hypertension treatment study. Invest Ophthalmol Vis Sci 2013;54(2):1252–9. [DOI] [PMC free article] [PubMed] [Google Scholar]
- 28.Abe RY, Gracitelli CP, Medeiros FA. The Use of Spectral-Domain Optical Coherence Tomography to Detect Glaucoma Progression. Open Ophthalmol J 2015;9:78–88. [DOI] [PMC free article] [PubMed] [Google Scholar]
- 29.Leung CK, Yu M, Weinreb RN, Lai G, Xu G, Lam DS. Retinal nerve fiber layer imaging with spectral-domain optical coherence tomography: patterns of retinal nerve fiber layer progression. Ophthalmology 2012;119(9):1858–66. [DOI] [PubMed] [Google Scholar]
- 30.Budenz DL, Fredette M-J, Feuer WJ, Anderson DR. Reproducibility of Peripapillary Retinal Nerve Fiber Thickness Measurements with Stratus OCT in Glaucomatous Eyes. Ophthalmology 2008;115(4):661–666.e4. [DOI] [PubMed] [Google Scholar]
- 31.Saunders LJ, Russell RA, Crabb DP. Measurement precision in a series of visual fields acquired by the standard and fast versions of the Swedish interactive thresholding algorithm: analysis of large-scale data from clinics. JAMA Ophthalmol 2015;133(1):74–80. [DOI] [PubMed] [Google Scholar]
Associated Data
This section collects any data citations, data availability statements, or supplementary materials included in this article.


