

Abstract
Specialized translation initiation is a novel form of regulation of protein synthesis whereby RNA structures within the 5’-UTR regulate translation rates of specific mRNAs. Like internal ribosomal entry sites (IRES), specialized translational initiation requires the recruitment of eukaryotic initiation factor 3 (eIF3), but specialized translation initiation requires cap recognition by eIF3d, a new 5’-m7GTP recognizing protein. How these RNA structures mediate eIF3 recruitment to affect translation of specific mRNAs remains unclear. Here we report the NMR structure of a stem-loop within the c-JUN 5’ UTR recognized by eIF3 and essential for specialized translation initiation of this well-known oncogene. The structure exhibits similarity to eIF3 recognizing motifs found in HCV-like IRES, suggesting mechanistic similarities. This work establishes the RNA structural features involved in c-JUN specialized translation initiation and provides a basis to search for small molecules inhibitors of aberrant expression of the proto-oncogenic c-JUN.
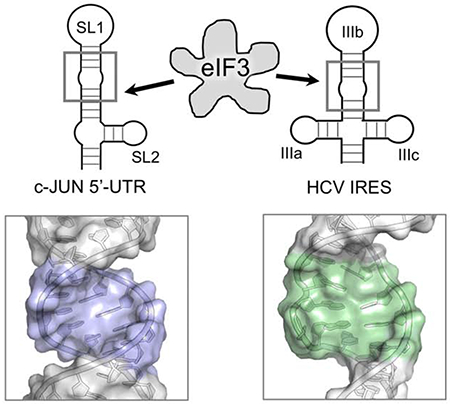
Graphical Abstract
Introduction:
Translational initiation is highly regulated and its deregulation is implicated with diseased cellular states (Silvera et al, 2010, Stumpf et al, 2011). Initiation of protein synthesis involves the orchestrated recruitment of the ribosome to the initiation codon by a multifaceted network of eukaryotic initiation factors (eIFs) that are present in limiting amounts to ensure controlled levels of protein synthesis (Bhat et al, 2015; Jackson et al, 2010; Andaya et al, 2014). Significant up- or down-regulation of eIFs has been linked to the etiology of cancer (Ruggero et al, 2013). In short, canonical translation initiation involves recognition of the mRNA 5’-m7GTP cap by eIF4F, a trimeric complex with cap binding (eIF4E), mRNA unwinding (eIF4A), and ribosomal loading (eIF4G) activities. The mRNA-bound eIF4F complex is then loaded into the 43S preinitiation complex comprised of the small ribosomal subunit (40S) and several other auxiliary factors (eIF1, eIF2-tRNA, eIF3, and eIF5).
Translation initiation is regulated by secondary and tertiary structures within mRNAs that modulate eIF activity and can increase or decrease translation rates, such as encumbering eIF4A helicase unwinding by stable secondary structures or recruitment of activating auxiliary proteins (Truitt et al, 2016). Internal ribosome entry sites (IRES) are well-known examples of complex RNA structures that facilitate direct entry of the translation machinery, by-passing cap recognition (Terenin et al, 2017; Truitt et al, 2016). Hepatitis C virus (HCV)-like IRES are recognized by the 13-units ~800kDa eIF3 complex (Terenin et al, 2017; Honda et al, 1999; Fraser et al, 2007; Khan et al, 2014), which serves as a scaffold for 43S preinitiation complex formation and assists in mRNA loading during canonical translational initiation. In IRES-mediated translation initiation, eIF3 recognizes the IRES structure directly (Querol-Audi et al, 2013; Valášek et al, 2017). Although a complete physical understanding of eIF3 recognition of HCV-like IRES’ is still lacking, regions of the HCV-like IRESs required for 40S and eIF3 recruitment are known (Kieft et al, 2001; Buratti et al, 1998).
IRESs are rare in eukaryotic transcripts (Holcik et al, 2000; Johannes et al, 1999), but relatively more prevalent in growth factors and house-keeping genes. They facilitate aberrant protein synthesis during cellular stress or cancer, when the eIF4F complex is inhibited (Holcik et al, 2000; Stephane et al, 2001; Hellen et al 2001, Aurelio et al, 2005; Hsieh et al, 2012). mRNAs lacking IRESs can be translated when eIF4F is inhibited through a third form of translation initiation, that requires both recognition of specific mRNA structures by eIF3 and mRNA-cap recognition by eIF3d (Lee et al, 2015; Lee et al, 2016). During specialized translational initiation, the protein DAPI5 binds to eIF3d and might replace the ribosomal loading function of eIF4G (de la Parra et al, 2018). How RNA elements recruit eIF3, which features of their sequence and/or structure are recognized, and whether they somehow resemble IRESs with which they share the ability to interact with eIF3, remain unexplored. These are critical questions to understand specialized translational initiation, which is addressed herein.
One of the most studied mRNAs that undergoes eIF3d-directed specialized translation initiation is the mitotic transcriptional regulator and proto-oncogene c-JUN. The c-JUN 5’-UTR was proposed to harbor a cellular IRES (Johnson et al, 1996; Wisdom et al, 1999; Blau et al, 2012), but specialized translation initiation was discovered instead during a whole cell photoactivatable ribonucleoside-enhanced crosslinking and immunoprecipitation (PAR-CLIP) study, where a region of its mRNA cross-linked to eIF3 and its deletion was shown to be critical for maintaining cap-dependent c-JUN translation rates (Lee, 2015). The cross-linked region mapped to a 56-mer stem-loop (SL1) located at position +93 to +143 relative to the transcription start site, as designated based on cap analysis gene express (CAGE) data deposited in FANTOM (Lee, 2015) (Fig. 1A). Both SL1 and a neighboring stem-loop (SL2), located at +151 to +169, exhibit sequence conservation in mammals, and perhaps matching secondary structure based on predictions from the Mfold web server (Zuker et al, 2003) (Supplementary Fig. S1).
Figure 1.
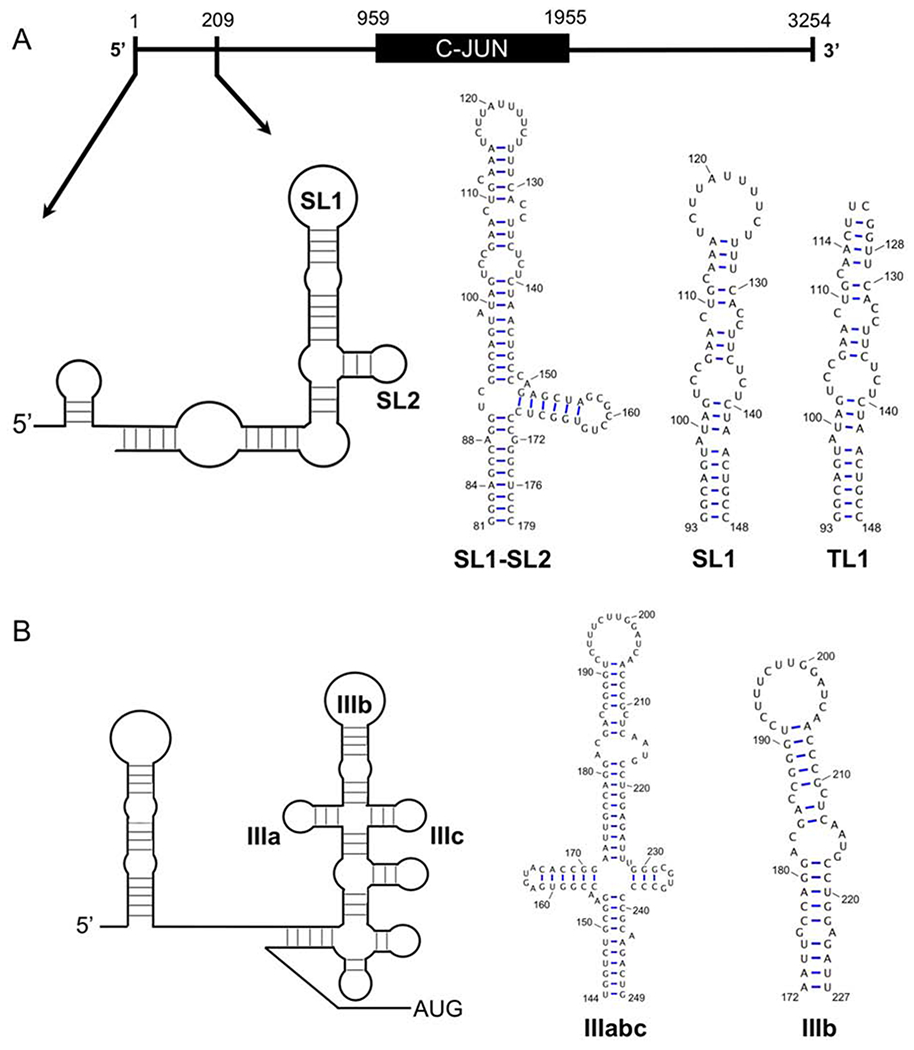
(A) Representation of the c-JUN transcript showing the position of the stem-loop responsible for specific translational initiation within the 5’-UTR (93-148, SL1) that cross-links to eIF3. Numbering is based on cap analysis gene expression (CAGE) data deposited in FANTOM. The proposed secondary structure of TSS +1-209 is depicted and the location of SL1 and its proximal stem-loop (SL2) are labeled. Sequence and secondary structure of SL1, along with the TL1 construct used for structure determination. (B) Representation of the HCV IRES secondary structure with eIF3 subdomains IIIa, IIIb, and IIIc labeled. Secondary structure and sequence of subdomain IIIb (172-227) is represented as well.
We used nuclear magnetic resonance spectroscopy (NMR) and small angle X-ray scattering (SAXS) to understand structurally what drives eIF3 recognition of SL1. We show that SL1 has a flexible internal loop structurally analogous to the HCV IRES subdomain IIIb internal loop, which has previously been shown to be key for eIF3 binding (Collier et al, 2002) (Fig. 1A, B). The complete SL1-SL2 element folds into a 3-way stem-loop junction (Fig. 1A) which is similar in global shape to the IIIabc subdomain found in the HCV IRES (Perard et al, 2013; Quade et al, 2015). Modeling the SL1 and SL2 construct into the eIF3a and eIF3c pockets known to bind the HCV IRES (Sun et al, 2013; Hashem et al, 2013; Erzberger et al, 2014) provides a good fit, suggesting that c-JUN specialized translation initiation and HCV-like IRESs recognize eIF3 in structurally similar ways.
Results:
RNA Construct Design and Verification of the Secondary Structure
We determined the NMR structure of a construct shown to cross-link with eIF3 and to be essential for specialized translation initiation of c-JUN (Fig. 1A). NMR assignments and structure determination were facilitated by preparing a second construct where the highly dynamic, flexible apical loop was replaced with a UUCG tetraloop (TL1) (Fig. 1A), which provided greatly improved spectral quality (see below). Shorter constructs were generated as well, for assignment confirmation of overlapped regions, corresponding to the bottom (TL1-BOT) and top (TL1-TOP) sections of the structure (Supplementary Fig. S2 & S3).
Before undertaking the NMR analysis, we confirmed that the SL1 sequence retains the proposed secondary structure when isolated from the rest of the 5’-UTR. N-methylisatoic anhydride (NMIA) based SHAPE (selective 2′ hydroxyl acylation analyzed by primer extension) experiments for the SL1 provided chemical reactivities that, when incorporated into the secondary structure prediction program RNAStructure (Mathews et al, 2004), matched the secondary structure of the mRNA obtained from the analysis of the complete 5’-UTR of c-Jun (Fig. 2A). High reactivities within the apical loop and near the A99 bulge were observed, but the proposed lower and upper internal loops were largely unreactive.
Figure 2.
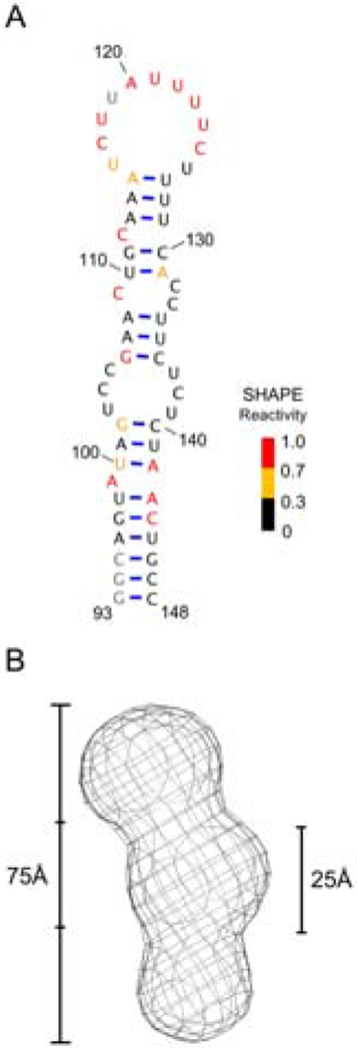
(A) Secondary structure of SL1 with color-coded SHAPE reactivities mapped to each nucleotide. Reactivities are normalized based on the RNAStructure software (Mathews et al, 2004). No data could be acquired for nucleotides represented in grey. (B) Refined SAXS envelope for SL1 generated by ATSAS (Svergun et al, 1999; Volkov et al, 2003).
We followed up these results by acquiring small angle x-ray scattering (SAXS) data to generate a low-resolution model of SL1 (Fig. 2B). The SAXS envelope is ~75Å long and exhibits lower resolution at the apical loop and in the center of the model; this second result was unexpected given the moderate amount of SHAPE reactivity in both the lower (U103, C104, C105, U137, C138, U139) and upper internal loops (C109, C132, C133). We tentatively positioned these internal loops into the low-resolution center of the model (which is 25Å wide), based on the overall size of the RNA and the attribution of the apical loop to the less resolved region at the top. The model reveals a bend of ~20-30 degrees from the helical axis that coincide with this middle region, suggestive of a kink or bend in the helical structure induced by the internal loop residues, as was also observed for the HCV IRES IIIb internal loop (Kieft et al, 2001; Collier et al, 2002).
NMR was then used to establish the secondary structure unambiguously. Almost all NH protons, the appearance of which is indicative of base-pairing, were assigned (Fig. 3A, Supplementary Fig. S4) for both constructs. Imino chemical shifts were assigned for each base-pair, with the exception of U127-H3, predicted to base-pair with A115, located at the stem-apical loop interface and therefore broadened by exchange with solvent. However, a low intensity cross-peak was observed between U127-H3 and A114-H22 suggesting formation of the base-pair.
Figure 3.
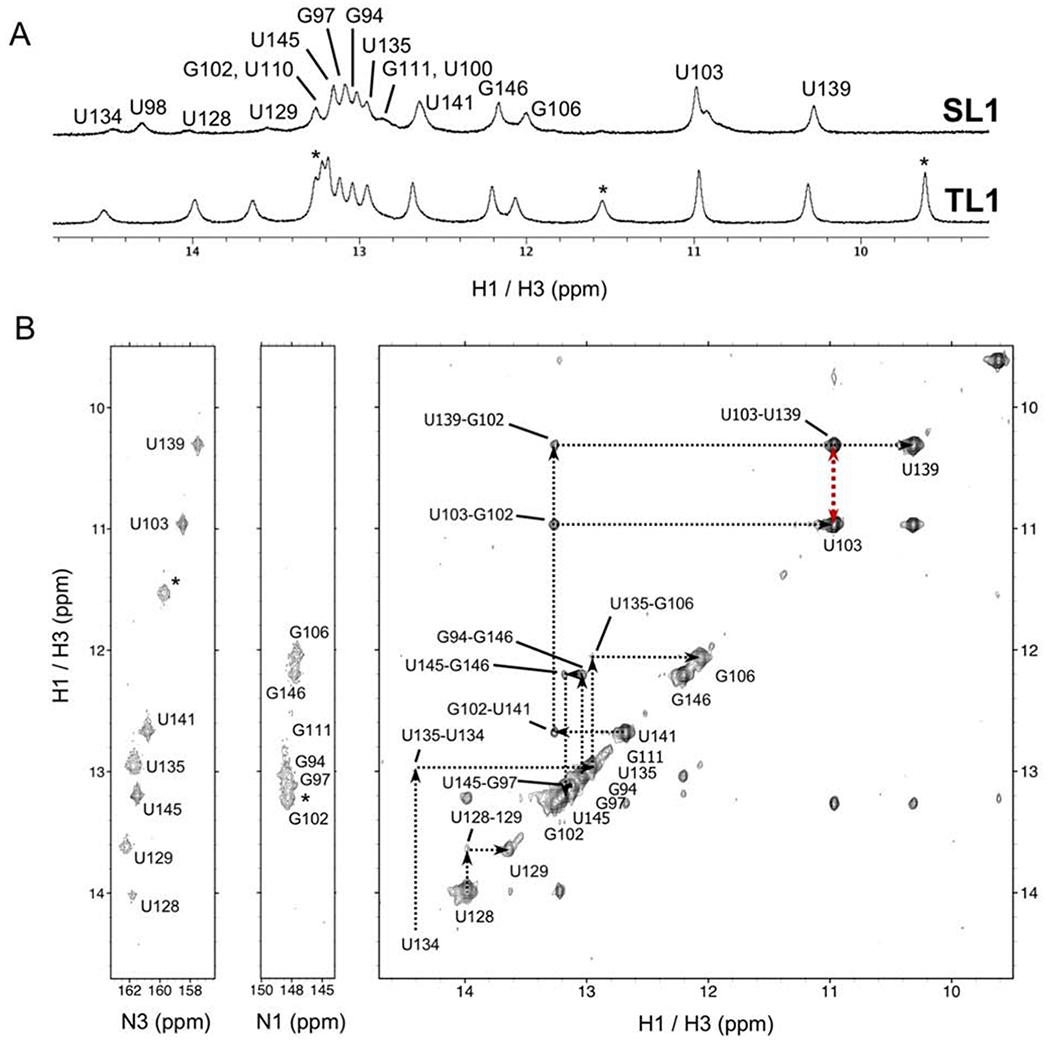
(A) 1D 1H NMR spectra for the SL1 and TL1 RNAs show very similar spectra, indicative of very similar structures; (*) indicates resonances from the UUCG tetraloop. (B) (right) H2O NOESY spectrum for TL1 with black dotted lines showing sequential NOE correlations involving imino protons. (left) 15N HSQC with N3 and N1 where assignments are aligned with H2O NOESY cross-peaks, confirming resonance assignments. The red dotted line represents the strong U103-H3 to U139-H3 NOE, supportive of the U103-U139 base-pair.
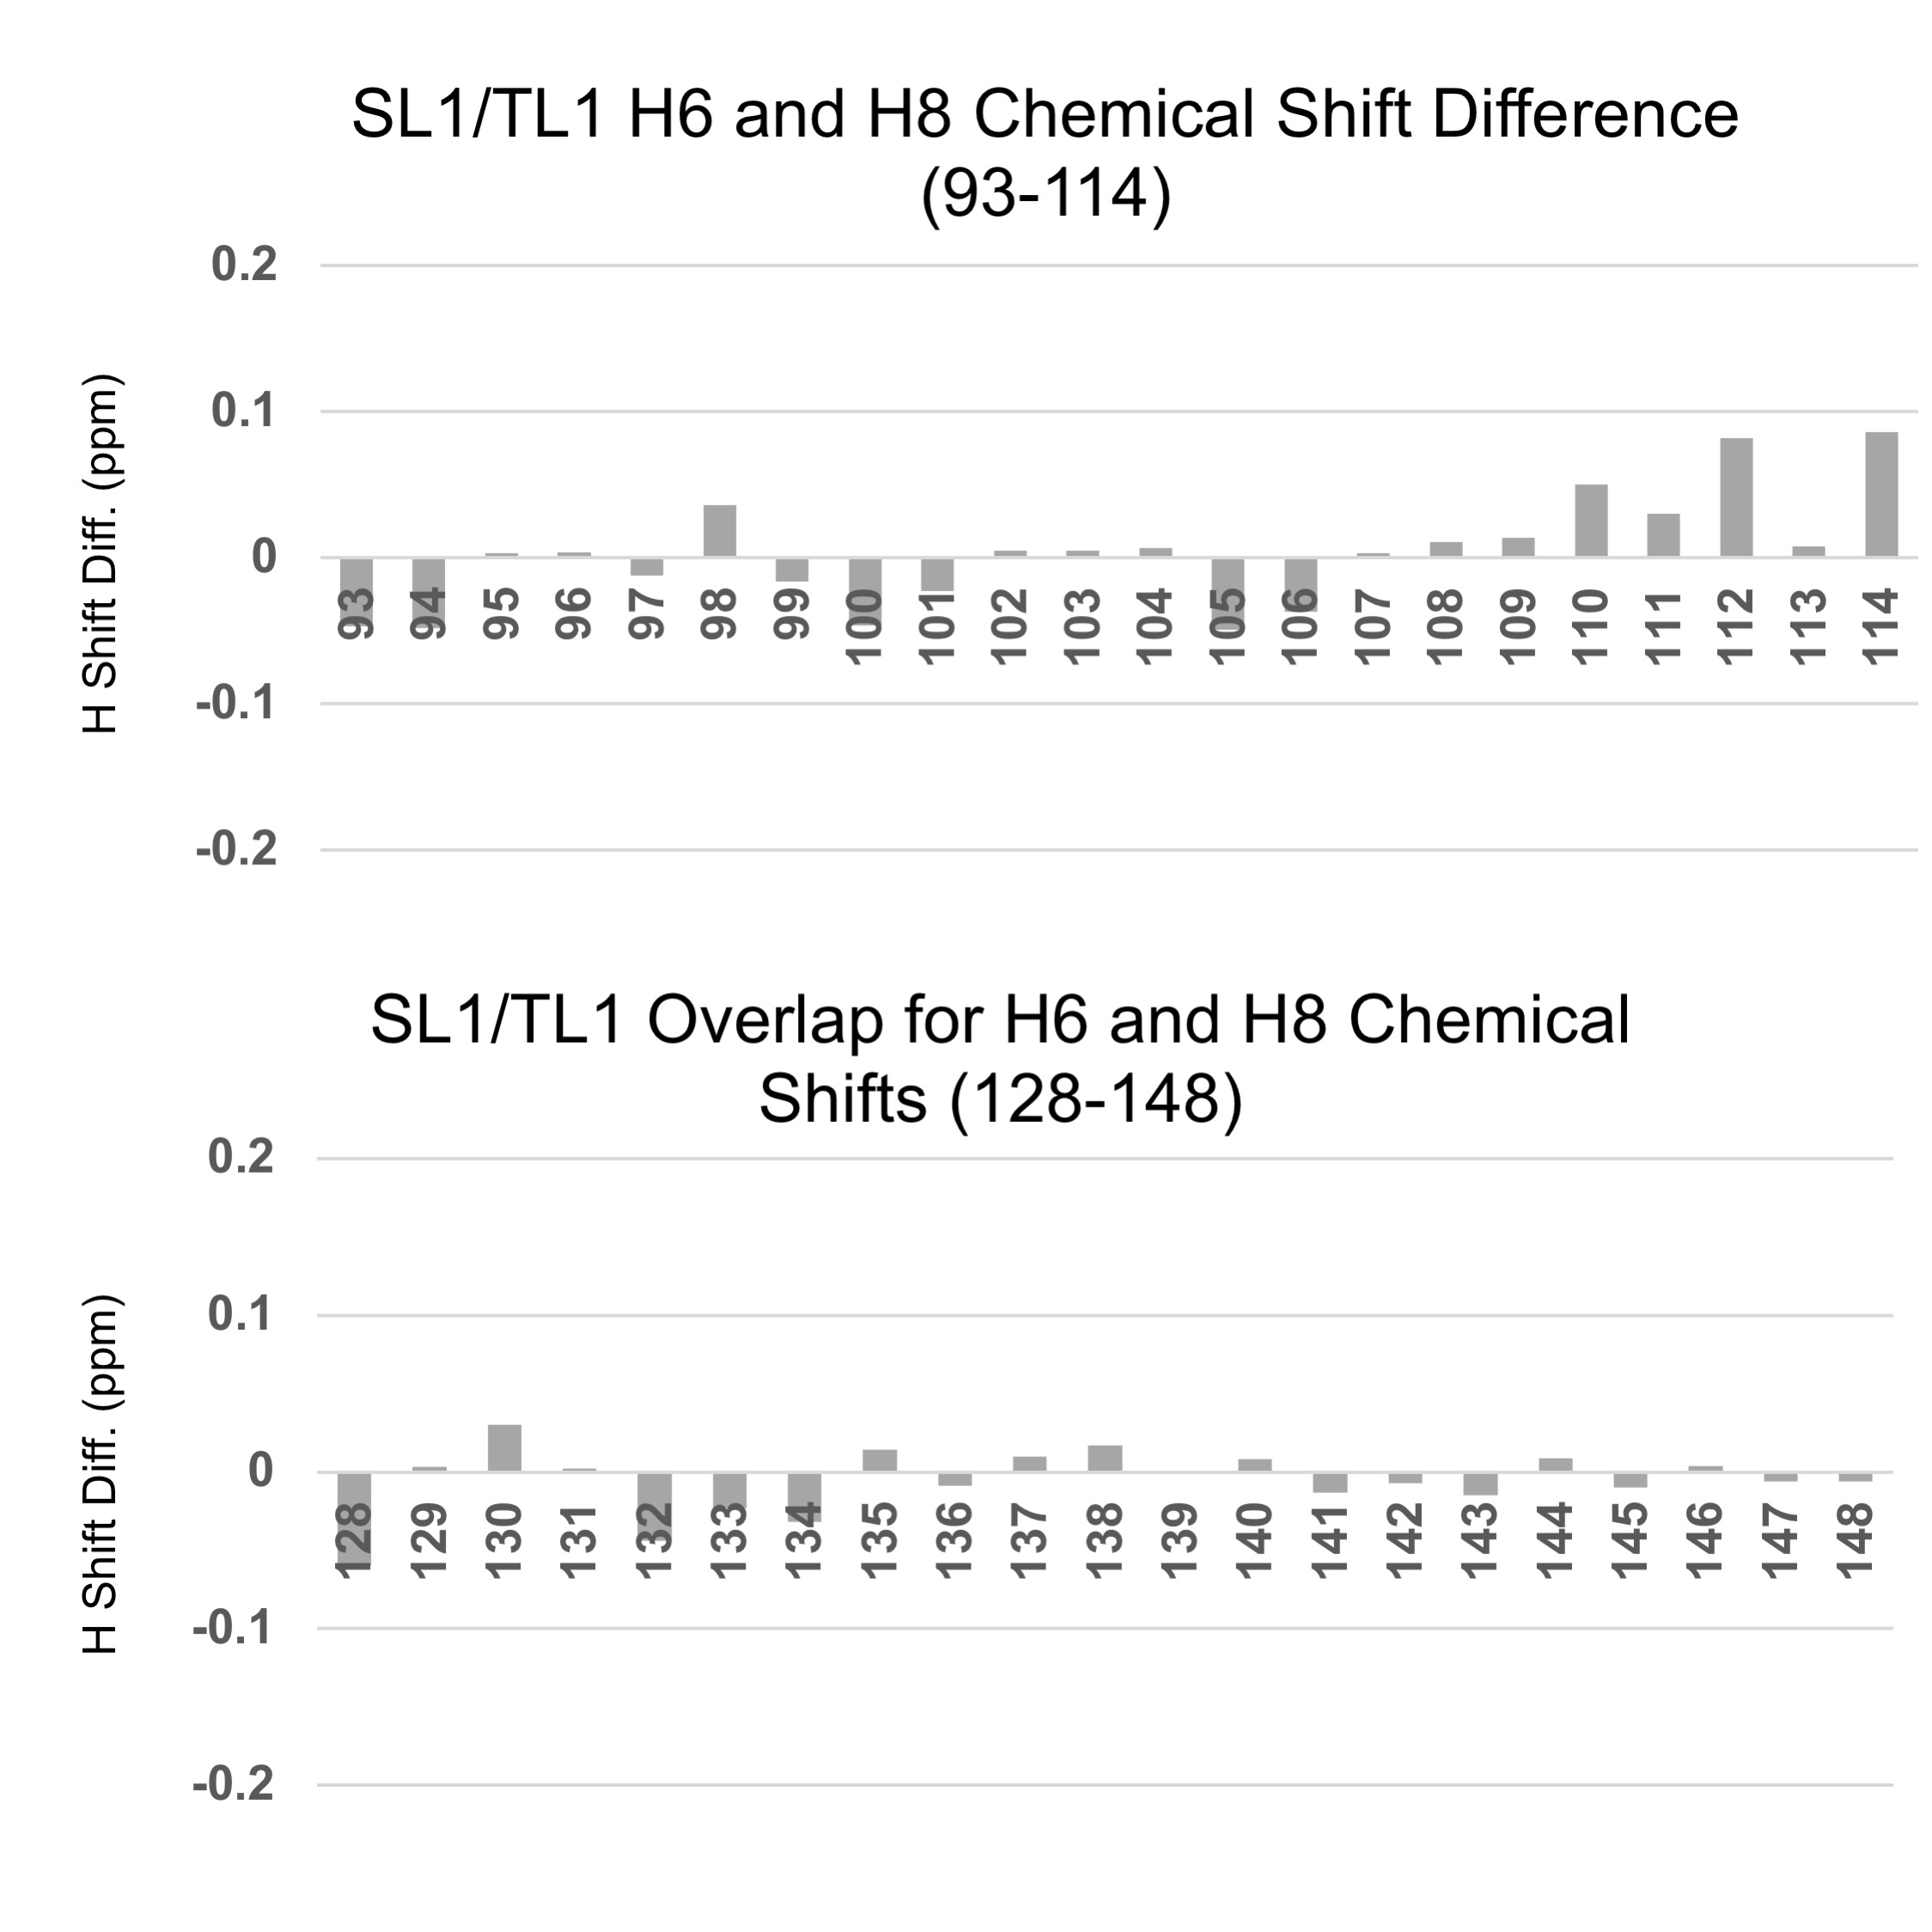
The chemical shifts and peaks intensities observed for the NH residues of the SL1 RNA map very well to the corresponding resonances for TL1, with the exception of several broad downfield peaks (U128-H3 and U129-H3 which neighbors the apical loop, and U134 which neighbors the upper internal loop) likely due to neighboring unpaired, flexible nucleotides. Additionally, U98-H3 which neighbors the flexible A99 bulge based on SHAPE data was difficult to assign in TL1 spectra.
Since NMR chemical shifts are extremely sensitive to local structure, we conclude that the two RNAs have very similar structure. However, we collected most of the data required for structure determination with the UUCG-containing TL1 construct because of reduced spectral line width, as illustrated in the spectral comparison. We have found in multiple projects that large unpaired loops lead to reduced spectral quality, perhaps as a result of aggregation under NMR conditions.
A distinct difference in stability between the lower and upper internal loops was observed when examining H2O NOESY spectra. The upper, cytosine-rich internal loop exhibited no cross-strand NOE interactions. Additionally, the neighboring U110-A131 and G111-A130 base-pairs exhibit a high degree of chemical exchange suggesting the formation of base-pairs, but also exposure to solvent from partial opening of the base pairs. Surrounding unpaired nucleotides C109 and C112 both exhibit high SHAPE activity suggesting their flexibility impart deviation from A-form helical base-pairing for U110-A131 and G111-C130, and globally destabilizing this portion of the structure.
In contrast, the G102-H3 and G106-H3 base-pairs, proximal to the lower internal loop, were assigned unambiguously with G102 exhibiting NOE interactions to both U103-H3 and U139-H3. The non-canonical U103-U139 base-pair was corroborated by strong cross-peaks between U103-H3 and U139-H3 within the non-canonical base-pairing range (12-10 ppm) (Fig. 3B). U103-H3 and U139-H3 exhibit several intermolecular NOEs with C104 and C138-amino protons as well, suggesting a well-ordered lower internal loop structure. The flexible nucleotides within the upper internal loop, the destabilized U110-A131 and G111-A130 base-pairs, and the non-canonical U103-U139 base-pair are all likely to play a role in lowering resolution, as observed in the center of the SAXS envelope.
Analysis of the NMR Spectra
Since the loop nucleotides are flexible and devoid of intrinsic structure, and the spectral quality reduced, we elected to determine the structure (93-114, 128-148) using NMR restraints obtained from TL1 spectra, where the apical loop is replaced with a stable UUCG tetraloop. This is safe, because the SL1 structure is duplicated in the TL1 RNA, based on almost identical chemical shifts (Supplementary Fig. S5).
Reduced spectral overlap and increased spectral quality in the TL1 D2O NOESY spectrum, together with recording 13C filtered 3D NOESY experiments, allowed at least one NOE interaction to be obtained for almost all NMR active nuclei in TL1. Only one disconnect in the typical helical “walk” pattern was observed, proximal to the upper internal loop. The C112 bulged nucleotide exhibits the expected H2’ cross-peaks with A113-H8, yet its G111-H2’-C112-H8 interaction is absent. Atypical assignments suggest C112 is displaced from the base-stack because of detection of an NOE interaction between G111-H2’ and A113-H8, in addition to an unexpected G111-H1’ to A113-H8 interaction (Fig. 4A, B). Further inspection of the D2O TOCSY data shows that G111 exhibits mixed 2’-endo/3’-endo sugar pucker, based on relatively strong G111-H1’ to H2’, H3’, and H4’ cross-peaks (Fig. 4C). Nucleotides U110 and A113 neighboring G111 exhibited H1’ to H2’ TOCSY correlations, suggesting a partial 2’-endo conformation and flexibility for this region of the RNA (Fig. 4C). A131 and C132 also exhibit deviations from A-form helical patterns, where A131-H2 correlations to G111-H1’ are of weak intensity, and C132 exhibits mixed 2’-endo/3’-endo TOCSY cross-peaks (Fig. 4C). These deviations from A-form helical patterns combined with the SHAPE reactivity for upper internal loop residues C109 and A131 indicate that this region of SL1 is flexible, which likely contributes to lowering the resolution in the center of the SAXS envelope (Fig. 2B)
Figure 4.
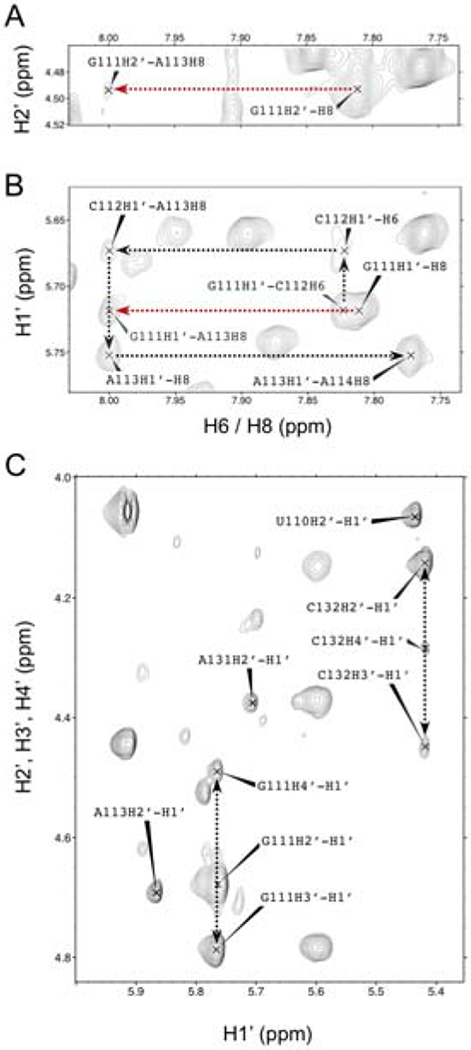
Regions of the D2O NOESY spectrum of TL1 exhibiting atypical NOE patterns for the upper internal loop region. Black dotted lines show sequential NOE interactions and deviations from standard helical patterns are represented as red dotted lines. (A) An atypical NOE cross-peak between G111-H2’ to A113-H8. (B) The H1’ to H6/H8 helical “walk” from G111 to A114. The red dotted line represents an atypical NOE interaction between G111-H1’ and A113-H8. (C) D2O TOCSY spectrum of TL1 TOP. Peaks between H1’ to H2’, H3’, and H4’ for G111 and C132 suggest deviation from canonical 3’-endo conformation to a mixed 2’-endo/3’-endo pattern.
Almost all expected adenosine H2 correlations to i+1 and cross-strand i-1 H1’ nuclei exhibit the expected medium to strong-intensity cross-peaks, with the exception of the bulged A99, A143, and the aforementioned A131. A99-H2 to U100-H1’ and A143-H1’ could only be detected in experiments conducted on the smaller fragment as very low-intensity cross-peaks. By contrast, A143 exhibited strong-intensity NOEs with C45-H1’ and low to medium intensity cross-peaks to the cross-strand i+1 A99 and unexpectedly, to the i+2 residue U100 as well. This observation suggests A99 might exchange between a stacked-in and a solvent exposed conformation, and that, when A99 is solvent exposed, the U100-A142 base-pair stacks over the U98-A143 base-pair. However, NOEs for all H1’, H2’, and H3’ nuclei to H6 or H8 for residues near A99 were assigned with the expected A-form intensities. Since the SHAPE reactivity data are high for most residues surrounding the A99 bulge, we suspect that A99, along with U98-C45 and U100-A143, are innately flexible with the A99 base fluctuating between a major conformation (stacked between U98 and U100) and a transient minor conformation where A99 is displaced from the base stack. This is sometimes observed in unpaired A’s, for example in the pre-miR-21 structure (Shortridge, et al, 2017).
Structure of the eIF3 binding stem-loop of c-JUN
The structure of TL1 was calculated using a simulated annealing protocol from the NIH-XPLOR package (Schwieters et al, 2005). We describe herein the ensemble of 10 structures chosen based on lowest energy score from a refinement calculation of 200 structures, which converged to a 1.29 Å heavy atom RMSD. Alignment of individual sections of the RNA were all below 1.00 Å, with the exception of internal loop proximal residues 108-113 and 129-134 (Fig. 5A, Supplementary Table S1). Additional refinement was attempted by incorporating residual dipolar coupling (RDC) data into the XPLOR refinement script. However, inclusion of RDC’s into the calculations produced no significant improvement in ensemble convergence. We attribute this result to the combination of a high number of NOE restraints per nucleotide and, more significantly, to the conformational flexibility of the center of the molecule, which prevents an accurate estimation of the alignment tensor vector (Lipsitz et al, 2004).
Figure 5.
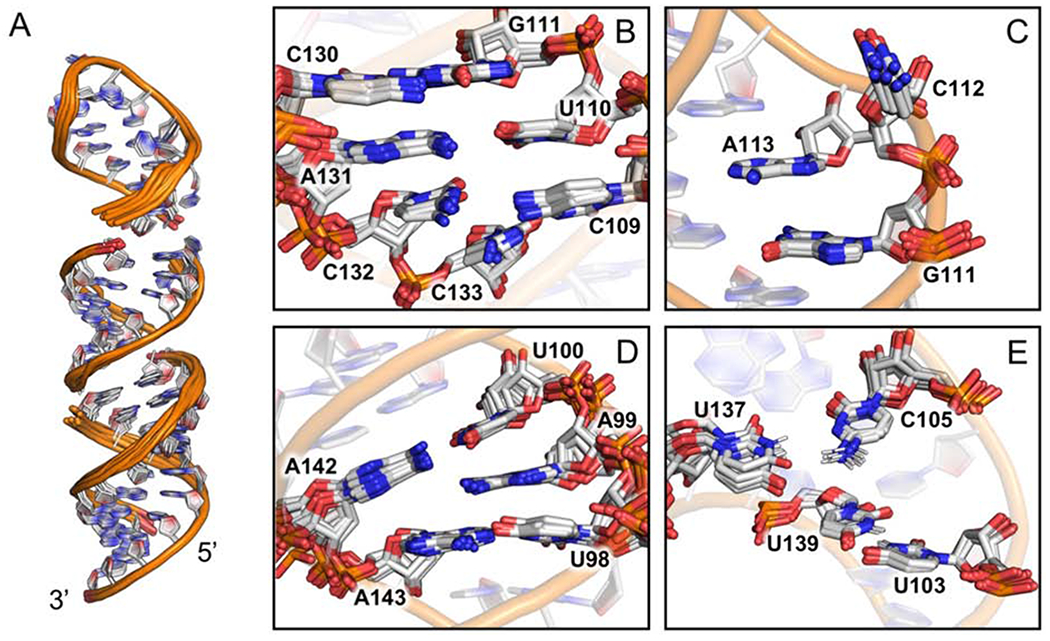
Structure of TL1 (white, PDB: 6MXQ) (A) Local superposition for: (lower) 93-103, 139-148; (middle) 104-109, 132-138; and (top) 110-131 sections of the structure. (B) The unpaired nucleotides C109, C132, and C133 of the upper internal loop. (C) C112 bulges out and is displaced from the base-stack between G111 and A113. (D) the unpaired A99 is inserted into the base-stack between U98 and U100. (E) U103-U139 base-pair and long range C105-U137 electrostatic interactions. B-E shown from sectional alignments of the ensemble.
All models exhibit an unusual narrow to wide major groove width near the center of the stem-loop. Using the 3DNA software suite, we calculated major groove widths at its narrowest location (A101-P to A134-P) to be ~9 Å and at the widest location (C104 to A131) to be ~16Å (Lu et al, 2003) (Supplementary Fig. 6S). It is likely that the narrow major groove width is a result of the A99 bulge and unpaired C132 and C133 bases, positioned within one helical pitch from each other on opposite strands of the helix, which push the phosphodiester backbones towards each other to accommodate the unpaired nucleotides within the base-stack. We attribute the widened groove to the U103-U139 base-pair. The variation in groove width coincides with the pivot point for the stem-loop to bend ~20-30 degrees from the helical axis, consistent with the SAXS data, while local flexibility and variability at the upper internal loop could explain the low-resolution mid-section of the SAXS model.
Consistent with the SAXS data, the upper internal loop and proximal base pairs (108-113, 129-134) exhibit the largest local RMSD (1.23Å). Inspection of the ensemble of structures shows that this is due to the combined effect of the unpaired C109, C132, C133 residues, and the presence of the C112 bulge that together disrupt base-pair planarity and hydrogen bonding geometries for the neighboring G111-C130 and U110-A131 base-pairs as well (Fig. 5B). The unpaired cytosines (C109, C132, C133) converge poorly relative to each structure in the ensemble, yet in all models are positioned within the base-stack. We reason that the variable positions for these bases is indicative of their flexibility, explaining the disrupted the planarity of the neighboring U111-A131 base-pair to some extent. The G111-C130 base-pair may be affected as well, but C112 is also likely to play a role since it is displaced from the base stack in all models, in a manner reminiscent of a previously submitted structure, PDB 3J3F (Anger et al, 2013) (Fig. 5C). Interestingly, high SHAPE reactivity was detected for both C109 and C112, yet only C112 is displaced from the helix. We attribute this property to C112 being sandwiched between two base-pairs, one of which is a rigid GC base-pair, without an unpaired nucleotide on the opposite strand. In contrast, C109 neighbors two AU base-pairs and its stacking between neighboring A108 and U110 is likely facilitated by the flexibility of the unpaired C132 and C133 nearby, suggesting its SHAPE reactivity arises from a transient minor conformation.
The A99 bulge converges well within the ensemble and appears well-ordered (Fig. 5D), with a large number of -intra and -inter ribose-to-base NOE restraints. The A99 base is inserted between the U98-A143 and U100-A142 base-pairs with the only deviation from A-form helices in that U100 exhibits abnormal backbone angles (α = 156° β = −160° γ = 167°) to accommodate A99. This observation supports our hypothesis that the high SHAPE reactivity near the A99 bulge is due to a transient solvent exposed conformation that affects A99 and its neighboring base-pairs U98-A143 and U100-A142, which is likely to be missed in the NMR refinement that relies on the observation of the more highly populated structure.
U103 and U139 are base-paired in each model in the ensemble even when calculations were executed without inclusion of hydrogen bonding restraints. The base pair is slightly concave and twisted from ideal geometry. Strong intensity NOEs between the H3 nuclei and local amino protons favored the following hydrogen bond pattern: U139-H3 to U103-O2 (2.3-2.5Å) and U103-H3 to U139-O4 (2.1-2.3Å) (Fig. 5E). The UU base-pair promotes a highly stacked lower internal loop with long-range electrostatic interactions observed between U137-O4 to C105-H41 (3.0-3.2Å) and U137-H3 to C105-N3 (3.3-3.5Å) (Fig. 5E).
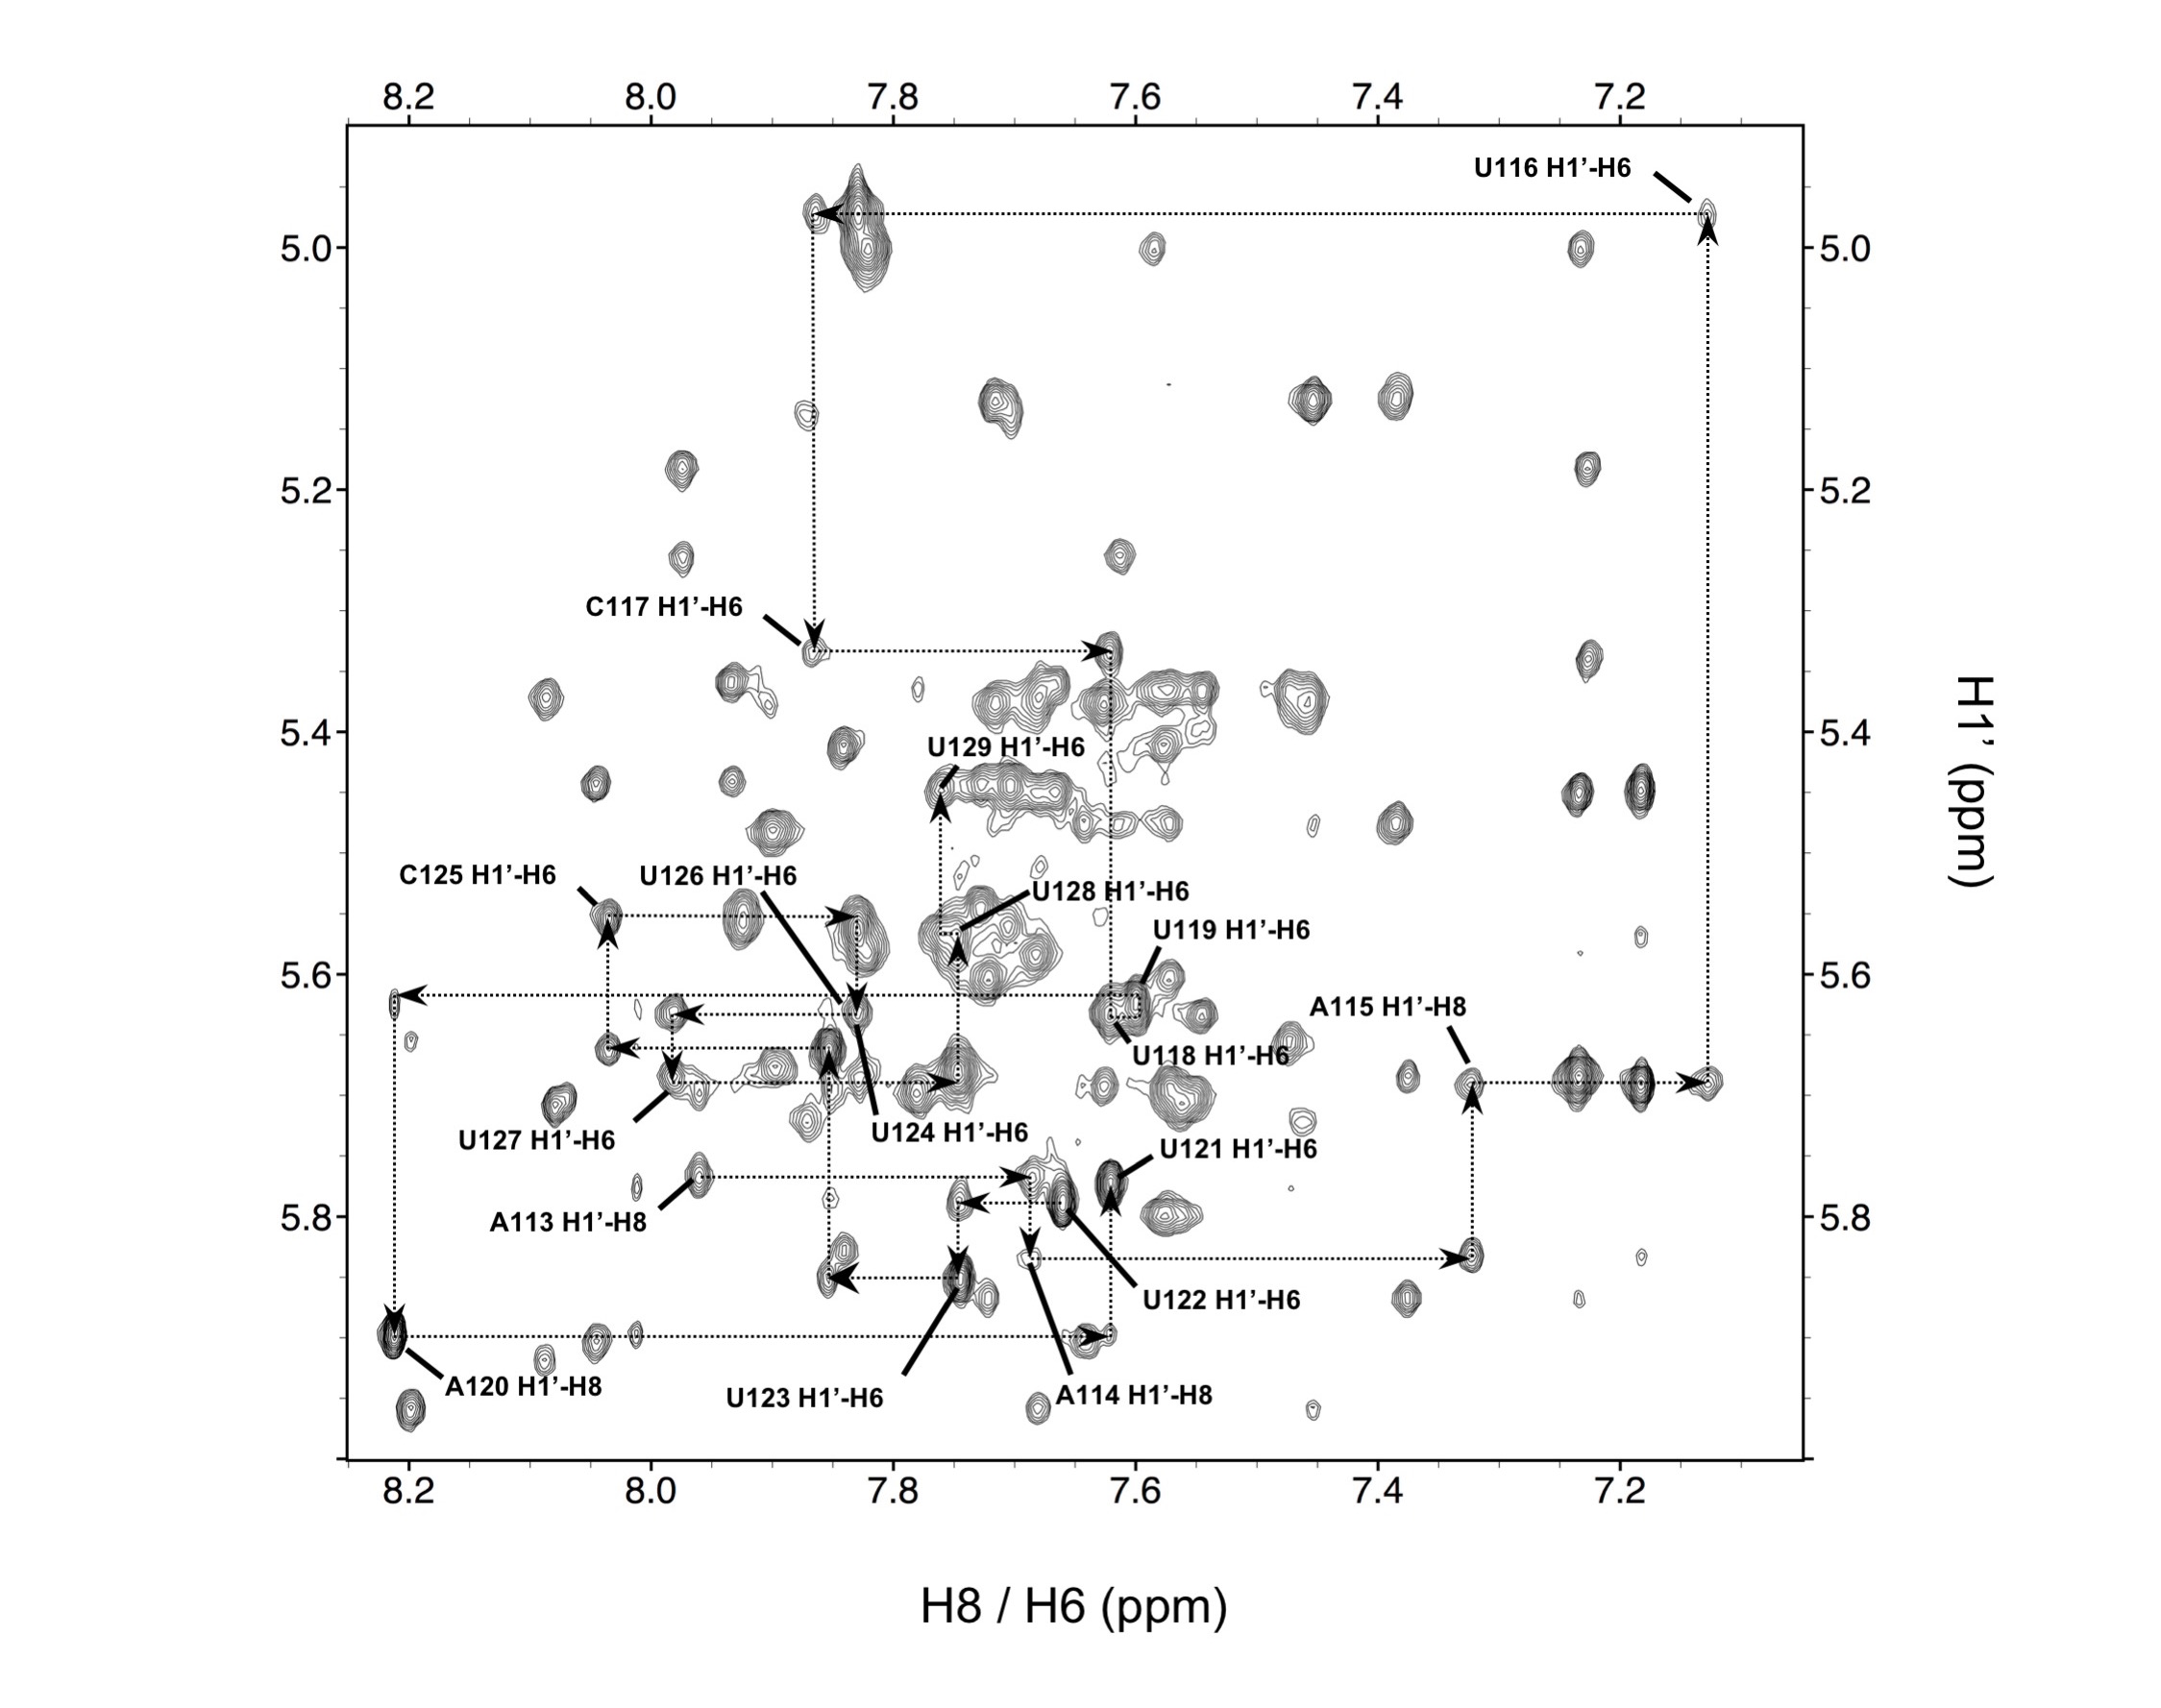
When we examined the structure of the SL1 apical loop (nucleotides A115 to U127), the spectra contained significant overlap and broadening, resulting in a more limited number of unambiguous assignments from D2O NOESY experiments. However, H1’ and H2’ to H6 and H8 assignments were almost continuously observed in a deuterated sample for apical residues A115 to U127, with the only break observed between U121 and U122 (Supplementary Figure S7). Interestingly, intramolecular H1’ and H2’ to H6 and H8 cross-peaks for nucleotides at the stem-loop junction (A116, U117, C118 and C125, U126, U127) exhibited expected low-intensity NOEs, whereas nucleotides U119 to U124 deviated from the standard helical “walk” cross-peak patterns and exhibited low to medium intensities, commonly seen for nucleotides in anti-syn equilibrium.
We merged restraints derived from the deuterated SL1 D2O NOESY spectra with restraints for residues 5’-G93 to A114, U128 to 3’-C148 derived from TL1 and intraresidue restraints for A155 to A128. In the 10 structure ensemble of low energy structures, the apical loop is surprisingly well resolved, considering its large size and lack of base-pairs (Fig. 6A, Supplementary Table S2). Modeling the lowest energy structure into the SL1 SAXS envelope provides good matching as well, including the lower resolution for the dynamic apical loop (Fig. 6B). Within it, unpaired nucleotides form an extended helical turn without well-organized base stacking or pairing (Fig. 6C), with the exception of A120, U121, and U122 bases, which are in most models completely unstacked and induce the backbone turn with U121 extruded from the loop, consistent with the gap of H1’ to H6 and H8 connections in the helical walk. At the stem-loop interface, A115-U127 exhibit regular conformation (Fig. 6D). During calculations, we initially chose not to enforce the A115-U127 base-pair due to its ambiguous H3 assignments. Yet, in most models the base-pair stacks above the A115-U127 base-pair and falls within the range and orientation of Watson-Crick hydrogen bond formation.
Figure 6.
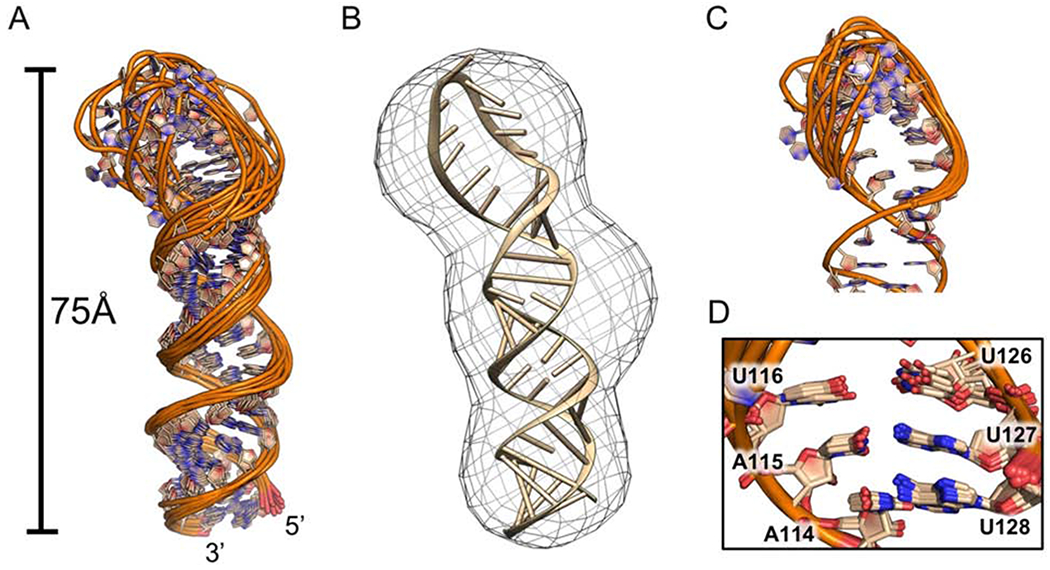
Structure of the SL1 apical loop (wheat, PDB: 6NOA). (A) Ensemble of 10 converged structures, superposed over all heavy atoms. (B) Lowest energy model for the SL1 apical loop fit into the SAXS envelope. (C) (top) Ensemble of 10 models superimposed with respect to the apical loop residues. (bottom) A115-U127 base-pairing with U116 and U126 stacking located at the stem-apical loop interface.
Structure of the SL1-SL2 Junction
We next investigated the larger RNA, including the 3-way junction formed by SL1 and SL2, because this extended element is reminiscent of the junctions found in HCV-like IRESs and involving two helices (IIIa and IIIc) that neighbor IIIb (Fig. 1A, B). The junction and subdomains are critical for 40S recruitment and eIF3 binding to HCV-like IRESs (Kieft et al, 2001).
Constructs were generated containing SL1 and SL2 (SL1-SL2) to assess its ability to fold and confirm the secondary structure (Fig. 1A). Using an initial low-resolution SAXS model, we observed a ~75 Å envelope similar to the SL1 structure that meets at a possible junction site with a second portion of the envelope that is 50Å long, which we tentatively assigned to be representative of the SL2 and 5’-3’ helices (Fig. 7A). In each SAXS model, subtle extensions located at the presumed junction site suggest formation of the SL2 stem-loop, stacked over the short 5’-3’ stem.
Figure 7.
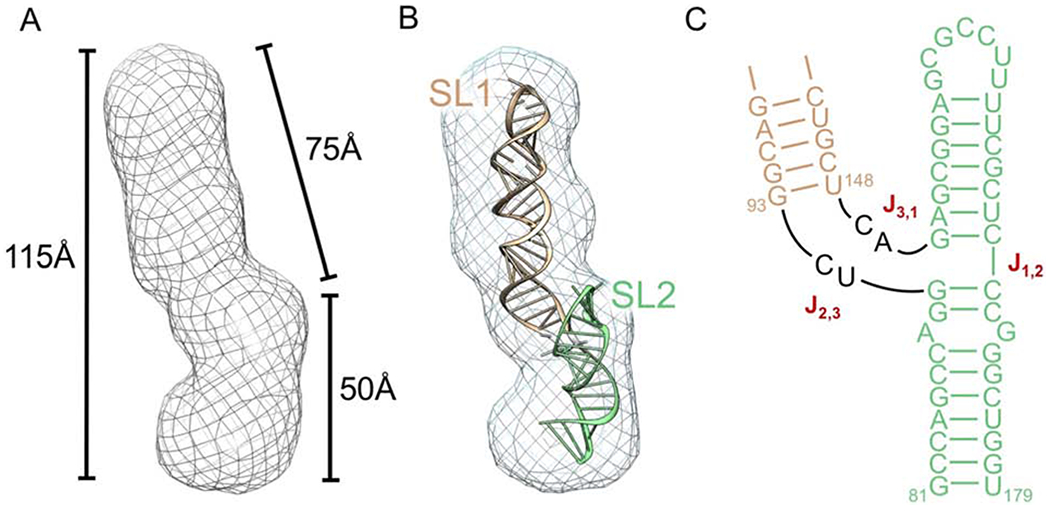
(A) SAXS envelope for SL1-SL2 generated by the ATSAS software package. (B) Model of SL1-SL2 generated by simRNA and fit into the refined SAXS envelope for SL1-SL2. SL1 (wheat), SL2 and 5’-3’ helix (light green). Secondary structure restraints for simRNA calculations were based on the imino NMR peak assignments. SL1 and SL2 annotation are based on the comparison with the SL1 SAXS envelope. (C) Secondary structure of SL1-SL2 represented with SL2 and the 5’-3’ stem coaxially stacked. Helical junction enumerations are based on (Lescoute et al, 2006).
A series of constructs containing SL1 and SL2 were generated to establish the SL1-SL2 secondary structure by NMR spectroscopy, with varying length of the 5’-3’ stem, starting with 5’-81 to 3’-179, 5’-84 to 3’-176, and 5’-88 to 3’-172. We found that a full stem length (81-179) was required to fold SL1 by tracking the distinctive imino resonances of the U103-U139 base pair, which align well with the SL1 assignments (Supplementary Fig. S8, S9). We then synthesized TL1*-SL2, where SL1 was truncated and capped with a UUCG tetraloop to improve spectral quality for assignments and secondary structure determination (Supplementary Fig. S10). All expected base-pair NH’s were assigned for this RNA, with the exception of helix termini G81, G90, G93, and G151, which are missing, most likely due to solvent exchange (Supplementary Fig. S11). Almost all imino resonances had NOE interactions with neighboring imino nuclei, with the exception of SL2 iminos U168, the U155-G165 wobble base-pair, and U164. H2O NOESY of a double tetraloop construct TL1*-TL2 were used to confirm the identity of U155, U164, and G165 imino resonances by providing weak intensity cross-peaks in this stabilized construct (Supplementary Fig. S12).
Crystal structures of the HCV IIIabc RNA show that helix IIIa coaxially stacks with helix IIIb, and helix IIIc stacks with the 5’-3’ stem instead. We suspected SL1-SL2 would exhibit similar coaxial stacking and that SL2 would fold similarly to helix IIIc because the junction between SL2 and the 5’-3’ stem lacks any interhelical nucleotides, as is the case for IIIc and its respective 5’-3’ stem. Based on three-way junction topology, lack of junction nucleotides predicts that SL2 would be coaxially stacked with the 5’-3’ stem (Lescoute et al, 2006).
We attempted using NMR to identify NOE interactions between the G90-C170 and G151-C169 base-pairs, which would be indicative of the base-pairs being stacked coaxially, but the relevant iminos are unassignable due to their rapid solvent exchange. Thus, we resorted to modeling the junction using simRNA, a coarse-grained molecular dynamics package, to generate representative models of the junction (Boniecki et al, 2016). In total, 24 models were generated using the simRNA platform, guided by the validated base-pairing established using NMR experiments, then followed-up with Rosetta RNA De Novo energy minimization (Das et al, 2010). Global structure convergence was poor (RMSD = ~15Å) due to fluctuation in the orientation of SL1, branching from the 3-way junction. However, when aligned with only SL1 or SL2 individually, the RMSD for the selected stem-loops improves dramatically providing support for the predictive accuracy of the models (Supplementary Fig. S13). Several models fit well into the SAXS envelope as well, further supporting our prediction that SL2 and the 5’-3’ stem occupy the shorter (50A) protruding region of the model, while SL1 occupies the longer (75Å) extension (Fig. 7B). Interestingly, every one of the 24 models demonstrated coaxial stacking between SL2 and the 5’-3’ stem, further corroborating the predicted three-way junction topology (Fig. 7C, Supplementary Fig. S13). Short of a formal X-ray structure, the simRNA models fit well enough into the SAXS envelope to warrant modeling eIF3 recognition based on previously reported IRES-eIF3 complexes, as discussed below (Sun et al, 2013; Hashem et al, 2013; Erzberger et al, 2014).
Discussion:
Specialized translation initiation is a cap-dependent mechanism of protein synthesis that deviates from the eIF4E-dependent canonical cap-dependent pathway and instead utilizes a novel m7G cap recognition function of eIF3d (Lee et al, 2015; Lee et al, 2016). Specific transcripts such as c-JUN mRNA are programmed to be translated through this pathway by RNA structures within their 5’-UTR that directly recruit eIF3 to the 5’-UTR upstream of the initiation codon (Fig. 1A). SL1 was identified within the c-JUN mRNA, among other transcripts to cross-link with multiple eIF3 subunits (eIF3a, 3b, 3d, and 3g) (Lee et al, 2015). It was also reported to exhibit sub-micromolar binding affinity to recombinant eIF3. Significant decreases in luciferase activity, for a construct driven by the 5’-UTR of c-JUN, were observed when the c-JUN mRNA was mutated at the eIF3 cross-linking site. Altogether, these data provide strong evidence that SL1 of the c-JUN 5’-UTR directly recruits eIF3 to drive translation of the downstream open reading frame.
Specialized translation initiation for c-JUN has similarities to IRES-driven translational initiation; in both cases, eIF3 recognizes specific RNA structures and these interactions drive recruitment of the mRNA to the ribosome for initiation of protein synthesis (Sizova et al, 1998; Kieft et al, 2001; Collier et al, 2002), but is also distinct because it requires cap recognition. While the interaction of eIF3 with IRESs has been investigated, very little is known regarding how eIF3 recognizes features of mRNAs that drive specialized translation initiation. Here, we report the structure of the RNA element found in the c-JUN 5’-UTR and compare it to HCV IRES subdomains recognized by eIF3.
Inspection of the NMR structure and SAXS-derived model shows that the RNA contains two internal loops, one well-structured and the second more flexible, that create atypical major groove widths and subtle bending of the hairpin from its helical axis. We generated computational models of the SL1-SL2 element that resembles the IRES structure and observed consistent coaxial stacking between the SL2 and the 5’-3’ termini. These features exhibit interesting parallels with secondary and three-dimensional structural features of the HCV IRES.
In IRESs, sequences that bind to eIF3 are inconsistently conserved (Smith et al, 1995; Brown et al, 1992; Kieft et al, 2001), suggesting that secondary and tertiary structural features of the RNA, rather than sequence, are recognized by eIF3. For instance, eIF3 recognition is completely suppressed only when subdomain IIIb, a 50-60 nucleotide stem-loop, is destabilized (Kieft et al, 2001, Collier et al, 2002). Our NMR structure of the c-JUN 5’-UTR and the SAXS models suggest that SL1-SL2 adopts a similar structure, suggesting these RNAs might be recognized similarly by eIF3.
Cryo-EM studies show that HCV IRES IIIabc subdomain binds to eIF3 between the highly basic eIF3a and eIF3c lobes within the eIF3 octameric core (Sun et al, 2013). The size of this pocket (70-75Å) fits the size of SL1-SL2 well, suggesting that the SL1-SL2 element, and not just SL1, is recruited by eIF3 in a manner that is similar to the IIIabc structure (Fig. 8A). This model provides a unified view of eIF3 in recruitment of IRES and of elements within the 5’-UTRs as occurs in c-JUN specialized translation initiation
Figure 8.
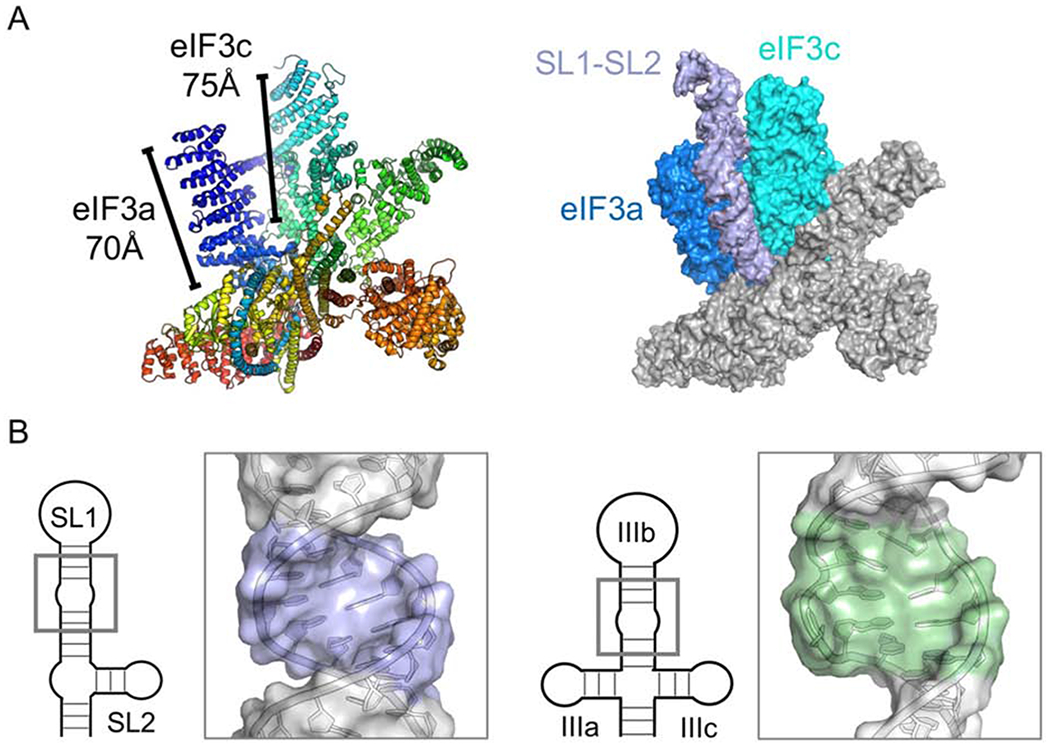
(A) (left) EIF3 recognizes the HCV IRES IIIabc in a highly basic cleft located between eIF3a (blue) and eIF3c (teal) (PDB: 5A5T); (right) the dimensions of SL1-SL2 fit within this cleft similarly to previously modeled HCV-like IRES IIIb subdomains (Sun et al, 2013; Hashem et al, 2013; Erzberger et al, 2014). (B) Comparison of the internal loops and enlarged major grooves associated with eIF3 recognition: (left) SL1, (right) HCV IRES IIIb.
In this model, HCV-like IRES and specialized translation initiation mechanisms both share similar modes of eIF3 recognition driven by the molecular shape of the RNA recognition elements, but the similarities between the c-JUN mRNA and HCV IRES IIIabc structures extend beyond size and secondary structure. The middle of the SL1 RNA contains a flexible cytosine-rich internal loop, which causes an enlarged major groove and a kink in the stem-loop, bending it away from its helical axis, much like subdomain IIIb, even if the detailed structural features responsible for the bending differ between the two (Fig. 8B). We hypothesize this internal loop region serves analogous roles in eIF3 recognition, although functional validation will be required to confirm this hypothesis.
Apical loops vary in size across HCV-like IRES IIIb subdomains making their contribution to specific recognition unclear. For instance, the CSFV IIIb domain harbors a stable tetraloop, whereas SL1 and HCV IIIb are capped by 11-14 nucleotides, flexible pyrimidine-rich loops (Brown et al, 1992). Pyrimidine-rich tracts are found in other IRES elements and have been shown to bind auxiliary proteins such as hnRNPs, increasing IRES activity (Jang et al, 1990; Luz et al; 1991; Conte et al, 2000; Hellen et al, 1994). This divergence poses the question of whether the SL1 apical loop binds proteins to regulate c-JUN translation rates as well.
Additional structural data of this RNA bound to eIF3 or its subunits, as well as functional data, will be needed to achieve an understanding of eIF3 recognition of c-JUN mRNA and its parallels with HCV-like IRES recognition. However, our chemical probing, SAXS, and NMR spectroscopy approach provides the first insight into three-dimensional RNA structures required for specialized translation initiation. HCV IRES subdomains are anti-viral drug targets (Gallego et al, 2002; Klinck et al, 2000; Dibrov et al, 2014), therefore, targeting the SL1 upper internal loop or the SL1-SL2 3-way junction may prove a viable approach for reducing specialized translation initiation of c-JUN and other proliferative genes that are aberrantly expressed in therapeutic resistant tumors.
Materials and Methods
RNA Preparation
All RNAs were transcribed in vitro using in-house T7 polymerase using DNA templates (Integrated DNA Technologies) containing the T7 promoter. Transcriptions were concentrated by ethanol precipitation and purified by gel extraction using 12.5-20% denaturing polyacrylamide gel electrophoresis. RNA was removed from gel fragments by electro-elution, concentrated by ethanol precipitation, resuspended in 20 mM sodium phosphate (pH = 6.0), 100mM KCl, 500mM NaCl, and 1mM EDTA buffer, then dialyzed into 20 mM sodium phosphate (pH = 6.0), 0.01mM EDTA for NMR data collection. Deuterated RNA samples were synthesized using partially deuterated (D-H5, H3’, H4’, H5’, H5’’) rNTPs (Cambridge Isotope Laboratories). 13C and 15N labeled samples were synthesized using fully labeled rNTPs (Cambridge Isotope Laboratories).
Selective 2’-OH Acylation Analyzed by Primer Extension (SHAPE)
SHAPE chemical probing on the SL1 construct to verify formation of the same secondary structure observed in the context of the complete 5’-UTR (Wilkinson et al, 2006). The resulting chemical modifications were analyzed by primer extension with a radiolabeled DNA oligonucleotide and separated by gel electrophoresis. In order to accommodate primer binding, SL1 was transcribed with a 3’-extension for priming reverse transcription. Chemical acylation and reverse transcription conditions followed a procedure similar to previous work (Barnwal et al, 2016). The secondary structure of SL1 was calculated using RNAStructure using SHAPE reactivities as soft restraints (Mathews et al, 2004). Secondary structure images were rendered with VARNA and colored based on RNAStructure output (Darty et al, 2009).
Small Angle X-ray Scattering (SAXS)
RNA samples for small angle X-ray scattering (SAXS) were prepared similarly to samples made for NMR measurements, but at the lower concentration range of 2-4 mg/ml. SAXS experiments were recorded on NANOSTAR, a small angle scattering spectrometer with a Bruker Turbo rotating Cu-Anode X-ray source at the National Magnetic Resonance Facility at Madison. The particle distance distribution function P(r) plots were calculated using GNOM (Svergun et al, 1992). Model generation followed a procedure similar to previous work (Barnwal et al, 2016). In summary, low resolution ab initio shape reconstruction was done first using DAMMIN (Svergun et al, 1999). A total of 20 models were generated with DAMMIN using in house written scripts. The best and final model was selected with a suite of software (DAMSEL, DAMSUP, DAMAVER and DAMFILT) (http://www.embl-hamburg.de/biosaxs) for comparison and fitting to the NMR structure (Volkov et al, 2003).
NMR Experiments
All NMR experiments were executed on Bruker Advance 800 or 600 MHz spectrometers equipped with triple resonance cryogenic probes. All NMR samples were prepared to 400 – 1000uM and, before each experiment, freshly annealed by heating to 90°C for 2-3 minutes and immediately snap cooled to −20°C. Excha ngeable 2D 1H-1H NOESY and 2D [1H-15N] HSQC spectra were recorded in 95% H2O/5% D2O in 20 mM phosphate buffer at pH 6.0 and 0.01 uM EDTA at 5°C The non-exchangeable 2D 1H-1H NOESY, 1H-1H TOCSY, 2D [1H-13C] HSQC, 1H-13C NOESY-HSQC were recorded in 99.9% D2O buffer at 25°C. The exchangeable and non-exchange able NOESY spectra were recorded with various mixing times (100–300 ms) to facilitate spectral assignments and quantification of cross peak intensities by comparison of with peaks corresponding to known distances (e.g. H5-H6). All NMR data were processed either with Topspin (www.bruker.com) or NMRPipe (Delaglio et al, 1995) and analyzed using Sparky (Lee et al, 2015) or CCPNMR (Vranken et al, 2005).
Experimental Constraints
Assignments of RNA spectra were guided by predicted RNA chemical shift values and using established NOE helical “walk” patterns (Wüthrich et al, 1986; Varani et al, 1996). Experimental constraints for structure calculations of SL1 were compiled by dividing the RNA into two segments: stem (93-114, 128-148) and apical loop (115-127). Stem constraints were obtained by grafting a UUCG tetraloop to replace the dynamic apical loop to generate construct TL1, that improved spectral quality. We have often found that large flexible apical loops, as found in this RNA, lead to loss of spectra quality, perhaps by inducing aggregation (Varani et al, 1991; Barnwal et al 2016). TL1 assignments were used in restrained molecular dynamics calculations of the stem structure. Overlay of TL1 2D 1H-1H NOESY spectra with a spectrum of perdeuterated SL1 showed remarkable similarities in the chemical shifts and allowed the direct transfer of TL1 assignments to SL1 assignments for apical loop calculations. Distance restraints were derived from NOE intensities and organized into ‘strong’ (2.5Å ± 0.7Å), ‘medium’ (3.5Å ± 1.5Å), and ‘weak’ (4.5Å ± 2.0Å) bins based on peak intensities relative to fixed A-form helical distances (e.g. H5-H6 = 2.5Å, H3’-H6/H8 = 3.5Å). Restraints for overlapped regions were confirmed using truncated version of TL1 (TL-BOT and TL-TOP) in addition to corroboration by 3D 13C-NOESY-HSQC spectra. Hydrogen bond, planarity and dihedral restraints were included for base-paired nucleotides that were surrounded by base-pairs confirming to A-form helicity.
Structure Calculations
Xplor-NIH was used for all structure calculations (Schwieters et al, 2003). Compiled experimental restraints are initially used in a simulated annealing procedure starting from randomized coordinates and initially undergo high temperature (3500K to 298K) torsional angle dynamics where incremental decreases in temperature are represented by progressively introducing van der Waals terms and raising the force constants for angles, dihedral angles, NOEs and van der Waals repulsions. Following the final cooling step, the molecule underwent two sequential refinement steps in torsional angle space, then in Cartesian space. The lowest energy structure with minimum violations of distance (>0.5A) or torsion angle (>5°) restraints were used for in a follow-up refinement step incorporating a statistical base-base position potential for base-paired nucleotides. The 10 structure TL1 ensemble was calculated from 200 independent calculations using restraints from NOESY experiments and predicted values for A-type helical base-pairs (backbone and ribose dihedral angles, hydrogen-bond and planarity distance restraints). The 10-structure SL1 ensemble was calculated from 200 independent calculations using all NOE restraints from TL1 for residues 93-113 and 129-148 based on <0.1 ppm chemical shift overlap between the two spectra, NOEs from deuterated SL1 D2O NOESY spectra, and predicted values for A-type helical base-pairs (backbone and ribose dihedral angles, hydrogen-bond and planarity distance restraints).
Molecular Dynamic Simulations
A coarse grain molecular dynamics simulation software, simRNA, was used to computationally model SL1-SL2 (Boniecki, 2016). These calculations were performed in parallel, using the replica exchange Monte Carlo method, on the NMRBox server (Maciejewski et al., 2017). The secondary structure restraints were based on H1 and H3 imino resonance assignments from constructs SL1, TL1*-SL1 and TL1*-TL2. The total amount of time to run these calculations was approximately 323 CPU hours, using 3 CPUs per structure and 15 models per CPU. After obtaining the general topology of each model using simRNA, the models were further refined using a full atom minimization in Rosetta RNA De Novo (Das et al, 2010).
Computational Modeling
Structural analysis and RMSD calculations were done using a combination of PyMol and VMD (Schrödinger LLC, 2010; Humphrey et al, 1996). SAXS models were fitted using Chimera and positions were validated based on best global superposition relative to the structure coordinates (Pettersen et al, 2004; Cantara et al, 2017). The SL1-SL2 model bound to eIF3 was initially built by recognizing eIF3a and eIF3c subunits from previously predicted binding sites for HCV-IRES IIIabc domain (Sun et al, 2013; Hashem et al, 2013; Erzberger et al, 2014) and inspection of eIF3 subunits (PDB: 5A5T) with basic patches, indicative of high nucleic acid binding affinity based on global electronegativity mapping using PyMol. Previous models of IRES elements bound to eIF3 locate the RNA within a cleft formed by the eIF3a and eIF3c subunits, which is also rich is basic sidechains. Positioning of SL1-SL2 was first attempted using the Chimera docking tool followed by modifications in PyMol for realistic positioning of the solvent exposed portion of SL1-SL2.
Supplementary Material
Supplementary Figure S1. Clustal Omega multiple sequence alignment for human c-JUN mRNA from NM_002228. Nucleotides 81-179 are displayed and listed based on similarity to the human sequence. Species shown are those with almost identical sequence alignment and highly conserved secondary structure when predicted by the Mfold web server.
Supplementary Figure S4. H2O NOESY spectrum of SL1 RNA, with black dotted lines showing sequential NOE interactions involving imino protons. The red dotted line represents the strong U103-H3 to U139-H3 NOE supportive of the U103-U139 base-pair.
Supplementary Figure S5. Comparison of H6 and H8 chemical shifts values for SL1 and TL1 based on comparison of D2O NOESY spectra.
Supplementary Figure S6. (A) Global superposition of the 10 lowest energy structures from the ensemble of converged structure for the TL1 stem-loop. (B) Narrowest and widest major groove widths among converged structures are measured from A101-P to A134-P and C104 to A131, respectively.
Supplementary Figure S7. D2O NOESY spectrum recorded for SL1 using a highly deuterated sample were deuterium was replaced for protons C5, C2’, C3’, C4’, C5’, and C5’’ for each nucleotide. Black dotted lines represent sequential H1’ to H6/H8 “helical walk” NOE connectivities for apical loop nucleotides A113 to U129.
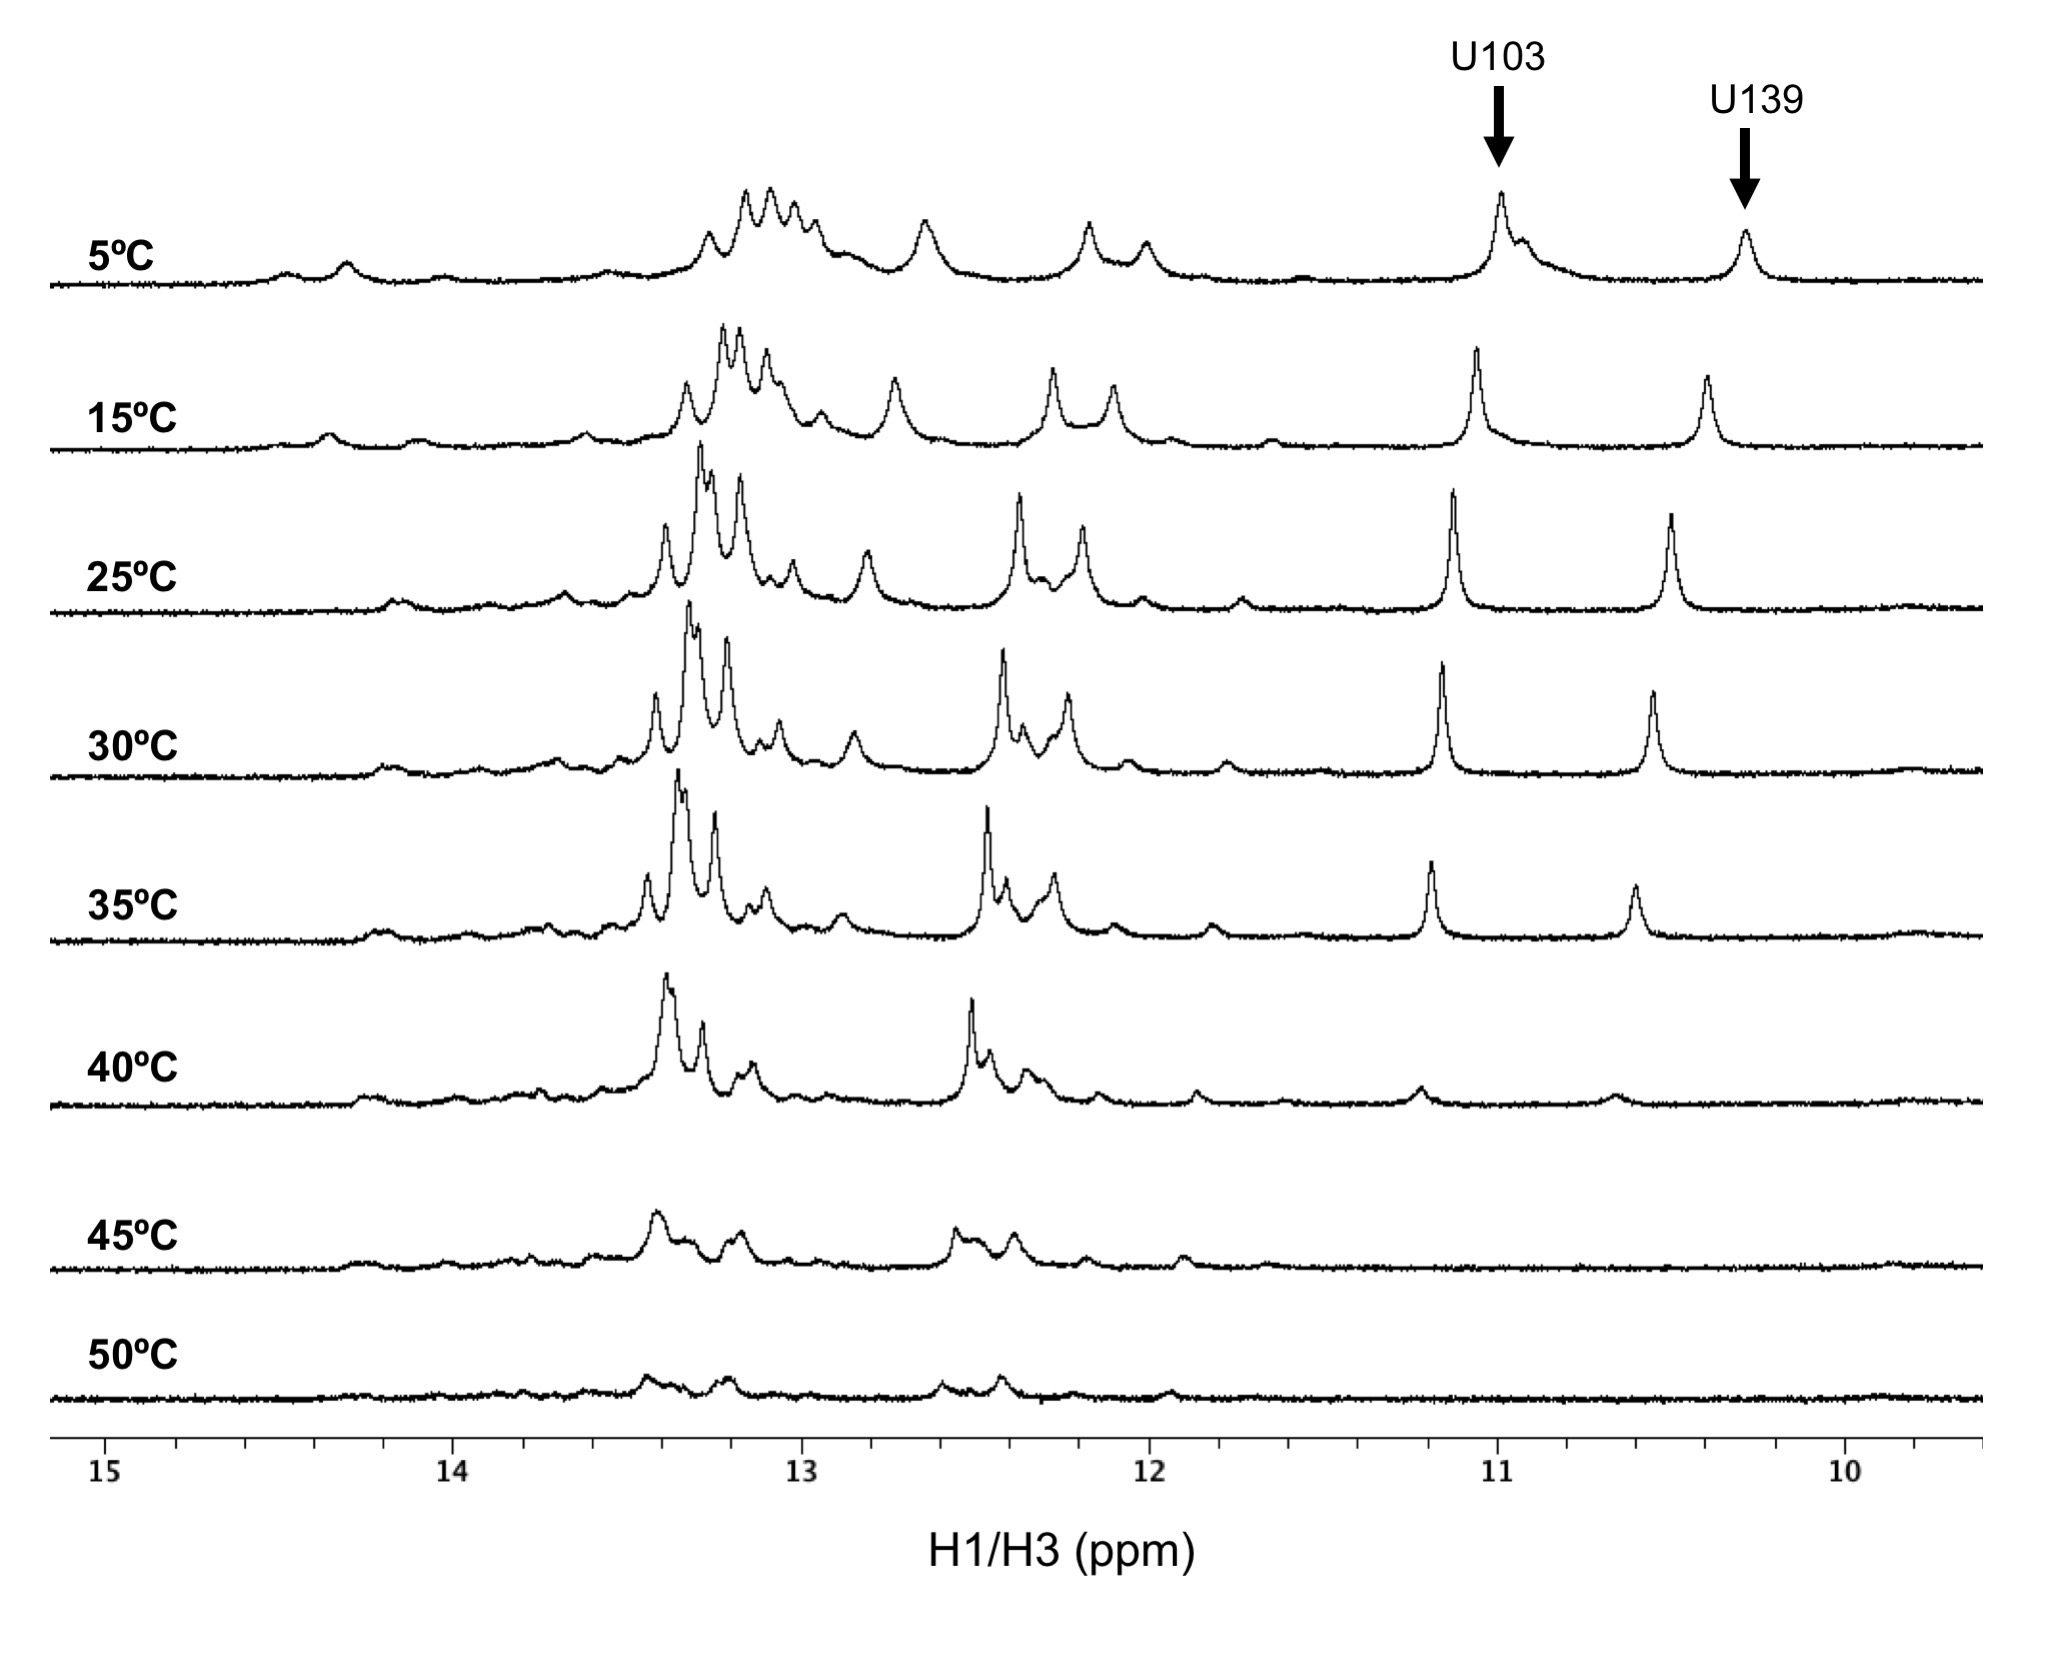
Supplementary Figure S8. 1D 1H spectra for SL1 where U103 and U139 are tracked for spectra collected between 5°C and 50°C in 5°C i ncrements. Stable formation of the U103-U139 base-pair is observed until 45°C.
Supplementary Figure S9. 1D 1H spectra for SL1-SL2 where U103 and U139 are tracked for spectra collected between 5°C and 50°C in 5°C increments. Stable formation of the U103-U139 base-pair is observed until 45°C.
Supplementary Figure S10. (A) Representation of the secondary structure and sequence of SL1-SL2 and TL1*-SL2 construct. TL1*-SL2 was designed to have SL1 truncated and capped by a tetraloop to facilitate H2O NOESY peak assignments. (B) 1D 1H spectra for SL1-SL2 compared to the truncated TL1*-SL2. (*) indicates resonances originating in the cUUCGc tetraloop.
Supplementary Figure S11. (left) Representation of the TL1*-SL2 sequence and secondary structure, where SL1 is truncated at the A96-U145 base-pair and capped with a cUUCGg tetraloop to facilitate resonance assignments. (right) Assigned H2O NOESY spectrum for the same RNA.
Supplementary Figure S12. (left) Representation of the TL1*-TL2 sequence and secondary structure, where SL1 is truncated at the A96-U145 base-pair and capped with a cUUCGg tetraloop to facilitate resonance assignments. SL2 is capped with a cGAAAg tetraloop facilitate resonance assignments. (right) Assigned H2O NOESY spectrum for the same RNA.
Supplementary Figure S13. (A) Lowest energy model calculated from simRNA (Boniecki, 2016) and refined by Rosetta RNA De Novo energy minimization (Das et al, 2010) for SL1-SL2. (B) 24 simRNA-generated models sectionally aligned to the Rosetta RNA De Novo energy minimization model. Secondary structures represented for each individual section: SL1 (93-148; RMSD = 4.07 Å), SL2 & 5’-3’ helix (81-90, 151-179; RMSD = 4.22 Å), 3-way helical junction (89-94, 147-152, 168-171; RMSD = 2.56 Å).
Table S1. NMR and refinement statistics for TL1 RNA.
Table S2. NMR and refinement statistics for SL1 RNA.
Supplementary Figure S2. (left) TL1-TOP sequence and secondary structure. (right) Assigned H2O NOESY spectrum revealing base-paired imino protons corresponding to G106 to A114, and U128 to C136.
Supplementary Figure S3. (left) TL1-BOT sequence and secondary structure. (right) Assigned H2O NOESY spectrum revealing for base-paired imino protons corresponding to G93 to U103, and U139 to C148.
The structure of the RNA specialized translation initiation element that recruits eIF3 to the 5’-UTR of the proto-oncogene c-Jun is reported and compared with Hepatitis C Virus (HCV) IRES.
The similarity in structure suggests that c-JUN specialized translation initiation elements and HCV-like IRESs recognize eIF3 in structurally similar ways.
This model provides a unified view of recruitment of eIF3 by IRES and by elements within the 5’-UTRs as occurs in c-JUN specialized translation initiation.
Acknowledgments
We are grateful to Dr. Paulo F. Cobra and Dr. Kai Cai for help with the collection of SAXS data at the National Magnetic Resonance Facility in University of Wisconsin-Madison. We are also thankful to Dr. Rajan K. Paranji at the University of Washington for guidance while establishing pulse programs for RDC experiments.
Funding
Supported by NIH NIGMS grant 1 R35 GM121487 and 1 R01 GM103834 and NSF grant 1613678. SAXS studies made use of the National Magnetic Resonance Facility at Madison, which is supported by NIH grant P41GM103399 (NIGMS). SAXS studies were supported by funds from NIH shared instrumentation grant S10RR027000 and the University of Wisconsin-Madison.
Footnotes
Publisher's Disclaimer: This is a PDF file of an unedited manuscript that has been accepted for publication. As a service to our customers we are providing this early version of the manuscript. The manuscript will undergo copyediting, typesetting, and review of the resulting proof before it is published in its final form. Please note that during the production process errors may be discovered which could affect the content, and all legal disclaimers that apply to the journal pertain.
References
- 1.Andaya A, Villa N, Jia W, Fraser CS, Leary JA. Phosphorylation stoichiometries of human eukaryotic initiation factors. Int J Mol Sci. 2014;15(7):11523–38. [DOI] [PMC free article] [PubMed] [Google Scholar]
- 2.Anger AM, Armache JP, Berninghausen O, et al. Structures of the human and Drosophila 80S ribosome. Nature. 2013;497(7447):80–5. [DOI] [PubMed] [Google Scholar]
- 3.Barnwal RP, Loh E, Godin KS, et al. Structure and mechanism of a molecular rheostat, an RNA thermometer that modulates immune evasion by Neisseria meningitidis. Nucleic Acids Res. 2016;44(19):9426–9437. [DOI] [PMC free article] [PubMed] [Google Scholar]
- 4.Bhat M, Robichaud N, Hulea L, Sonenberg N, Pelletier J, Topisirovic I. Targeting the translation machinery in cancer. Nat Rev Drug Discov. 2015;14(4):261–78. [DOI] [PubMed] [Google Scholar]
- 5.Blau L, Knirsh R, Ben-Dror I, Oren S, Kuphal S, Hau P, … Vardimon L Aberrant expression of c-Jun in glioblastoma by internal ribosome entry site (IRES)-mediated translational activation. Proceedings of the National Academy of Sciences. 2012;109(42), E2875–E2884. [DOI] [PMC free article] [PubMed] [Google Scholar]
- 6.Boniecki MJ, Lach G, Dawson WK, et al. SimRNA: a coarse-grained method for RNA folding simulations and 3D structure prediction. Nucleic Acids Res. 2016;44(7):e63. [DOI] [PMC free article] [PubMed] [Google Scholar]
- 7.Brown ES, Zhang H, Ping LH, Lemon SM. Secondary structure of the 59 nontranslated regions of hepatitis C virus and pestivirus genomic RNAs. Nucleic Acids Res. 1992; 20:5041–5045. [DOI] [PMC free article] [PubMed] [Google Scholar]
- 8.Buratti E, Tisminetzky S, Zotti M, Baralle FE. Functional analysis of the interaction between HCV 5’UTR and putative subunits of eukaryotic translation initiation factor eIF3. Nucleic Acids Res. 1998;26(13):3179–87. [DOI] [PMC free article] [PubMed] [Google Scholar]
- 9.Cantara WA, Olson ED, Musier-forsyth K. Analysis of RNA structure using small-angle X-ray scattering. Methods. 2017;113:46–55. [DOI] [PMC free article] [PubMed] [Google Scholar]
- 10.Chard LS, Kaku Y, Jones B, Nayak A, Belsham GJ. Functional analyses of RNA structures shared between the internal ribosome entry sites of hepatitis C virus and the picornavirus porcine teschovirus 1 Talfan. J Virol. 2006;80(3):1271–9. [DOI] [PMC free article] [PubMed] [Google Scholar]
- 11.Collier AJ, Gallego J, Klinck R, et al. A conserved RNA structure within the HCV IRES eIF3-binding site. Nat Struct Biol. 2002;9(5):375–80. [DOI] [PubMed] [Google Scholar]
- 12.Collier AJ, Gallego J, Klinck R, et al. A conserved RNA structure within the HCV IRES eIF3-binding site. Nat Struct Biol. 2002;9(5):375–80. [DOI] [PubMed] [Google Scholar]
- 13.Conte MR, Grüne T, Ghuman J, et al. Structure of tandem RNA recognition motifs from polypyrimidine tract binding protein reveals novel features of the RRM fold. EMBO J. 2000;19(12):3132–41. [DOI] [PMC free article] [PubMed] [Google Scholar]
- 14.Darty K, Denise A, Ponty Y. VARNA: Interactive drawing and editing of the RNA secondary structure. Bioinformatics. 2009;25(15):1974–5. [DOI] [PMC free article] [PubMed] [Google Scholar]
- 15.Das R, Karanicolas J, and Baker D “Atomic accuracy in predicting and designing noncanonical RNA structure”. Nature Methods. 2010;7:291–294. [DOI] [PMC free article] [PubMed] [Google Scholar]
- 16.De la parra C, Ernlund A, Alard A, Ruggles K, Ueberheide B, Schneider RJ. A widespread alternate form of cap-dependent mRNA translation initiation. Nat Commun. 2018;9(1):3068. [DOI] [PMC free article] [PubMed] [Google Scholar]
- 17.Delaglio F, Grzesiek S, Vuister GW, Zhu G, Pfeifer J, Bax A. NMRPipe: a multidimensional spectral processing system based on UNIX pipes. J Biomol NMR. 1995;6(3):277–93. [DOI] [PubMed] [Google Scholar]
- 18.Dibrov SM, Parsons J, Carnevali M, et al. Hepatitis C virus translation inhibitors targeting the internal ribosomal entry site. J Med Chem. 2014;57(5):1694–707. [DOI] [PMC free article] [PubMed] [Google Scholar]
- 19.Erzberger JP, Stengel F, Pellarin R, et al. Molecular Architecture of the 40S-eIF1-eIF3 Translation Initiation Complex. Cell. 2014;159(5):1227–1228. [DOI] [PMC free article] [PubMed] [Google Scholar]
- 20.Fraser CS, Doudna JA. Structural and mechanistic insights into hepatitis C viral translation initiation. Nat Rev Microbiol. 2007;5(1):29–38. [DOI] [PubMed] [Google Scholar]
- 21.Gallego J, Varani G. The hepatitis C virus internal ribosome-entry site: a new target for antiviral research. Biochem Soc Trans. 2002;30(2):140–5. [DOI] [PubMed] [Google Scholar]
- 22.Hashem Y, Des georges A, Dhote V, et al. Hepatitis-C-virus-like internal ribosome entry sites displace eIF3 to gain access to the 40S subunit. Nature. 2013;503(7477):539–43. [DOI] [PMC free article] [PubMed] [Google Scholar]
- 23.Hellen CU, Pestova TV, Litterst M, Wimmer E. The cellular polypeptide p57 (pyrimidine tract-binding protein) binds to multiple sites in the poliovirus 5’ nontranslated region. J Virol. 1994;68(2):941–50. [DOI] [PMC free article] [PubMed] [Google Scholar]
- 24.Hellen CU, Sarnow P. Internal ribosome entry sites in eukaryotic mRNA molecules. Genes Dev. 2001;15(13):1593–612. [DOI] [PubMed] [Google Scholar]
- 25.Holcik M, Sonenberg N, Korneluk RG. Internal ribosome initiation of translation and the control of cell death. Trends Genet. 2000;16(10):469–73. [DOI] [PubMed] [Google Scholar]
- 26.Hsieh AC, Liu Y, Edlind MP, Ingolia NT, Janes MR, Sher A, … D. Ruggero (2012). The translational landscape of mTOR signalling steers cancer initiation and metastasis. Nature, 485(7396), 55–61. [DOI] [PMC free article] [PubMed] [Google Scholar]
- 27.Humphrey W, Dalke A, and Schulten K VMD: visual molecular dynamics., J Mol Graph 14 1996;33–38, 27–38. [DOI] [PubMed] [Google Scholar]
- 28.Jackson RJ, Hellen CU, Pestova TV. The mechanism of eukaryotic translation initiation and principles of its regulation. Nat Rev Mol Cell Biol. 2010;11 (2): 113–27. [DOI] [PMC free article] [PubMed] [Google Scholar]
- 29.Jang SK, Wimmer E. Cap-independent translation of encephalomyocarditis virus RNA: structural elements of the internal ribosomal entry site and involvement of a cellular 57-kD RNA-binding protein. Genes Dev. 1990;4(9):1560–72. [DOI] [PubMed] [Google Scholar]
- 30.Johannes G, Carter MS, Eisen MB, Brown PO, Sarnow P. Identification of eukaryotic mRNAs that are translated at reduced cap binding complex eIF4F concentrations using a cDNA microarray. Proc Natl Acad Sci USA. 1999;96(23):13118–23. [DOI] [PMC free article] [PubMed] [Google Scholar]
- 31.Johnson R, Spiegelman B, Hanahan D, & Wisdom R Cellular transformation and malignancy induced by ras require c-jun. Molecular and Cellular Biology. 1996;16(8), 4504–11. [DOI] [PMC free article] [PubMed] [Google Scholar]
- 32.Khan D, Bhat P, Das S. HCV-like IRESs sequester eIF3: advantage virus. Trends Microbiol. 2014;22(2):57–8. [DOI] [PubMed] [Google Scholar]
- 33.Kieft JS, Zhou K, Grech A, Jubin R, Doudna JA. Crystal structure of an RNA tertiary domain essential to HCV IRES-mediated translation initiation. Nat Struct Biol. 2002;9(5):370–4. [DOI] [PubMed] [Google Scholar]
- 34.Kieft JS, Zhou K, Jubin R, Doudna JA. Mechanism of ribosome recruitment by hepatitis C IRES RNA. RNA. 2001;7(2):194–206. [DOI] [PMC free article] [PubMed] [Google Scholar]
- 35.Klinck R, Westhof E, Walker S, Afshar M, Collier A, Aboul-ela F. A potential RNA drug target in the hepatitis C virus internal ribosomal entry site. RNA. 2000;6(10):1423–31. [DOI] [PMC free article] [PubMed] [Google Scholar]
- 36.Lee AS, Kranzusch PJ, Cate JH. eIF3 targets cell-proliferation messenger RNAs for translational activation or repression. Nature. 2015;522(7554):111–4. [DOI] [PMC free article] [PubMed] [Google Scholar]
- 37.Lee AS, Kranzusch PJ, Doudna JA, Cate JH. eIF3d is an mRNA cap-binding protein that is required for specialized translation initiation. Nature. 2016;536(7614):96–9. [DOI] [PMC free article] [PubMed] [Google Scholar]
- 38.Lee W, Tonelli M, Markley JL. NMRFAM-SPARKY: enhanced software for biomolecular NMR spectroscopy. Bioinformatics. 2015;31(8):1325–7. [DOI] [PMC free article] [PubMed] [Google Scholar]
- 39.Lescoute A, Westhof E. Topology of three-way junctions in folded RNAs. RNA. 2006;12(1):83–93. [DOI] [PMC free article] [PubMed] [Google Scholar]
- 40.Lipsitz RS, Tjandra N. Residual dipolar couplings in NMR structure analysis. Annu Rev Biophys Biomol Struct. 2004;33:387–413. [DOI] [PubMed] [Google Scholar]
- 41.Lu XJ, Olson WK. 3DNA: a software package for the analysis, rebuilding and visualization of three-dimensional nucleic acid structures. Nucleic Acids Res. 2003;31(17):5108–21. [DOI] [PMC free article] [PubMed] [Google Scholar]
- 42.Luz N, Beck E. Interaction of a cellular 57-kilodalton protein with the internal translation initiation site of foot-and-mouth disease virus. J Virol. 1991;65(12):6486–94. [DOI] [PMC free article] [PubMed] [Google Scholar]
- 43.Maciejewski MW, Schuyler AD, Gryk MR, et al. NMRbox: A Resource for Biomolecular NMR Computation. Biophys J. 2017;112(8):1529–1534. [DOI] [PMC free article] [PubMed] [Google Scholar]
- 44.Mathews DH, Disney MD, Childs JL, Schroeder SJ, Zuker M, Turner DH. Incorporating chemical modification constraints into a dynamic programming algorithm for prediction of RNA secondary structure. Proc Natl Acad Sci USA. 2004; 101(19):7287–92. [DOI] [PMC free article] [PubMed] [Google Scholar]
- 45.Pestova TV, Shatsky IN, Fletcher SP, Jackson RJ, Hellen CU. A prokaryotic-like mode of cytoplasmic eukaryotic ribosome binding to the initiation codon during internal translation initiation of hepatitis C and classical swine fever virus RNAs. Genes Dev. 1998;12(1):67–83. [DOI] [PMC free article] [PubMed] [Google Scholar]
- 46.Pettersen EF, Goddard TD, Huang CC, et al. UCSF Chimera--a visualization system for exploratory research and analysis. J Comput Chem. 2004;25(13):1605–12. [DOI] [PubMed] [Google Scholar]
- 47.Quade N, Boehringer D, Leibundgut M, Van den heuvel J, Ban N. Cryo-EM structure of Hepatitis C virus IRES bound to the human ribosome at 3.9-A resolution. Nat Commun. 2015;6:7646. [DOI] [PMC free article] [PubMed] [Google Scholar]
- 48.Querol-audi J, Sun C, Vogan JM, et al. Architecture of human translation initiation factor 3. Structure. 2013;21(6):920–8. [DOI] [PMC free article] [PubMed] [Google Scholar]
- 49.Schrodinger LLC. (2010) The PyMOL Molecular Graphics System, Version 1.3r1. [Google Scholar]
- 50.Schwieters CD, Clore GM. Using small angle solution scattering data in Xplor-NIH structure calculations. Prog Nucl Magn Reson Spectrosc. 2014;80:1–11. [DOI] [PMC free article] [PubMed] [Google Scholar]
- 51.Schwieters CD, Kuszewski JJ, Tjandra N, Clore GM. The Xplor-NIH NMR molecular structure determination package. J Magn Reson. 2003;160(1):65–73. [DOI] [PubMed] [Google Scholar]
- 52.Silvera D, Formenti SC, Schneider RJ. Translational control in cancer. Nat Rev Cancer. 2010;10(4):254–66. [DOI] [PubMed] [Google Scholar]
- 53.Silvera D, Formenti SC, Schneider RJ. Translational control in cancer. Nat Rev Cancer. 2010;10(4):254–66. [DOI] [PubMed] [Google Scholar]
- 54.Sizova DV, Kolupaeva VG, Pestova TV, Shatsky IN, Hellen CU. Specific interaction of eukaryotic translation initiation factor 3 with the 5’ nontranslated regions of hepatitis C virus and classical swine fever virus RNAs. J Virol. 1998;72(6):4775–82. [DOI] [PMC free article] [PubMed] [Google Scholar]
- 55.Stumpf CR, & Ruggero D (2011). The cancerous translation apparatus. Current Opinion in Genetics and Development, 21(4), 474–483. [DOI] [PMC free article] [PubMed] [Google Scholar]
- 56.Sun C, Querol-audi J, Mortimer SA, et al. Two RNA-binding motifs in eIF3 direct HCV IRES-dependent translation. Nucleic Acids Res. 2013;41(15):7512–21. [DOI] [PMC free article] [PubMed] [Google Scholar]
- 57.Svergun DI. Restoring low resolution structure of biological macromolecules from solution scattering using simulated annealing. Biophys J. 1999;76(6):2879–86. [DOI] [PMC free article] [PubMed] [Google Scholar]
- 58.Svergun DI Determination of the regularization parameter in indirect-transform methods using perceptual criteria. J. Appl. Crystallogr 1992;25, 495–503 [Google Scholar]
- 59.Terenin IM, Smirnova VV, Andreev DE, Dmitriev SE, Shatsky IN. A researcher’s guide to the galaxy of IRESs. Cell Mol Life Sci. 2017;74(8):1431–1455. [DOI] [PMC free article] [PubMed] [Google Scholar]
- 60.Truitt ML, Ruggero D. New frontiers in translational control of the cancer genome. Nat Rev Cancer. 2016;16(5):288–304. [DOI] [PMC free article] [PubMed] [Google Scholar]
- 61.Valášek LS, Zeman J, Wagner S, et al. Embraced by eIF3: structural and functional insights into the roles of eIF3 across the translation cycle. Nucleic Acids Res. 2017;45(19):10948–10968. [DOI] [PMC free article] [PubMed] [Google Scholar]
- 62.Varani G, Aboul-ela F, & Allain FH-T NMR investigation of RNA structure. Progress in NMR Spectroscopy. (1996); 29(96), 51–127. [Google Scholar]
- 63.Varani G, Cheong C, & Tinoco I Jr. Structure of an Unusually Stable RNA Hairpin. Biochemistry. 1991;30(13), 3280–3289. [DOI] [PubMed] [Google Scholar]
- 64.Vranken WF, Boucher W, Stevens TJ, et al. The CCPN data model for NMR spectroscopy: development of a software pipeline. Proteins. 2005;59(4):687–96. [DOI] [PubMed] [Google Scholar]
- 65.Wilkinson KA, Merino EJ, Weeks KM. Selective 2’-hydroxyl acylation analyzed by primer extension (SHAPE): quantitative RNA structure analysis at single nucleotide resolution. Nat Protoc. 2006;1(3):1610–6. [DOI] [PubMed] [Google Scholar]
- 66.Wisdom R, Johnson RS, & Moore C c-Jun regulates cell cycle progression and apoptosis by distinct mechanisms. The EMBO Journal. 1999;18(1), 188–97. [DOI] [PMC free article] [PubMed] [Google Scholar]
- 67.Wüthrich Kurt. (1986) NMR of Proteins and Nucleic Acids. (New York: John Wiley & Sons; ). [Google Scholar]
- 68.Zuker M Mfold web server for nucleic acid folding and hybridization prediction. Nucleic Acids Res. 2003;31(13):340x6–15. [DOI] [PMC free article] [PubMed] [Google Scholar]
Associated Data
This section collects any data citations, data availability statements, or supplementary materials included in this article.
Supplementary Materials
Supplementary Figure S1. Clustal Omega multiple sequence alignment for human c-JUN mRNA from NM_002228. Nucleotides 81-179 are displayed and listed based on similarity to the human sequence. Species shown are those with almost identical sequence alignment and highly conserved secondary structure when predicted by the Mfold web server.
Supplementary Figure S4. H2O NOESY spectrum of SL1 RNA, with black dotted lines showing sequential NOE interactions involving imino protons. The red dotted line represents the strong U103-H3 to U139-H3 NOE supportive of the U103-U139 base-pair.
Supplementary Figure S5. Comparison of H6 and H8 chemical shifts values for SL1 and TL1 based on comparison of D2O NOESY spectra.
Supplementary Figure S6. (A) Global superposition of the 10 lowest energy structures from the ensemble of converged structure for the TL1 stem-loop. (B) Narrowest and widest major groove widths among converged structures are measured from A101-P to A134-P and C104 to A131, respectively.
Supplementary Figure S7. D2O NOESY spectrum recorded for SL1 using a highly deuterated sample were deuterium was replaced for protons C5, C2’, C3’, C4’, C5’, and C5’’ for each nucleotide. Black dotted lines represent sequential H1’ to H6/H8 “helical walk” NOE connectivities for apical loop nucleotides A113 to U129.
Supplementary Figure S8. 1D 1H spectra for SL1 where U103 and U139 are tracked for spectra collected between 5°C and 50°C in 5°C i ncrements. Stable formation of the U103-U139 base-pair is observed until 45°C.
Supplementary Figure S9. 1D 1H spectra for SL1-SL2 where U103 and U139 are tracked for spectra collected between 5°C and 50°C in 5°C increments. Stable formation of the U103-U139 base-pair is observed until 45°C.
Supplementary Figure S10. (A) Representation of the secondary structure and sequence of SL1-SL2 and TL1*-SL2 construct. TL1*-SL2 was designed to have SL1 truncated and capped by a tetraloop to facilitate H2O NOESY peak assignments. (B) 1D 1H spectra for SL1-SL2 compared to the truncated TL1*-SL2. (*) indicates resonances originating in the cUUCGc tetraloop.
Supplementary Figure S11. (left) Representation of the TL1*-SL2 sequence and secondary structure, where SL1 is truncated at the A96-U145 base-pair and capped with a cUUCGg tetraloop to facilitate resonance assignments. (right) Assigned H2O NOESY spectrum for the same RNA.
Supplementary Figure S12. (left) Representation of the TL1*-TL2 sequence and secondary structure, where SL1 is truncated at the A96-U145 base-pair and capped with a cUUCGg tetraloop to facilitate resonance assignments. SL2 is capped with a cGAAAg tetraloop facilitate resonance assignments. (right) Assigned H2O NOESY spectrum for the same RNA.
Supplementary Figure S13. (A) Lowest energy model calculated from simRNA (Boniecki, 2016) and refined by Rosetta RNA De Novo energy minimization (Das et al, 2010) for SL1-SL2. (B) 24 simRNA-generated models sectionally aligned to the Rosetta RNA De Novo energy minimization model. Secondary structures represented for each individual section: SL1 (93-148; RMSD = 4.07 Å), SL2 & 5’-3’ helix (81-90, 151-179; RMSD = 4.22 Å), 3-way helical junction (89-94, 147-152, 168-171; RMSD = 2.56 Å).
Table S1. NMR and refinement statistics for TL1 RNA.
Table S2. NMR and refinement statistics for SL1 RNA.
Supplementary Figure S2. (left) TL1-TOP sequence and secondary structure. (right) Assigned H2O NOESY spectrum revealing base-paired imino protons corresponding to G106 to A114, and U128 to C136.
Supplementary Figure S3. (left) TL1-BOT sequence and secondary structure. (right) Assigned H2O NOESY spectrum revealing for base-paired imino protons corresponding to G93 to U103, and U139 to C148.