

Abstract
The coordination of DNA unwinding and synthesis at replication forks promotes efficient and faithful replication of chromosomal DNA. Disruption of the balance between helicase and polymerase activities during replication stress leads to fork progression defects and activation of the Rad53 checkpoint kinase, which is essential for the functional maintenance of stalled replication forks. The mechanism of Rad53-dependent fork stabilization is not known. Using reconstituted budding yeast replisomes, we show that mutational inactivation of the leading strand DNA polymerase, Pol ε dNTP depletion, or chemical inhibition of DNA polymerases cause excessive DNA unwinding by the replicative DNA helicase, CMG, demonstrating that budding yeast replisomes lack intrinsic mechanisms that control helicase-polymerase coupling at the fork. Importantly, we find that the Rad53 kinase restricts excessive DNA unwinding at replication forks by limiting CMG helicase activity, suggesting a mechanism for fork-stabilization by the replication checkpoint.
INTRODUCTION
The maintenance of genomes across generations depends on the rapid, complete, and accurate replication of DNA. Proteins involved in cellular DNA replication assemble into large multi-subunit complexes, called replisomes, which facilitate the coordination of DNA unwinding and DNA synthesis. In addition to limiting the generation of unstable single-stranded DNA (ssDNA), the physical and functional coupling of helicase and polymerase within replisomes promotes maximal fork rates1–5. However, the coupling of DNA unwinding and synthesis at replication forks is challenged in replication stress conditions that inhibit the polymerase, but not the helicase. Uncoupling of helicase progression from DNA synthesis has been observed when the replisome encounters DNA lesions or DNA-protein crosslinks on the leading strand template, or as a result of the inhibition of DNA polymerase activity, either by mutation of Pol α-primase, chemical inhibition with aphidicolin, or by limiting intracellular dNTP levels using the ribonucleotide reductase inhibitor, hydroxyurea (HU)6–13. Consistent with DNA polymerase activity promoting replisome progression, the eukaryotic replicative DNA helicase, CMG (Cdc45-MCM-GINS), slows down significantly when uncoupled from DNA synthesis7,9,14. A similar reduction in helicase speed was observed upon stochastic helicase-polymerase uncoupling at reconstituted E. coli replication forks, which led to the proposal that the intrinsic slowing of the replicative DNA helicase after uncoupling from DNA synthesis acts as a “dead man’s switch” that limits the length of ssDNA tracks at the fork and facilitates helicase-polymerase recoupling15.
Yet, this failsafe mechanism is not sufficient to protect forks from irreversible breakdown, or collapse, in eukaryotic cells, as these are critically dependent on a highly conserved genome surveillance pathway, called the DNA replication checkpoint (DRC), to recover from blocks to DNA replication16. The DRC is a kinase signaling cascade that is initiated by the apical checkpoint sensor kinase, Mec1-Ddc2 in budding yeast or ATR-ATRIP in vertebrates, culminating in the activation of the downstream checkpoint effector kinase, Rad53 in budding yeast or CHK1 in vertebrates, which orchestrates the cellular stress response. It is thought that ssDNA generated by CMG uncoupled from DNA synthesis provides a platform for the activation of Mec1-Ddc2 and ATR-ATRIP17. Thus, helicase slowing after uncoupling from DNA synthesis may balance checkpoint activation with the generation of potentially deleterious ssDNA7.
Although the checkpoint elicits a host of responses that promote cell viability, including cell cycle arrest, induction of higher dNTP levels, regulation of nucleases, and inhibition of origin firing, the essential function of the checkpoint in yeast is to prevent the collapse of stalled forks18. How the checkpoint protects stalled forks from collapse is not known. Loss of checkpoint function compromises the structural integrity of stalled replication forks, resulting in the accumulation of unusual replication intermediates with abnormally high levels of ssDNA10,13,19,20. While the checkpoint does not seem to be required to maintain the integrity of replisome complexes per se21,22, it has been suggested to control replisome progression after inhibition of DNA synthesis to suppress the accumulation of ssDNA due to helicase-polymerase uncoupling10–13,21,23, although some studies have found that replisome progression is not controlled by the checkpoint24–26.
Both Mec1 and Rad53 target a host of proteins in order to mediate the checkpoint response in S phase16. To illuminate the specific function of Rad53 at replisomes we employed the reconstituted origin-dependent budding yeast DNA replication system4,27. We describe three different approaches that reconstitute helicase-polymerase uncoupling events to model replication stress conditions that inactivate polymerase function: 1) Mutational inactivation of the leading-strand polymerase, Pol ε; 2) dNTP depletion; and 3) chemical inhibition of polymerase activity. In all cases we observe uninterrupted CMG helicase progression after stalling of DNA synthesis, demonstrating that DNA unwinding and synthesis are not tightly coupled at eukaryotic forks. Importantly, we find that the Rad53 kinase constrains replisome progression by limiting CMG-catalyzed DNA unwinding, suggesting a mechanism by which the replication checkpoint mediates fork stabilization.
RESULTS
Regulated replication of nucleosome-free plasmid templates in vitro
In eukaryotes, three DNA polymerases, Pol α, Pol δ, and Pol ε, are required for normal chromosome replication28,29. Pol α and Pol δ act preferentially on the lagging strand, while Pol ε synthesizes the bulk of the leading strand. Pol2, the catalytic subunit of Pol ε, is unique in that it contains two exonuclease-polymerase domains, but only the N-terminal domain is catalytically active30. Intriguingly, while point mutations in the polymerase active site of Pol2 are lethal, deletion of the N-terminal catalytic domain is not lethal31,32. Yet, in previous studies, fork rates in vitro appeared similar in the presence of Pol ε harboring a point mutation in the polymerase domain or lacking the N-terminal polymerase domain altogether4,27. Therefore, to identify differences between these Pol ε variants we decided to characterize them side-by-side.
We previously demonstrated that nucleosomes limit Okazaki fragment length in vitro by restricting strand-displacement synthesis by Pol δ27. As Pol ε also plays a role in histone segregation33, we wanted to establish conditions that separate Pol ε’s functions in DNA replication and chromatin assembly. Using higher salt and lower Pol δ concentrations we observed Okazaki fragments with a physiological length distribution also on naked DNA (Extended Data Fig. 1). The modified conditions support efficient maturation of nascent strands by Cdc9 and Fen1 (Fig 1a). The average replication termination efficiency is ~30 % in the presence of Top1 and ~45 % in the presence of Top2, resulting in the generation of catenated plasmid dimers or decatenated plasmid monomers, respectively (Fig. 1b, Extended Data Fig. 2 + 3a). The majority of the remainder products are late replication intermediates (LRIs). In the absence of topoisomerase, fork stalling at positive supercoils leads to the accumulation of early replication intermediates (ERIs) (Fig. 1b, Extended Data Fig. 3b+c). In the presence of both Top1 and Top2, replication products resembled those obtained with Top 2 alone (Extended Data Fig. 3d). We conclude that plasmid replication proceeds through canonical intermediate stages under these conditions.
Figure 1: Active site mutations in the Pol ε polymerase domain inhibit DNA synthesis and induce excessive DNA unwinding at replication forks.
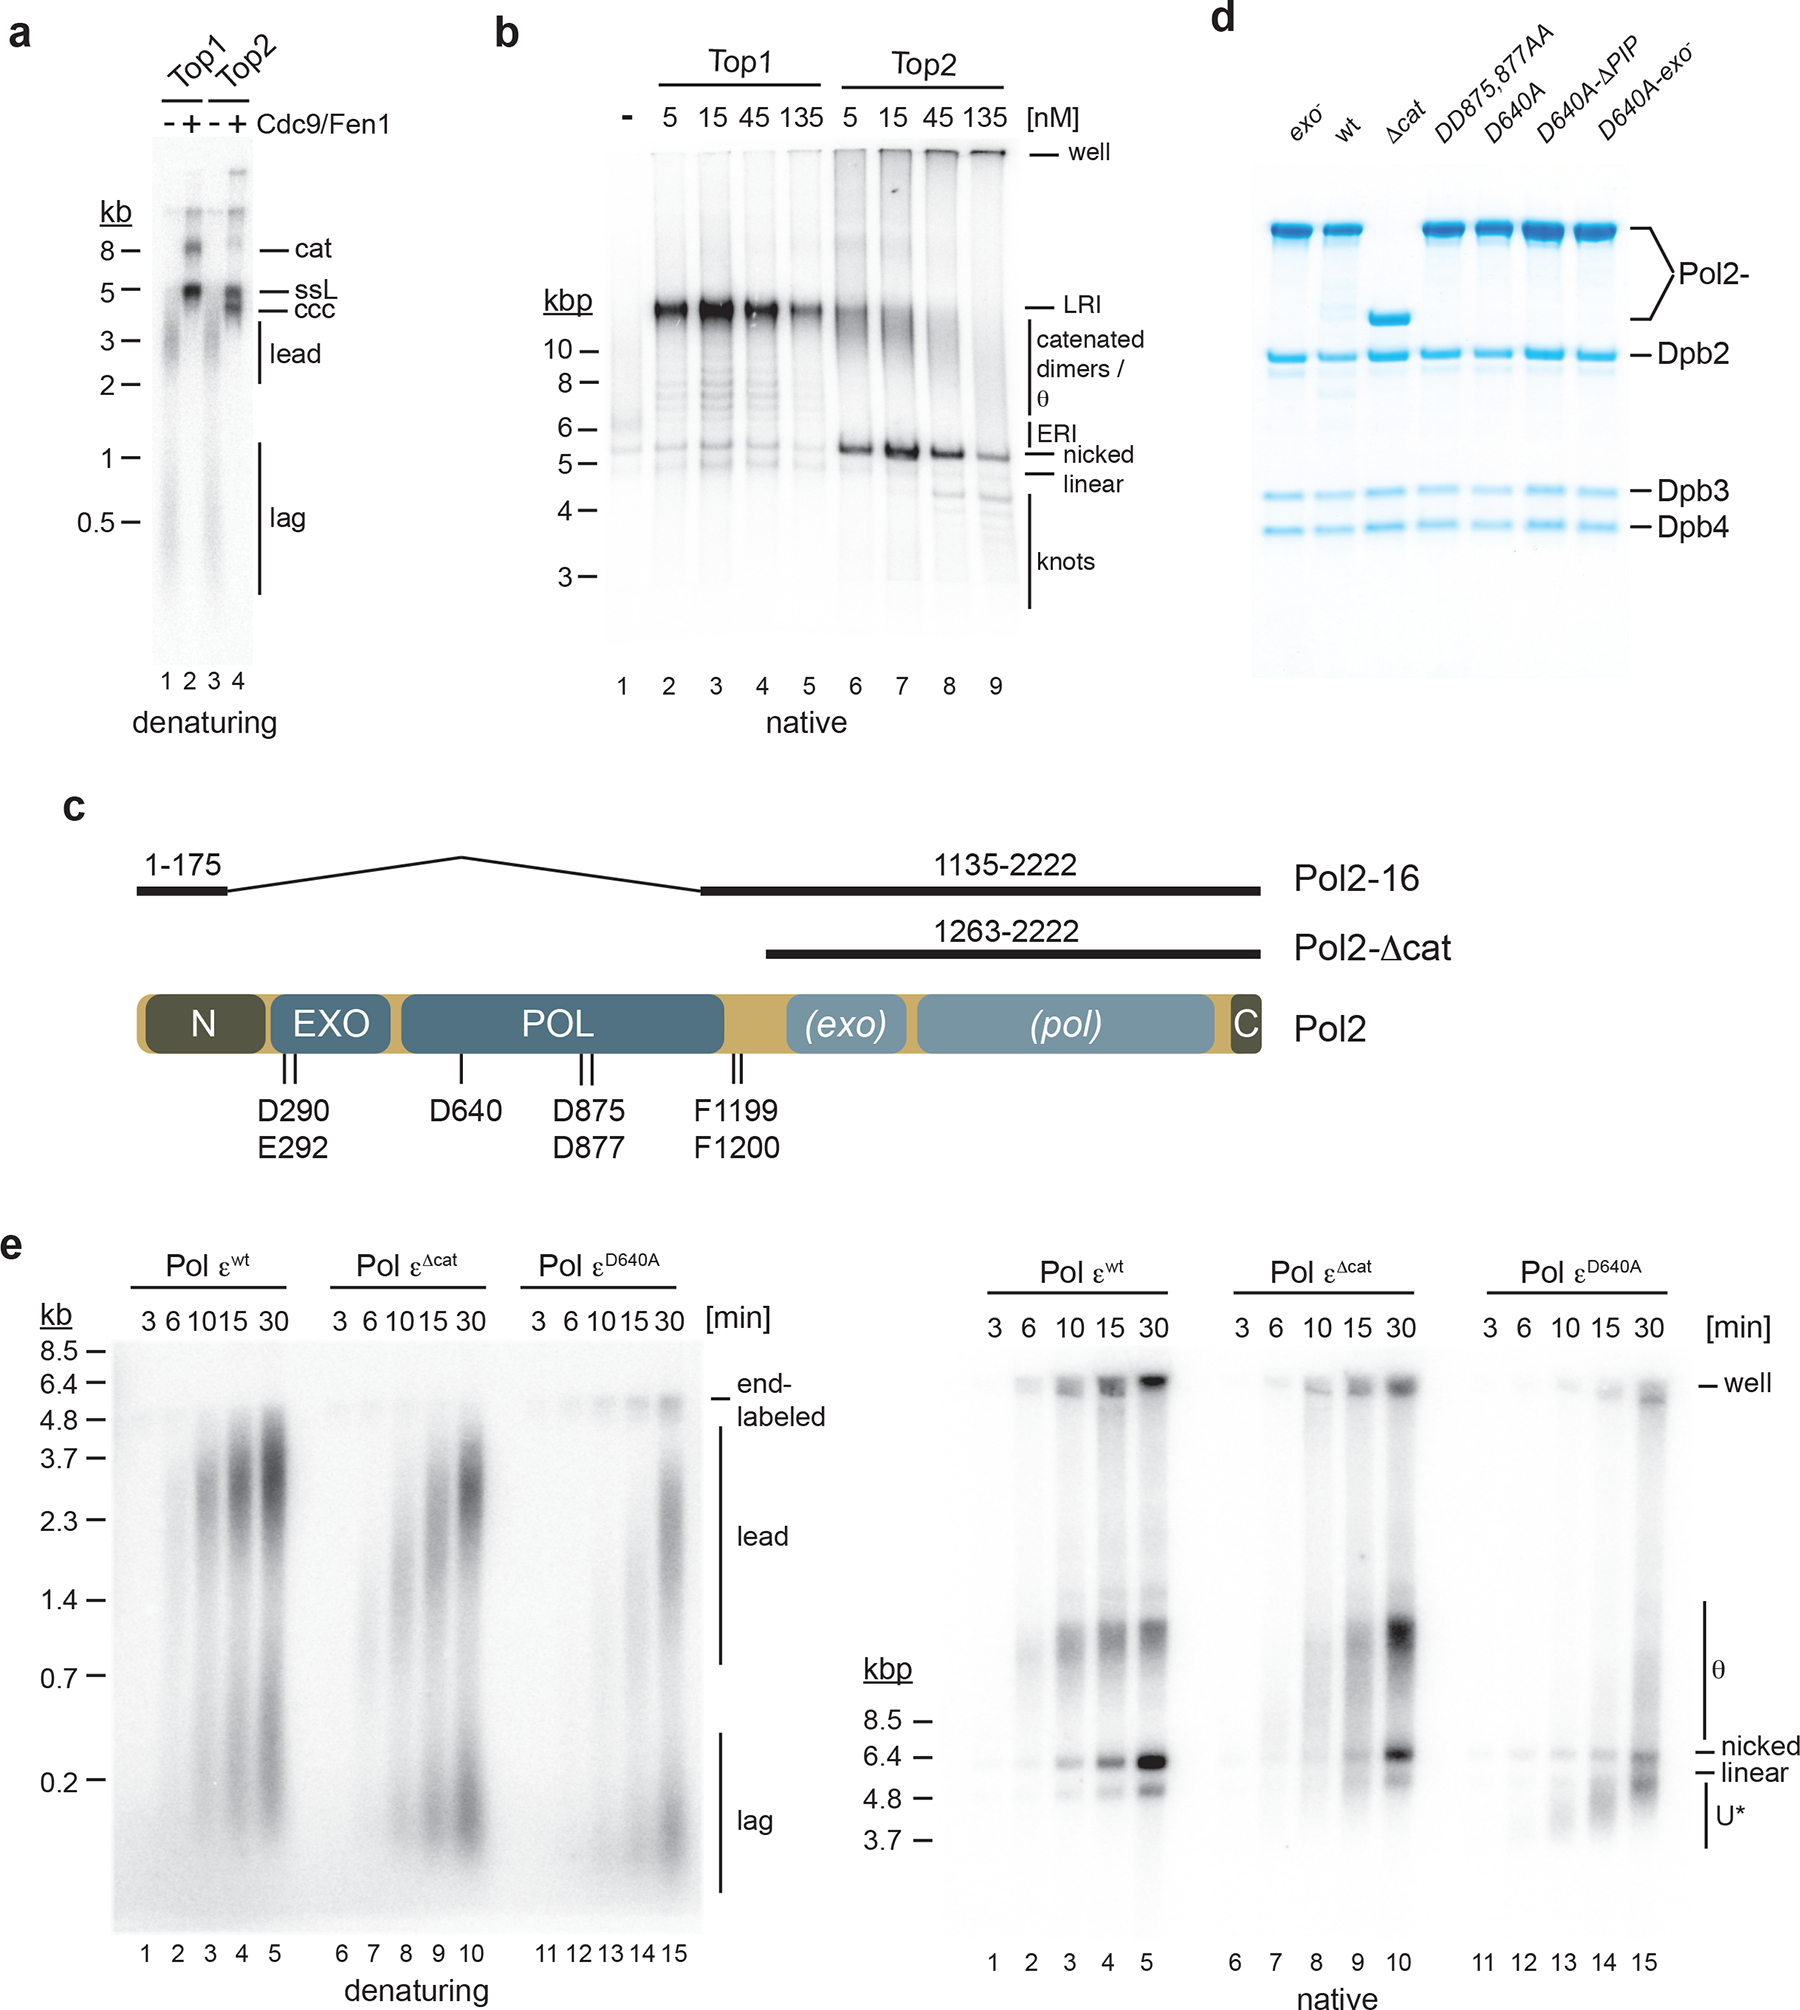
a, Nascent strand maturation by Cdc9 and Fen1 in standard DNA replication reactions. Template: pARS1. Replication products were analyzed by 0.8 % alkaline agarose gel-electrophoresis and autoradiography. lead: leading strands; lag: lagging strands; ccc: covalently closed circle; ssL: single-stranded linear; cat: catenated dimer. b, Native agarose gel-analysis of standard replication products. Template: pARS1. LRI: late replication intermediate; ERI: early replication intermediate. Note that reactions were performed in the absence of Cdc9 and Fen1, resulting in the formation of nicked plasmid daughters. c, Domain structure of Pol2. Amino acids mutated in this study are indicated at the bottom. Pol2 regions retained in Pol2–16 and Pol2-Δcat are indicated on top. N: N-terminal domain; EXO: exonuclease domain; POL: polymerase domain; (exo): inactive exonuclease domain; (pol): inactive polymerase domain; C: C-terminal domain. d, Purified Pol ε variants. e, Time course analysis of standard DNA replication reactions performed with indicated Pol ε variants (15 nM); template: pARS1. Replication products were analyzed by 0.8 % alkaline (left) or native (right) agarose gel-electrophoresis and autoradiography. U*: partially replicated and unwound DNA. Uncropped gel images for panels a-e are available as source data.
Pol ε active site mutations cause excessive DNA unwinding at replication forks
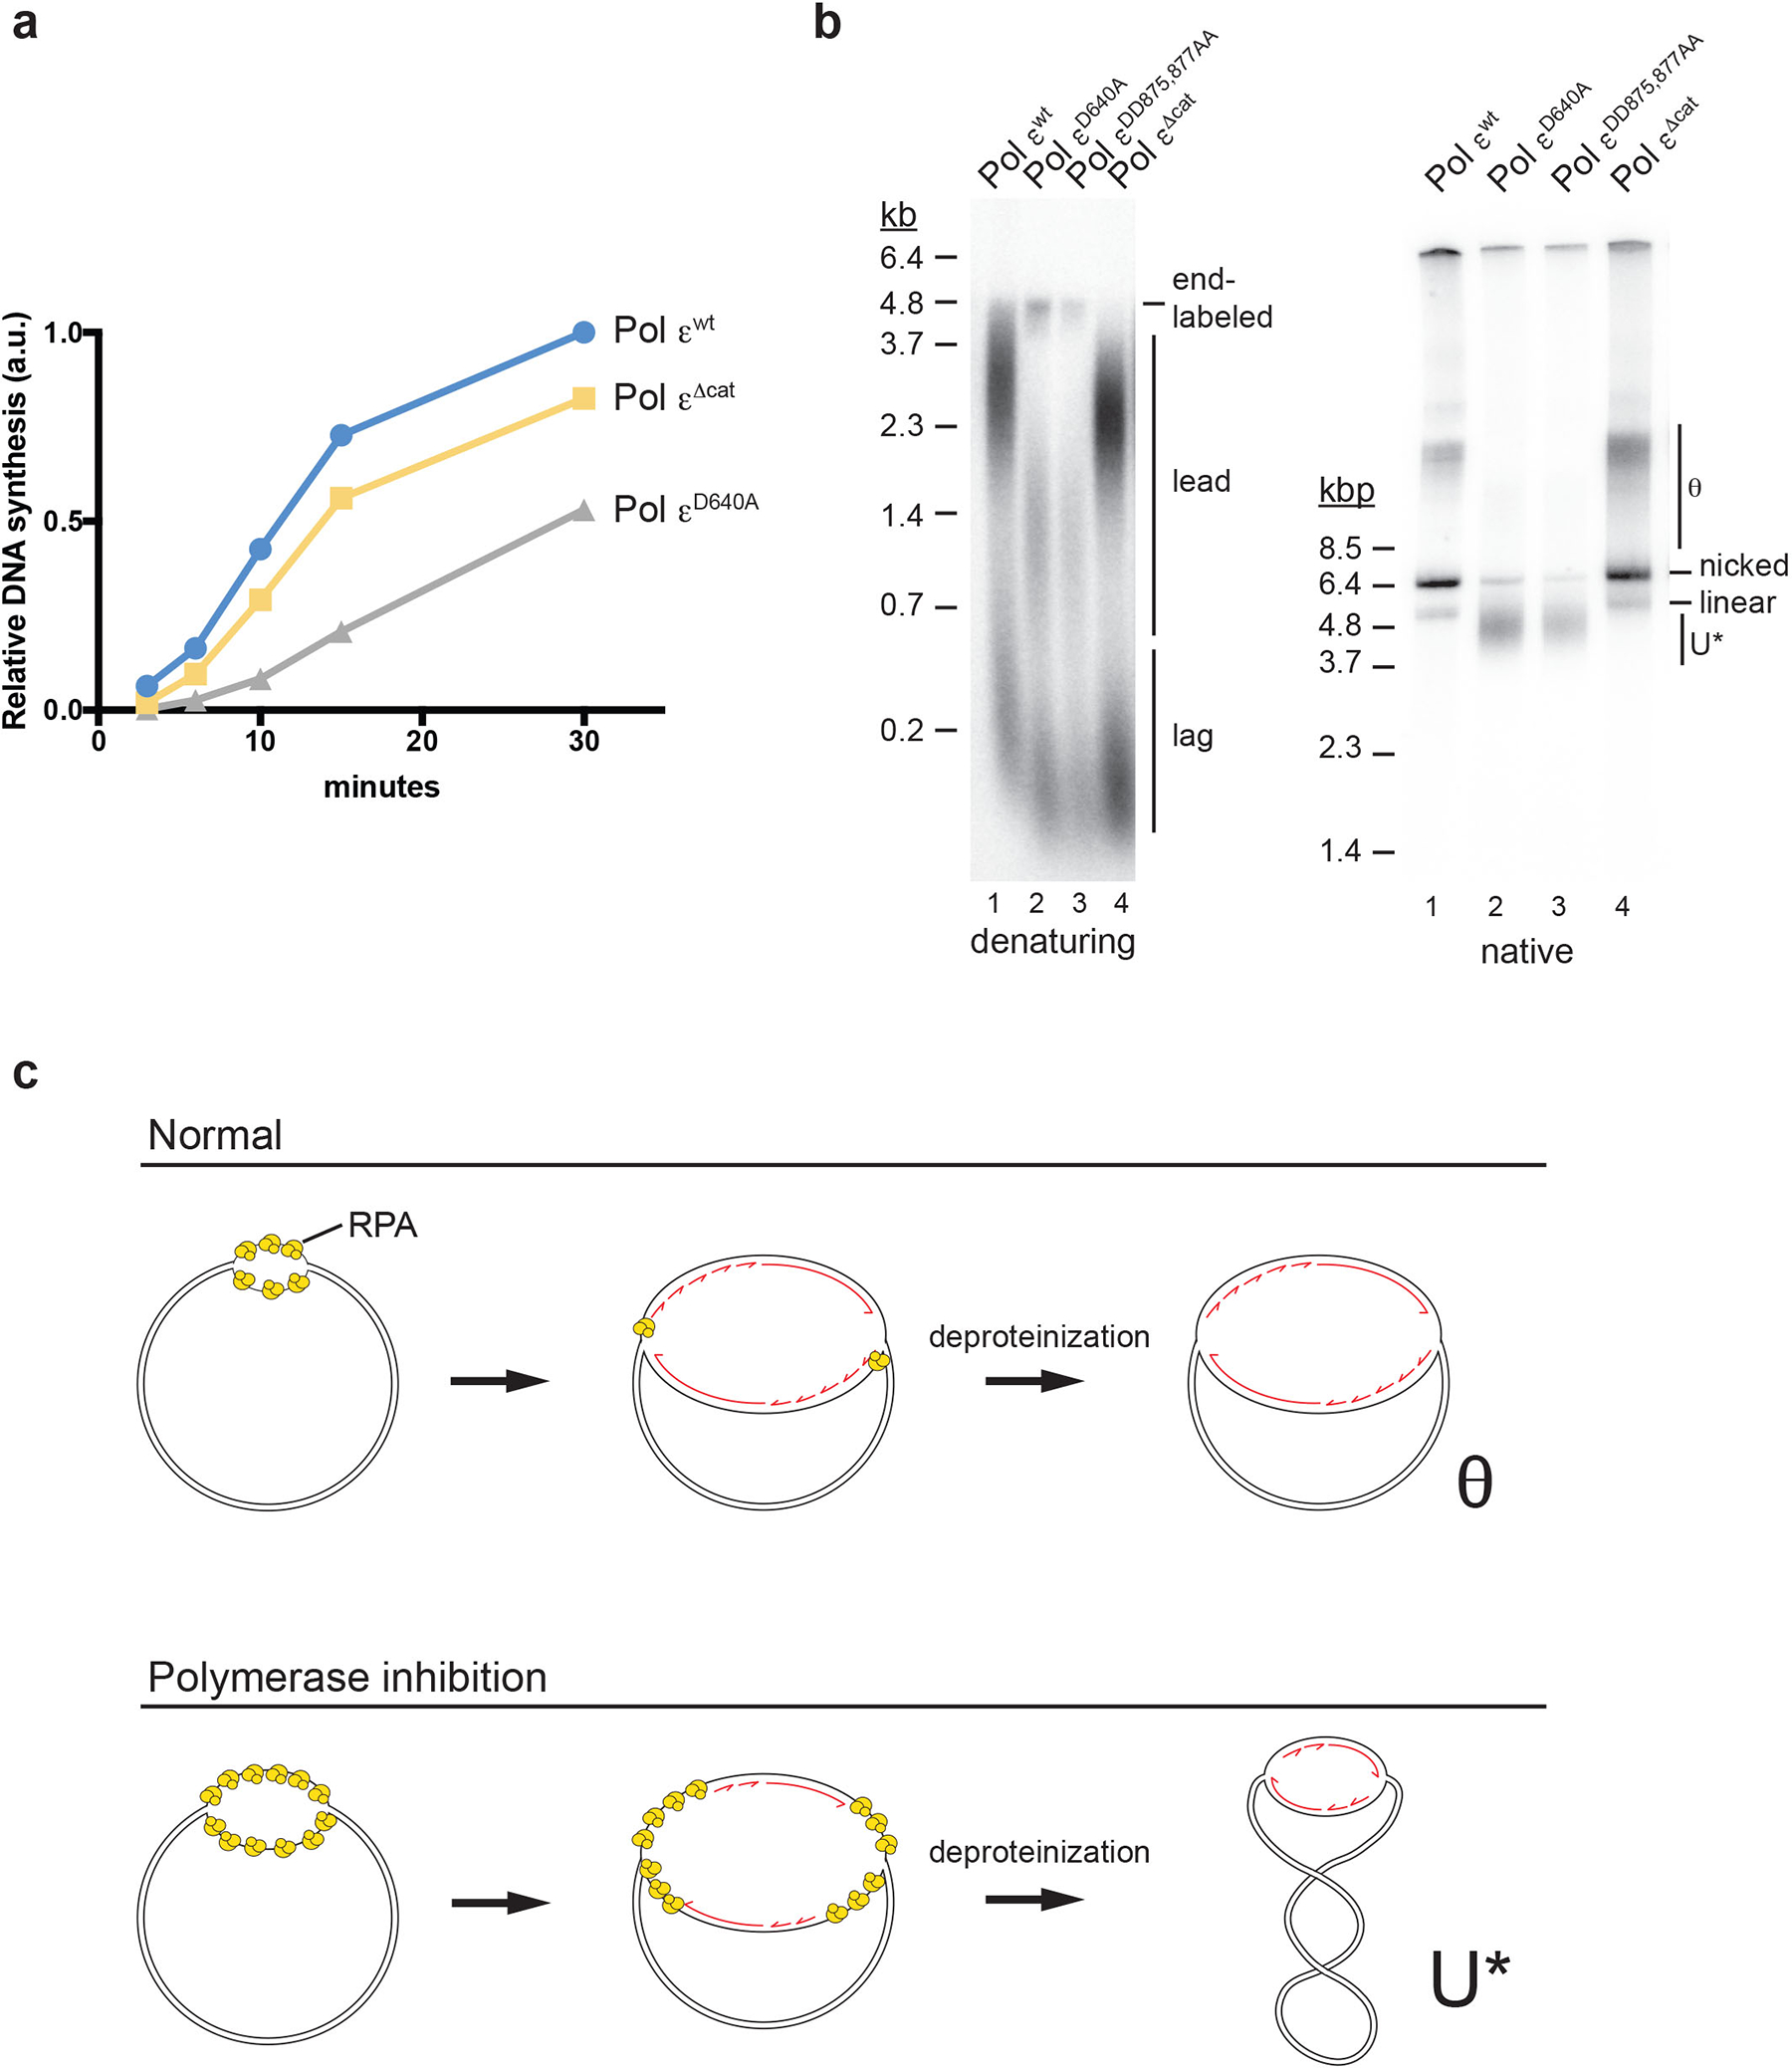
Our attempts to purify Pol ε containing pol2–1632, which lacks the Pol2 catalytic domain, were unsuccessful. We, therefore, purified Pol εΔcat 4 to study the deletion of the Pol2 catalytic domain (Fig. 1c,d). We also purified Pol ε complexes harboring Pol2 mutations D640A27 or DD875,877AA31 to test the effect of point mutations in the polymerase domain. Consistent with previous reports4,27, DNA synthesis in the presence of Pol εΔcat and Pol εD640A was reduced relative to Pol εwt (Fig. 1e, Extended Data Fig. 4a). As RFC inhibits primer extension by Pol α, the bulk of DNA synthesis in the presence of Pol εΔcat and Pol εD640A is carried out by Pol δ27. Reduced fork progression in the absence of Pol ε activity is consistent with Pol δ acting distributively and physically uncoupled from CMG5,34. However, overall DNA synthesis was even lower in the presence of Pol εD640A or Pol εDD875,877AA relative to Pol εΔcat (Fig. 1e, Extended Data Fig. 4a+b), indicating that an inactive N-terminal Pol2 polymerase domain inhibits DNA synthesis by Pol δ at replication forks.
Analysis of the native structure of the respective replication products revealed striking differences. As expected, plasmid monomers and LRIs were predominant in the presence of Pol εwt (Fig. 1e). The fraction of θ intermediates was increased in the presence of Pol εΔcat, consistent with lower fork rates. Unexpectedly, products obtained with Pol εD640A or Pol εDD875,877AA exhibited a greatly increased gel mobility (Fig. 1e, Extended Data Fig. 4b). Fast migrating plasmid forms are a product of DNA unwinding (Extended Data Fig. 4c). We refer to these partially replicated and unwound DNA forms as U* to differentiate them from U form DNA described previously in other systems in the absence of DNA synthesis35–37. In conclusion, Pol ε complexes harboring point mutations in the polymerase active site inhibit Pol δ, causing excessive DNA unwinding at replication forks.
CMG uncoupling from DNA synthesis is caused by free mutant Pol ε
Pol ε physically associates with CMG during leading strand synthesis5,34,38–41. However, our observation that leading strand synthesis by Pol δ trails the advancing CMG in the presence of mutant Pol ε suggested that Pol δ was inhibited at a distance from the fork by free Pol ε. Consistent with this notion, leading strand lengths correlate inversely with the concentration of Pol εD640A (Fig. 2a). This effect is explained by changes in the rate of leading strand synthesis, which is 0.28 kb/min in the presence of 7.5 nM Pol εD640A, but only 0.04 kb/min at 60 nM Pol εD640A (Fig. 2b). Formation of U* is also dependent on the concentration of Pol εD640A: While normal θ replication intermediates predominate at 7.5 nM and 15 nM Pol εD640A, U* predominates at 30–60 nM Pol εD640A (Fig. 2a). In contrast, leading strand synthesis rates are constant and U* DNA is undetectable across a range of Pol εwt and Pol εΔcat concentrations (Fig. 2c, Extended Data Fig. 5). Interestingly, the rate of leading strand synthesis in the presence of Pol εΔcat (0.33 kb/min, Fig. 2d) is similar to that at low concentrations of Pol εD640A (0.28 kb/min, Fig. 2b). Combined with the absence of U* in the presence of Pol εΔcat or low concentrations of Pol εD640A, this data indicates that Pol δ extends leading strands in close proximity to the fork in those conditions.
Figure 2: Pol ε polymerase point mutants impede leading strand synthesis in a concentration-dependent manner.
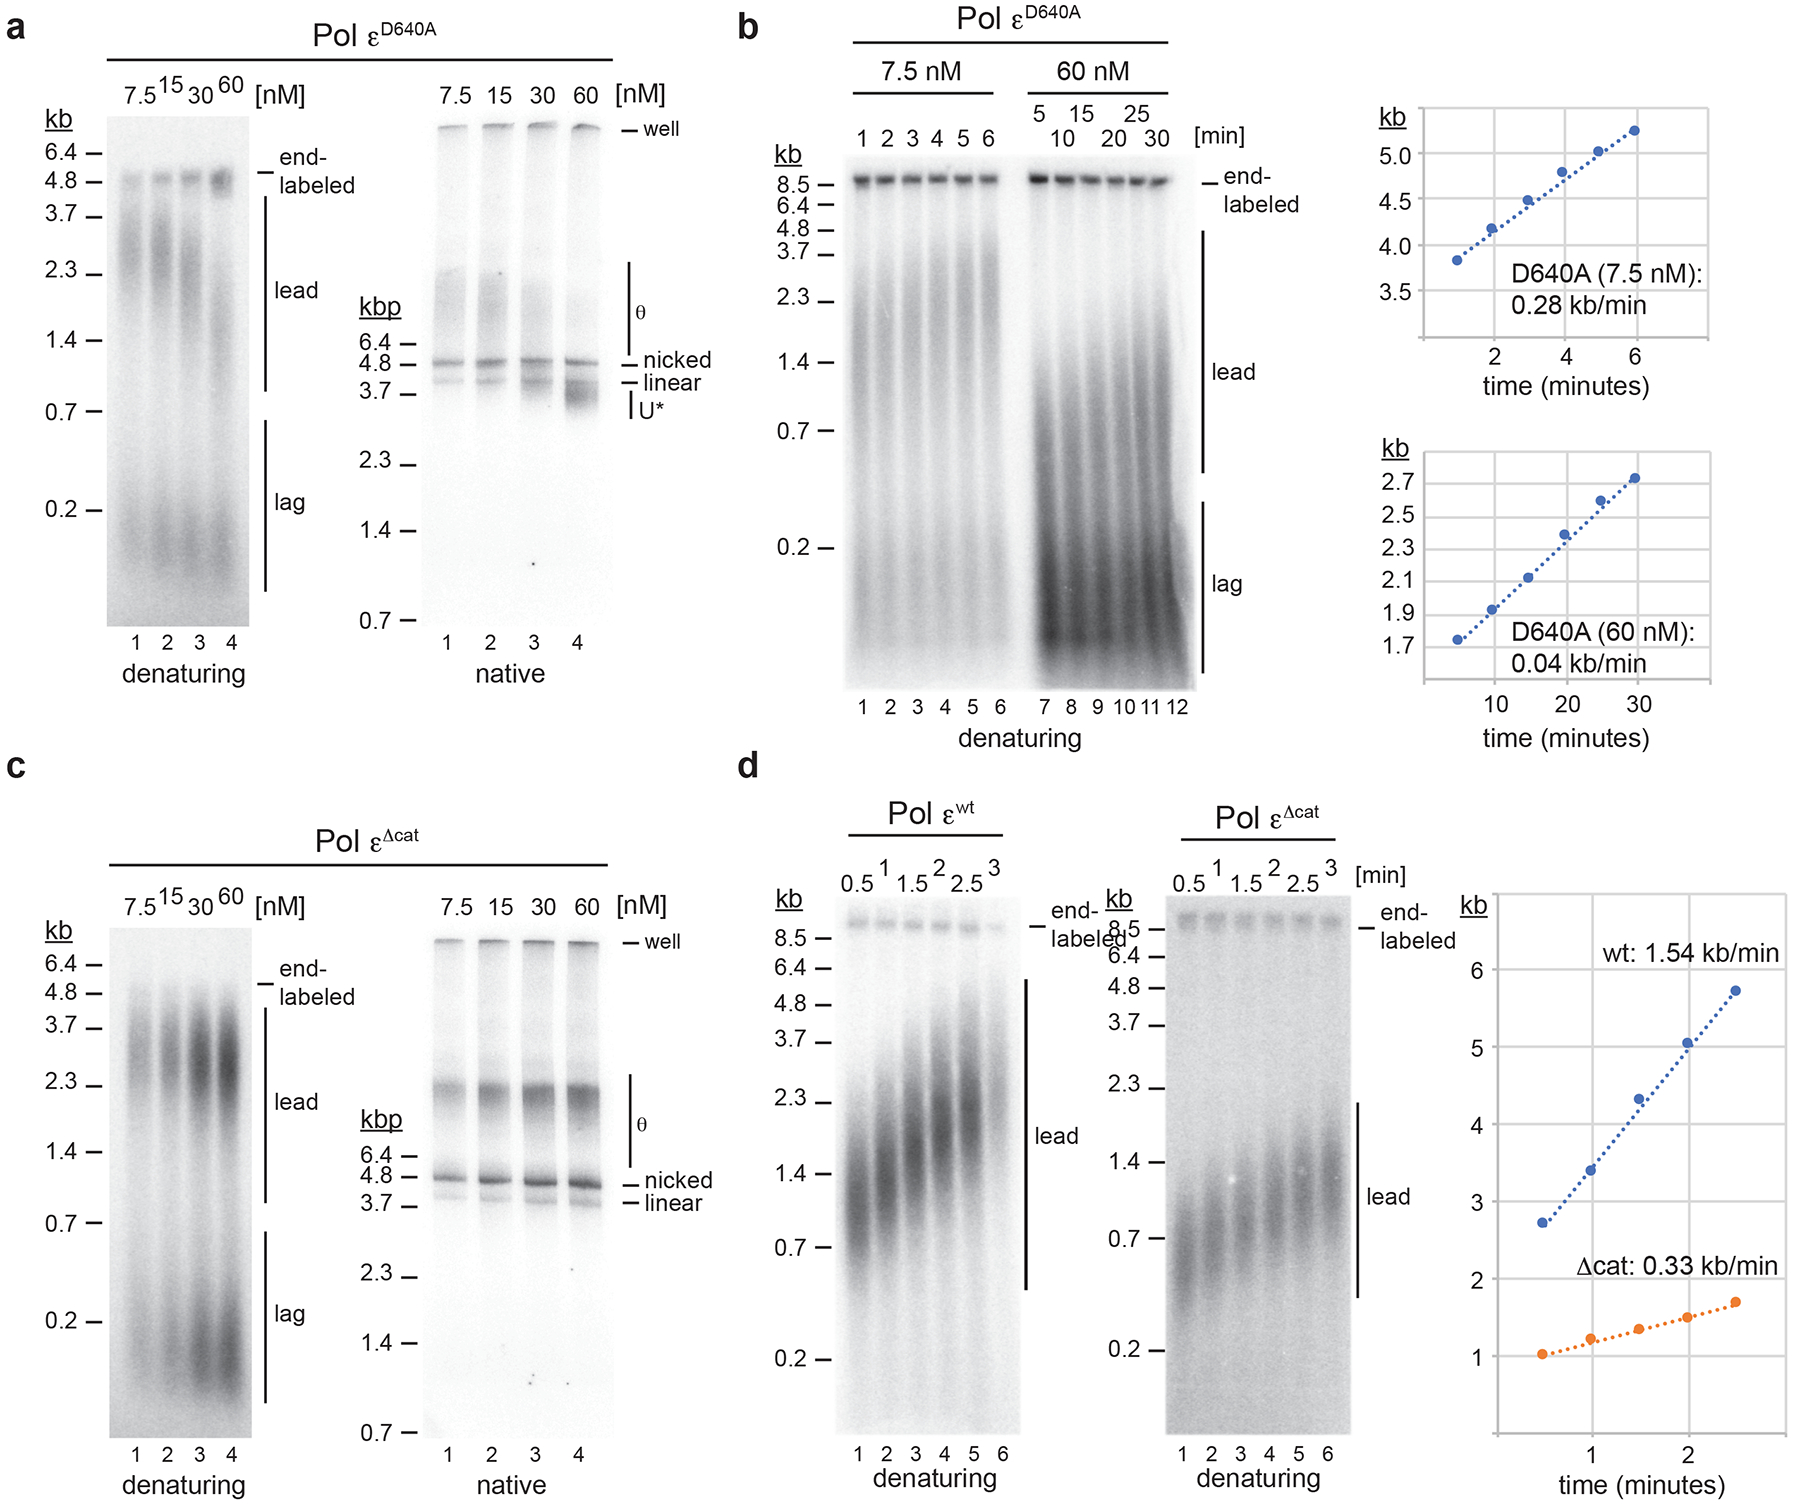
a, Titration experiment to determine the effect of Pol εD640A concentration on fork progression; reactions were stopped 45 minutes after origin activation. Template: pARS1. b, Pulse-chase experiments to determine leading strand synthesis rates in the presence of 7.5 nM or 60 nM Pol εD640A; time indicates minutes after chase with cold dATP; maximum leading strand positions are plotted on the right. Template: pARS305. c, Titration experiment to determine effect of Pol εΔcat concentration on fork progression. Template: pARS1. d, Pulse-chase experiment to determine rates of leading strand synthesis in the presence of 30 nM Pol εwt (left) or Pol εΔcat (middle); time indicates minutes after chase. Template: pARS305. Maximum leading strand positions are plotted on the right. Uncropped gel images for panels a-d and data for graphs in b and d are available as source data.
Mutant Pol ε competes with Pol δ for PCNA-bound primer-template junctions
The ability of mutant Pol ε to inhibit Pol δ was unexpected as previous studies demonstrated that Pol δ competes Pol ε at PCNA-bound primer-template junctions5,34,42. To clarify this discrepancy, we tested the ability of Pol ε variants to compete Pol δ in a primer extension assay. Pol δ (4 nM) was pre-incubated with primed RPA-coated M13 ssDNA (1 nM), RFC and PCNA, and three nucleotides to initiate primer extension (Fig. 3a). Various concentrations of Pol ε were subsequently added alongside the remaining fourth nucleotide and DNA synthesis monitored by denaturing gel-analysis. Reactions were incubated for 3 minutes, which allows Pol δ, but not Pol ε, to complete daughter strand synthesis (Extended Data Fig. 6). While Pol δ is largely resistant to competition by Pol εwt or Pol εΔcat, DNA synthesis by Pol δ was significantly inhibited by Pol εD640A (Fig. 3b). Thus, an inactive Pol2 polymerase domain enhances the capacity of Pol ε to compete Pol δ.
Figure 3: PCNA binding and exonuclease activity of Pol2 are required for inhibition of Pol δ by Pol ε mutants.

a, Primer extension reaction scheme to measure Pol δ competition by Pol ε. b, Left: Denaturing agarose gel analysis of primer extension products obtained with Pol δ in presence of increasing concentrations of indicated Pol ε variants. FL: full-length (7.25 kb). Right: Average DNA synthesis, normalized to DNA synthesis by Pol δ in absence of Pol ε; error bars indicate s.d. of two independent experiments. c, Titration experiments to determine the effect of Pol εD640A-exo- or Pol εD640A-ΔPIP concentration on fork progression. Reactions were stopped 45 minutes after origin activation. Template: pARS1. Uncropped gel images of panels b and c and data for graph in b are available as source data.
Next, we tested if Pol ε-PCNA interaction is important to compete Pol δ43. To disrupt the Pol ε-PCNA interaction we mutated Pol2 PIP-box residues F1199 and F1200 to alanines44 to generate a Pol εD640A-ΔPIP double-mutant complex. Mutation of the Pol2 PIP box attenuated the ability of Pol εD640A to compete Pol δ (Fig. 3b+c). As the balance between DNA polymerase and exonuclease activity of Pol2 is shifted towards the exonuclease under conditions that disfavor DNA synthesis45, we hypothesized that the exonuclease contributes to Pol ε’s affinity for PCNA-bound primer-template junctions in Pol2 polymerase mutants. We, therefore, purified Pol ε with active site mutations in both the polymerase (D640A) and exonuclease (DD290,292AA)45 domain. The Pol εD640A-exo- double mutant complex is also deficient for competing Pol δ (Fig. 3b+c). Thus, PCNA binding and the Pol2 exonuclease promote the competition of Pol δ by inactive Pol ε.
Suppression of Pol δ inhibition by Pol ε restores viability of pol2 mutant cells
Next, we asked if mutations in the Pol2 PIP box suppress the lethality of point mutations in the Pol2 polymerase active site, using a plasmid shuffle approach. Since the inhibitory effect of mutant Pol ε on Pol δ is concentration-dependent (Fig. 2a, 3b), we expressed the episomal POL2 alleles from the GAL1,10 promoter to tune POL2 expression levels by modulating galactose concentrations in the medium (Fig. 4a). While wild-type POL2 efficiently complements the loss of endogenous POL2, pol2–16 is defective for supporting cell growth (Fig. 4b). Since the growth of pol2–16 cells depends on unidentified suppressors46, it is likely that our plasmid-shuffle conditions do not support accumulation of suppressors. Unlike pol2–16, pol2Δcat supports robust cell growth, demonstrating that the reduced viability of pol2–16 cells is not solely a consequence of the loss of the Pol2 catalytic domain. As expected, pol2-D640A and pol2-DD875,877AA do not support cell growth at high galactose concentrations, but weak cell growth is observed at 0.05 % galactose. The unexpectedly weak suppression of the lethality of pol2-D640A and pol2-DD875,877AA at low galactose concentrations is likely a consequence of the predominantly switch-like behavior of the GAL1,10 promoter47. In contrast, mutation of the PIP box efficiently rescued the growth of pol2-D640A and pol2-DD875,877AA cells. These results demonstrate that reduced intracellular Pol2 levels or disruption of the PCNA-interaction of Pol ε suppress the lethality of Pol2 polymerase point mutations, consistent with Pol δ inhibition causing the lethality of Pol2 catalytic mutations.
Figure 4: Inhibition of Pol ε competition of Pol δ suppresses the lethality of Pol2 polymerase active site mutations.
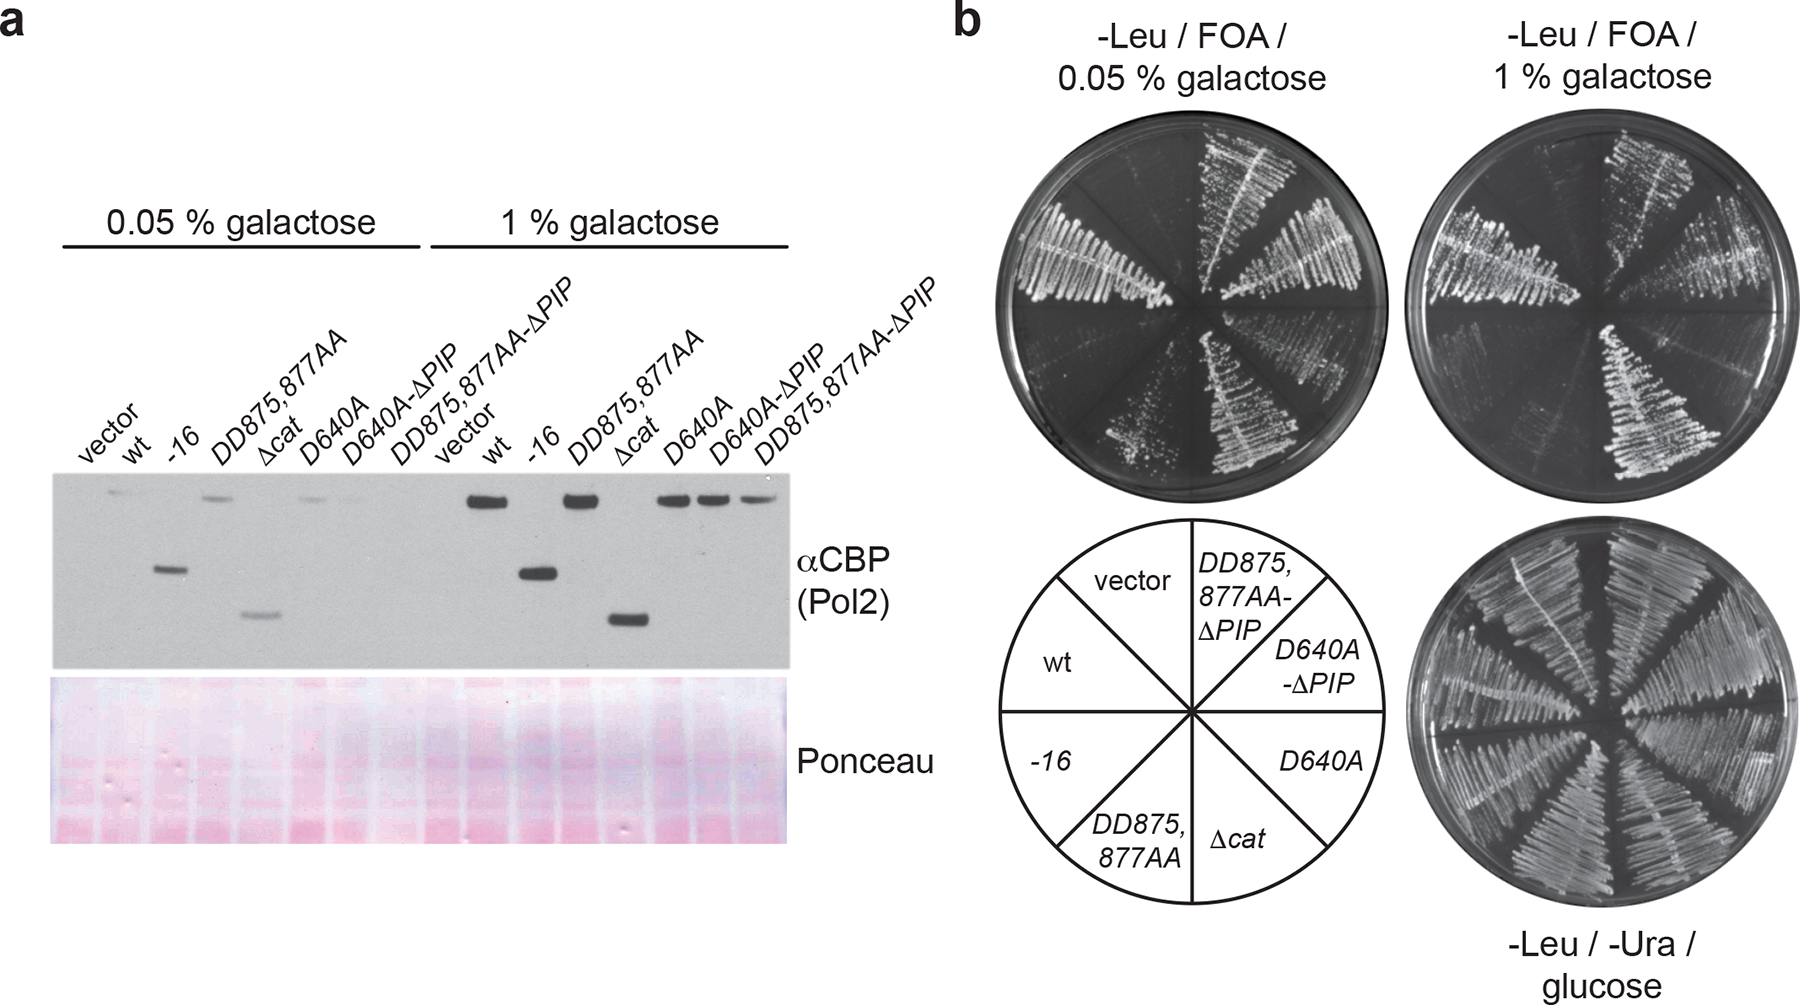
a, Western blot analysis of galactose-induced Pol2 levels in cells expressing Pol2 variants from episomal plasmids. b, POL2 plasmid shuffle assay. Tester cells were transformed with the indicated plasmids and assayed for growth on media containing glucose and lacking 5-FOA, or containing 5-FOA, 2 % raffinose, and the indicated concentrations of galactose. Uncropped blot images for panel a are available as source data.
Excessive DNA unwinding at replication forks upon dNTP depletion
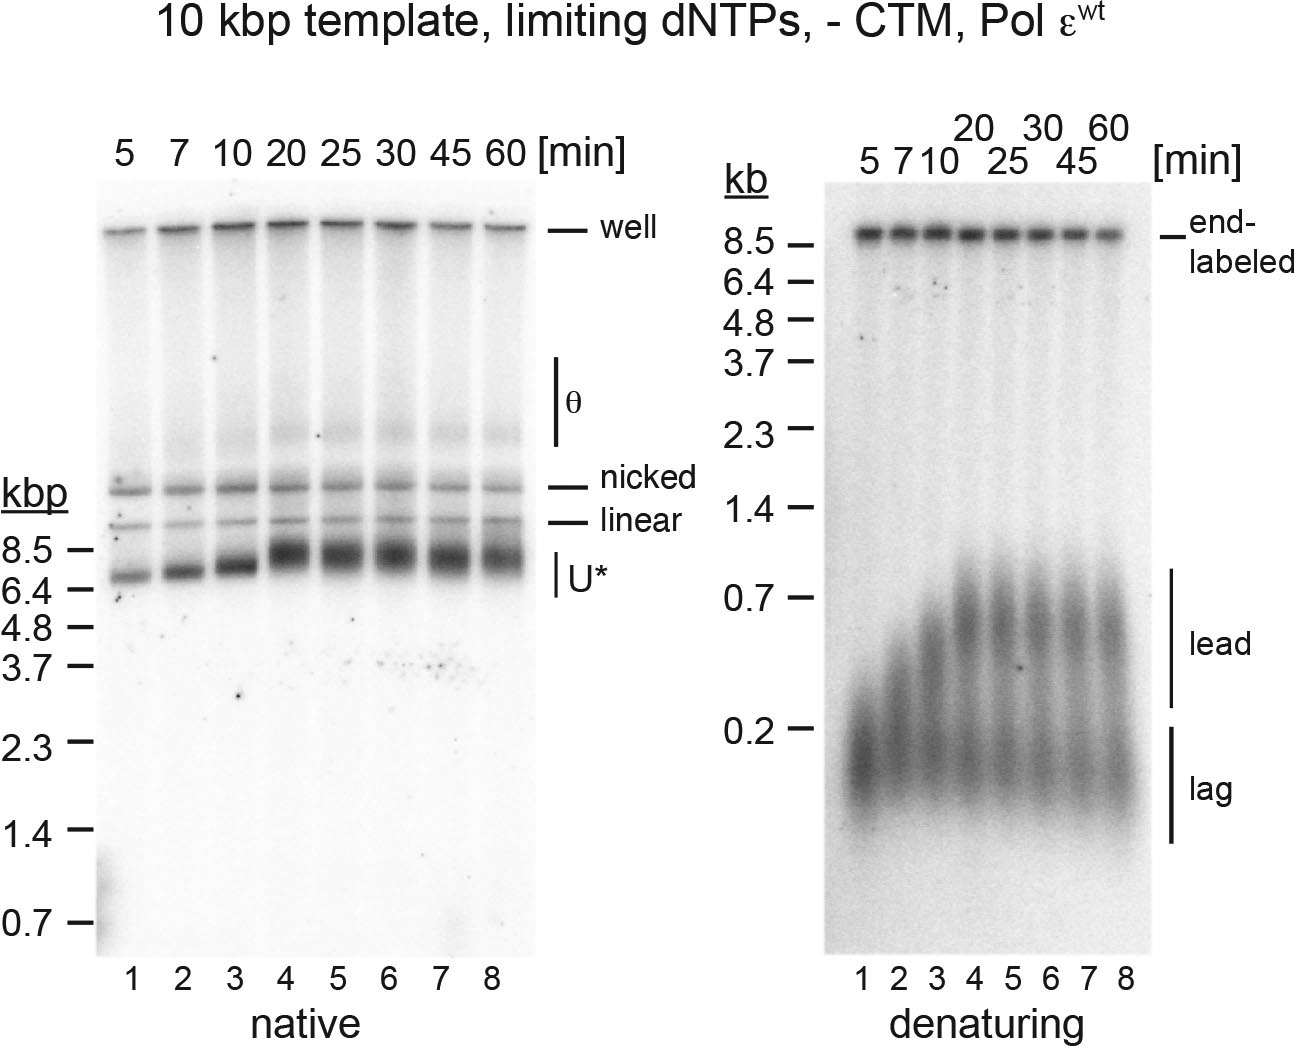
To determine if uninterrupted CMG helicase progression is a general feature of the replisome after polymerase inhibition we performed experiments at limiting dNTP concentrations. Incomplete leading strand extension and U* replication products are observed at dNTP concentrations of 0.25 μM and 0.5 μM, while near full-length leading strands and regular θ replication intermediates appear at 1 μM dNTPs (Fig. 5a), suggesting that dNTP depletion causes excessive DNA unwinding at replication forks. Since limiting dNTP concentrations promote the exonuclease activity of Pol ε45, we sought to exclude nascent strand resection as the source for U* formation. To this end we performed pulse-chase experiments in which DNA synthesis was initiated in the presence of 0.25 μM dNTPs and trace amounts of α−32P-dATP, followed by a chase with 500 μM cold dATP 5 minutes after origin activation, which maintains the remaining three dNTPs at limiting concentrations during the chase. In the presence of either Pol εexo- or Pol εwt U* is observed from the beginning of the chase, demonstrating that U* formation at limiting dNTP concentrations is not due to nascent strand resection (Fig. 5b, Extended Data Fig. 7). While U* persisted over the 60 minute time course under limiting dNTP concentrations, it is only transiently detected at early time points under non-limiting dNTP conditions, likely reflecting origin unwinding preceding DNA synthesis (Fig. 5c). The decrease of the gel mobility of U* concomitant with DNA synthesis suggests that DNA synthesis and unwinding under limiting dNTP conditions occur at comparable rates of ~ 55 bp/min (Fig. 5b, lanes 1–5). However, over longer time periods and on larger plasmid templates the gel mobility of U* continued to increase again after DNA synthesis had stalled, indicating that DNA unwinding by CMG continues upon dNTP exhaustion (Fig. 5d). We note that U* was formed under limiting dNTP conditions irrespective of the presence of Csm3-Tof1-Mrc1 (CTM) (Fig. 5b, Extended Data Fig. 7), which suppresses helicase-polymerase uncoupling in HU-treated cells11. In conclusion, limiting dNTP conditions cause uninterrupted and continuous replisome progression uncoupled from DNA synthesis.
Figure 5: Helicase-polymerase uncoupling at limiting dNTP concentrations.
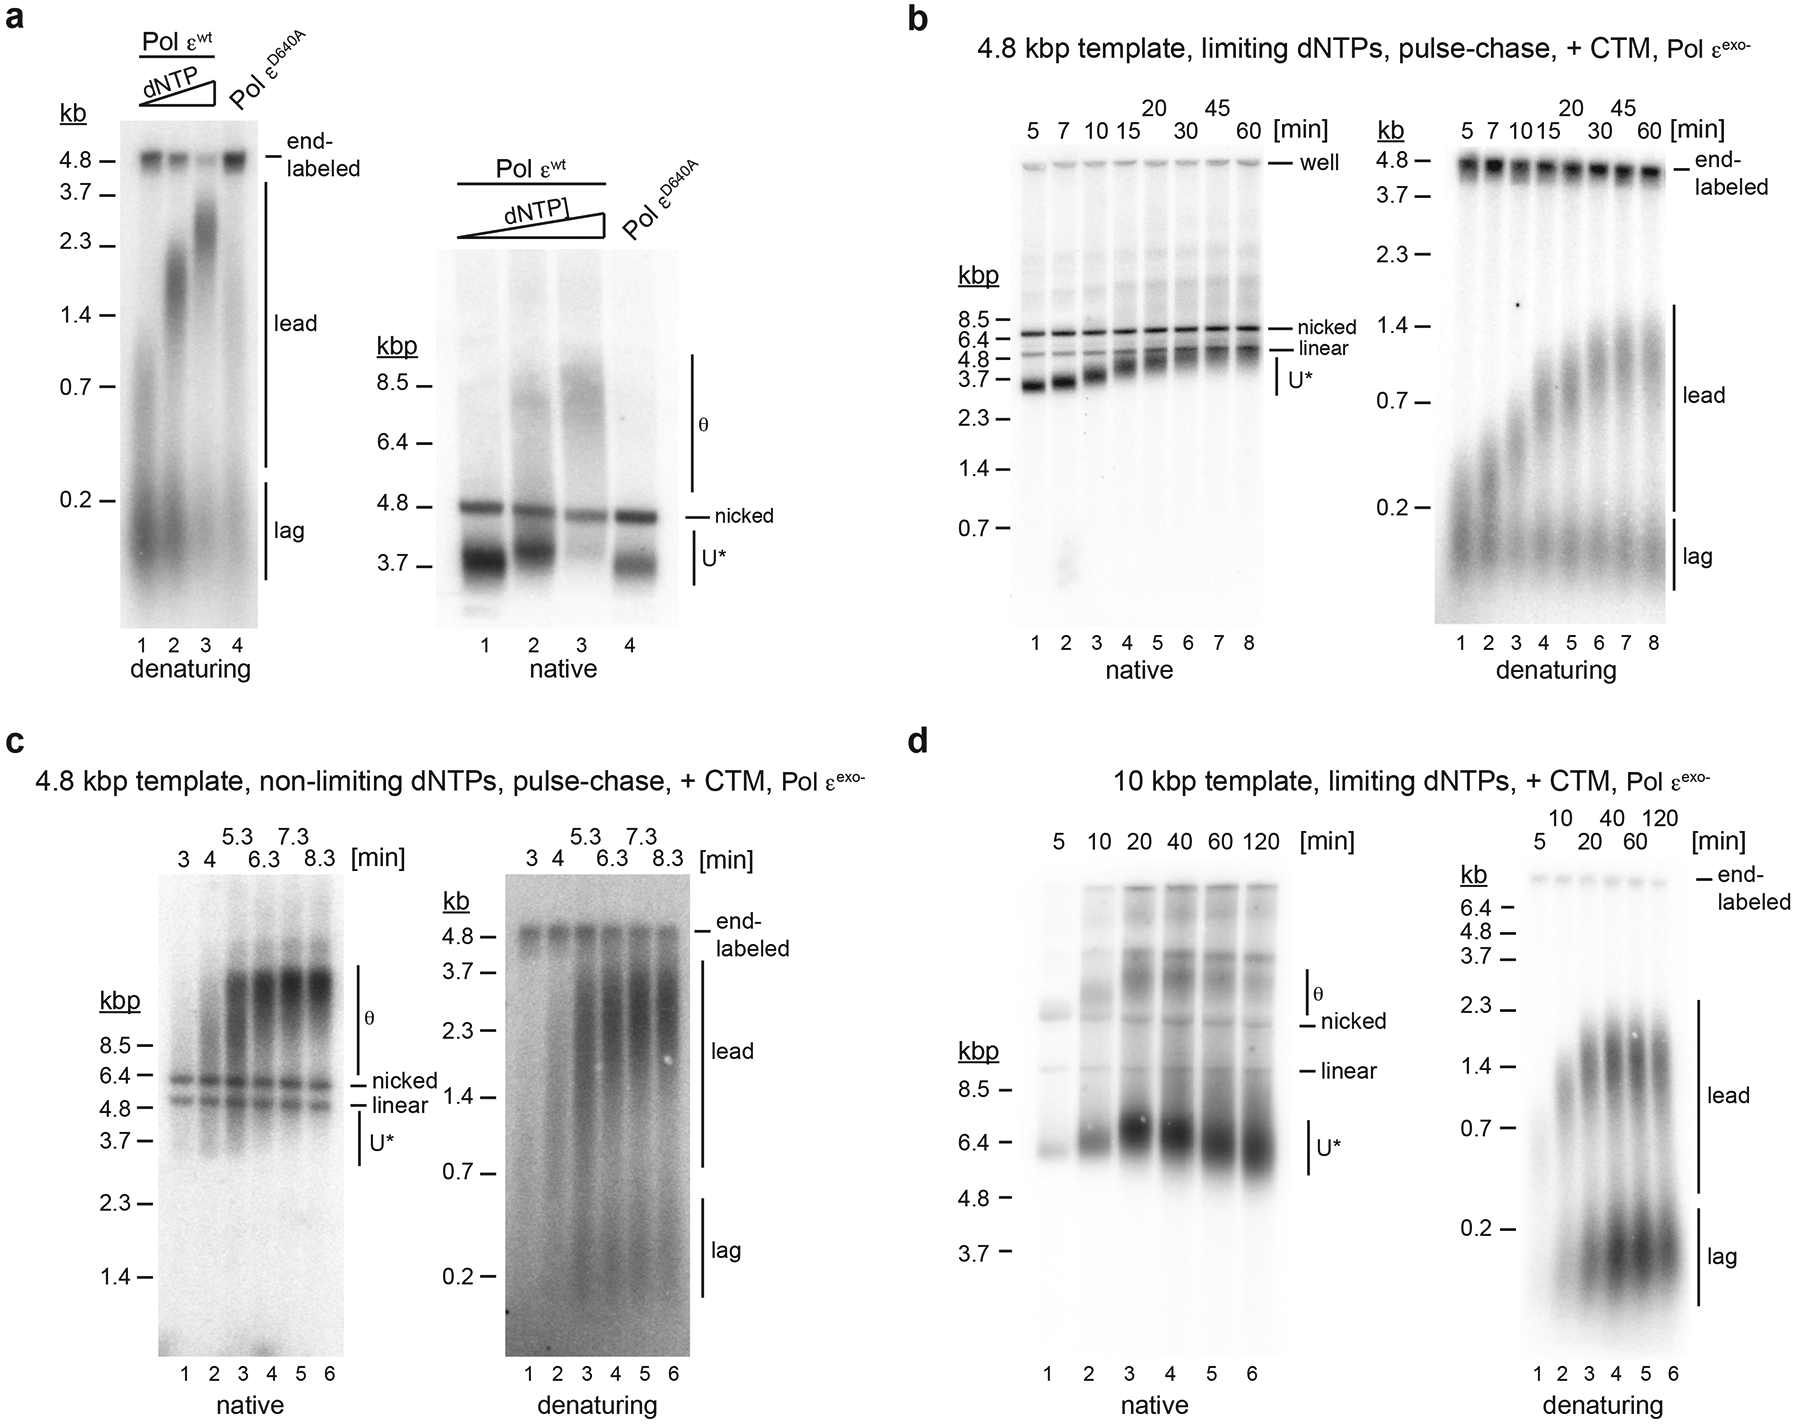
a, Standard replication reactions were performed in the presence of 0.25 μM, 0.5 μM, or 1 μM dNTPs and 30 nM Pol εwt (lanes 1–3), or 40 μM dNTPs and 60 nM Pol εD640A (lane 4). Template: pARS1. b, Pulse-chase experiment of standard replication reaction performed in presence of 0.25 μM each dNTP. Pol εexo- was used in place of Pol εwt. Times indicate minutes after origin activation. Chase (500 μM cold dATP) was added at 5 minutes. Template: pARS1. c, Pulse-chase experiment of standard replication reaction at non-limiting dNTP concentrations (40 μM dCTP / dTTP / dGTP, 4 μM dATP). Times indicate minutes after origin activation. Chase (500 μM cold dATP) was added at 5 minutes. Template: pARS1. d, Time course analysis of standard DNA replication reaction performed at 0.25 μM dNTPs (each); Template: pARS305. Uncropped gel images are available as source data.
Rad53 inhibits excessive DNA unwinding at replication forks after polymerase inhibition
Previous studies suggested that Rad53 inhibits replisome progression in yeast cells treated with HU10,11,13,21. We, therefore, tested the ability of purified recombinant Rad53 to inhibit progression of reconstituted replisomes. Because Rad53 also inhibits origin firing16, we used a two-step approach to temporally separate fork progression from origin firing (Figure 6a). In the first step, replication forks were formed at the origin and stalled by omission of topoisomerase from the reaction. In the second step, the fork block was resolved by addition of Top1 and Top2, while DNA synthesis was controlled with aphidicolin. Fig. 6b shows that addition of Top1 and Top2 without aphidicolin led to efficient fork release, resulting in the progression of normal θ intermediates and formation of fully extended leading strands 10 minutes after fork release; replicated plasmid monomers appeared within 30 minutes after fork restart. In contrast, in the presence of aphidicolin, early θ replication intermediates resulting from fork stalling were rapidly converted to U* and DNA synthesis progressed at a greatly reduced rate. Consistent with U* being a negatively supercoiled product of DNA unwinding, U* formed in the presence of aphidicolin is efficiently relaxed by E. coli Topo I (Extended Data Fig. 8a). Thus, inhibition of DNA polymerase activity by aphidicolin, like mutational inactivation of Pol ε or dNTP depletion, results in excessive DNA unwinding at replication forks.
Figure 6: Rad53 inhibits DNA unwinding at replication forks after inhibition of DNA synthesis by aphidicolin.
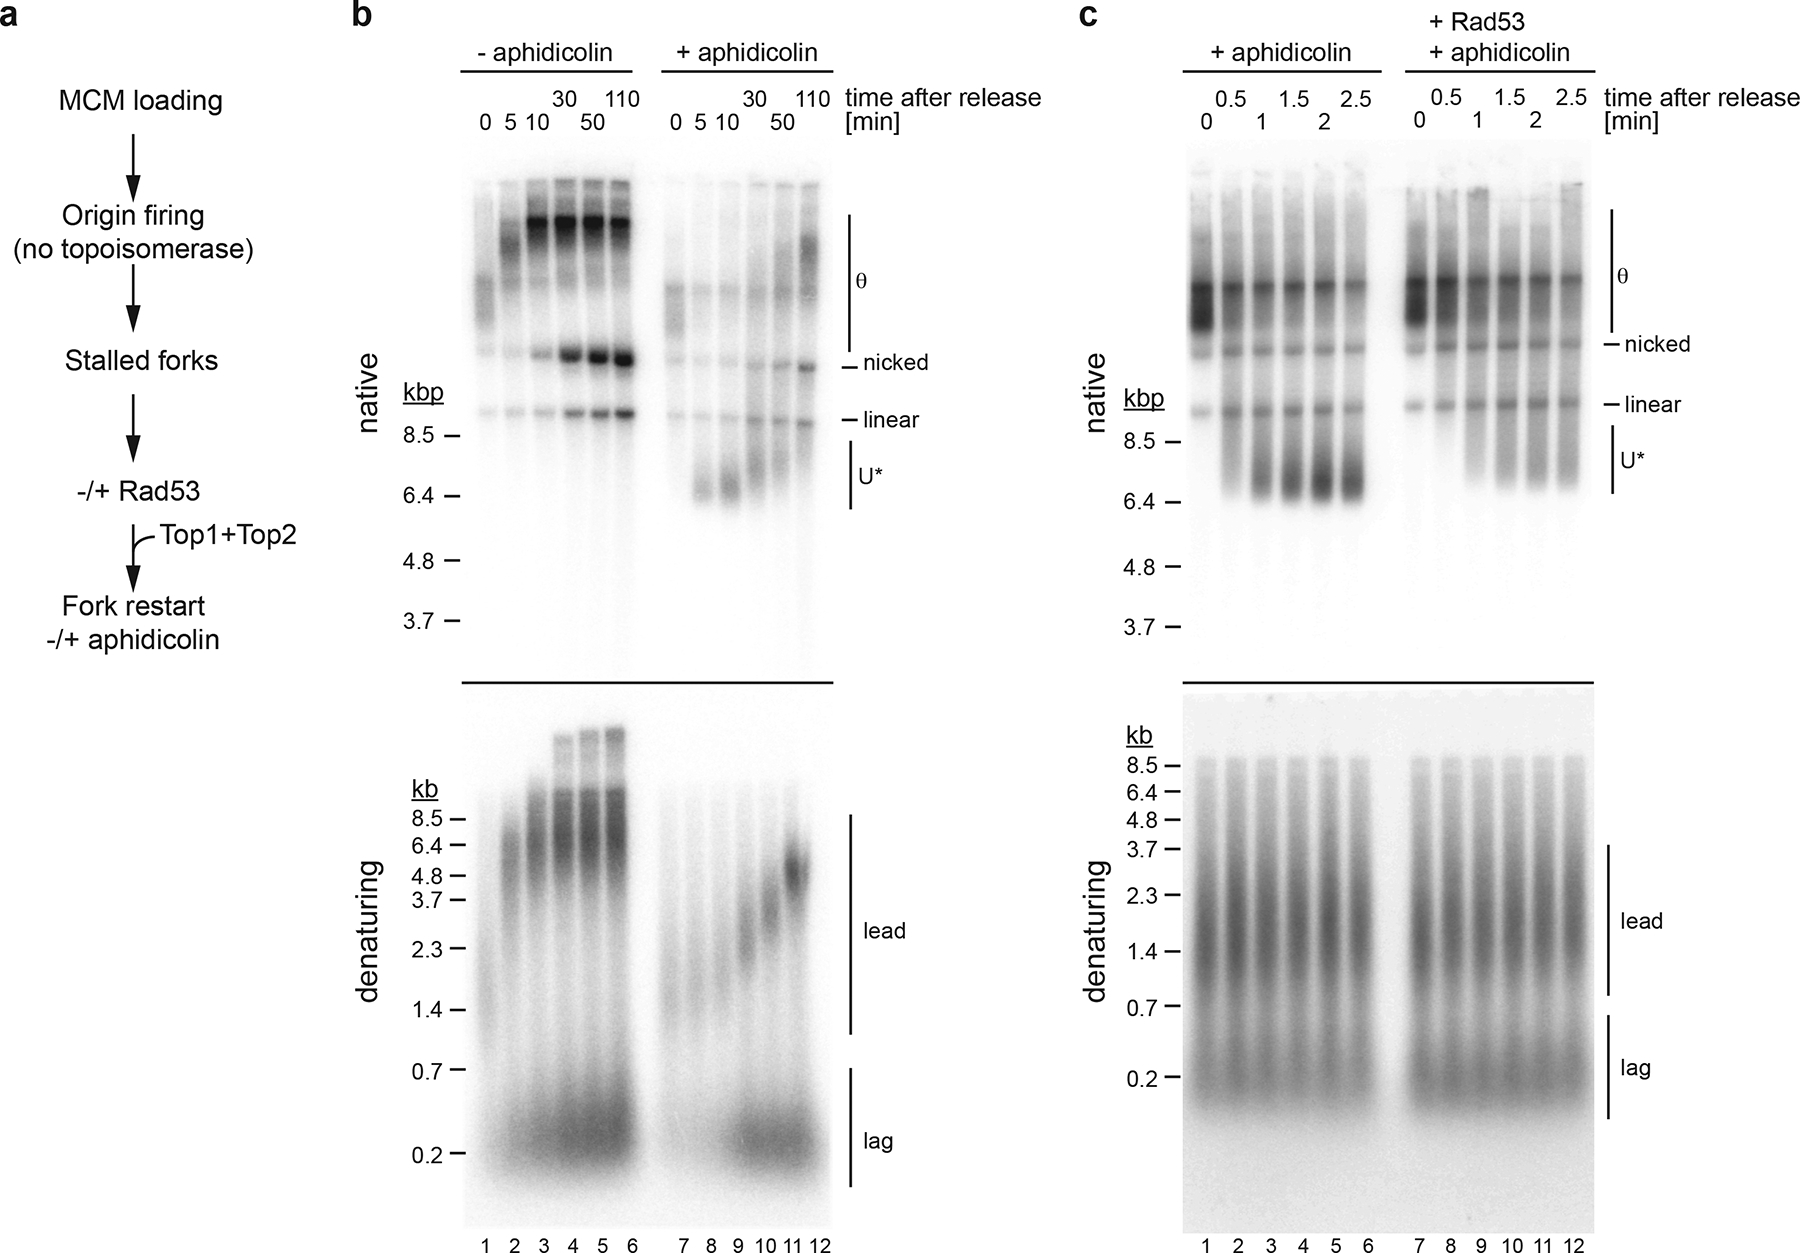
a, Experimental outline. b, Effect of aphidicolin on fork progression. Forks were released from a topological stall in the absence or presence aphidicolin (30 μM) as indicated. Times indicate minutes after Top1 and Top2 addition. Template: pARS305. c, Effect of Rad53 on helicase-polymerase uncoupling. Stalled forks were either mock-treated (lanes 1–6) or treated with Rad53 (lanes 7–12) prior to release in the presence of aphidicolin. Template: pARS305. Uncropped gel images for panels b and c are available as source data.
As U* mobility was maximal 5 minutes after fork release in the presence of aphidicolin (Fig. 6b), we assessed the effect of Rad53 on U* formation within 2.5 minutes of fork release; DNA synthesis did not progress noticeably within this period (Fig. 6c). In the absence of Rad53, U* was formed 1–1.5 minutes after fork release. In contrast, in the presence of Rad53 the rate of U* formation was strongly reduced. Inhibition of DNA unwinding was dependent on the Rad53 kinase activity (Extended Data Fig. 8b+c). Thus, Rad53 controls DNA unwinding at replication forks following polymerase inhibition.
Rad53 inhibition of DNA unwinding at replication forks is not dependent on CTM or Cdc45
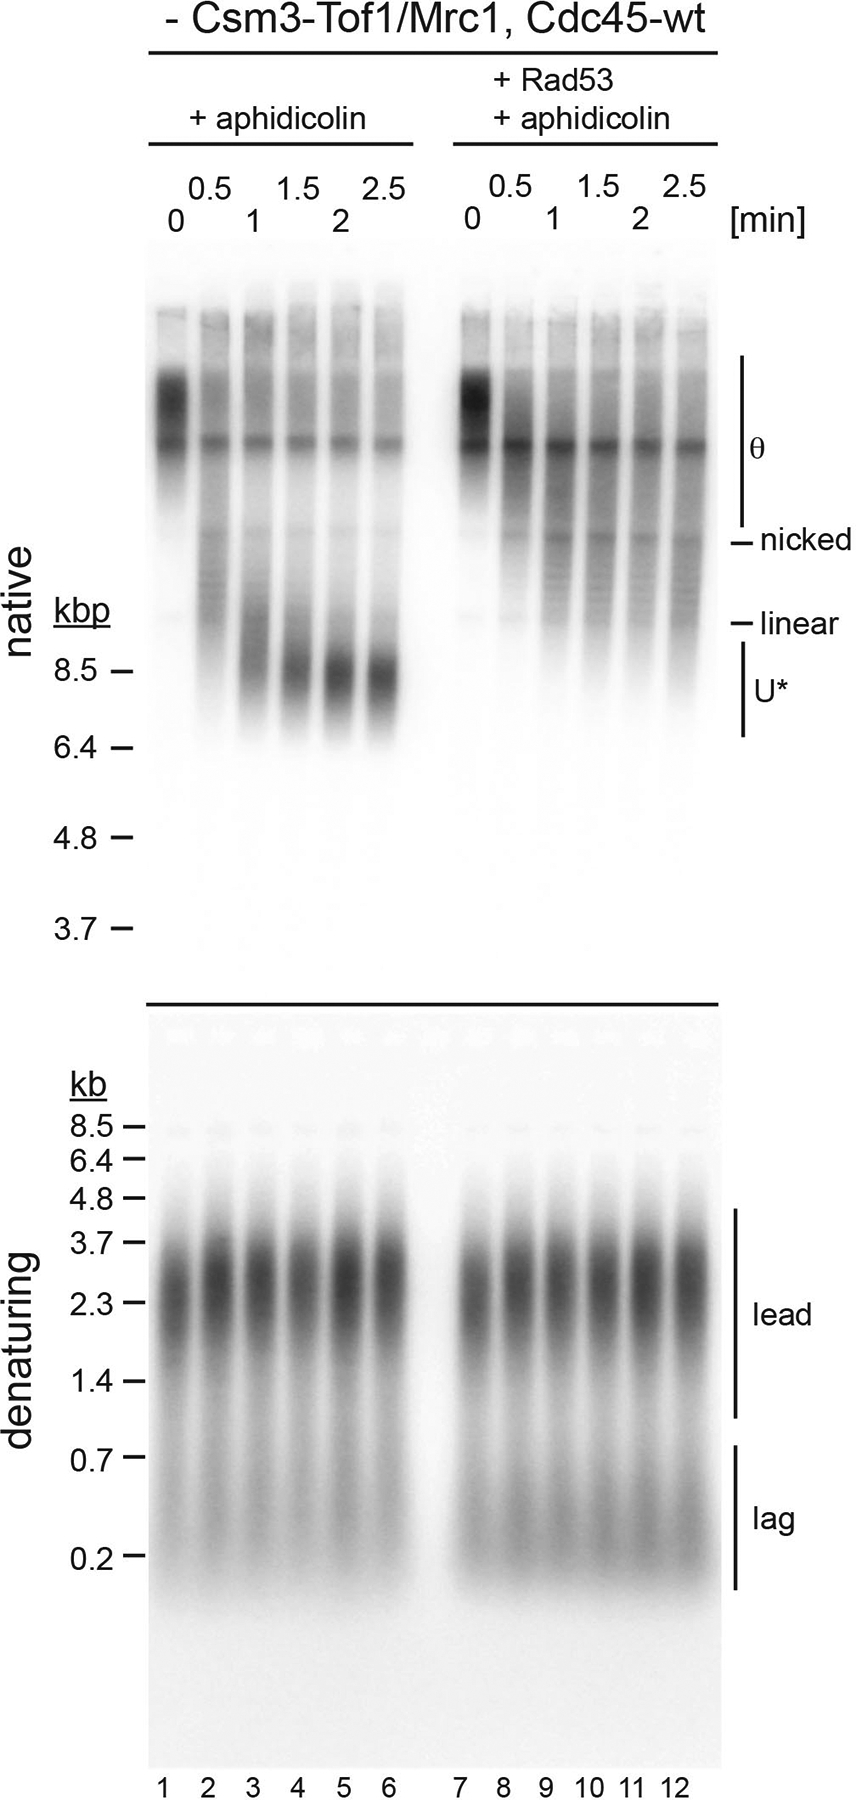
How does Rad53 control DNA unwinding at replication forks? Both Csm3-Tof1 and Mrc1 promote normal fork rates4,48,49, are phosphorylated by Rad53 during replication stress50,51, and are required for the restriction of replisome progression in cells treated with HU11. Moreover, Mrc1 acts as an adaptor for Rad53 during checkpoint activation52. However, we find that CTM is not required for the Rad53-dependent inhibition of DNA unwinding at replication forks (Fig. 7, Extended Data Fig. 9). Cdc45 has been shown to target Rad53 to stalled replication forks53. Phosphorylation of two threonine residues, T189 and T195, on the surface of Cdc45 mediates the binding of Rad53 to Cdc45 via the Rad53 FHA1 domain. We purified Cdc45–2A, which contains alanine substitutions at T189 and T195, to disrupt the Cdc45-Rad53 interaction53. However, replacement of Cdc45 with Cdc45–2A did not detectably attenuate the ability of Rad53 to inhibit U* formation (Fig. 7a). This is consistent with cdc45–2A cells exhibiting no apparent growth defect under replication stress53. Moreover, although the cdc45–2A allele sensitizes cells to HU treatment when combined with the checkpoint-deficient mrc1-AQ allele53, omission of CTM from reactions containing Cdc45–2A did not prevent Rad53 from inhibiting excessive DNA unwinding after helicase-polymerase uncoupling (Fig. 7b). It is noteworthy that the rate of U* formation is reduced in reactions lacking CTM, suggesting that CTM promotes the rate of DNA unwinding by CMG. We, therefore, propose that CTM promotes fork rates by directly stimulating the CMG helicase.
Figure 7: Rad53 control of DNA unwinding by CMG does not depend on Cdc45 or Mrc1.
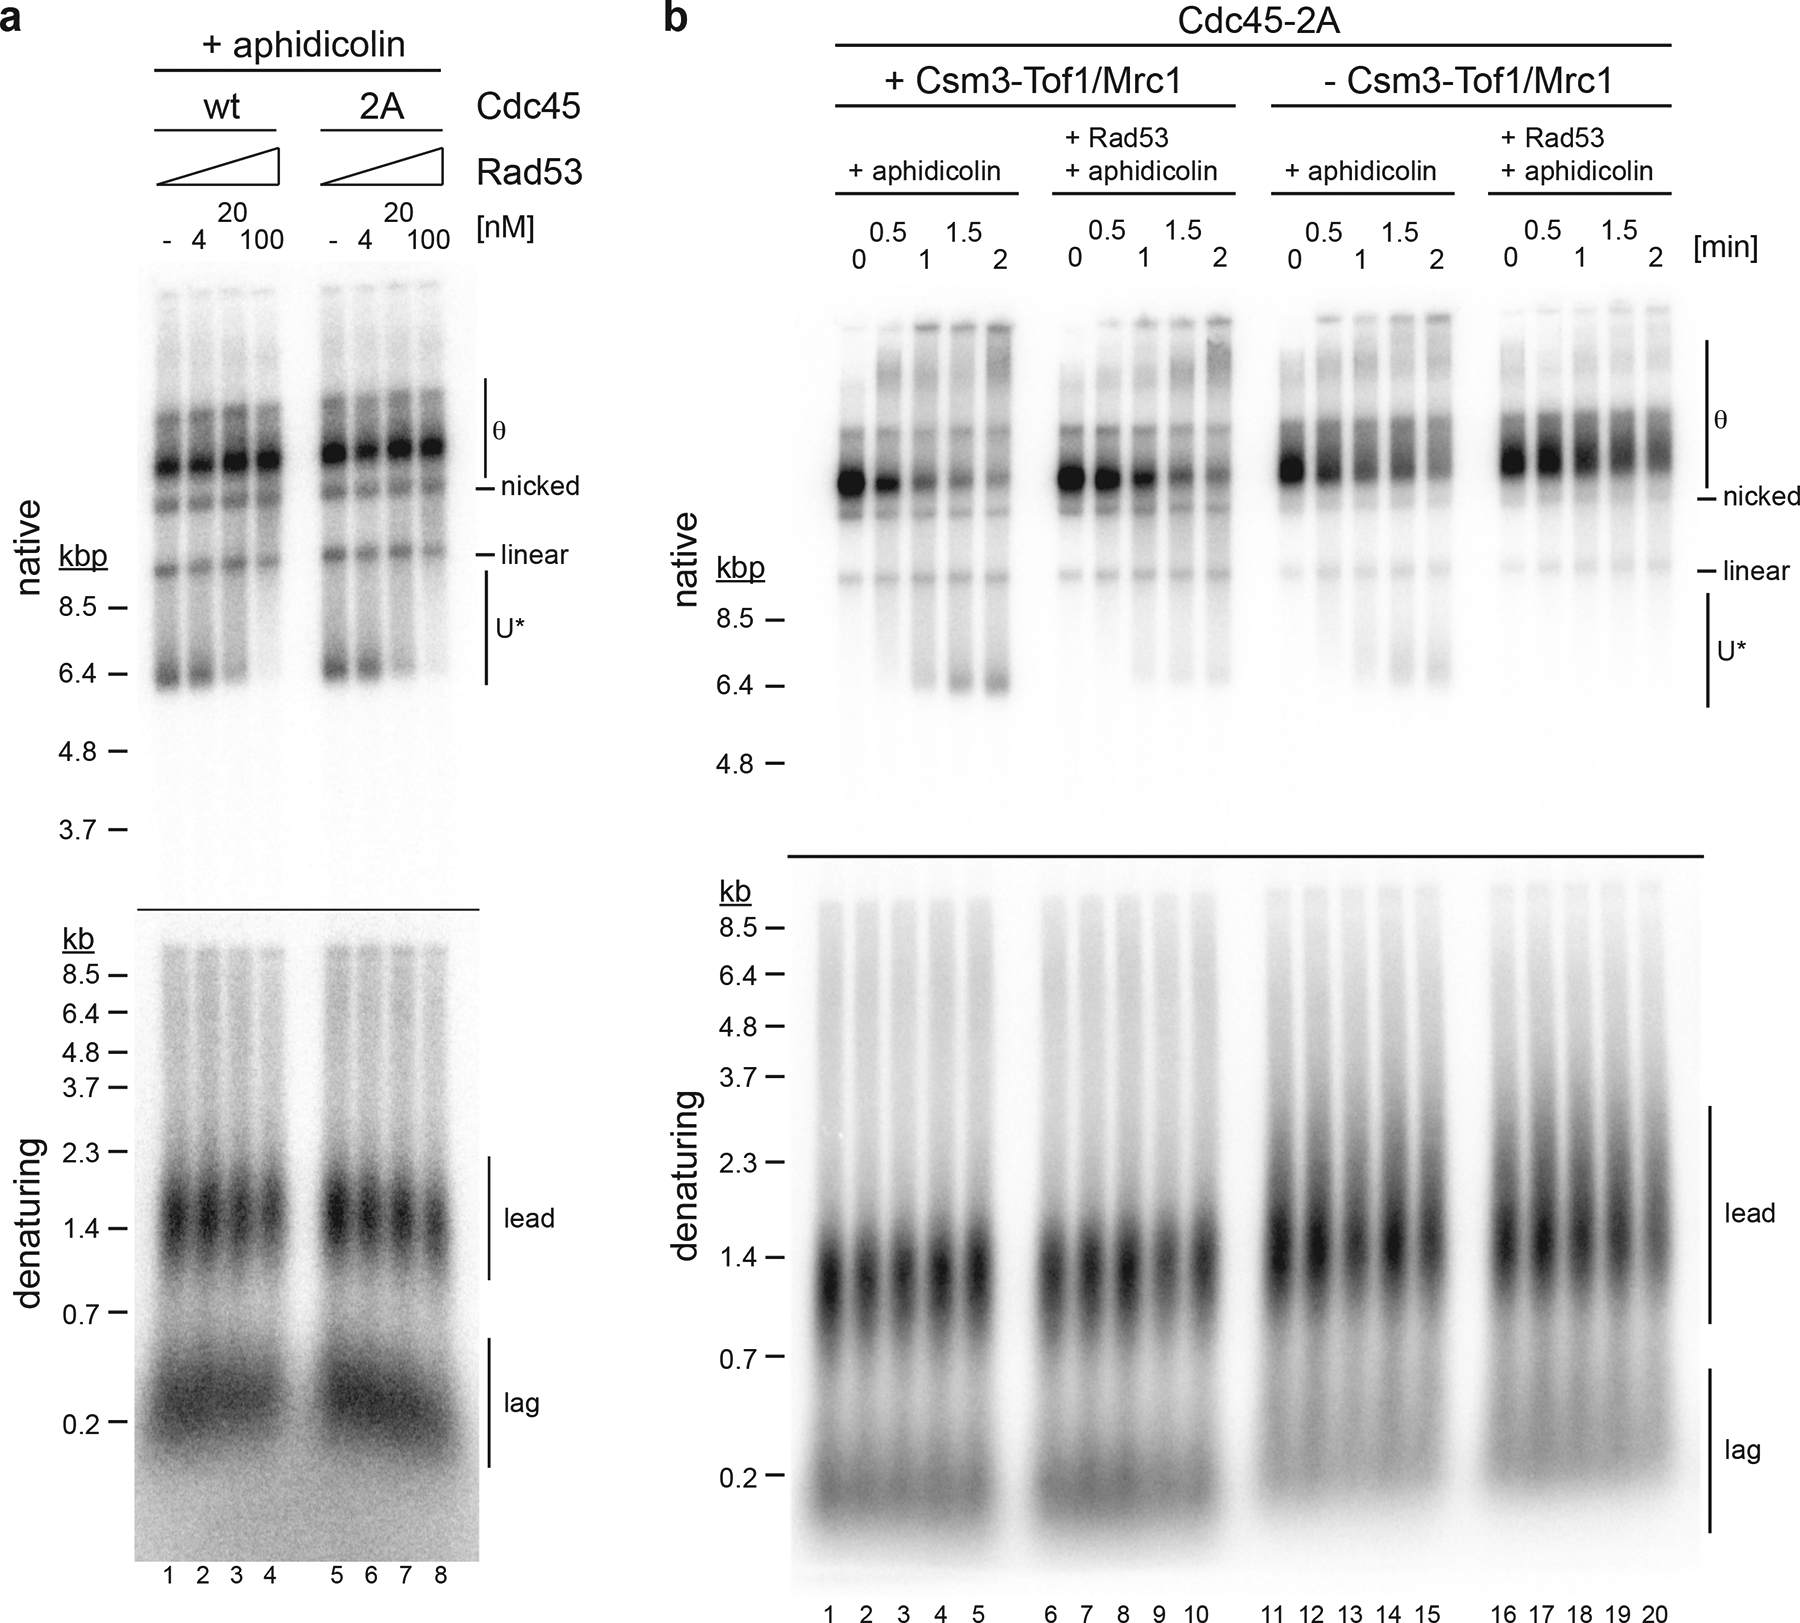
a, Reaction scheme as in Figure 6a, except that Cdc45–2A was used in place of Cdc45 where indicated; stalled forks were treated with the indicated concentrations of Rad53, and then released for two minutes by addition of Top1/Top2 in the presence of aphidicolin. Template: pARS305. b, Forks were assembled with Cdc45–2A in place of Cdc45, either in the absence or presence of Csm3-Tof1/Mrc1 as indicated, stalled by omission of topoisomerase, treated with 100 nM Rad53 as indicated, and released in the presence of aphidicolin as indicated. Time indicates minutes after fork release. Template: pARS305. Uncropped gel images are available as source data.
Rad53 inhibits the CMG helicase irrespective of DNA synthesis
Next, we tested if DNA synthesis at forks is a prerequisite for the inhibition of replisome progression by Rad53. For this, we modified an approach for origin-dependent CMG assembly and activation that avoids initiation of DNA synthesis41. To separate the inhibitory effect of Rad53 on CMG assembly from its potential role in regulating the CMG helicase, we assembled and activated CMGs on plasmid DNA in the absence of topoisomerase to stall active CMGs at template supercoils. Stalled CMGs were mock-treated or treated with Rad53, before being released from the topological block by addition of Top1. CMG helicase activity is detected by the generation of U form DNA in native gels. While the gel-mobility of U form DNA generated prior to CMG stalling continued to increase after block removal in the absence of Rad53, it persisted in the presence of Rad53, demonstrating that Rad53 inhibits DNA unwinding by CMG (Fig. 8a). We note that this data does not exclude the possibility that proteins other than CMG are targeted by Rad53 to regulate CMG activity, as some replisome components, e.g. Pol ε and Mcm10, which promote replisome progression5,54,55, are included in the CMG helicase assay here.
Figure 8: Rad53 control of DNA unwinding by CMG does not require inhibition of DNA synthesis.
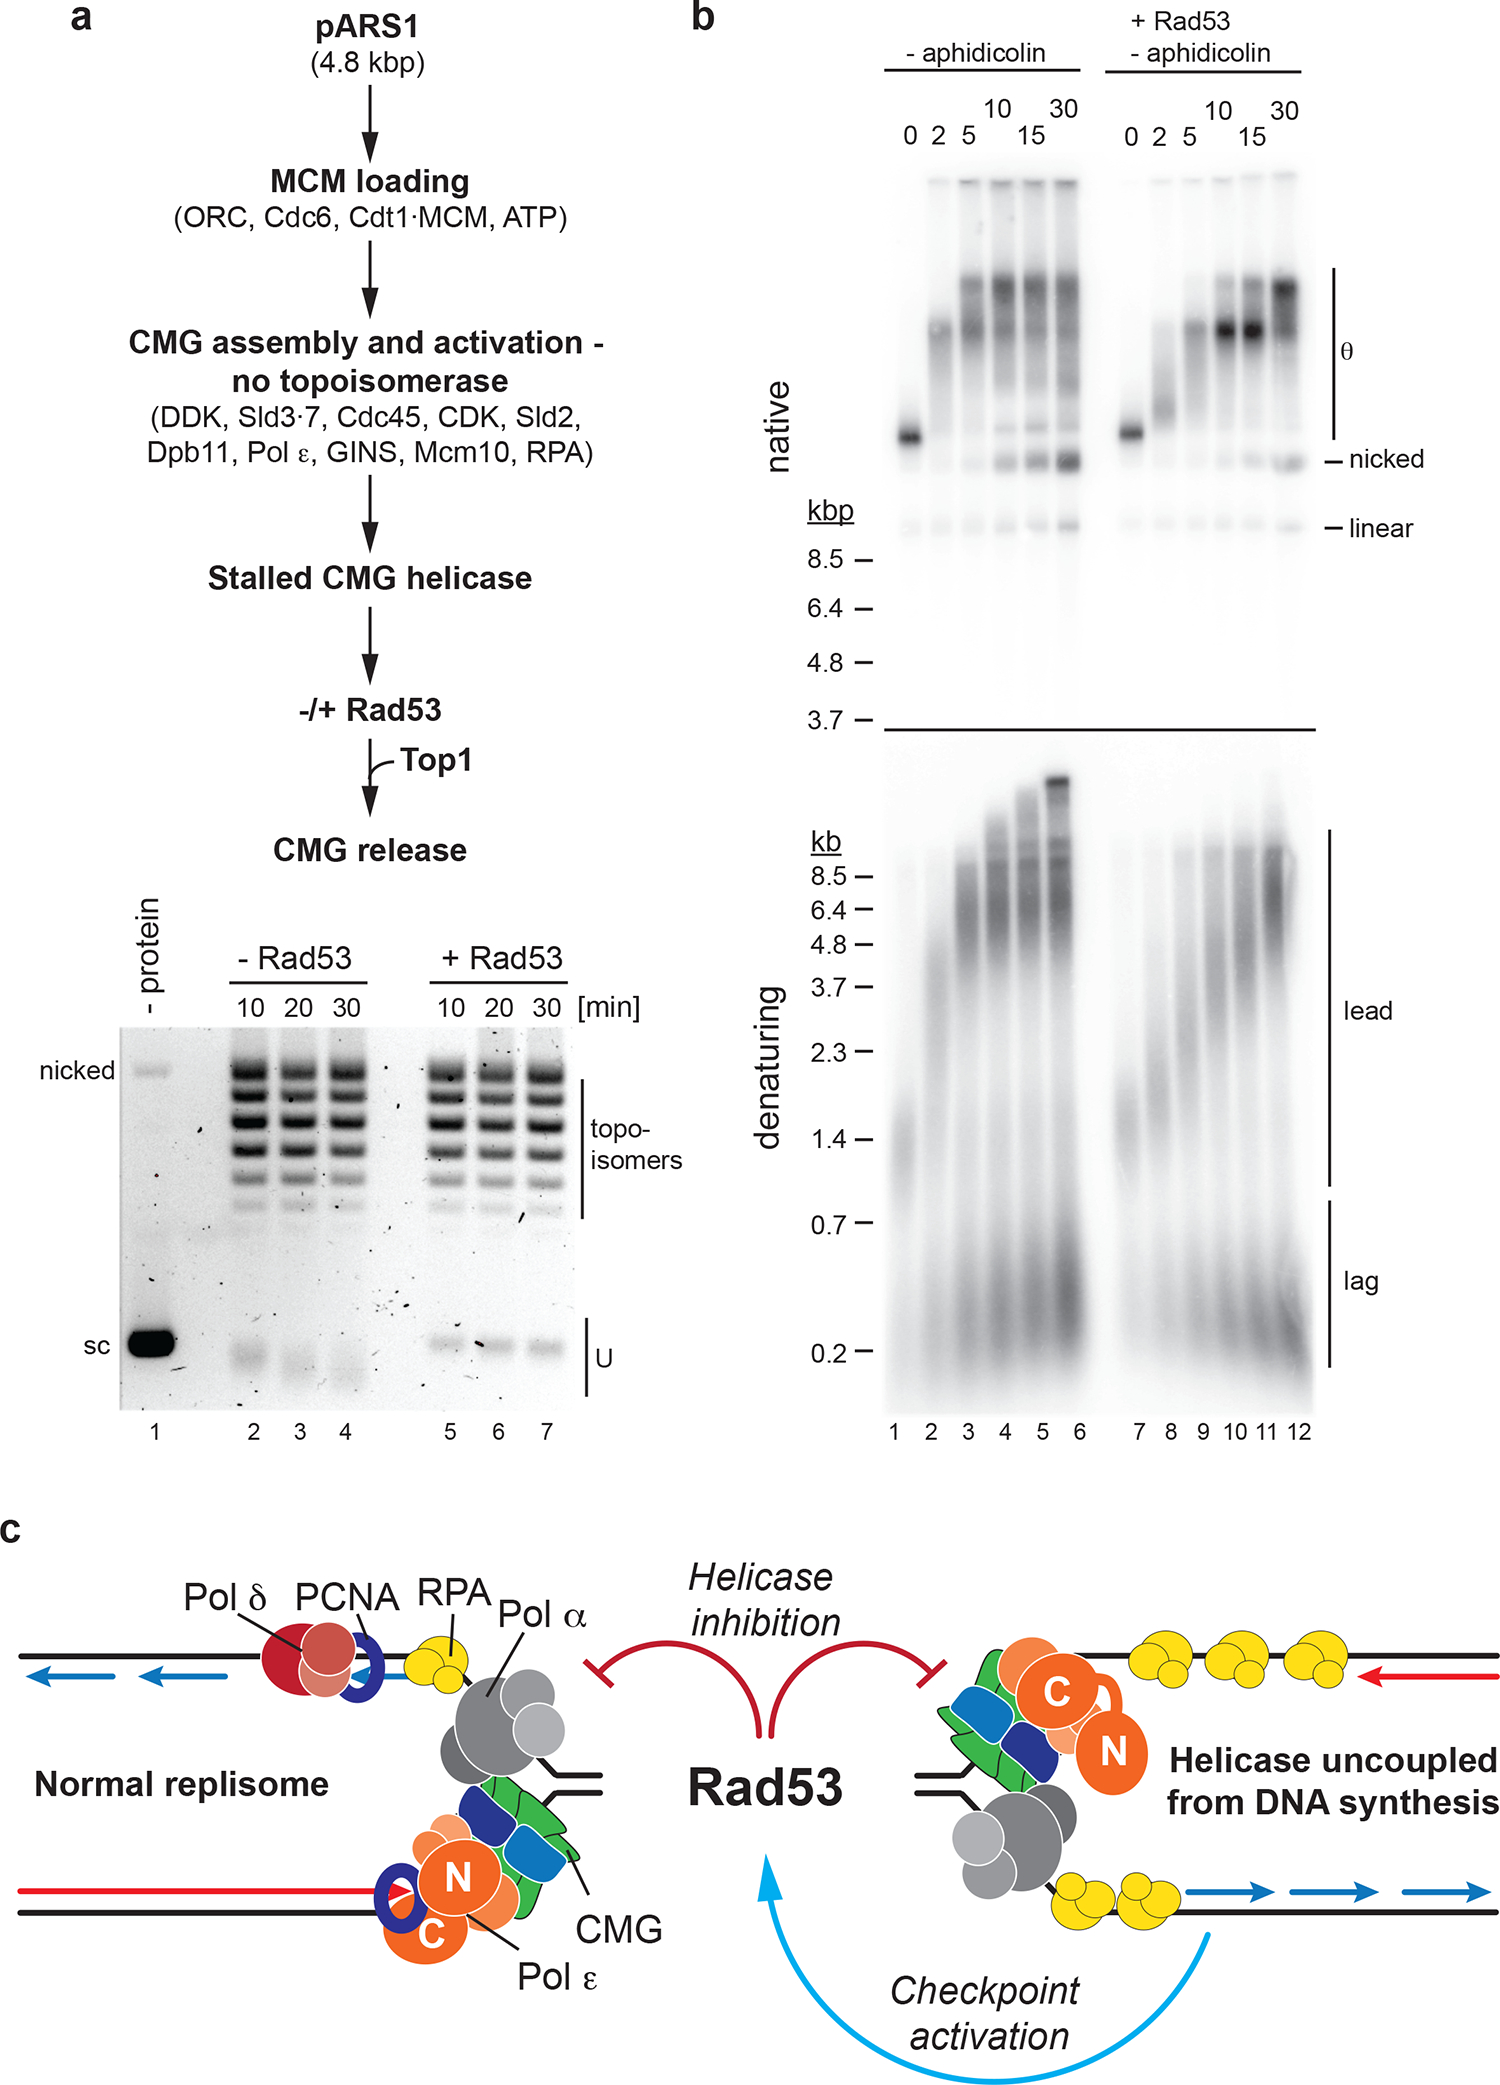
a, CMG helicase assay. Top: Reaction scheme. Bottom: Products analyzed by ethidium-bromide stain after native agarose gel-electrophoresis. Times indicate minutes after Top1 addition. sc: supercoiled. Template: pARS1. b, Reaction scheme as outlined in Figure 6a, omitting aphidicolin and including Rad53 as indicated. Template: pARS305. c, Model illustrating the control of fork progression by Rad53. Helicase-polymerase uncoupling induces the checkpoint via activation of Mec1-Ddc2 by RPA-coated ssDNA (blue arrow). Subsequent Rad53 activation leads to inhibition of replisome progression both in cis at forks undergoing extensive helicase-polymerase uncoupling, and at normal forks in trans (red block arrows). Uncropped gel images for panels a and b are available as source data.
To determine if Rad53 limits CMG activity only after inhibition of DNA synthesis, we tested the ability of Rad53 to inhibit fork progression in the absence of aphidicolin. As before, in the absence of Rad53, addition of Top1 and Top2 induced efficient and synchronous release of stalled forks, with leading strand synthesis largely complete 5 minutes after fork release, coincident with the appearance of fully replicated plasmid daughter monomers (Fig. 8b). In contrast, fork progression was markedly reduced in the presence of Rad53. Thus, Rad53 inhibition of fork progression is not dependent on the inhibition of DNA synthesis.
DISCUSSION
We have shown that polymerase inhibition at a eukaryotic replication fork causes uninterrupted CMG helicase progression uncoupled from DNA synthesis. This indicates that DNA synthesis and DNA unwinding are not tightly coupled in the replisome. Our data support a model in which the coordination of DNA synthesis and unwinding at replication forks is maintained by the catalytic rates of the helicase and polymerase, rather than by their tight physical interaction. Consequently, helicase-polymerase uncoupling may occur stochastically even under normal conditions. Combined with the observation that lagging strand synthesis can be uncoupled from leading strand synthesis at eukaryotic forks6,10 this may indicate an autonomy of the DNA synthesis and DNA unwinding machineries at eukaryotic replication forks analogous to that observed in E. coli15, possibly to increase the robustness of the DNA replication process.
In E. coli, the intrinsic slowing of the replicative helicase after uncoupling from polymerase, the “dead-man’s switch”, limits the generation of ssDNA and facilitates helicase-polymerase recoupling15. Some evidence suggests that CMG inherently unwinds DNA also at rates that are below those of normal forks7,9,14, which may be due to CMG slippage or loss of the driving force of DNA synthesis3,14. Consistent with this notion, our data suggests that the rate of DNA unwinding by yeast CMG does not greatly exceed ~ 55 bp per minute if uncoupled from DNA synthesis, well below the normal fork rate of ~ 1–2 kb per minute. Thus, intrinsic helicase slowing upon uncoupling from DNA synthesis may buffer transient helicase-polymerase uncoupling and permit rapid re-coupling without the need for checkpoint activation. Recoupling of the CMG to leading strand synthesis may involve Pol δ, which exhibits a rate of DNA synthesis that exceeds normal fork rates4,5,56, and which competes free Pol ε at PCNA-bound primer-template junctions5,34.
However, as the helicase does not arrest after uncoupling from DNA synthesis, the “dead man’s switch” failsafe mechanism is insufficient to maintain fork integrity when DNA synthesis is stalled for extended periods of time, as occurs during replication stress. Under such conditions, maintenance of fork integrity is strictly dependent on checkpoint signaling19,26. Our observation that Rad53 further restricts DNA unwinding by the CMG provides a molecular mechanism for the previously observed checkpoint-dependent control of replisome progression10,11,13,21,23. Restriction of replisome progression by Rad53 may limit the generation of ssDNA to prevent replication catastrophe from RPA exhaustion and protect forks from nuclease attack57,58. CMG inhibition by Rad53 may also help maintain the replisome near the site of polymerase stalling to facilitate the recoupling of CMG to leading strand synthesis.
How Rad53 inhibits the CMG helicase is not clear. While Mrc1 mediates the activation of Rad53 at stalled forks and is itself a target for Rad5352, our data demonstrate that, once activated, Rad53 can inhibit DNA unwinding by CMG in the absence of Mrc1. Redundant mechanisms may be involved in Rad53-dependent fork control. For example, Cdc45 provides an additional docking site for Rad53 that acts synergistically with Mrc1 to protect cell viability during replication stress53. However, we find that Rad53 can inhibit replisome progression independently of both Mrc1 and Cdc45. Rad53 is recruited to replisomes in vivo even after disruption of its interaction with both Mrc1 and Cdc4553, indicating that Rad53 interacts with yet other replisome components. The inhibition of CMG activity by Rad53 may involve Mcm10 or Pol ε, both of which have been implicated in promoting fork progression38,54,55, or CMG may be targeted directly by Rad53. For example, Chk2 has been shown to inhibit CMG directly in Drosophila59. Elucidating the Rad53-dependent replisome control mechanism will require the identification of the critical Rad53 phosphorylation sites in the replisome.
The inhibition of CMG activity by Rad53 does not require prior inhibition of DNA polymerase activity. This supports a model in which stressed forks signal the Rad53-dependent inhibition of normal forks in trans (Fig. 8c). Such a mechanism may provide an additional strategy to preserve dNTP levels during replication stress and prevent further fork stalling events. While Mec1-Ddc2-dependent Rad53 activation is bypassed here by the use of active recombinant Rad5360, reconstitution of this pathway will provide a gateway to differentiate between global and local Rad53 effects in the future.
Our observation of helicase-polymerase uncoupling in the presence of Pol ε complexes harboring an inactive polymerase domain was unexpected. The data suggests that compensatory leading strand synthesis by Pol δ can occur close to the fork at limiting concentrations of Pol ε polymerase point mutants (Extended Data Fig. 10). However, at concentrations that exceed those of active forks, free mutant Pol ε complexes compete with Pol δ. We propose that this inhibition is the cause of lethality by pol2 alleles harboring an inactive polymerase domain. Pol ε mutants lacking the N-terminal polymerase domain, on the other hand, cannot compete Pol δ at primer-template junctions, explaining why such mutants are viable. Contrary to pol2–16, we find that the pol2Δcat allele and polymerase-dead pol2 alleles lacking a functional PIP box efficiently rescue the lethality of pol2Δ cells. Thus, the loss of leading strand synthesis by Pol ε is significantly better tolerated by cells than previously thought, although it remains to be seen how efficient and stress-resistant replication forks are in cells lacking Pol ε polymerase activity.
METHODS
DNA templates
Plasmids used in this study are listed in Supplementary Table 1. Plasmids pARS1 (4.8kb) and pARS305 (9.8kb) have been described previously (27, 61). For use in DNA replication reactions, plasmids were purified by sucrose gradient centrifugation following maxiprep column purification (Qiagen). Templates for primer extension reactions were generated by annealing the circular DNA template (M13mp18 ssDNA, NEB) to an oligonucleotide of the sequence 5’-CCCAGTCACGACGTTGTAAAACG-3’. Excess oligonucleotides were removed after the annealing reaction using S-400 spin column chromatography (GE Healthcare).
Protein purification
Details on the methods used for protein purification can be found in Supplementary Note 1. A summary of purification steps for each protein is listed in Supplementary Table 2. Yeast strains generated in this study are listed in Supplementary Table 3.
Standard DNA Replication assay
All steps were carried out at 30°C. First, Mcm2–7 loading was performed in a 10 μl reaction by incubating 10 nM plasmid DNA template, 50 nM ORC, 50 nM Cdc6 and 100 nM Cdt1·Mcm2–7 in a buffer consisting of 25 mM HEPES-KOH (pH7.6), 0.02 % NP-40, 10 mM magnesium acetate, 5 % glycerol, 100 mM potassium acetate, 2 mM DTT, and 5 mM ATP for 15min. DDK was then added to 125 nM and incubation continued for a further 15 min. Unless otherwise stated, DNA replication was initiated by the addition of 15 μl master mix of replication proteins resulting in final concentration of 60 nM Sld3·7, 80 nM Cdc45, 50 nM Clb5·Cdk1, 80 nM GINS, 30 nM Dpb11, 30nM Pol ε, 80 nM Sld2, 120 nM RPA, 60 nM Pol α, 35 nM Ctf4, 20 nM RFC, 70 nM PCNA, 4 nM Pol δ, 20 nM Csm3·Tof1, 20 nM Mrc1, 15 nM Mcm10, 30 nM Top1, and 30 nM Top2. The final replication reaction also included 0.2 mg / ml BSA, 40 μM each dATP / dGTP / dTTP / dCTP, 200 μM each GTP / CTP /UTP, 66 nM α32P-dATP (3,000 Ci / mmol), 16 mM creatine phosphate, 0.04 mg / ml creatine kinase, 190 nM potassium acetate, 20 mM sodium chloride, and 15 mM potassium chloride. Reactions were terminated at times indicated in the respective figures by adding 40 mM EDTA, 1.6 U Proteinase K, and 0.25 % SDS, and incubating the mix at 37°C for 30 minutes. DNA was isolated by phenol / chloroform extraction and unincorporated nucleotides removed with G-50 spin columns equilibrated in TE buffer. The sample was then fractionated on a 0.8% alkaline agarose gel (30 mM NaOH and 2 mM EDTA) or 0.8% native agarose gel (in TAE) dried, and imaged using Typhoon FLA 7000. Quantification of the gel images was performed using the ImageJ software.
Modified replication assays
In Figure 1A, the master mix of replication proteins included Fen1 and Cdc9 as indicated, resulting in final concentrations of 15 nM and 12 nM, respectively. In Figure 1E, the concentration of Pol ε or its variants was 15 nM. For the dNTP titration experiment in Figure 5A (lanes 1–3) the final concentration of α32P-dATP was 3.3 nM; the shown experiment was performed in the absence of Csm3·Tof1 and Mrc1. For reactions with limiting dNTPs in Figure 5B and Extended Data Figure 7, the final concentration of dNTPs was 250 nM each.
To stall replisomes in absence of topoisomerase (Figure 6), replication was initiated with master mix devoid of Top1 and Top2 and continued for 10 minutes, followed by simultaneous addition of Top1, Top2 and aphidicolin (or DMSO as control), as indicated, to final concentrations of 30 nM, 30 nM and 30 μM, respectively. In experiments involving Rad53, 7 minutes after the addition of master mix (lacking Top1 and Top2), Rad53 was added to final concentration of 100 nM or as indicated (Figure 7a) and incubation was continued for an additional 7 minutes prior to addition of either Top1 and Top2 with or without aphidicolin.
For protein titration experiments, the stock of the corresponding protein was serially diluted in respective storage buffer and equal volumes of the protein dilutions were added to the initiation master mix. For time course assays, equal volumes of a replication reaction were removed from a single master reaction and terminated at indicated times as described above for standard replication assay.
dNTP pulse-chase replication reactions
Reactions in Figure 2 were carried out identically to the standard replication assay with the exception that the dATP concentration was lowered to 2 μM during the pulse and the addition of cold dATP to final concentration of 1 mM for the chase. Reactions were pulse-labeled for 10 mins (Figure 2B) or 2.5 mins (Figure 2D). In Figures 5B and 5C, the final concentration of cold dATP was raised to 500 μM after 5 minutes.
Primer extension assay
Primer extension reactions were performed at 30°C in polymerization buffer (25 mM Tris-HCl pH 7.5, 8 mM Mg-Acetate, 50 mM K-glutamate, 5 % glycerol). First, 1 nM of DNA template was incubated with 1 mM ATP, 1 mM DTT, 80 μM dATP, 80 μM dGTP, 80 μM dCTP and 400 nM of RPA for 5 mins. PCNA and RFC were then added to 70 nM and 4 nM respectively and incubation was continued for 5 more minutes. Then, 4 nM Pol δ and 33 nM α32P-dATP (3,000 Ci / mmol) was added to the reaction resulting in a primer extension by 9 bp (due to lack of dTTP). After 5 mins, variants of Pol ε (to final concentrations as indicated) and 80 μM dTTP were added to the mix and the extension was continued for 3 minutes. The reactions were stopped by the addition of EDTA and SDS to final concentrations of 40 mM and 0.25 %, respectively. Products were fractionated on a 0.8 % alkaline agarose gel (30 mM NaOH and 2 mM EDTA), dried, and imaged using Typhoon FLA 7000. Quantification of the gel images was performed using the ImageJ software.
CMG helicase assay
All steps were carried out at 30°C. First, Mcm2–7 loading was performed by incubating 140 fmol of plasmid DNA template with 50 nM ORC, 50 nM Cdc6 and 100 nM Cdt1·Mcm2–7 in a buffer consisting of 25 mM HEPES-KOH (pH7.6), 0.02 % NP-40, 10 mM magnesium acetate, 5 % glycerol, 100 mM potassium acetate, 2 mM DTT, 5 mM ATP, 40 mM creatine phosphate and 0.1 mg / ml creatine kinase for 15 minutes. DDK was then added to 125 nM and incubation continued for a further 15 minutes. Then a master mix of proteins for CMG activation was added to the reaction resulting in final concentration of 75 nM Sld3·7, 100 nM Cdc45, 60 nM CDK, 100 nM GINS, 40 nM Dpb11, 30 nM Pol ε, 100 nM Sld2, 135 nM RPA, 15 nM Mcm10, and 0.4 mg / ml BSA. The reaction mix was incubated for 10 minutes and Rad53 was then added, as indicated, to a final concentration of 100 nM. Incubation was continued for 5 minutes and Top1 was added to final concentration of 30 nM. Aliquots of the reaction were removed at indicated times and terminated by adding 25 mM EDTA, 1.6 U Proteinase K and 0.25% SDS, and incubating the mix at 42°C for 20 minutes. DNA was isolated by phenol / chloroform extraction and unincorporated nucleotides removed by centrifugation through G-50 spin columns equilibrated with TE buffer. Products were fractionated on a 1.0 % native agarose gel (in TAE) and visualized by staining the gel with 1x TAE consisting of 0.5 μg / ml of ethidium bromide for 1 hour followed by de-staining with 1x TAE / 1 mM magnesium sulfate for 1 hour.
Plasmid Shuffle assay with Pol ε variants
Yeast strain T-1925–5 (W303 leu2–3,112 trp1–1 can1–100 ura3–1 ade2–1 his3–11,15 pol2Δ::KAN pRS416-Pol2–3HA::), a kind gift of Xiaolan Zhao (MSKCC), was transformed with respective pRS315G-POL2 tester plasmids and grown on selective minimal plates lacking uracil and leucine. Resulting transformants were re-streaked on minimal plates lacking leucine and grown for 24 hours at 30°C to allow loss of pRS416-POL2wt. Transformants were then re-streaked on minimal plates lacking leucine and containing 0.1 % 5-fluoroorotic acid (5-FOA), 2 % raffinose, and either 0.05 % or 1 % galactose, as indicated. For the Western blot analysis in Figure 4A, transformants were grown to the density of 2 × 10⁷ cells / ml in selective media lacking leucine and uracil and containing 2 % raffinose. Galactose was then added to final concentration of either 0.05 % or 1 %, and cells collected after 3 hours and lysed and processed for western blotting.
Quantification and statistical analysis
Data were quantified and statistically analyzed using Image J and Graphpad Prism 7.0 softwares, respectively. For the pulse-chase experiments in Figure 2, lane profiles of the gels were generated using the Image J and the maximum product length was approximated as the intersection of two straight lines, corresponding to a straight line manually fitted to background and a second straight line manually fitted to the leading edge of the leading strand population. A standard curve generated from molecular marker was used to convert the point of intersection to length in base pairs. Replication rates were calculated by fitting the data into a linear regression and calculating the slope of the regression.
For the quantification of relative DNA synthesis in Figure 3B, total DNA synthesis per lane was first calculated using the lane profiles and divided by the amount of DNA synthesis in lane 1 (without Pol ε). In Extended Data Figure 3A, the percent dissolution was calculated as the fraction of full-length linear product relative to total replication products in each lane.
REPORTING SUMMARY
Further information on experimental design is available in the Nature Research Reporting Summary linked to this article.
DATA AVAILABILITY
Source Data for graphs in Fig. 2 and 3, and Extended Data Fig. 3 and 4 are available with the paper online.
Extended Data
Extended Data Fig. 1. Reaction conditions affecting lagging strand synthesis in vitro.
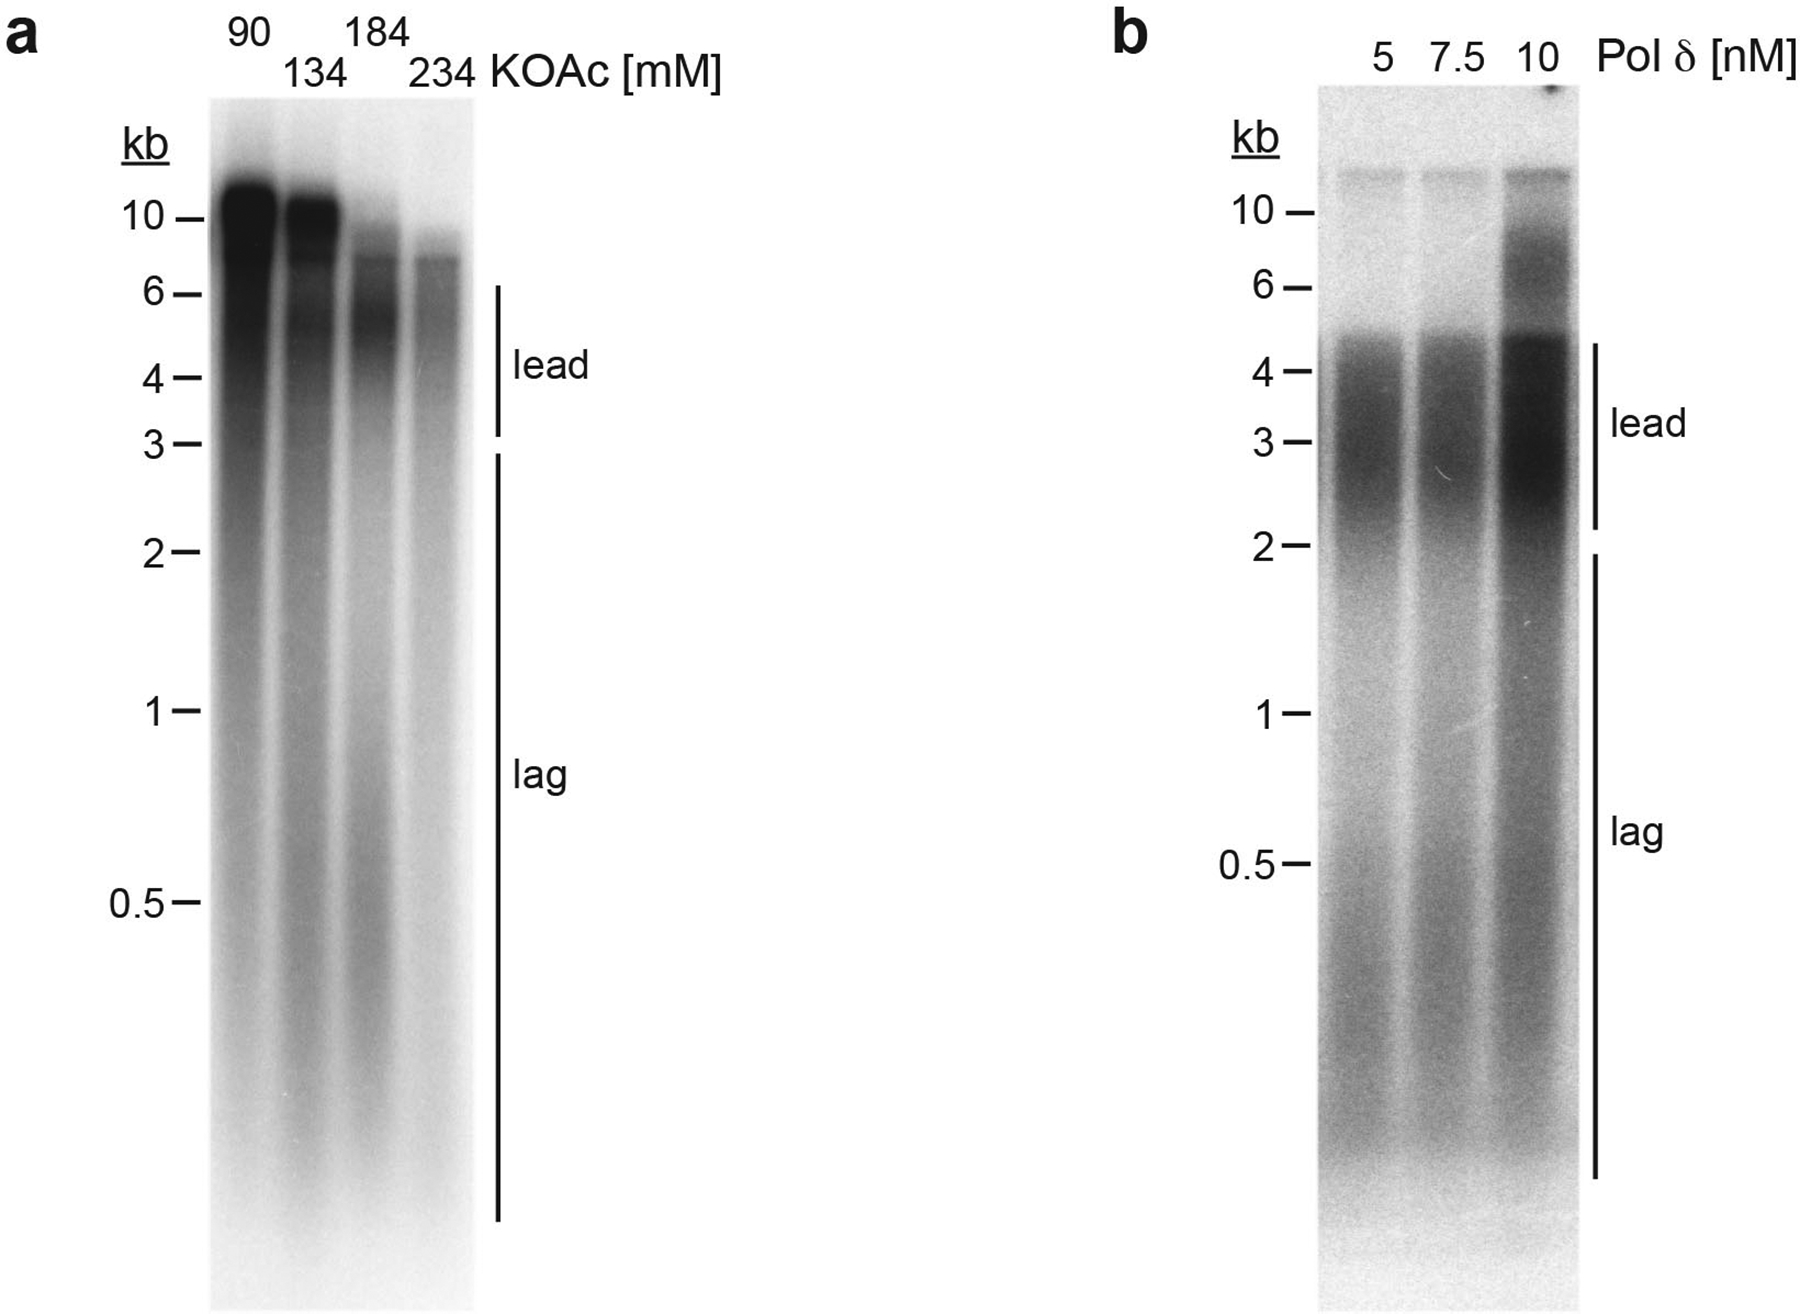
a, Standard replication reactions were performed at various final salt concentrations as indicated. Template: pARS305. b, Titration of Pol δ into standard replication reactions. Template: pARS1. Reaction products were analyzed by 0.8 % alkaline agarose gel-electrophoresis and autoradiography. Uncropped gel images are available as source data.
Extended Data Fig. 2. Plasmid replication intermediates.

Leading strands are in red, lagging strands in blue. ERI: early replication intermediate; LRI: Late replication intermediate.
Extended Data Fig. 3. Characterization of replication products.
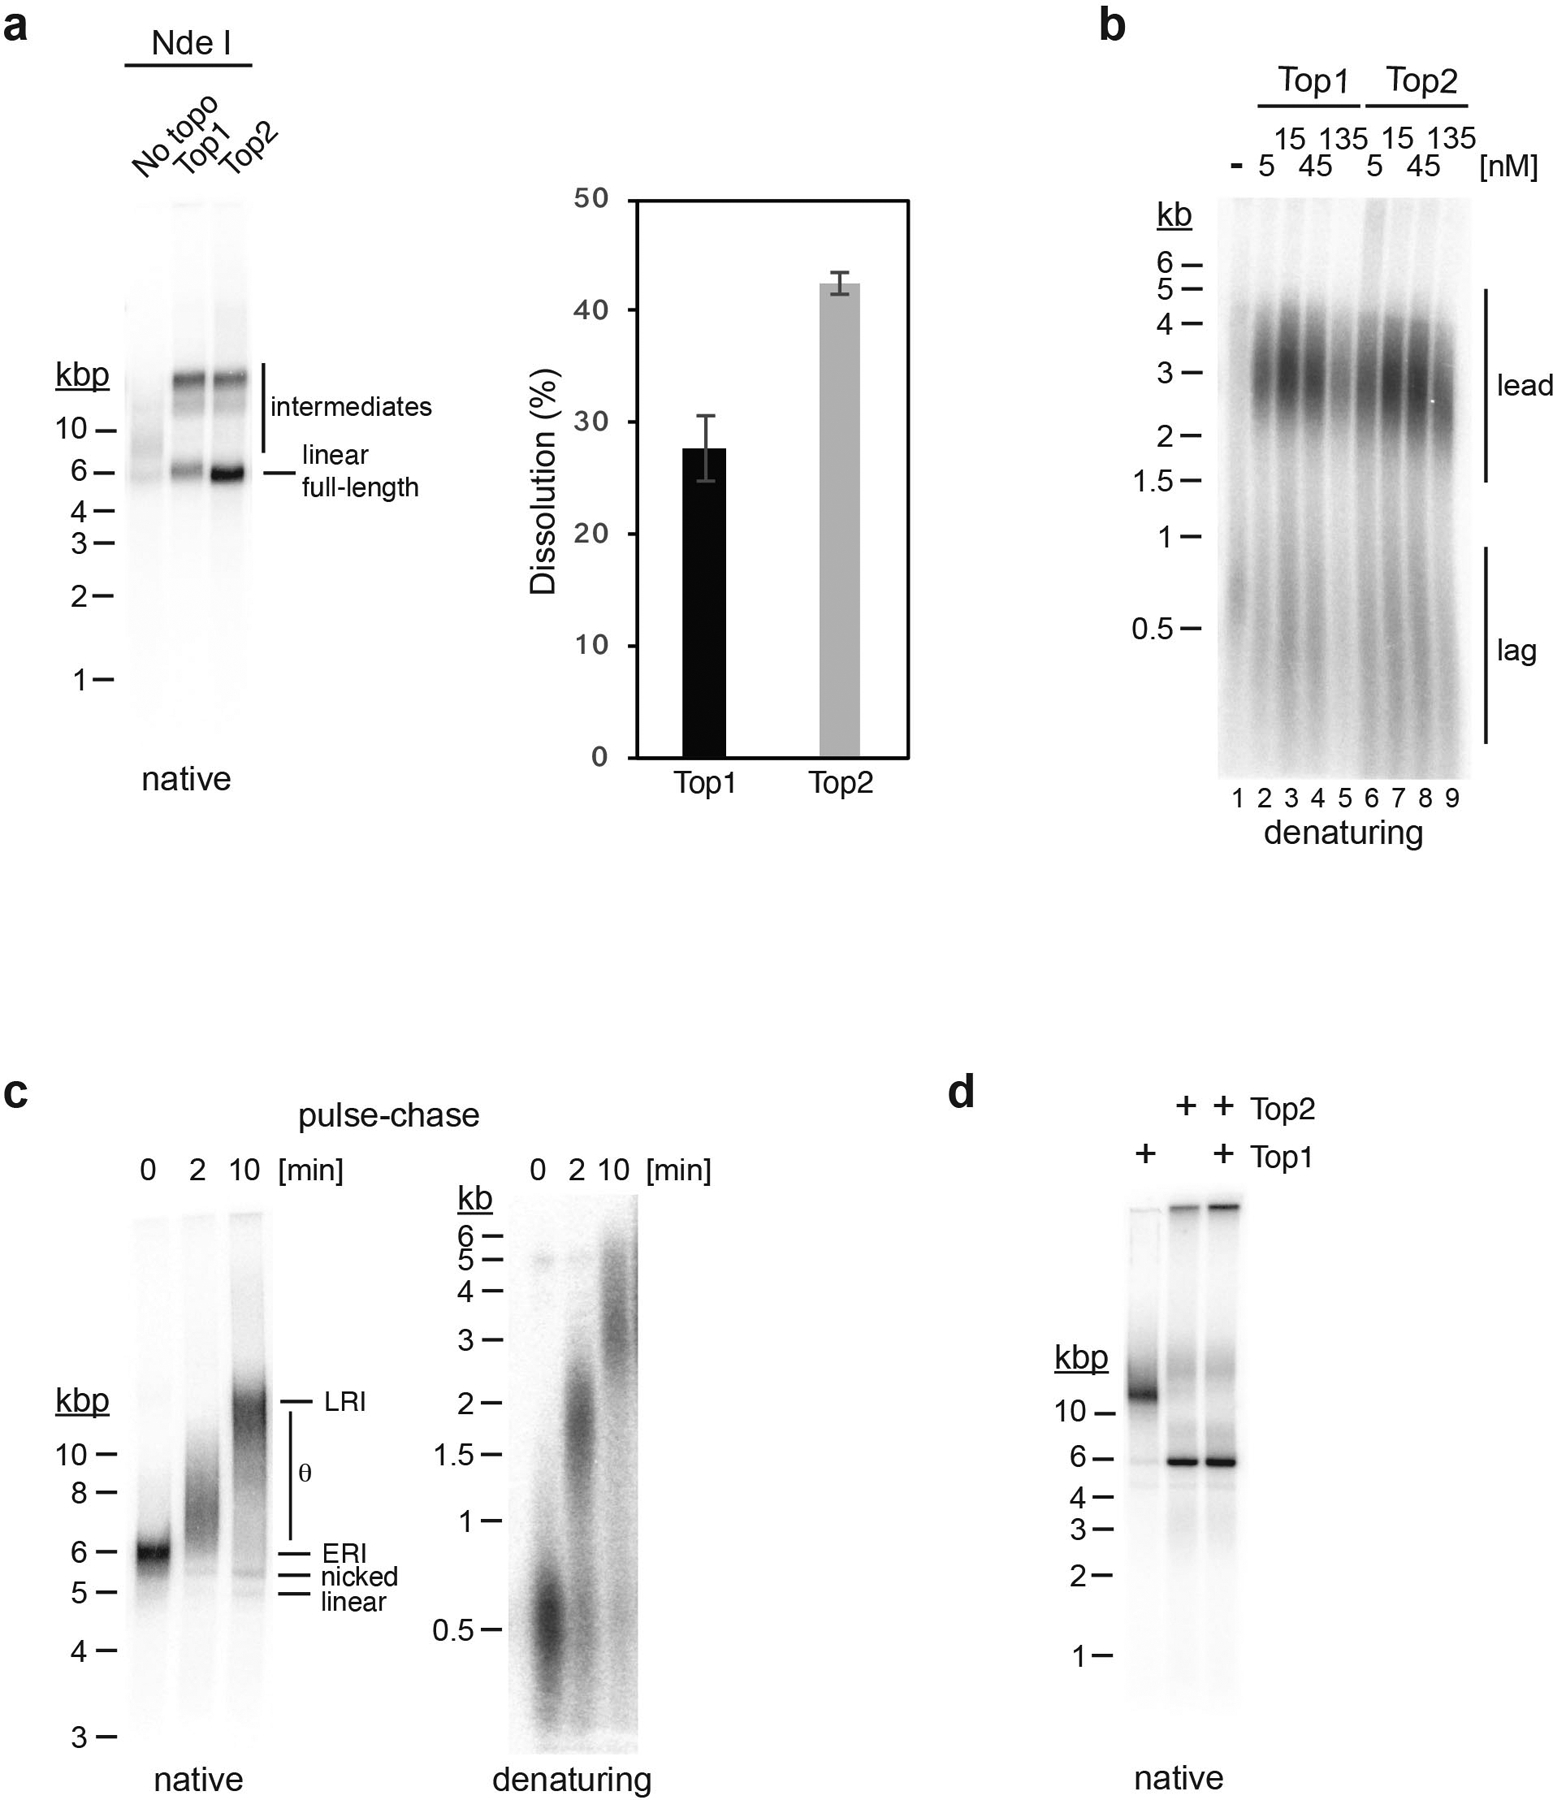
a, Standard replication reactions with pARS1 were carried out in the absence or presence of Top1 or Top2, as indicated. Reactions were stopped 60 minutes after origin activation, and replication products analyzed by native agarose gel-electrophoresis and autoradiography after linearization with the unique cutter Nde I, which cuts near the origin (fully replicated DNA molecules will resolve into linear monomers after linearization, whereas replication products containing unreplicated regions will resolve into double Y-shaped intermediates. Representative gel is shown on the left. The bar diagram depicts the average dissolution efficiency (fraction of linear full-length molecules per reaction) and s.d. of three independent experiments. b, Replication products from experiment in Figure 1b were analyzed by alkaline agarose gel-electrophoresis and autoradiography. c, Pulse-chase experiment demonstrating that the ERI is a precursor of the LRI. Replisomes were formed on chromatin templates in the presence of α−32P-dCTP and stalled by omission of topoisomerase from the reaction (lane 1). After 15 minutes, Top1 was added to the reaction to release the stalled replisomes and intermediates chased by simultaneous addition of excess cold dCTP. At the indicated time points (lanes 2 and 3) replication products were isolated and analyzed by native (left) or denaturing agarose gel-electrophoresis and autoradiography. d, Standard replication reactions carried out in the presence of either Top1, Top2, or both. Replication products were analyzed by native agarose gel-electrophoresis and autoradiography. Uncropped gel images and data for graph in panel a are available as source data.
Extended Data Fig. 4. Reduced DNA synthesis and excess DNA unwinding in the presence of Pol ε polymerase mutants.
a, Total relative DNA synthesis in reactions of Figure 1e were measured using ImageJ and plotted over time. b, Standard DNA replication reactions were carried out in the presence of wild-type or the indicated Pol ε variants (60 nM). 45 minutes after origin activation reactions were stopped and replication products analyzed by alkaline (left) or native (right) agarose gel-electrophoresis and autoradiography. Template: pARS1. c, Model for formation of θ and U* replication intermediates during plasmid replication in vitro. In normal DNA replication, the origin is initially unwound upon CMG activation (top left), followed shortly thereafter by the commencement of DNA synthesis and the coupling of leading strand synthesis to DNA unwinding by CMG (top center). Compensatory positive supercoils formed in the template during unwinding and fork progression are removed by Top1 and/or Top2. After deproteinization, the resulting θ structure is maintained (top right). In contrast, under conditions that slow-down DNA synthesis after origin unwinding the CMG helicase progresses along the template (bottom left) in advance of DNA synthesis; compensatory positive supercoils generated during DNA unwinding are removed by Top1 and/or Top2, and the unwound single-stranded DNA is stabilized by RPA binding (bottom center). Upon deproteinization, unwound complementary DNA strands reanneal, causing compensatory negative supercoils and thus resulting in a partially replicated, negatively supercoiled replication intermediate, U* (bottom right). Data for graph in panel a and uncropped gel images for b are available as source data.
Extended Data Fig. 5. Effect of Pol ε concentration on fork progression.
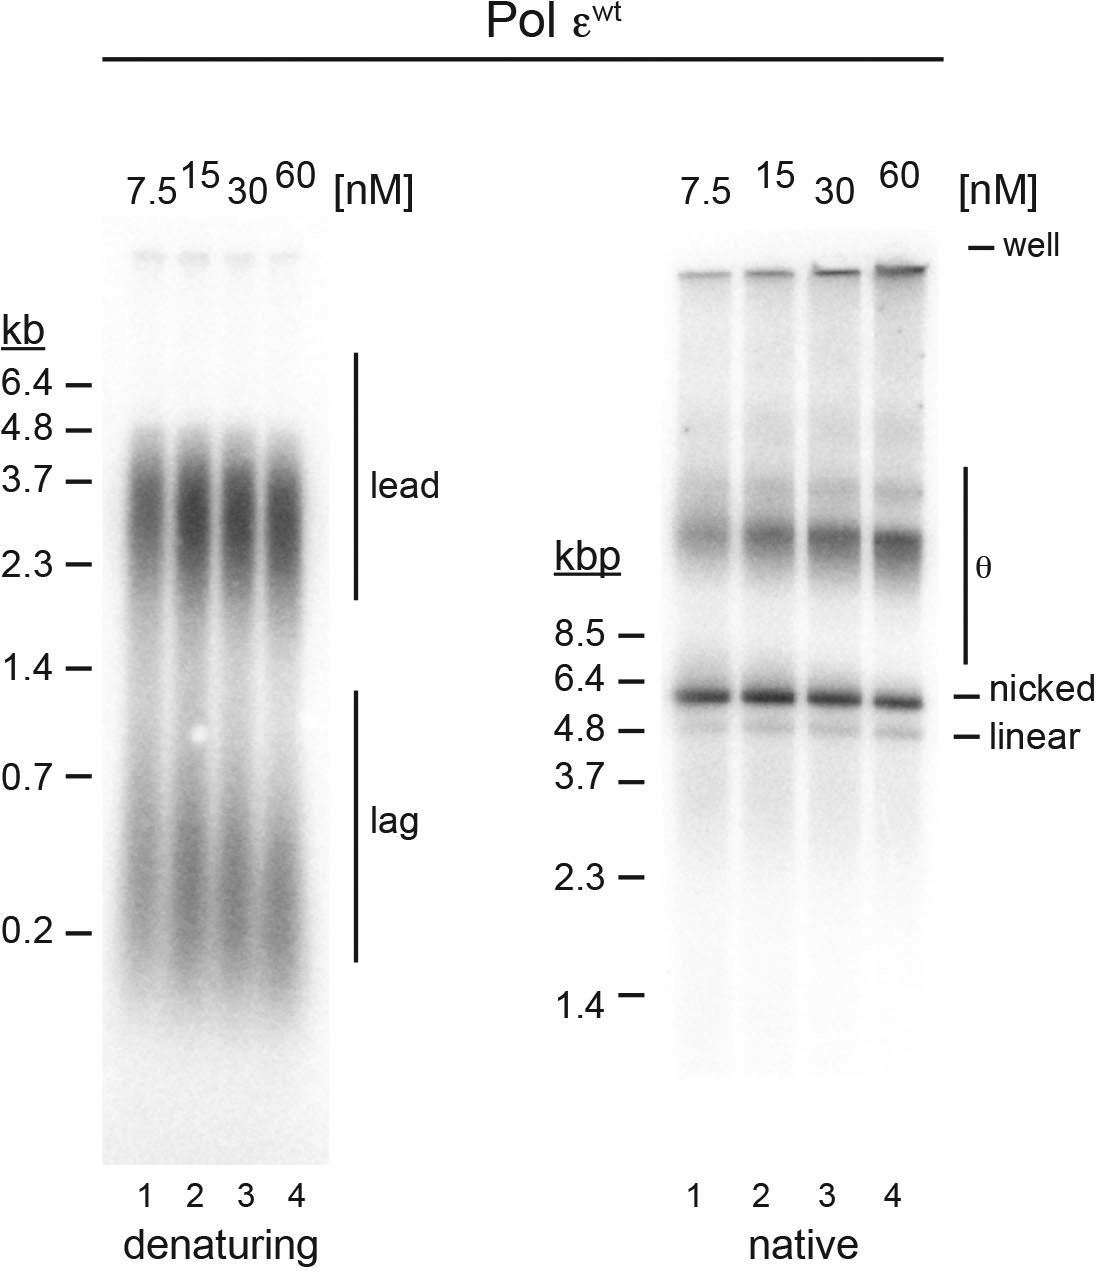
Pol εwt was titrated into standard replication reactions, reactions stopped 45 minutes after origin activation, and replication products analyzed by denaturing (left) or native (right) agarose gel-electrophoresis and autoradiography as indicated. Template: pARS1. Uncropped gel images are available as source data.
Extended Data Fig. 6. Primer extension by Pol δ and Pol ε.
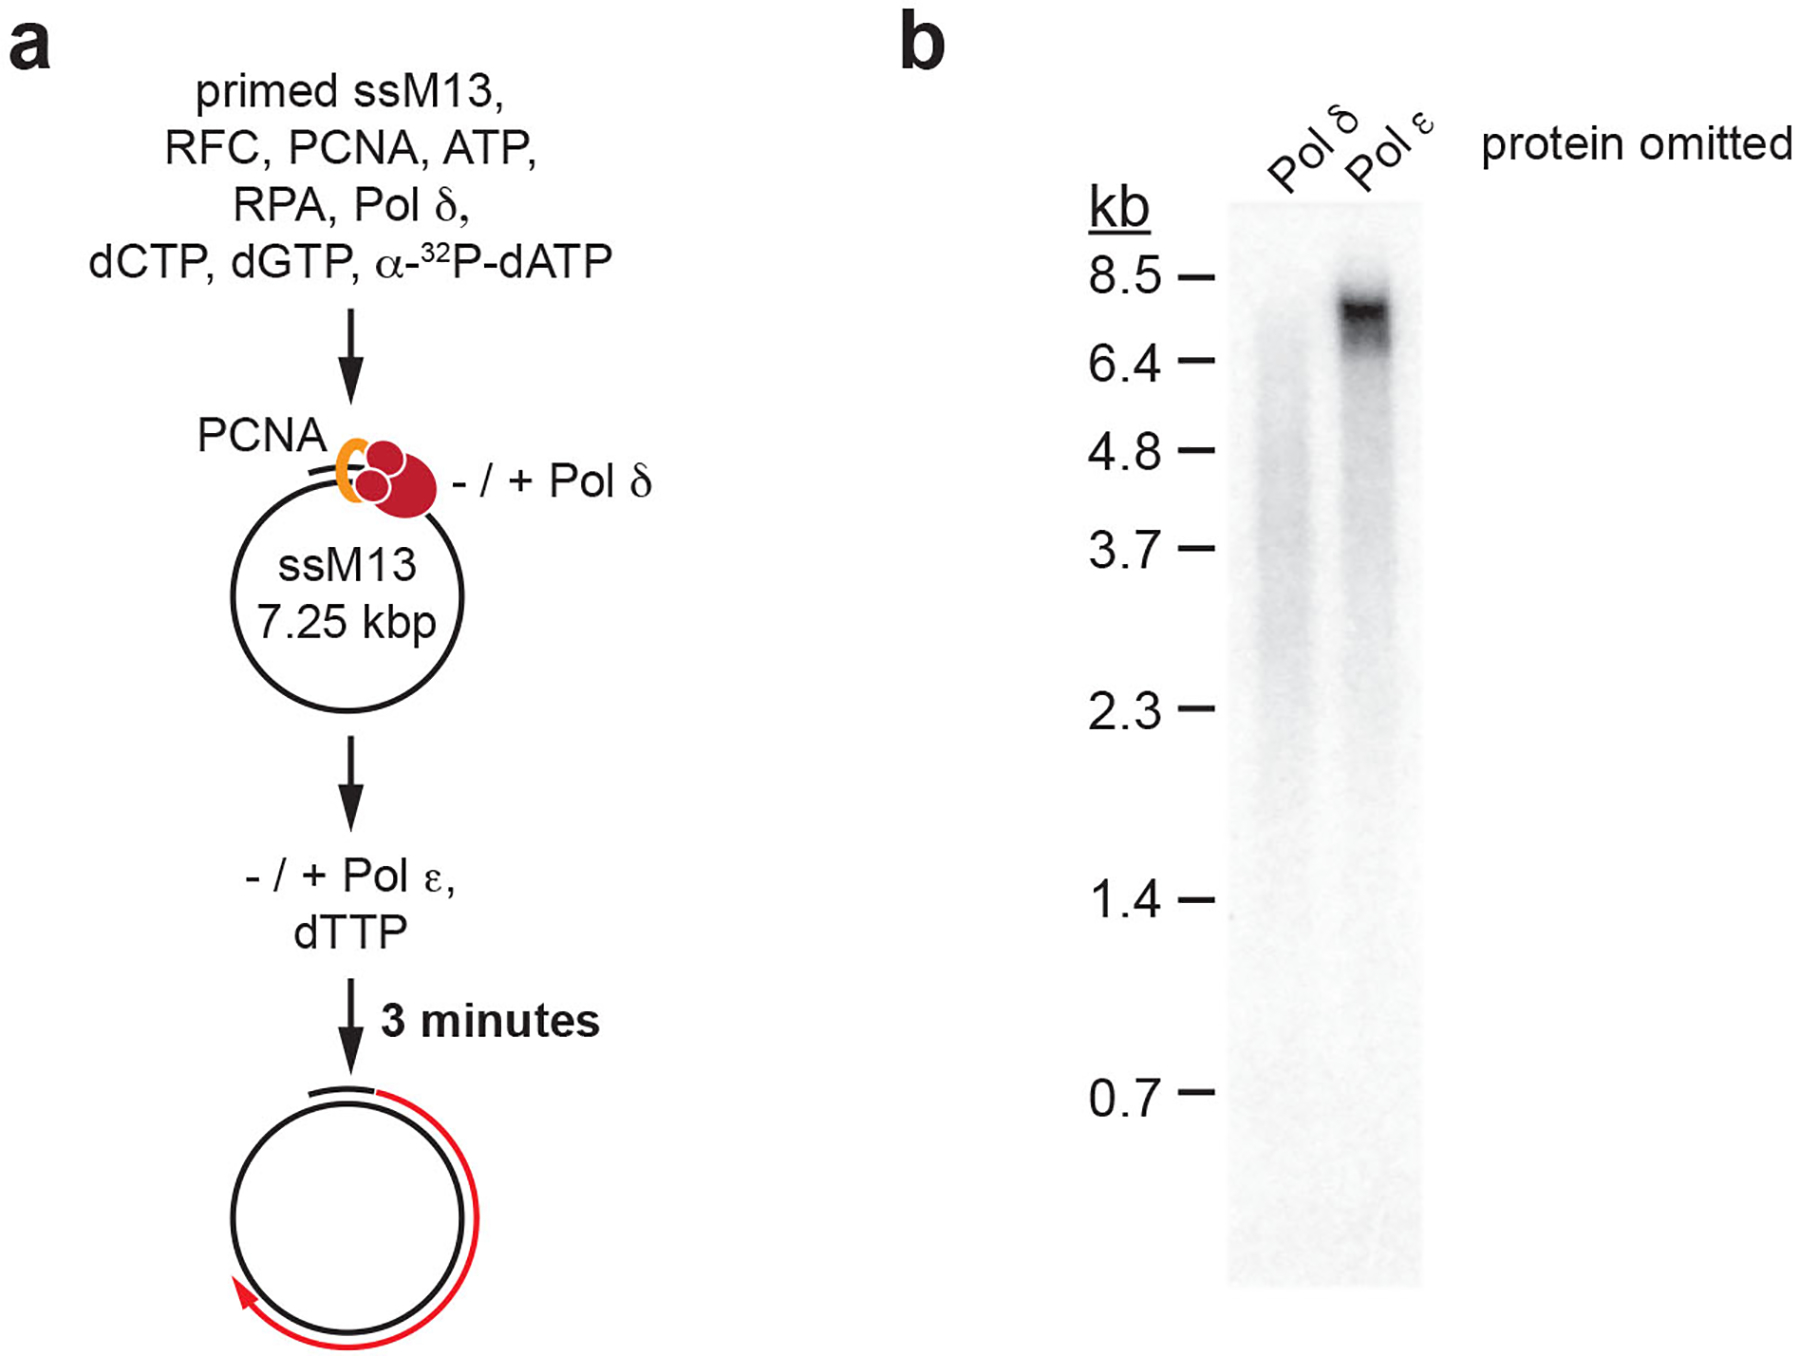
a, Reaction scheme: Singly primed single-stranded M13mp18 DNA was pre-incubated with RPA, RFC/PCNA, three nucleotides, and Pol δ to initiate primer extension; Pol ε was subsequently added along with the remaining fourth nucleotide and incubation continued for 3 minutes. b, Denaturing agarose gel analysis of primer extension products obtained according to reaction scheme in a, but with either Pol δ or Pol ε omitted from the reaction. Uncropped gel images are available as source data.
Extended Data Fig. 7. Excessive DNA unwinding under limiting dNTP conditions in the absence of Csm3-Tof1-Mrc1 and presence of Pol εwt.
Pulse-chase experiment of standard replication reaction performed at 0.25 μM each dNTP as in Figure 5b, with the following changes: 1) Pol εwt was used instead of Pol εexo-; 2) Csm3-Tof1 and Mrc1 were omitted from the reaction; 3) pARS305 instead of pARS1 served as a template. Time indicates minutes after origin activation. The reaction was chased with 500 μM cold dATP 5 minutes after origin activation. Reaction products were analyzed by agarose gel-electrophoresis and autoradiography. Uncropped gel images are available as source data.
Extended Data Fig. 8. Inhibition of DNA unwinding after CMG uncoupling from DNA synthesis is dependent on the kinase activity of Rad53.
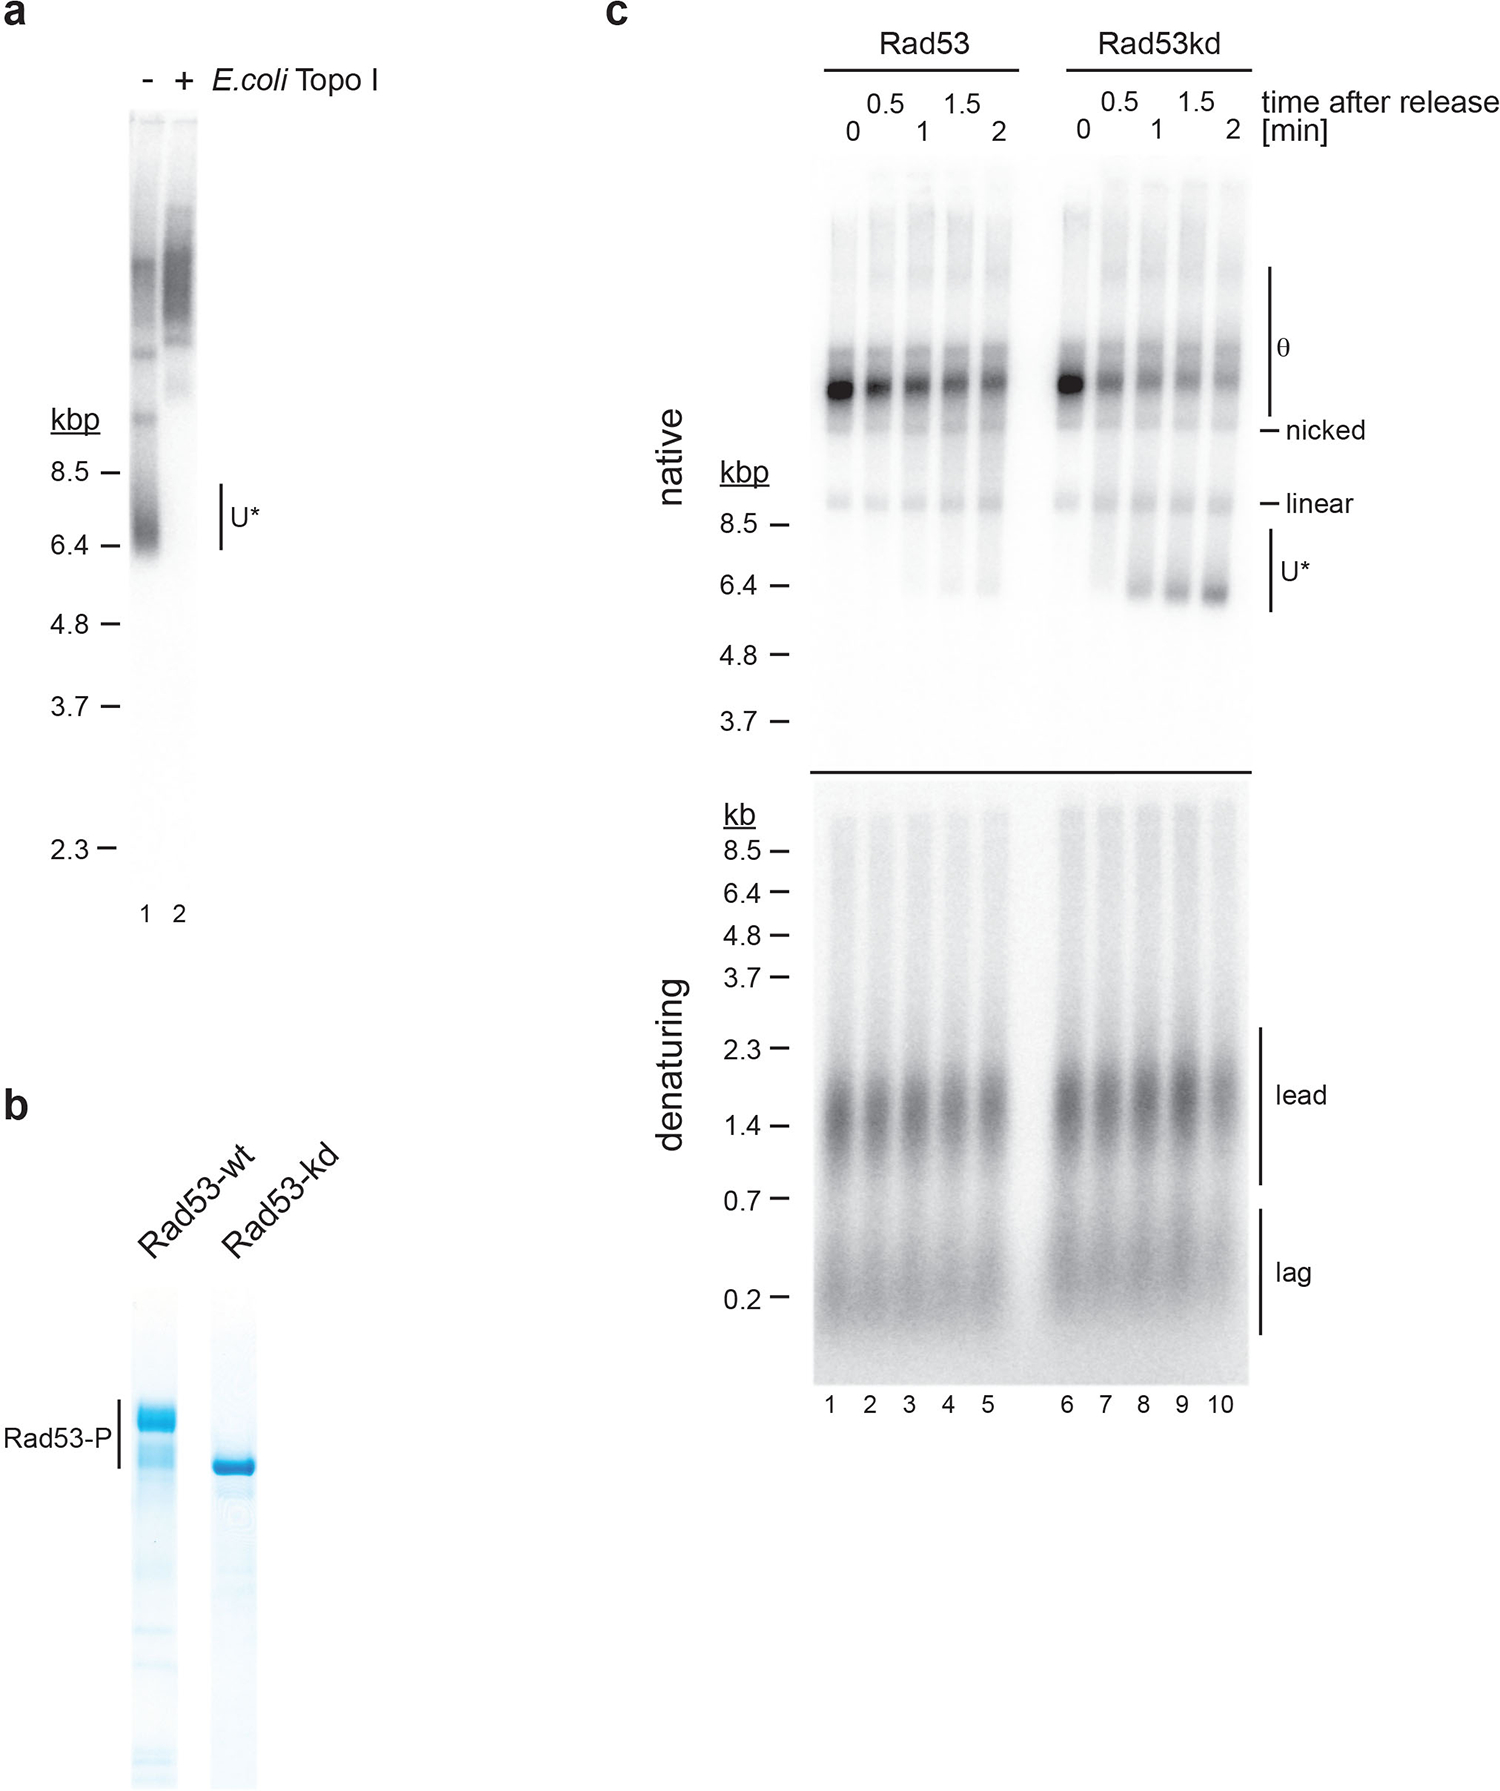
a, Experiment demonstrating that U* DNA obtained in the presence of aphidicolin is negatively supercoiled. DNA isolated from the reaction analyzed in Figure 6c, lane 5, was either mock-treated (lane 1) or treated with E. coli Topo I (lane 2) and analyzed by native agarose gel-electrophoresis. b, Purified wild-type and kinase-dead Rad53 (Rad53kd). Rad53-P: Autophosphorylated forms of Rad53. c, Effect of Rad53 kinase activity on U* formation after fork release from topological block in the presence of aphidicolin. Reactions were carried out as in Figure 6c, except that wild-type (lanes 1–5) or kinase-dead (lanes 6–10) Rad53 was added to the reaction prior to fork release. Uncropped gel images are available as source data.
Extended Data Fig. 9. Inhibition of DNA unwinding after CMG uncoupling from DNA synthesis does not require CTM.
Experiment is as in Figure 6c, except that Csm3-Tof1 and Mrc1 were omitted from the reaction. Uncropped gel images are available as source data.
Extended Data Fig. 10. Models for modes of fork progression in the presence of wild-type and catalytically dead Pol ε.
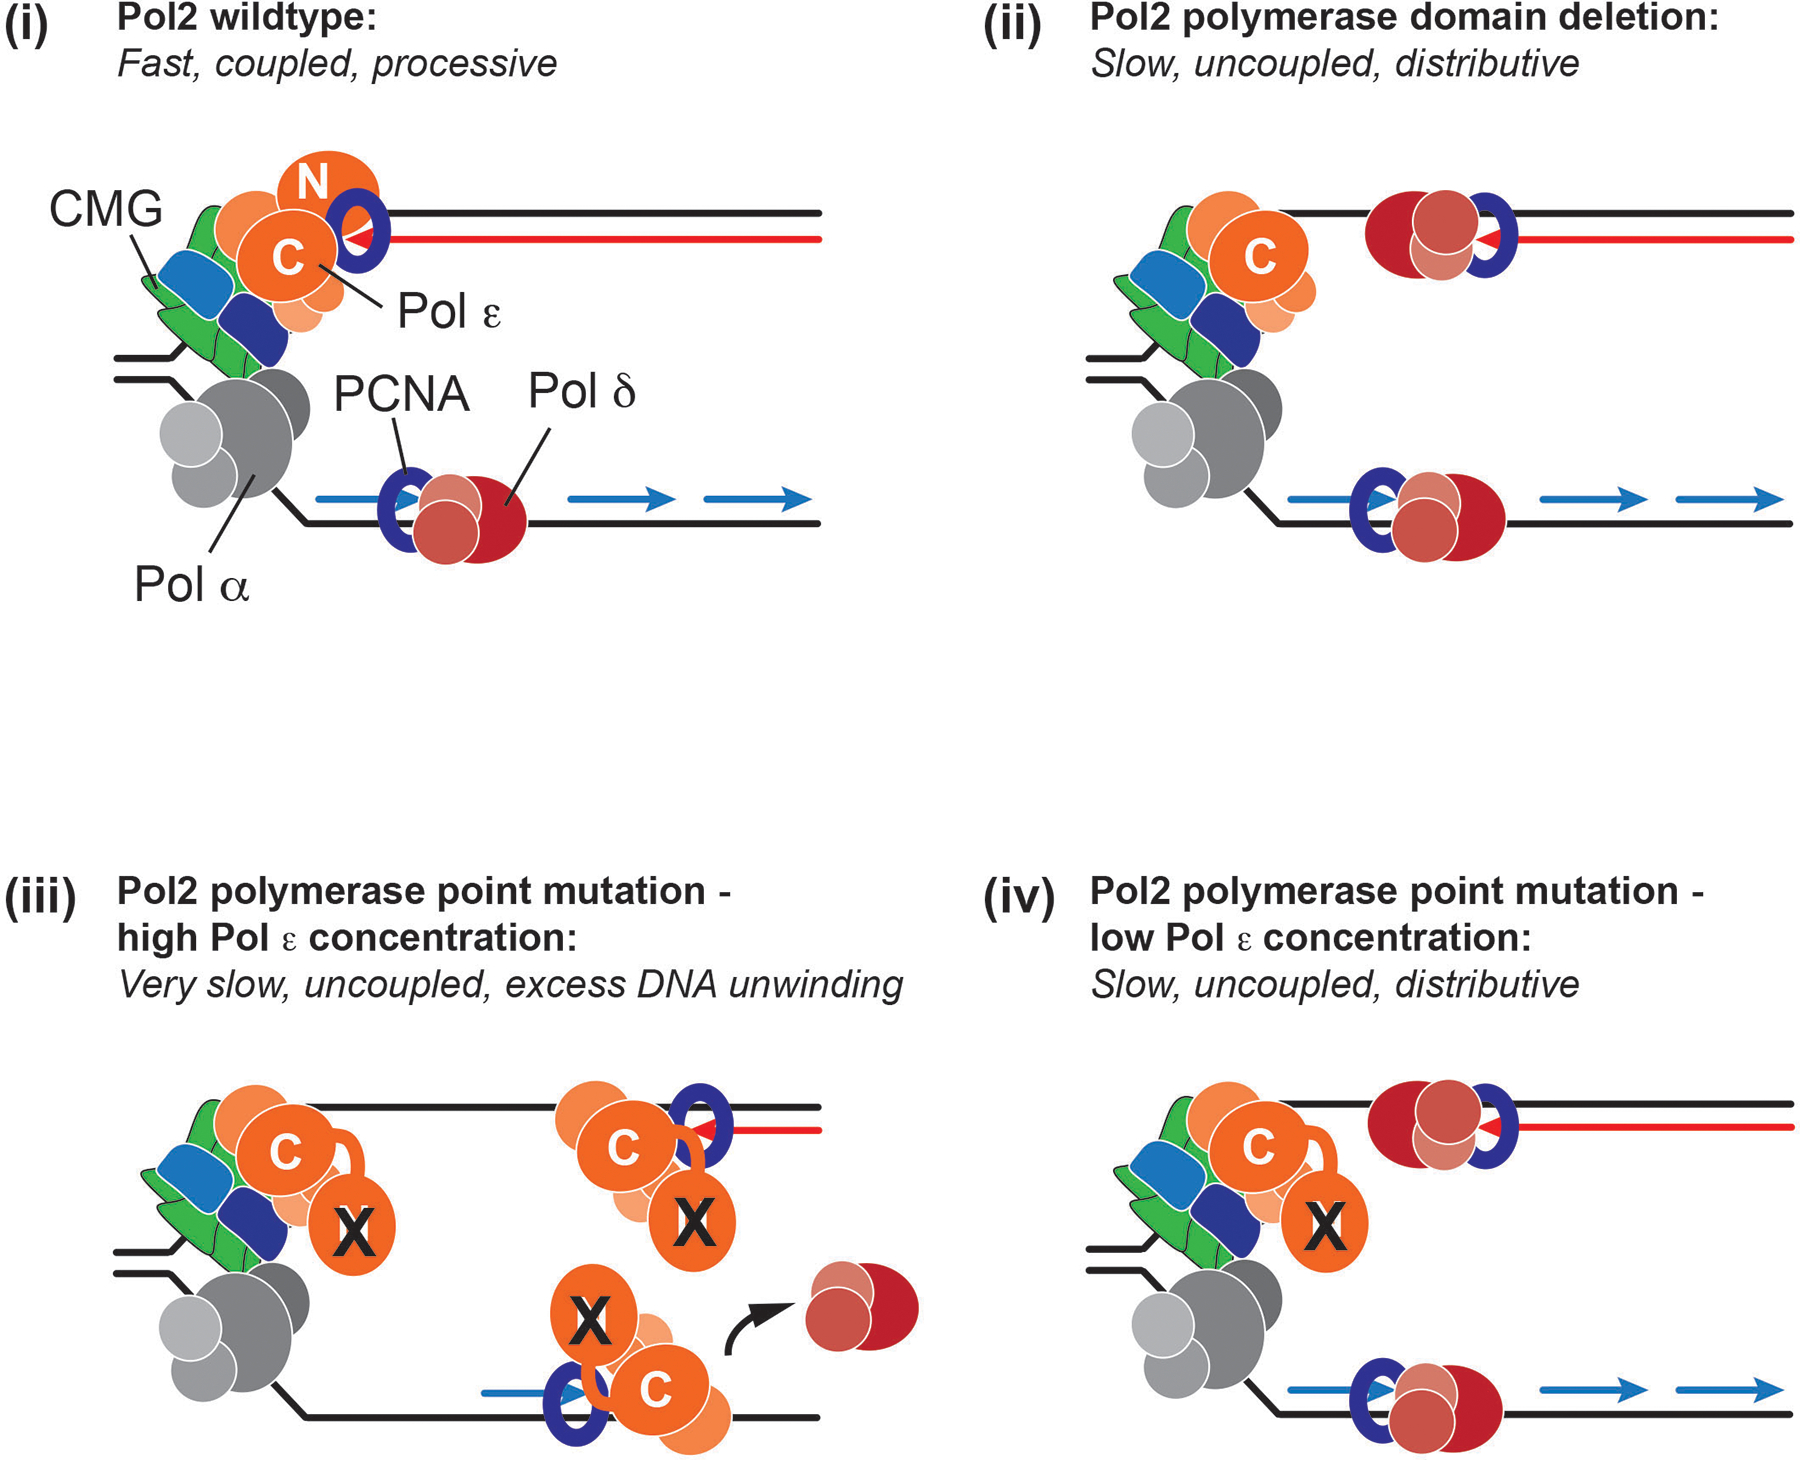
N and C indicate the N- or C-terminal exo-pol domain of Pol2. X indicates inactive mutant N-terminal Pol2 polymerase domain.
Supplementary Material
ACKNOWLEDGMENTS
This work was supported by NIH grant R01GM107239. We thank Ken Marians and Tom Kelly for critical comments on the manuscript, and Xiaolan Zhao for yeast strains.
Footnotes
COMPETING INTERESTS
The authors declare no competing interests.
REFERENCES
- 1.Kim S, Dallmann HG, McHenry CS & Marians KJ Coupling of a replicative polymerase and helicase: a tau-DnaB interaction mediates rapid replication fork movement. Cell 84, 643–50 (1996). [DOI] [PubMed] [Google Scholar]
- 2.Manosas M, Spiering MM, Ding F, Croquette V & Benkovic SJ Collaborative coupling between polymerase and helicase for leading-strand synthesis. Nucleic Acids Res 40, 6187–98 (2012). [DOI] [PMC free article] [PubMed] [Google Scholar]
- 3.Stano NM et al. DNA synthesis provides the driving force to accelerate DNA unwinding by a helicase. Nature 435, 370–3 (2005). [DOI] [PMC free article] [PubMed] [Google Scholar]
- 4.Yeeles JTP, Janska A, Early A & Diffley JFX How the Eukaryotic Replisome Achieves Rapid and Efficient DNA Replication. Mol Cell 65, 105–116 (2017). [DOI] [PMC free article] [PubMed] [Google Scholar]
- 5.Georgescu RE et al. Mechanism of asymmetric polymerase assembly at the eukaryotic replication fork. Nat Struct Mol Biol 21, 664–70 (2014). [DOI] [PMC free article] [PubMed] [Google Scholar]
- 6.Taylor MRG & Yeeles JTP The Initial Response of a Eukaryotic Replisome to DNA Damage. Mol Cell 70, 1067–1080 e12 (2018). [DOI] [PMC free article] [PubMed] [Google Scholar]
- 7.Taylor MRG & Yeeles JTP Dynamics of Replication Fork Progression Following Helicase-Polymerase Uncoupling in Eukaryotes. J Mol Biol 431, 2040–2049 (2019). [DOI] [PMC free article] [PubMed] [Google Scholar]
- 8.Walter J & Newport J Initiation of eukaryotic DNA replication: origin unwinding and sequential chromatin association of Cdc45, RPA, and DNA polymerase alpha. Mol Cell 5, 617–27 (2000). [DOI] [PubMed] [Google Scholar]
- 9.Sparks JL et al. The CMG Helicase Bypasses DNA-Protein Cross-Links to Facilitate Their Repair. Cell 176, 167–181 e21 (2019). [DOI] [PMC free article] [PubMed] [Google Scholar]
- 10.Gan H et al. Checkpoint Kinase Rad53 Couples Leading- and Lagging-Strand DNA Synthesis under Replication Stress. Mol Cell 68, 446–455 e3 (2017). [DOI] [PMC free article] [PubMed] [Google Scholar]
- 11.Katou Y et al. S-phase checkpoint proteins Tof1 and Mrc1 form a stable replication-pausing complex. Nature 424, 1078–83 (2003). [DOI] [PubMed] [Google Scholar]
- 12.Nedelcheva MN et al. Uncoupling of unwinding from DNA synthesis implies regulation of MCM helicase by Tof1/Mrc1/Csm3 checkpoint complex. J Mol Biol 347, 509–21 (2005). [DOI] [PubMed] [Google Scholar]
- 13.Sabatinos SA, Green MD & Forsburg SL Continued DNA synthesis in replication checkpoint mutants leads to fork collapse. Mol Cell Biol 32, 4986–97 (2012). [DOI] [PMC free article] [PubMed] [Google Scholar]
- 14.Burnham DR, Kose HB, Hoyle RB & Yardimci H The mechanism of DNA unwinding by the eukaryotic replicative helicase. Nat Commun 10, 2159 (2019). [DOI] [PMC free article] [PubMed] [Google Scholar]
- 15.Graham JE, Marians KJ & Kowalczykowski SC Independent and Stochastic Action of DNA Polymerases in the Replisome. Cell 169, 1201–1213 e17 (2017). [DOI] [PMC free article] [PubMed] [Google Scholar]
- 16.Pardo B, Crabbe L & Pasero P Signaling pathways of replication stress in yeast. FEMS Yeast Res 17(2017). [DOI] [PubMed] [Google Scholar]
- 17.Byun TS, Pacek M, Yee MC, Walter JC & Cimprich KA Functional uncoupling of MCM helicase and DNA polymerase activities activates the ATR-dependent checkpoint. Genes Dev 19, 1040–52 (2005). [DOI] [PMC free article] [PubMed] [Google Scholar]
- 18.Tercero JA, Longhese MP & Diffley JF A central role for DNA replication forks in checkpoint activation and response. Mol Cell 11, 1323–36 (2003). [DOI] [PubMed] [Google Scholar]
- 19.Lopes M et al. The DNA replication checkpoint response stabilizes stalled replication forks. Nature 412, 557–61 (2001). [DOI] [PubMed] [Google Scholar]
- 20.Sogo JM, Lopes M & Foiani M Fork reversal and ssDNA accumulation at stalled replication forks owing to checkpoint defects. Science 297, 599–602 (2002). [DOI] [PubMed] [Google Scholar]
- 21.De Piccoli G et al. Replisome stability at defective DNA replication forks is independent of S phase checkpoint kinases. Mol Cell 45, 696–704 (2012). [DOI] [PubMed] [Google Scholar]
- 22.Dungrawala H et al. The Replication Checkpoint Prevents Two Types of Fork Collapse without Regulating Replisome Stability. Mol Cell 59, 998–1010 (2015). [DOI] [PMC free article] [PubMed] [Google Scholar]
- 23.Szyjka SJ et al. Rad53 regulates replication fork restart after DNA damage in Saccharomyces cerevisiae. Genes Dev 22, 1906–20 (2008). [DOI] [PMC free article] [PubMed] [Google Scholar]
- 24.Iyer DR & Rhind N Replication fork slowing and stalling are distinct, checkpoint-independent consequences of replicating damaged DNA. PLoS Genet 13, e1006958 (2017). [DOI] [PMC free article] [PubMed] [Google Scholar]
- 25.Poli J et al. dNTP pools determine fork progression and origin usage under replication stress. EMBO J 31, 883–94 (2012). [DOI] [PMC free article] [PubMed] [Google Scholar]
- 26.Tercero JA & Diffley JF Regulation of DNA replication fork progression through damaged DNA by the Mec1/Rad53 checkpoint. Nature 412, 553–7 (2001). [DOI] [PubMed] [Google Scholar]
- 27.Devbhandari S, Jiang J, Kumar C, Whitehouse I & Remus D Chromatin Constrains the Initiation and Elongation of DNA Replication. Mol Cell 65, 131–141 (2017). [DOI] [PMC free article] [PubMed] [Google Scholar]
- 28.Bell SP & Labib K Chromosome Duplication in Saccharomyces cerevisiae. Genetics 203, 1027–67 (2016). [DOI] [PMC free article] [PubMed] [Google Scholar]
- 29.Burgers PMJ & Kunkel TA Eukaryotic DNA Replication Fork. Annu Rev Biochem 86, 417–438 (2017). [DOI] [PMC free article] [PubMed] [Google Scholar]
- 30.Tahirov TH, Makarova KS, Rogozin IB, Pavlov YI & Koonin EV Evolution of DNA polymerases: an inactivated polymerase-exonuclease module in Pol epsilon and a chimeric origin of eukaryotic polymerases from two classes of archaeal ancestors. Biol Direct 4, 11 (2009). [DOI] [PMC free article] [PubMed] [Google Scholar]
- 31.Dua R, Levy DL & Campbell JL Analysis of the essential functions of the C-terminal protein/protein interaction domain of Saccharomyces cerevisiae pol epsilon and its unexpected ability to support growth in the absence of the DNA polymerase domain. J Biol Chem 274, 22283–8 (1999). [DOI] [PubMed] [Google Scholar]
- 32.Kesti T, Flick K, Keranen S, Syvaoja JE & Wittenberg C DNA polymerase epsilon catalytic domains are dispensable for DNA replication, DNA repair, and cell viability. Mol Cell 3, 679–85 (1999). [DOI] [PubMed] [Google Scholar]
- 33.Yu C et al. A mechanism for preventing asymmetric histone segregation onto replicating DNA strands. Science 361, 1386–1389 (2018). [DOI] [PMC free article] [PubMed] [Google Scholar]
- 34.Schauer GD & O’Donnell ME Quality control mechanisms exclude incorrect polymerases from the eukaryotic replication fork. Proc Natl Acad Sci U S A 114, 675–680 (2017). [DOI] [PMC free article] [PubMed] [Google Scholar]
- 35.Baker TA, Sekimizu K, Funnell BE & Kornberg A Extensive unwinding of the plasmid template during staged enzymatic initiation of DNA replication from the origin of the Escherichia coli chromosome. Cell 45, 53–64 (1986). [DOI] [PubMed] [Google Scholar]
- 36.Dean FB et al. Simian virus 40 (SV40) DNA replication: SV40 large T antigen unwinds DNA containing the SV40 origin of replication. Proc Natl Acad Sci U S A 84, 16–20 (1987). [DOI] [PMC free article] [PubMed] [Google Scholar]
- 37.Wold MS, Li JJ & Kelly TJ Initiation of simian virus 40 DNA replication in vitro: large-tumor-antigen- and origin-dependent unwinding of the template. Proc Natl Acad Sci U S A 84, 3643–7 (1987). [DOI] [PMC free article] [PubMed] [Google Scholar]
- 38.Goswami P et al. Structure of DNA-CMG-Pol epsilon elucidates the roles of the non-catalytic polymerase modules in the eukaryotic replisome. Nat Commun 9, 5061 (2018). [DOI] [PMC free article] [PubMed] [Google Scholar]
- 39.Langston LD et al. CMG helicase and DNA polymerase epsilon form a functional 15-subunit holoenzyme for eukaryotic leading-strand DNA replication. Proc Natl Acad Sci U S A 111, 15390–5 (2014). [DOI] [PMC free article] [PubMed] [Google Scholar]
- 40.Sun J et al. The architecture of a eukaryotic replisome. Nat Struct Mol Biol 22, 976–82 (2015). [DOI] [PMC free article] [PubMed] [Google Scholar]
- 41.Douglas ME, Ali FA, Costa A & Diffley JFX The mechanism of eukaryotic CMG helicase activation. Nature 555, 265–268 (2018). [DOI] [PMC free article] [PubMed] [Google Scholar]
- 42.Georgescu RE et al. Reconstitution of a eukaryotic replisome reveals suppression mechanisms that define leading/lagging strand operation. Elife 4, e04988 (2015). [DOI] [PMC free article] [PubMed] [Google Scholar]
- 43.Chilkova O et al. The eukaryotic leading and lagging strand DNA polymerases are loaded onto primer-ends via separate mechanisms but have comparable processivity in the presence of PCNA. Nucleic Acids Res 35, 6588–97 (2007). [DOI] [PMC free article] [PubMed] [Google Scholar]
- 44.Dua R, Levy DL, Li CM, Snow PM & Campbell JL In vivo reconstitution of Saccharomyces cerevisiae DNA polymerase epsilon in insect cells. Purification and characterization. J Biol Chem 277, 7889–96 (2002). [DOI] [PubMed] [Google Scholar]
- 45.Ganai RA, Bylund GO & Johansson E Switching between polymerase and exonuclease sites in DNA polymerase epsilon. Nucleic Acids Res 43, 932–42 (2015). [DOI] [PMC free article] [PubMed] [Google Scholar]
- 46.Garbacz MA et al. Evidence that DNA polymerase delta contributes to initiating leading strand DNA replication in Saccharomyces cerevisiae. Nat Commun 9, 858 (2018). [DOI] [PMC free article] [PubMed] [Google Scholar]
- 47.Acar M, Becskei A & van Oudenaarden A Enhancement of cellular memory by reducing stochastic transitions. Nature 435, 228–32 (2005). [DOI] [PubMed] [Google Scholar]
- 48.Szyjka SJ, Viggiani CJ & Aparicio OM Mrc1 is required for normal progression of replication forks throughout chromatin in S. cerevisiae. Mol Cell 19, 691–7 (2005). [DOI] [PubMed] [Google Scholar]
- 49.Tourriere H, Versini G, Cordon-Preciado V, Alabert C & Pasero P Mrc1 and Tof1 promote replication fork progression and recovery independently of Rad53. Mol Cell 19, 699–706 (2005). [DOI] [PubMed] [Google Scholar]
- 50.Smolka MB, Albuquerque CP, Chen SH & Zhou H Proteome-wide identification of in vivo targets of DNA damage checkpoint kinases. Proc Natl Acad Sci U S A 104, 10364–9 (2007). [DOI] [PMC free article] [PubMed] [Google Scholar]
- 51.Alcasabas AA et al. Mrc1 transduces signals of DNA replication stress to activate Rad53. Nat Cell Biol 3, 958–65 (2001). [DOI] [PubMed] [Google Scholar]
- 52.Osborn AJ & Elledge SJ Mrc1 is a replication fork component whose phosphorylation in response to DNA replication stress activates Rad53. Genes Dev 17, 1755–67 (2003). [DOI] [PMC free article] [PubMed] [Google Scholar]
- 53.Can G, Kauerhof AC, Macak D & Zegerman P Helicase Subunit Cdc45 Targets the Checkpoint Kinase Rad53 to Both Replication Initiation and Elongation Complexes after Fork Stalling. Mol Cell 73, 562–573 e3 (2019). [DOI] [PMC free article] [PubMed] [Google Scholar]
- 54.Langston LD et al. Mcm10 promotes rapid isomerization of CMG-DNA for replisome bypass of lagging strand DNA blocks. Elife 6(2017). [DOI] [PMC free article] [PubMed] [Google Scholar]
- 55.Looke M, Maloney MF & Bell SP Mcm10 regulates DNA replication elongation by stimulating the CMG replicative helicase. Genes Dev 31, 291–305 (2017). [DOI] [PMC free article] [PubMed] [Google Scholar]
- 56.Burgers PM Saccharomyces cerevisiae replication factor C. II. Formation and activity of complexes with the proliferating cell nuclear antigen and with DNA polymerases delta and epsilon. J Biol Chem 266, 22698–706 (1991). [PubMed] [Google Scholar]
- 57.Toledo LI et al. ATR prohibits replication catastrophe by preventing global exhaustion of RPA. Cell 155, 1088–103 (2013). [DOI] [PubMed] [Google Scholar]
- 58.Gomez-Gonzalez B, Patel H, Early A & Diffley JFX Rpd3L Contributes to the DNA Damage Sensitivity of Saccharomyces cerevisiae Checkpoint Mutants. Genetics 211, 503–513 (2019). [DOI] [PMC free article] [PubMed] [Google Scholar]
- 59.Ilves I, Tamberg N & Botchan MR Checkpoint kinase 2 (Chk2) inhibits the activity of the Cdc45/MCM2–7/GINS (CMG) replicative helicase complex. Proc Natl Acad Sci U S A 109, 13163–70 (2012). [DOI] [PMC free article] [PubMed] [Google Scholar]
- 60.Gilbert CS, Green CM & Lowndes NF Budding yeast Rad9 is an ATP-dependent Rad53 activating machine. Mol Cell 8, 129–36 (2001). [DOI] [PubMed] [Google Scholar]
- 61.Gros J, Devbhandari S & Remus D Origin plasticity during budding yeast DNA replication in vitro. EMBO J 33, 621–36 (2014). [DOI] [PMC free article] [PubMed] [Google Scholar]
Associated Data
This section collects any data citations, data availability statements, or supplementary materials included in this article.
Supplementary Materials
Data Availability Statement
Source Data for graphs in Fig. 2 and 3, and Extended Data Fig. 3 and 4 are available with the paper online.